An Image Enhancement Method Based on Non-Subsampled Shearlet Transform and Directional Information Measurement


1
School of Physical Sciences, University of Science and Technology of China, Hefei 230022, China
2
School of Information Science and Technology, Northwest University, Xi’an 710069, China
3
College of Air and Missile Defense, Air Force Engineering University, Xi’an 710051, China
*
Author to whom correspondence should be addressed.
Information 2018, 9(12), 308; https://doi.org/10.3390/info9120308
Submission received: 16 October 2018
/
Revised: 29 November 2018
/
Accepted: 3 December 2018
/
Published: 6 December 2018
(This article belongs to the Section Information Processes)
Abstract
:Based on the advantages of a non-subsampled shearlet transform (NSST) in image processing and the characteristics of remote sensing imagery, NSST was applied to enhance blurred images. In the NSST transform domain, directional information measurement can highlight textural features of an image edge and reduce image noise. Therefore, NSST was applied to the detailed enhancement of high-frequency sub-band coefficients. Based on the characteristics of a low-frequency image, the retinex method was used to enhance low-frequency images. Then, an NSST inverse transformation was performed on the enhanced low- and high-frequency coefficients to obtain an enhanced image. Computer simulation experiments showed that when compared with a traditional image enhancement strategy, the method proposed in this paper can enrich the details of the image and enhance the visual effect of the image. Compared with other algorithms listed in this paper, the brightness, contrast, edge strength, and information entropy of the enhanced image by this method are improved. In addition, in the experiment of noisy images, various objective evaluation indices show that the method in this paper enhances the image with the least noise information, which further indicates that the method can suppress noise while improving the image quality, and has a certain level of effectiveness and practicability.
1. Introduction
Various factors, such as the imaging environment, system equipment, and transmission medium, often affect the image acquisition process and cause the quality of an image to degrade by varying degrees. Image blurring, low contrast, and insufficient definition often make it inconvenient to subsequently analyze an image, extract the target, and classify or identify the targets. Therefore, the overall or local characteristics of an image should be carefully emphasized. Original unclear images should be made clear or certain features of interest should be emphasized. The differences in the characteristics of different objects in an image should be enlarged, and the features that are not of interest should be suppressed. As a result, the image quality can be improved, its information can be enriched, image interpretation and recognition can be enhanced, and the practical application value of images can be increased [1]. Currently, the commonly used image enhancement methods can be divided into two main categories: Spatial and frequency domain enhancements. The former directly deals with the gray value of an image. Common methods include grayscale transformation, histogram equalization, and unsharp masking methods. Although these methods improve image quality to a certain extent, the processing of detailed information, such as the image edge texture, is often not satisfactory. If the image information is enhanced by processing the image in the frequency domain, while the detailed information of the image is highlighted, it is prone to carrying noise forward into the enhanced image. To solve the above problems, we proposed an image enhancement method based on non-subsampled shearlet transform (NSST) and directional information measurement.
An NSST consists of a non-subsampled Laplacian pyramid transform and a shear filter with translation invariance. An NSST’s multiscale decomposition is similar to a non-subsampled contourlet transform (NSCT) [2]. However, an NSST uses a shear filter in the direction decomposition to solve the limitation of the number of directions of the non-subsampled directional filter (NSDFB) in NSCT; the shear filter can be represented by a window function in matrix form [3]. In addition, an NSST also makes up for the wavelet transform only for objects with isotropic characteristics. Its transform base has anisotropic characteristics. The aspect ratio in the interval can vary with scale. The number of directions can be determined based on the time complex and enhancement quality of the image. Therefore, an NSST not only retains the local time-frequency characteristics and translation invariance of an NSCT, but also has more flexibility and effectiveness than an NSCT.
After multiscale and multidirectional decomposition of an NSST, the original image is decomposed into a low-frequency image and several high-frequency images. The low-frequency image is an approximate copy of the original image and contains the contour information of the original image. Due to the poor contrast and sharpness of low-frequency images, traditional enhancement strategies, such as the histogram equalization method, are not obvious for improving the contrast, and losing part of the energy information. Therefore, this paper adopts a single-scale Retinex (SSR) image enhancement method, which enhances the contrast and sharpness of low-frequency images. The high-frequency images contain important details, such as the edge and texture of the image, and also contain some noise. The edge and texture information is not only the maximum value of the local gray mutation, but also has a strong direction, and noise is random. Although existing methods can achieve the enhancement effect to a certain extent, they fail to effectively separate edge and noise information while enhancing edge information specifically. To prevent noise from increasing when a high-frequency image was enhanced, we used high-frequency image enhancement based on directional information measurement. Using the advantage of highlighting important information, such as the edges and texture of the image, through directional information measurement [4], the position of the edge point and the texture point in a high-frequency image can be identified, and the pixel points of high-frequency images are classified into smooth points, edge points, and noise points. According to the characteristics of edge points in an NSST high-frequency channel, they are divided into step and ridge edges. Then, different enhancement methods are adopted for the two edges in the high-frequency channel, so as to increase the information and sharpness of the original image. In addition, because directional information measurement in the image is not sensitive to noise [5], we introduced this method as an enhancement strategy for high-frequency images, which is conducive to reducing interference of noise on the performance of the image enhancement process.
2. Image NSST Transformation
The proposal of wavelet transform is a milestone in multiscale transform [6]. Wavelet transform can effectively deal with the point singularity problem of one- or high-dimensional signals [7]. However, wavelet transform cannot capture the line singularity problem of images. To solve this problem, curvelet and contourlet transform [8] have been successively proposed. These two types of transforms can decompose an image in multiple directions based on a multiscale transform. In addition, the basic functions of the two have a wedge or rectangular support area, which provides an improved sparse expression for the high-dimension singularity in an image [9,10]. The subsampling operation in the multiscale and multidirectional decomposition processes can cause the image to not have translation invariance, resulting in a Gibbs phenomenon [11] in the enhanced image. The directional filtering system adopted by the recently proposed shearlet transform (ST) has translation invariance. Theoretically speaking, the directional filtering of a shearlet wave is a natural extension in multidimensional and multidirectional conditions. The shearlet wave can express the set of these regeneration functions as:
where matrix A determines the multiscale decomposition of the image and matrix A is anisotropic; the shear matrix S determines the multidirectional analysis of the image; j represents the decomposition scale; l represents the direction parameter; and k represents the translation parameter. In the domain, the set of basic functions ψi,j,k(x) is formed by rotating, shearing, and translating a single window function with good local characteristics. These sets together form the Parseval framework, and this process constitutes an affine system. When any :
For any , , , , , and satisfy:
The partitions are and . D0 and D1 are composed of the supports of and , respectively.
From the above algorithm, one can see that a shearlet has good local features and direction sensitivity; the number of directions on each layer scale is multiplied. In the process of image decomposition, both the curvelet and contourlet transform use the directional filter bank (DFB) proposed by Bamberger and Smith [12] to conduct directional decomposition of the image. Because a two-dimensional diamond filter matrix is introduced to DFB, in order to adapt to the filter filtering, the input image needs to be remodeled. The DFB-filtered image needs to be inversely synthesized to complete the remodeling. This process causes distortion in the enhanced image, creating confusion in its frequency domain coefficients. The NSST just makes up for the shortcoming of the curvelet and contourlet transforms.
The multidirectional decomposition of the NSST is accomplished using an improved shear filter. The idea is to perform a two-dimensional Fourier transform [13] on the image on a pseudopolar grid and then use a one-dimensional sub-band filter for filtering on the grid. It is not necessary to perform a critical sampling operation on the original image during the frequency domain transform of an NSST, so that the phenomenon of image distortion does not appear in the directional filtering process, and the translation invariance of the image is also guaranteed. In addition, the shear filter can adaptively acquire the geometrical characteristics of multidimensional data, which can better express the details of the image, such as the edges [14]. Because the support area of the shear filter is small, the probability of the occurrence of the Gibbs phenomenon is reduced, improving the calculation efficiency.
The multiscale decomposition of the NSST was performed using the non-subsampled Laplacian pyramid (NSLP) filter proposed by Cunha and Do [15] instead of the original LP filter. The NSLP decomposition can be completed by iterating the following process:
where f represents an image, is the detail coefficient at the scale j + 1, represents the low-frequency filter at the scale k, and is the high-frequency filter at the scale j. Assuming is an image of size N × N, and the number of direction Dj is given, then the NSST-based image transformation can be completed using the following steps:
Step 1: Image is decomposed into a low-pass image of size N × N and a high-pass image using an NSLP transform.
Step 2: is calculated in the pseudopolar grid and is obtained.
Step 3: is bandpass filtered to obtain the frequency domain coefficients in pseudopolar coordinates.
Step 4: The NSST coefficient of the Cartesian coordinate system is obtained using the inverse transformation of the fast Fourier transform (FFT) in the pseudopolar grid.
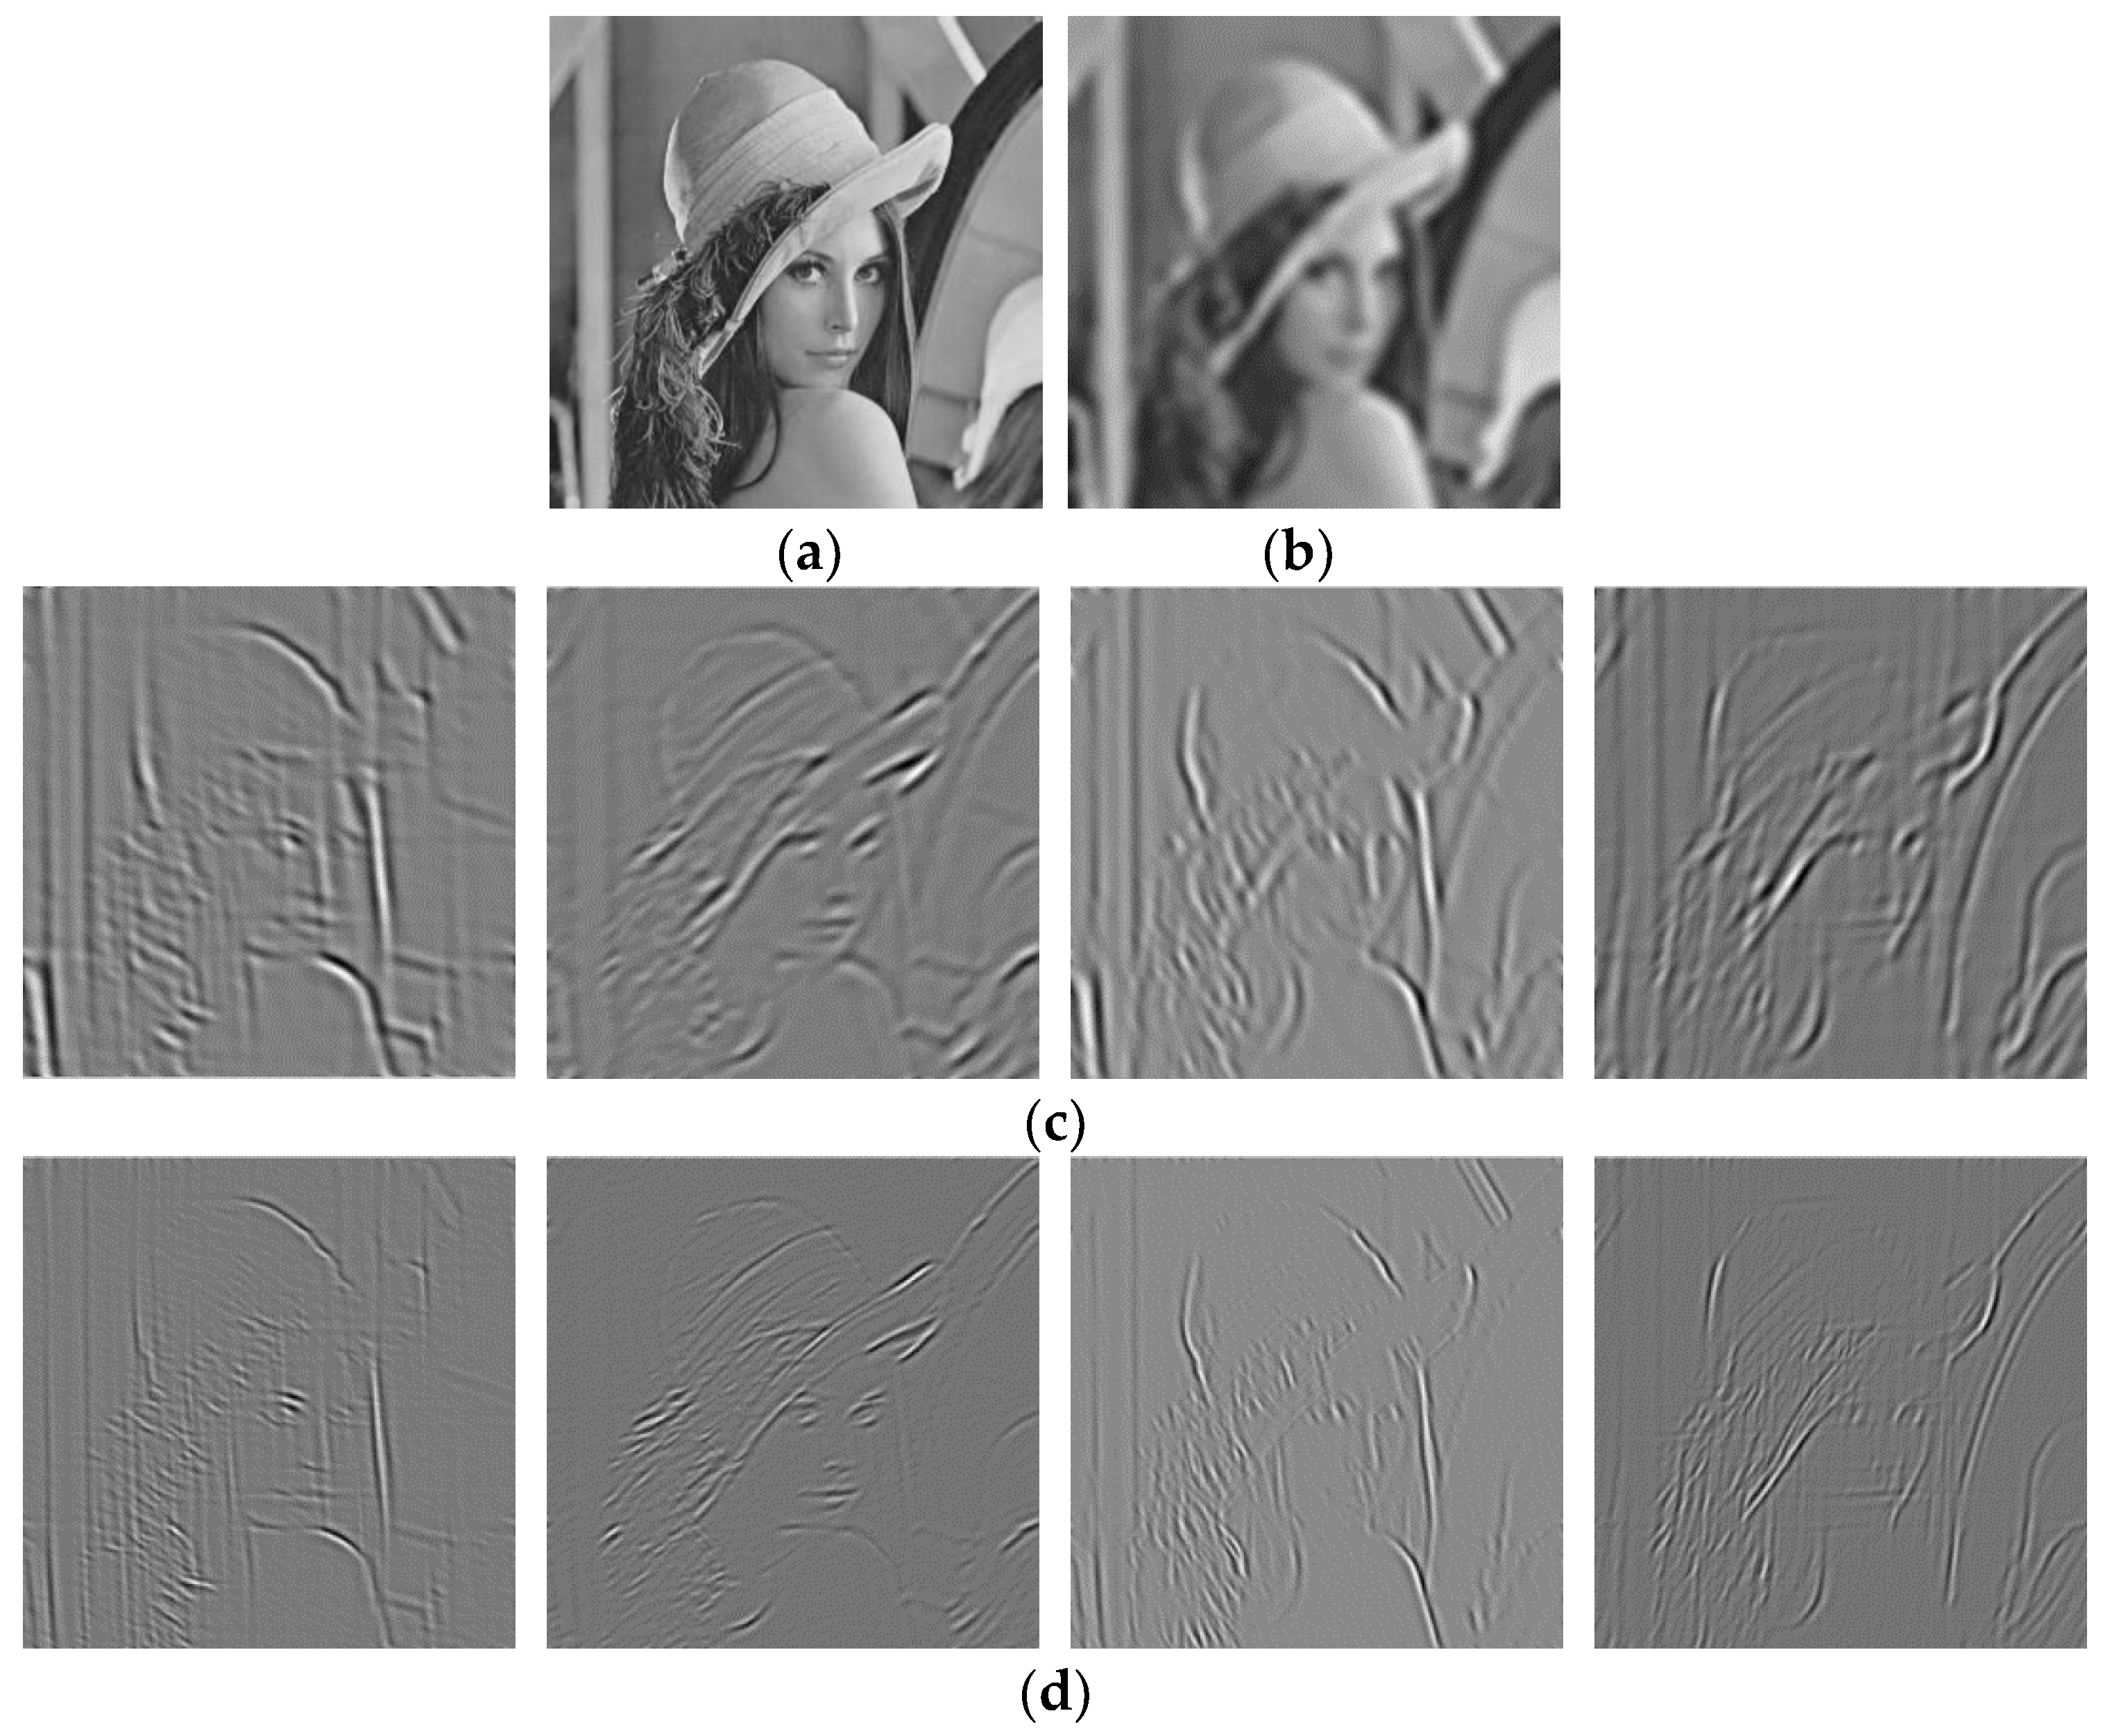
Figure 1 provides the source image, the low-frequency image decomposed by NSST transform, and the high-frequency image after multiscale and multidirectional decomposition.
3. Directional Information Measurement of the Image
Edge and texture information is the most important detailed information used in image enhancement. Extracting the details of edges and textures in the source image and injecting them into the original image is the goal of image enhancement. By calculating the directional information measurement of the pixel gray value, we can determine whether a pixel belongs to the edge or texture information of the image. Many studies in the literature [16] have also mentioned that directional information measurement of an image can separate the edge and texture information of the image from the noise. This type of measurement can better extract the useful information in the original image and effectively reduce the influence of noise on the enhancement effect.
Let the pixel gray value of image X at (i,j) be p(i,j), where r is the neighborhood radius of center (i,j); then, the neighborhood centered at (i,j) is:
If lθ represents a line that passes the center point of the neighborhood and its angle is θ, then lθ can divide the neighborhood window N into two parts, namely NL and NH. Then, the directional information measurement is:
where
Figure 2 presents the directional information measurement of image. Figure 2a shows the basic frame of the directional information measurement, Figure 2b is the Came picture, and Figure 2c is the directional information measurement of Figure 2b.
According to Equations (7)–(11), it can be seen that:
- (1)
- Let us assume that the edge passing the center point exists in the neighborhood of the current point. Due to the directionality of the edge point, when the direction of lθ is along or perpendicular to the edge track direction, dθ has the maximum and minimum values, respectively. Since the gray values of the pixels on both sides of the edge are significantly different, the value of M(i,j) is large. Obviously, the M(i,j) of the edge point is not sensitive to the change of the neighborhood size. That is, within a certain range, regardless of the size of the observation scale, the values of M(i,j) of the edge points are relatively large.
- (2)
- If the neighborhood of the current point belongs to the smooth region, for any direction of lθ, dθ is relatively small. Since the gray values of the pixels in the smooth region are basically the same, the values of dθ are relatively close to each other, and thus M(i,j) is small. Similarly, M(i,j) of the smooth point is also not sensitive to changes in the size of the neighborhood. Within a certain range, M(i,j) of the smooth point is relatively small regardless of the size of the observation scale.
- (3)
- If the neighborhood of the current point belongs to the texture area, for a small observation scale, the current neighborhood cannot reflect the regularity of the texture change over the gray scale, and the texture is more edge-oriented. Therefore, M(i,j) is large. For a large observation scale, that is, when the current neighborhood can contain enough texture structures, the texture structures on both sides are similar, regardless of the direction of lθ. Therefore, the values of dθ are relatively close to each other, M(i,j) is relatively small, and the performance is relatively smooth. Obviously, M(i,j) of the texture point is sensitive to the change of the neighborhood size. The M(i,j) of the texture point decreases with an increase of the observation scale.
- (4)
- For noise, no matter where the current point is in the edge, smooth, or texture regions, the distribution of noise on both sides is consistent regardless of the direction of lθ because the noise is random and has no directionality. Therefore, the effects of noise on M(i,j) are very small [17].
This leads to the following conclusions. The directional information measurement of a point in the image is a measure of the degree of whether a point is an edge point. The larger the information measure, the more likely it is that a particular point is an edge point.
4. A New Image Enhancement Algorithm
After the original image is decomposed by NSST, it is decomposed into a low-frequency image and several high-frequency images of the same size as the original image. After multistage decomposition by NSST, the high-frequency image contains important information, such as the structure, edge, and texture of the original image. This information is often reflected in the change of the direction information of the pixel point. Due to the imaging characteristics of high-frequency images, these images of the original image often contain a large amount of noise. Therefore, directional information measurement is adopted to enhance the high sub-band image. Pixel point directional information measurement is used to determine whether a particular point belongs to the edge or is a noise point in the image. The expression of the feature information of a high-energy region with detailed information and the smooth region with a small amount of information in the high-frequency images can be improved. The useless noise information is effectively filtered out. All of these are beneficial for improving the quality of the enhanced image.
The low-frequency component decomposed by NSST is an approximate component of the original image and contains most of the irradiation information. Image enhancement based on single-scale retinex (SSR) [18] can effectively highlight the high-frequency components in the low-frequency coefficients, making it more in line with human vision. Therefore, the SSR method is used to enhance the low-frequency coefficients after separation in this paper, thereby further improving the overall quality of the enhanced image of the original image.
The image enhancement algorithm based on NSST domain directional information measurement is as follows:
Input: The original image S.
Output: Enhanced image of the original image of using the method of this paper H.
Step 1: Perform multiscale and multidirectional decomposition on the original image S using NSST transform, and define the decomposed low-frequency coefficient as and high-frequency coefficient as , where k is the decomposition scale of the image, and l is the multidirectional decomposition level of the image at the level scale k.
Step 2: Perform image enhancement on using the processing scheme of low-frequency sub-band coefficients to obtain the enhanced low-frequency image Hlow.
Step 3: Perform image enhancement on the high-frequency image using a high-frequency sub-band coefficient processing scheme to obtain the multidirectional high-frequency enhanced image .
Step 4: Perform the inverse NSST transformation on the low-pass coefficient Hlow and the high-frequency coefficient to obtain the final enhanced image H.
4.1. Enhancement of Low-Frequency Sub-Band Coefficients
As mentioned above, the low-frequency image after NSST decomposition provides an approximate image of the original image, containing the illuminance energy in the original image. Enhancement strategies, such as the traditional histogram equalization method, can reduce the contrast of low-frequency images and cause the loss of some energy information. Therefore, for a low-frequency image , the image enhancement method based on SSR is used in the present study [19].
The SSR theory method can be described as follows. The original image is regarded as an image composed of both incident and reflected images. The incident light is irradiated from the reflective object, and through this reflection, the light is reflected and enters the human eye. The resulting image can be expressed as follows:
where R(x,y) indicates the reflection property of the object, that is, the intrinsic property of the image which should be retained to the utmost extent; and L(x,y) represents the image of the incident light which determines the dynamic range that the image pixel can reach where L(x,y) should be removed as much as possible. Generally, the irradiated image is estimated as a spatially smooth image, the original image is S(x,y), the reflected image is R(x,y), and the luminance image is L(x,y). Equations (12) and (13) can be obtained:
where r(x,y) is the output image, and the operation in the brackets following Equation (13) is a convolution operation. F(x,y) is the center surround function, expressed as:
where C is the Gaussian surround scale. λ is a scale whose value must satisfy the following equation:
As can be seen from Equation (15), the convolution in the SSR algorithm is the calculation of the incident image. The physical meaning is to estimate the change of illuminance in the image by calculating the weighted average of the pixel and the surrounding area, and by removing change L(x,y), and to only retain the S(x,y) attributes.
According to the SSR method, the low-frequency image is regarded as the original image and the Gaussian surrounding scale C is input, and this scale is generally a constant. When the value of C is small, although the dynamic compression can be well completed, a large degree of image distortion will occur. By contrast, when the value of C is large, the degree of image distortion can be reduced. After many attempts, for the method in this paper, when the value of C is 80, the image enhancement effect is the best. Then, λ is determined by Equations (14) and (15). The enhanced low-frequency image Hlow is calculated according to Equation (13).
4.2. Enhancement of High-Frequency Sub-Band Coefficients
Images with rich background information contain intricate texture. Edge blurring and excessive smoothing may occur easily during speckle reduction. After NSST decomposition, the detail information and noise of the original image are mostly in the high-frequency sub-band. To avoid amplification of the noise during enhancement, the image directional information measurement is used to better express the edge and texture information of the image with effective noise filtering. The detail and noise information in the high-frequency sub-band coefficients are classified by choosing an appropriate method. The useful details are enhanced, and noise suppression processing is performed to filter out noise that may be generated during the decomposition process and in the noise of the image itself, giving the enhanced image a better visual effect.
Using the statistical characteristics of the directional information measurement of the region where each pixel is located, the image pixel points in the high-frequency channel after the NSST decomposition are classified into step and ridge edges [20]. The idea of edge enhancement processing on the high-frequency image is as follows. The step edge of the original image in the airspace is represented as the ridge edge in the high-frequency channel of the NSST domain, which can be approximated as a truncated Gaussian function. By modifying the shape of the Gaussian function (i.e., reducing the variance of the Gaussian function and increasing its amplitude), an edge whose slope has changed can be obtained by inverse transformation. Thus, the edge is enhanced. The ridge edge in the airspace in the high-frequency channel of the NSST domain is represented by an odd–symmetric ridge edge pair, which can be approximated as a single-cycle sine function. Therefore, edge enhancement can be achieved by reducing the period of the single-cycle sine function and increasing its amplitude.
The period of the ridge edge and the odd–symmetric ridge edge pair is T. The function of the ridge edge used to fit the high-frequency sub-band coefficient of the NSST domain is shown in Equation (16):
where is the mean value obtained by fitting the Gaussian function. Let the variance of the fitted Gaussian function be , then σ is 0.5 × σ1. The function of fitting the odd-symmetric ridge edge pair is a single-cycle sine function with a period of T/3.
Based on the previous analysis, the algorithm for edge enhancement of high-frequency sub-band images is as follows: the step and ridge edges are found by the directional information measure. Then, Gaussian and sinusoidal fitting are performed on the two edges in the high-frequency channel. The variance σ of the fitted Gaussian function and the period T of the sine function are reduced, and the maximum amplitude increases. Thus, the edge enhancement of the high-frequency sub-band image is completed to obtain the final high-frequency enhanced image .
5. Simulation Experiment
5.1. SAR, Infrared, and Medical Image Enhancement Experiments
(1) Description of the Experiment
The experimental tools used in this paper were: Lenovo desktop computer with CPU of Intel Core i5 and memory of 4G. In addition, the simulation software was Matlab 2010. According to the theory and method described above and using MATLAB2010 as a tool, three groups of 256 × 256 images were selected for simulation experiments and analysis. The first, second, and third groups of images were Synthetic Aperture Radar (SAR), infrared, and medical images, respectively. In addition, to further prove the effectiveness of the method proposed in the present paper, three methods were selected for comparison with the method of this paper: (1) The multiscale retinex (MSR) method (Method 1); the NSCT domain-based histogram equalization image enhancement method (Method 2) [21]; and the multiscale retinex (MSR)- and NSCT-based image enhancement method (Method 3) [22]. Among them, the NSCT multiscale decomposition levels in Method 3 had four levels, and the direction decomposition levels were 1, 3, 3, and 4. For the method of this paper, NSST multiscale decomposition had four levels, the multiscale decomposition filter was maxflat, and the Shear filter was used for multidirectional decomposition of the image. The direction decomposition numbers were 6, 6, 8, and 8, while each neighborhood size was 3 × 3.
Image enhancement quality can be compared both subjectively and objectively. Subjective evaluation is usually performed visually or by visual inspection, generally referring to the evaluation of image brightness, texture, contrast, and sharpness. The objective evaluation criterion refers to the quantitative analysis of images. The objective evaluation criteria used in this paper are standard deviation (SD) [23], information entropy (IE), average gradient (AG) [24], edge intensity (QI), and root mean square error (RMSE) [25]. Among them, the SD is also called the mean square error, which can reflect the dispersion of the gray level of each pixel of the image relative to the gray average. The larger the SD, the greater the contrast the image has, the more information can be seen, and the better the image quality is. Information entropy is a measure of the richness of image information from the perspective of information theory. The size of information entropy reflects the amount of information carried by the image. Therefore, the larger the information entropy of the image, the richer the amount of information is, and the better the quality is. The average gradient reflects the ability of the image to express the contrast of small details. In general, the larger the average gradient, the clearer the image is. The larger the QI value, the greater the presence of important detail information, such as the edge of the original image in the enhanced image, and the higher the quality of the enhanced image. RMSE reflects the mirror of image detail preservation. It measures the deviation degree of the enhanced image from the original image’s gray level. For the image enhancement experiment, the larger the value is, the greater the degree of enhancement for the original image and the better the enhancement effect. Conversely, the worse the enhancement effect.
(2) Experimental results and analysis
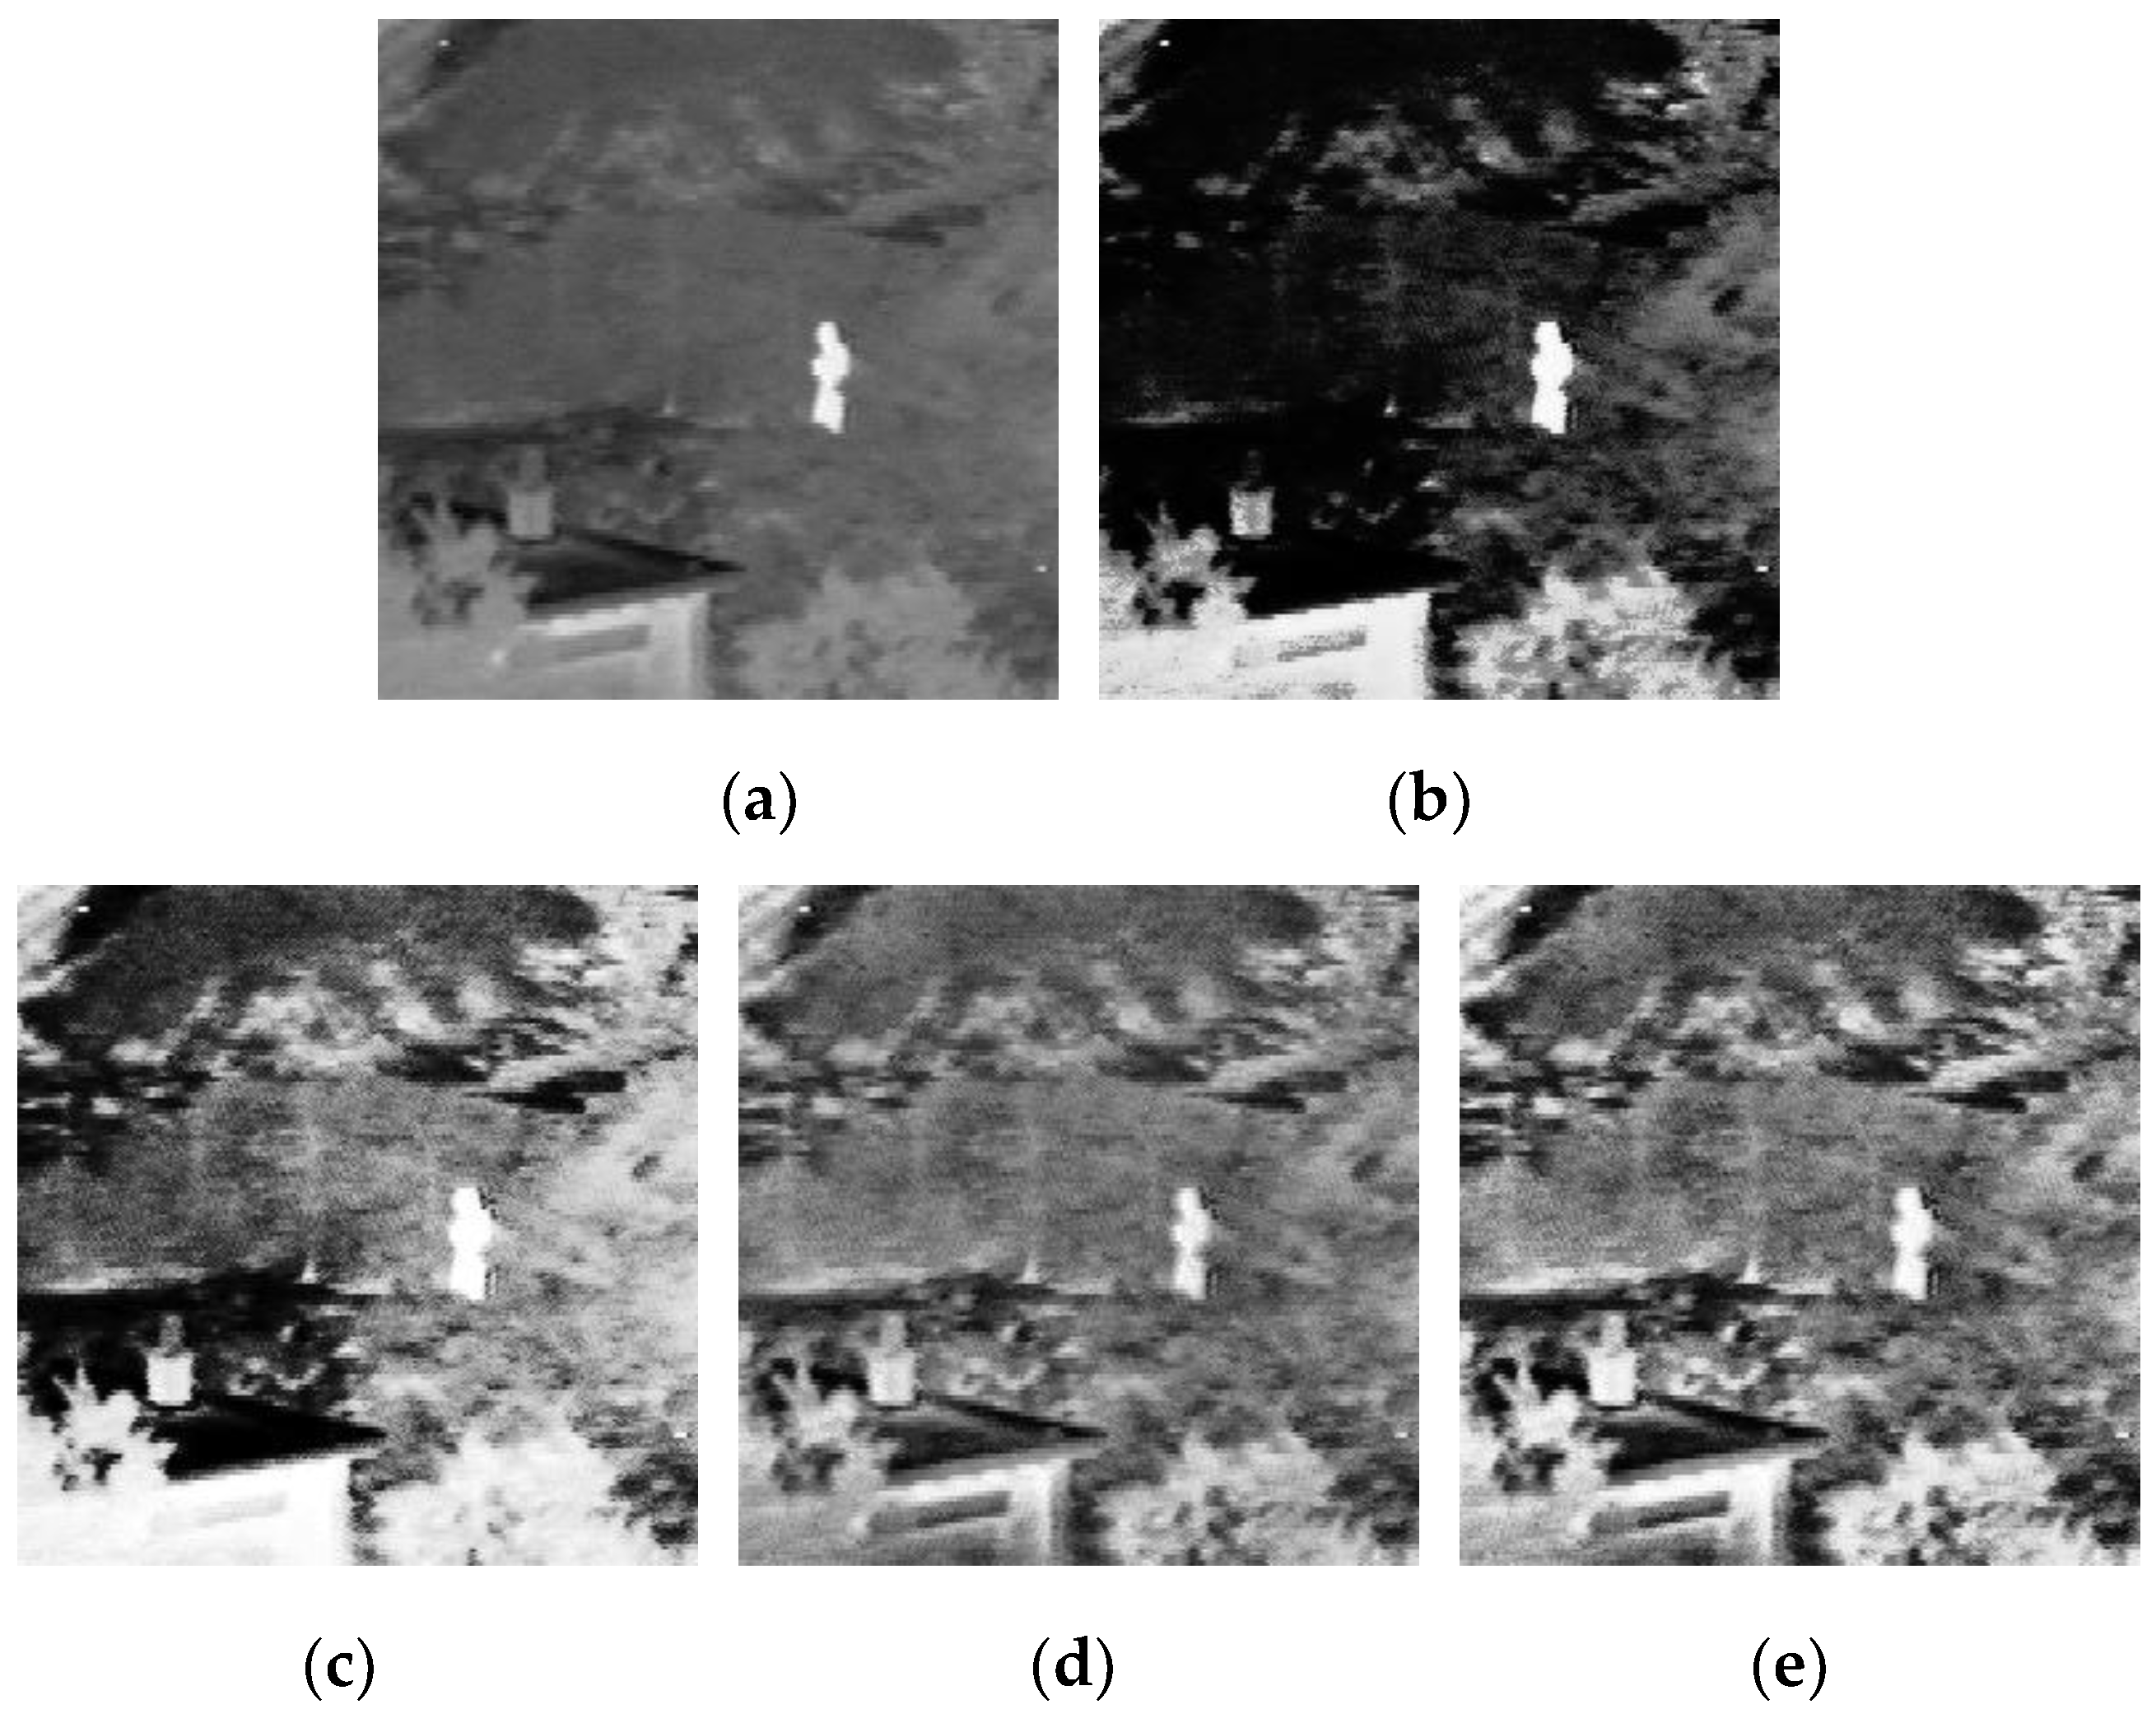
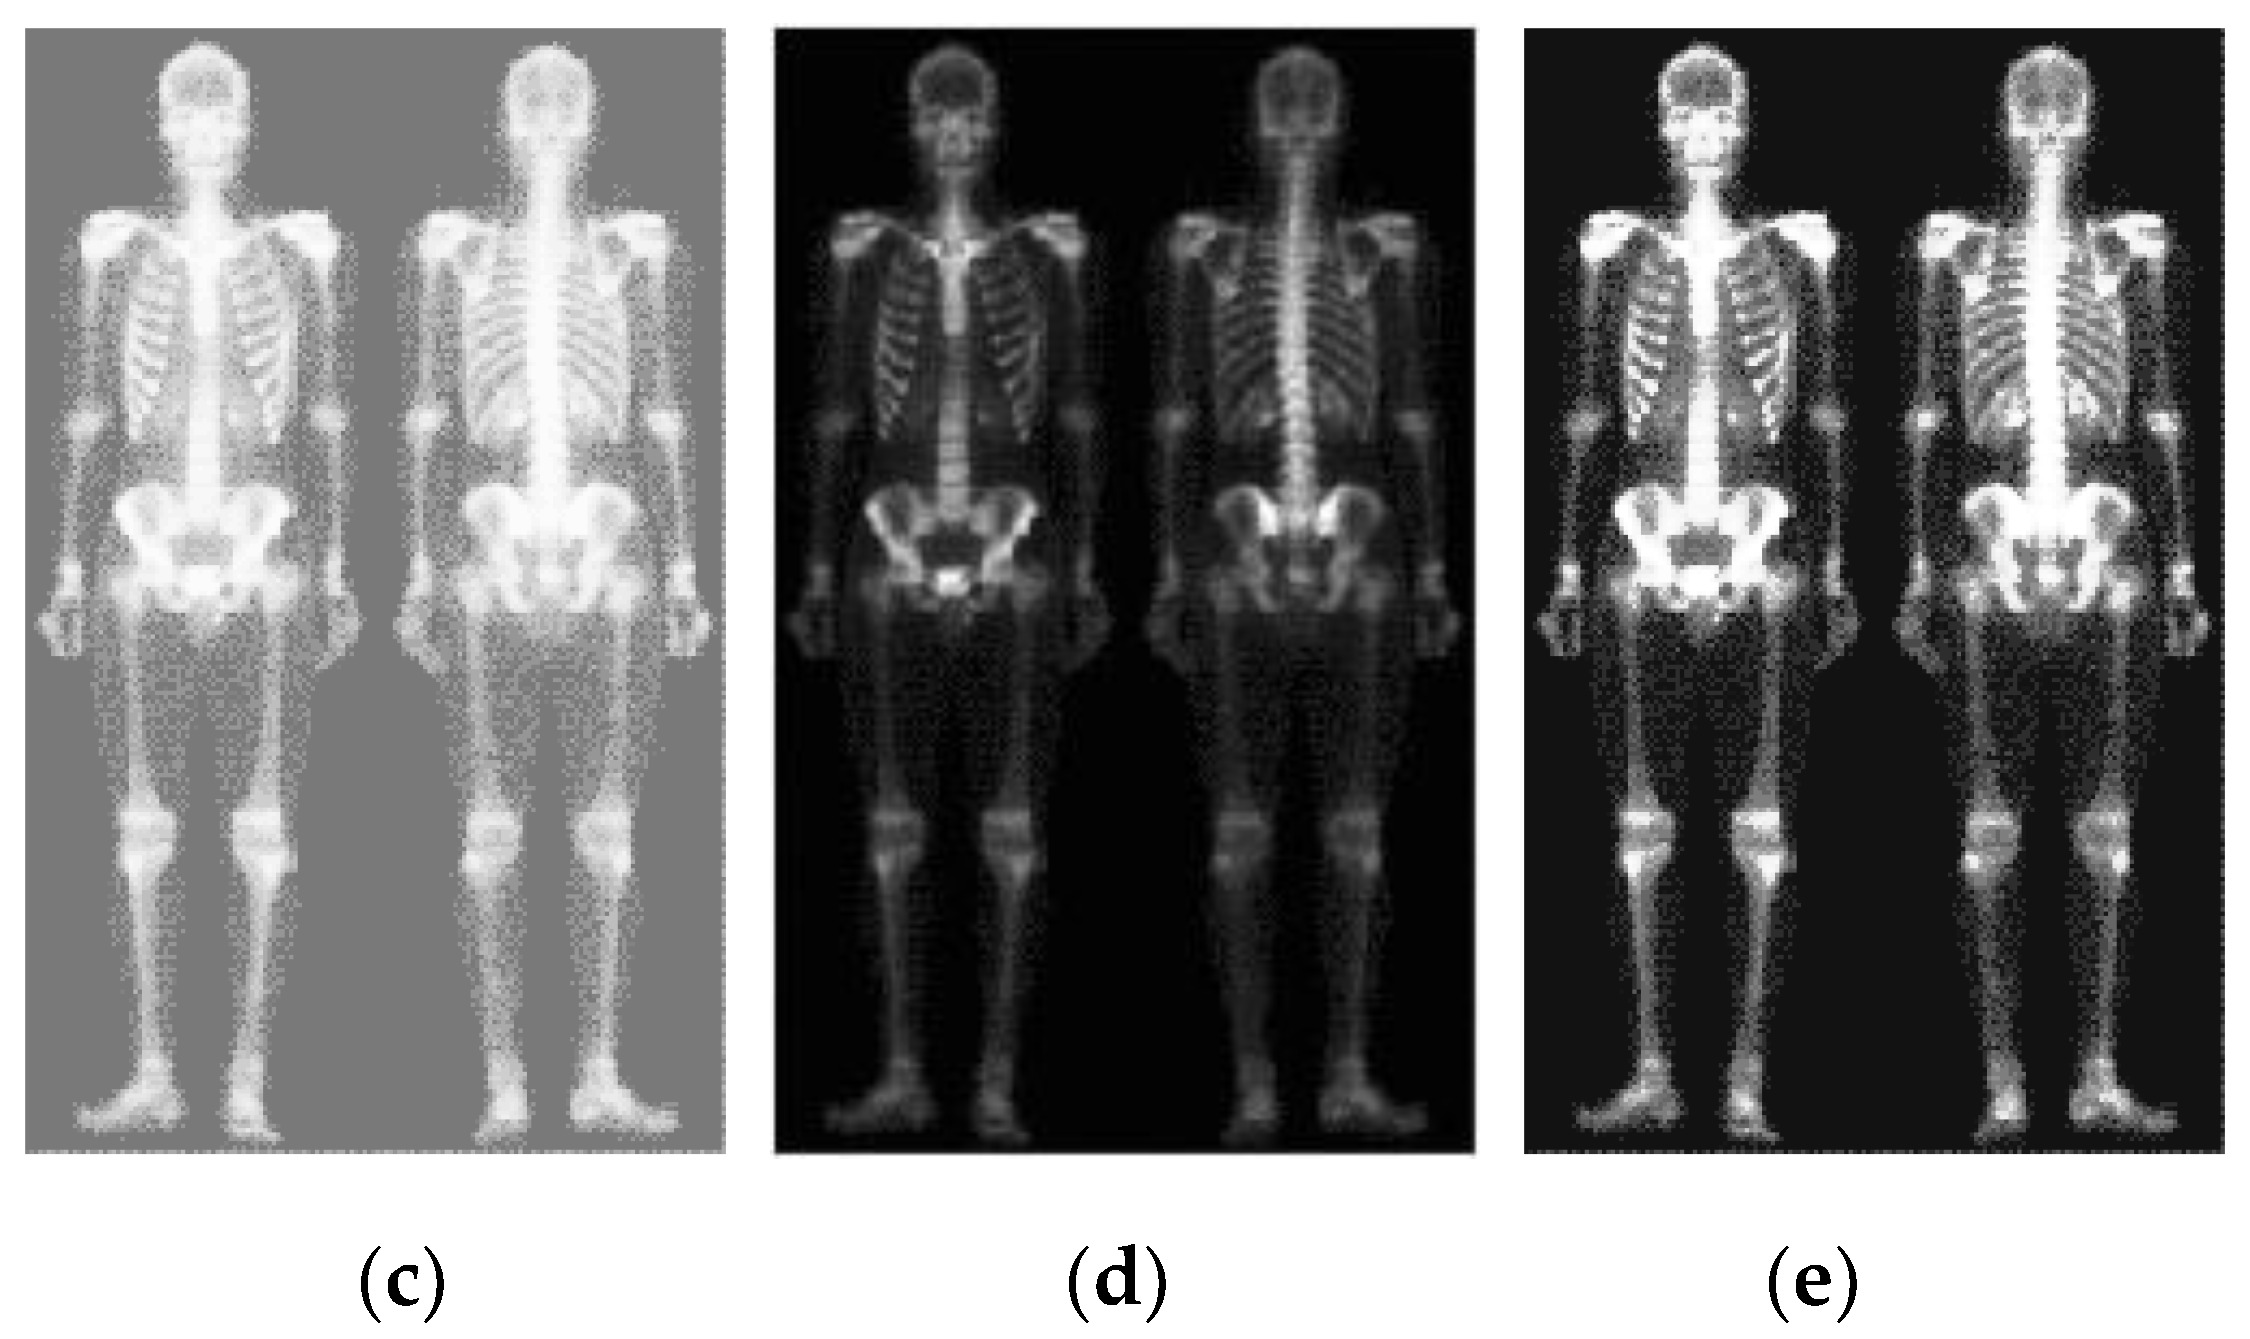
Figure 3, Figure 4 and Figure 5 show the results of experiments on enhanced SAR, infrared, and medical imagery, respectively. Subjectively, the enhanced image brightness and sharpness of Method 1 in Figure 3 are not satisfactory. The enhanced image brightness of methods 2 and 3 as well as the method used in this paper is better. Little difference can be seen in the enhanced image sharpness of Methods 2 and 3, but the enhanced image sharpness of the method employed in this paper is better than that of the other three methods. The enhanced image of the infrared image of Method 1 in Figure 4 is not very sharp. The texture and edge information in the image are not as rich as that in the enhanced image of Methods 2 and 3. The method of this paper is superior to the other three methods in terms of contrast, sharpness, and edge information of the image. Figure 5 is an enhanced medical image. Visually, the enhanced image brightness of Method 2 is better than the others, but the image has poor contrast. The enhanced image of Method 1 has better contrast, but poor sharpness. The enhanced image of the method employed in this paper can clearly allow the observation of bone structure and its details, while the contrast and sharpness of this image are better than those of the other three methods.
Because subjective analysis has certain limitations, we objectively evaluated the image enhancement results of the three groups of experiments, as shown in Table 1, Table 2 and Table 3. The data in Table 1, Table 2 and Table 3 show that, except for the contrast index in the infrared image enhancement experiment, the four indices (SD, IE, AG, and QI) of the method of this paper are superior to those of the other three methods in the three groups of experiments.
In the SAR image enhancement experiment, the data of the four items of Methods 2 and 3 were higher than those of Method 1, indicating that the image enhancement method in the frequency domain has more advantages in SAR image enhancement. Each index of Method 4 of this paper was higher than those of Methods 2 and 3; this proves that the image enhancement scheme adopted in this paper can improve the contrast, sharpness, and the amount of important information found in an image. In the infrared image enhancement experiment, the contrast index of the method of this paper was slightly lower than that of Method 2, while the other indices still showed a large advantage. This further demonstrates that the method of this paper can help researchers to better identify the edge and texture information in the original image and increase the amount of information available for analysis. In the medical image enhancement experiment, the indices of the method employed in this paper are obviously superior to those of the other three methods, especially for the SD and edge intensity. In addition, the information entropy and average gradient of the enhanced image of the proposed method in this paper were also higher than those of the other three methods. All of these demonstrate that the image enhancement method proposed in this paper can improve the performance of medical image enhancement.
5.2. Enhancement Experiment for Images with Band Noise
(1) Description of the Experiment
To further prove that the method of this paper can effectively separate noise from the useful information of an original image, we selected two groups of 256 × 256 grayscale blurred images with Gaussian white noise to compare image enhancement, specifically Lena and Barbara image groups. The three image enhancement methods described in Section 5.1 and the method of this paper were used to complete the comparison experiments of the images.
To review the enhancement results of images with band noise, the enhanced images were evaluated from both subjective and objective perspectives. The difference between these two perspectives is that in the enhancement experiment for images with band noise, the objective evaluation criteria used were normalized mutual information (NMI) and peak signal-to-noise ratio (PSNR). The NMI is an expression of the measured similarity between two pictures. The larger the NMI value, the higher the similarity is between two pictures. By comparing the NMI between the enhanced and the noise-free standard images of each method, the improvement of quality in the images with band noise removed by each method can be seen. The PSNR represents the amount of noise in the image. A larger PSNR indicates less noise was present. By calculating and comparing the PSNR between the enhanced and standard images of each method, the denoising performance of various enhancement methods could be analyzed.
(2) Experiment Results and Analysis
Figure 6 and Figure 7 show the enhancement experiment results of the Lena and Barbara images with band noise, respectively. From a subjective point of view, each method could extract and enhance important information in the original image for different images. However, in the two groups of experiments, the enhanced image of the method proposed in this paper had better sharpness and contrast than the enhanced images from the other three methods. The method of this paper had a low degree of distortion and better visual effects (Figure 6 and Figure 7). The image of Method 1 had poor brightness, and that of Method 2 had obvious noise information. To further compare the image enhancement performance of these methods, the enhancement results were objectively compared (shown in Table 4 and Table 5).
Based on the objective comparison of the results in Table 4 and Table 5, we can see that Method 3 and the method of this paper performed significantly better than Method 1 for the two evaluation indices in the two groups of experiments. This shows that the image enhancement method in the frequency domain is more conducive to filtering noise and can better preserve the details of the original image. In addition, the index of the method employed in this paper was better than the NMI and PSNR values of Method 3. This again demonstrates that the image enhancement method of the NSST domain used in this paper can identify and filter the noise information while retaining the structural information, such as the edge and texture of the original image, as much as possible. This experiment shows that the method of this paper performed well in enhancement experiments for images with band noise.
6. Conclusions
Based on the advantages of NSST in the field of image processing and the working principle of image enhancement, NSST was applied to the field of image enhancement. According to the characteristics of the high- and low-frequency coefficients in NSST, the MSR-based enhancement strategy was adopted for the low-frequency coefficient, and an enhancement strategy based on the directional information measurement was used for the high-frequency coefficient. After performing the inverse transformation on the enhanced low- and high-frequency sub-band images, the final enhanced image was obtained. In SAR, infrared and medical image enhancement experiments, the visual effect and objective evaluation indices presented by the enhanced image based on the method of this paper are better than those listed in this paper. In the experiment of noisy image, the NMI and PSNR values of the enhanced image based on the method of this paper are higher than those of other methods. From subjective and objective perspectives, the experiment verifies the superiority of the method based on this paper in enhancing the contrast and sharpness of image, while suppressing noise information. Finally, it is shown that the enhanced image based on the method of this paper can not only better express the edge, texture, and structural features in the original image, but can also filter out the noise in the image. As a result of that, the visibility of the enhanced image was improved while the influence of noise was reduced. Future research should center on learning how to further improve the algorithm used here to increase the computing speed.
Author Contributions
Conceptualization, Z.Q. and Y.X.; methodology, Y.X.; validation, Z.Q.; writing—original draft preparation, Z.Q.; writing—review and editing, Y.S.; funding acquisition, Y.S.
Funding
This research was funded by the National Natural Science Foundation of China under Grants No. 61703426 and No. 61503407.
Conflicts of Interest
The authors declare no conflict of interest.
References
- Wang, H.; Zhang, Y.; Shen, H.; Zhang, J. Review of image enhancement algorithms. Chin. Opt. 2017, 10, 438–448. [Google Scholar] [CrossRef]
- Li, L.; Si, Y.; Jia, Z. Medical Image Enhancement Based on CLAHE and Unsharp Masking in NSCT Domain. J. Med. Imaging Health Inf. 2018, 8, 431–438. [Google Scholar] [CrossRef]
- Zhang, B.; Jia, Z.; Qin, X.; Yang, J.; Hu, Y. Remote sensing image enhancement based on Shearlet transform. J. Optoelectron. Laser 2013, 24, 2249–2253. [Google Scholar]
- Hu, Y.; Krzysztof, J.; Chen, Y. Task-oriented information value measurement based on space-time prisms. Int. J. Geogr. Inf. Sci. 2016, 30, 1228–1249. [Google Scholar] [CrossRef]
- Li, H.; Chai, Y.; Ling, R.; Yin, H. Multifocus Image Fusion Scheme Using Feature Contrast of Orientation Information Measure in Lifting Stationary Wavelet Domain. J. Inf. Sci. Eng. 2013, 29, 227–247. [Google Scholar]
- Guariglia, E.; Silvestrov, S. Fractional-Wavelet Analysis of Positive Definite Distributions and Wavelets on D’(C); Engineering Mathematics II; Silvestrov, R., Ed.; Springer: Berlin, Germany, 2016; pp. 337–353. [Google Scholar]
- Guariglia, E. Spectral Analysis of the Weierstrass-Mandelbrot Function. In Proceedings of the 2nd International Multi Disciplinary Conference on Computer and Energy Science, Split, Croatia, 12–14 July 2017. [Google Scholar]
- Raj, S.; Nair, M.; Subrahmanyam, G. Satellite Image Resolution Enhancement Using Nonsubsampled Contourlet Transform and Clustering on Subbands. J. Indian Soc. Remote Sens. 2017, 45, 979–991. [Google Scholar] [CrossRef]
- Guido, R.C.; Barbon, S.; Vieira, L.S.; Sanchez, F.L.; Maciel, C.D.; Pereira, J.C.; Scalassara, P.R.; Fonseca, E.S. Introduction to the discrete shapelet transform and a new paradigm: Joint time-frequency-shape analysis. In Proceedings of the IEEE International Symposium on Circuits and Systems (IEEE ISCAS 2008), Seattle, WA, USA, 18–21 May 2008; pp. 2893–2896. [Google Scholar]
- Guido, R.C.; Addison, P.; Walker, J. Introducing wavelets and time-frequency analysis. IEEE Eng. Biol. Med. Mag. 2009, 28, 13. [Google Scholar] [CrossRef] [PubMed]
- Wu, Y.; Yin, J.; Dai, Y. Image Enhancement in NSCT Domain Based on Fuzzy Sets and Artificial Bee Colony Optimization. J. S. China Univ. Technol. (Nat. Sci. Ed.) 2015, 43, 59–65. [Google Scholar]
- Bamberger, R.H.; Smith, M.J.T. A filter bank for the directional decomposition of images: Theory and design. IEEE Trans. Signal Process. 1992, 4, 882–893. [Google Scholar] [CrossRef]
- Wang, Z.; Yang, F.; Peng, Z.; Chen, L.; Ji, L. Multi-sensor image enhanced fusion algorithm based on NSST and top-hat transformation. Opt.-Int. J. Light Electron. Opt. 2015, 126, 4184–4190. [Google Scholar]
- Li, L.; Si, Y. A Novel Remote Sensing Image Enhancement Method Using Unsharp Masking in NSST Domain. J. Indian Soc. Remote Sens. 2016, 44, 1–11. [Google Scholar] [CrossRef]
- Da Cunha, A.L.; Zhou, J.; Do, M.N. The nonsubsampled contourlet transform: Theory, design, and applications. IEEE Trans. Image Process. 2006, 10, 3089–3101. [Google Scholar] [CrossRef]
- Li, H. Research on Pixel Level Fusion Methods for Multifocus Image; Chongqing University: Chongqing, China, 2012. [Google Scholar]
- Li, C.; Liang, D.; Jiang, M. A wavelet-based image enhancement algorithm. J. Harbin Inst. Technol. 2009, 41, 262–265. [Google Scholar]
- Li, A.; Li, Y.; Liu, D.; Yang, X. Retinex enhancement method of multi-exposure workpiece images based on NSCT. J. Jilin Univ. (Eng. Technol. Ed.) 2012, 42, 1592–1596. [Google Scholar]
- Yamakawa, M.; Sugita, Y. Image enhancement using Retinex and image fusion techniques. Electron. Commun. Jpn. 2018, 101, 52–63. [Google Scholar] [CrossRef]
- Wang, S.; Liang, D. An Algorithmic Adaptive Enhancement Algorithm of Form Image Based on Image Information Measure. J. Image Gr. 2006, 11, 60–65. [Google Scholar]
- Zhou, Y.; Li, Q.; Huo, G. Adaptive image enhancement based on NSCT coefficient histogram matching. Opt. Precis. Eng. 2014, 22, 2214–2222. [Google Scholar] [CrossRef]
- Wu, Y.; Shi, J. Image Enhancement in Non-Subsampled Contourlet Transform Domain Based on Multi-Scale Retinex. Acta Opt. Sin. 2015, 35, 87–96. [Google Scholar]
- Eskicioglu, A.M.; Fisher, P.S. Image quality measures and their performance. IEEE Trans. Commun. 1995, 43, 2959–2965. [Google Scholar] [CrossRef] [Green Version]
- Chen, G.H.; Yang, C.L.; Xie, S.L. Gradient-based structural similarity for image quality assessment. In Proceedings of the 2006 International Conference on Image Processing, Atlanta, GA, USA, 8–11 October 2006; pp. 2929–2932. [Google Scholar]
- Gasparovic, M.; Gajski, D. Testing of Image Quality Parameters of Digital Cameras for Photogrammetric Surveying with Unmanned Aircrafts. Geod. List 2016, 70, 253–266. [Google Scholar]
Figure 1.
Two-layer non-subsampled shearlet transform (NSST) decomposition. (a) Original image; (b) low-frequency approximation image after NSST decomposition; (c) high-frequency detail image after decomposition by the first NSST layer; (d) high-frequency detail image after decomposition by the second NSST layer.

Figure 2.
Directional information measurement of the image. (a) Basic frame of directional information measurement; (b) Camerist; (c) directional information measurement of (a).
Figure 2.
Directional information measurement of the image. (a) Basic frame of directional information measurement; (b) Camerist; (c) directional information measurement of (a).

Figure 3.
Synthetic aperture radar image enhancement; experimental results. (a) Original image; (b) Method 1; (c) Method 2; (d) Method 3; (e) method of this paper.
Figure 3.
Synthetic aperture radar image enhancement; experimental results. (a) Original image; (b) Method 1; (c) Method 2; (d) Method 3; (e) method of this paper.


Figure 4.
Infrared image enhancement; experimental results. (a) Original image; (b) Method 1; (c) Method 2; (d) Method 3; (e) method of this paper.
Figure 4.
Infrared image enhancement; experimental results. (a) Original image; (b) Method 1; (c) Method 2; (d) Method 3; (e) method of this paper.

Figure 5.
Medical image enhancement; experimental results. (a) Original image; (b) Method 1; (c) Method 2; (d) Method 3; (e) method of this paper.
Figure 5.
Medical image enhancement; experimental results. (a) Original image; (b) Method 1; (c) Method 2; (d) Method 3; (e) method of this paper.


Figure 6.
Experimental results of Lena noise image enhancement. (a) Original image; (b) Method 1; (c) Method 2; (d) Method 3; (e) method of this paper.
Figure 6.
Experimental results of Lena noise image enhancement. (a) Original image; (b) Method 1; (c) Method 2; (d) Method 3; (e) method of this paper.


Figure 7.
Experimental results of Barbara image enhancement (a) Original image; (b) Method 1; (c) Method 2; (d) Method 3; (e) method of this paper.
Figure 7.
Experimental results of Barbara image enhancement (a) Original image; (b) Method 1; (c) Method 2; (d) Method 3; (e) method of this paper.


Table 1.
Objective evaluation of SAR image. SD: Standard deviation, IE: Information entropy, AG: Average gradient, QI: Edge intensity, RMSE: Root mean square error.
Table 1.
Objective evaluation of SAR image. SD: Standard deviation, IE: Information entropy, AG: Average gradient, QI: Edge intensity, RMSE: Root mean square error.
| Method 1 | Method 2 | Method 3 | Method of This Paper | |
|---|---|---|---|---|
| SD | 25.5981 | 29.9218 | 31.2173 | 33.6745 |
| IE | 6.2154 | 5.8777 | 7.6509 | 7.7795 |
| AG | 66.3755 | 74.5268 | 71.9774 | 77.0601 |
| QI | 129.3333 | 132.000 | 130.667 | 133.333 |
| RMSE | 35.6328 | 70.8548 | 62.7218 | 76.0373 |
Table 2.
Objective evaluation of infrared image.
| Method 1 | Method 2 | Method 3 | Method of This Paper | |
|---|---|---|---|---|
| SD | 8.3528 | 12.2699 | 10.5825 | 14.1323 |
| IE | 5.9298 | 5.7747 | 7.3261 | 7.4219 |
| AG | 55.8713 | 74.817 | 42.405 | 66.3998 |
| QI | 116.000 | 118.667 | 117.333 | 120.000 |
| RMSE | 33.5286 | 46.2509 | 57.6837 | 60.3351 |
Table 3.
Objective evaluation of medical image.
| Method 1 | Method 2 | Method 3 | Method of This Paper | |
|---|---|---|---|---|
| SD | 12.7115 | 8.7209 | 10.5082 | 14.6631 |
| IE | 3.0834 | 2.9463 | 3.0319 | 4.3297 |
| AG | 61.6765 | 44.1985 | 47.7816 | 73.1899 |
| QI | 137.3333 | 140.000 | 138.6667 | 141.333 |
| RMSE | 49.2881 | 34.3490 | 41.0353 | 61.1784 |
Table 4.
Objective comparison of image enhancement of Lena image.
| Method 1 | Method 2 | Method 3 | Method of This Paper | |
|---|---|---|---|---|
| NMI | 0.5574 | 1.1094 | 1.0492 | 1.1106 |
| PSNR | 10.5755 | 16.4564 | 17.2313 | 17.2609 |
Table 5.
Objective comparison of image enhancement of Barbara image.
| Method 1 | Method 2 | Method 3 | Method of This Paper | |
|---|---|---|---|---|
| NMI | 0.6087 | 1.1992 | 1.1603 | 1.2057 |
| PSNR | 11.5892 | 15.7178 | 16.2943 | 16.4880 |
© 2018 by the authors. Licensee MDPI, Basel, Switzerland. This article is an open access article distributed under the terms and conditions of the Creative Commons Attribution (CC BY) license (http://creativecommons.org/licenses/by/4.0/).
Share and Cite
MDPI and ACS Style
Qu, Z.; Xing, Y.; Song, Y. An Image Enhancement Method Based on Non-Subsampled Shearlet Transform and Directional Information Measurement. Information 2018, 9, 308. https://doi.org/10.3390/info9120308
AMA Style
Qu Z, Xing Y, Song Y. An Image Enhancement Method Based on Non-Subsampled Shearlet Transform and Directional Information Measurement. Information. 2018; 9(12):308. https://doi.org/10.3390/info9120308
Chicago/Turabian StyleQu, Zhi, Yaqiong Xing, and Yafei Song. 2018. "An Image Enhancement Method Based on Non-Subsampled Shearlet Transform and Directional Information Measurement" Information 9, no. 12: 308. https://doi.org/10.3390/info9120308
Note that from the first issue of 2016, this journal uses article numbers instead of page numbers. See further details here.