Article

Storytelling and Visualization: An Extended Survey

1
Visual and Interactive Computing Group, Swansea University, Swansea SA2 8PP, UK
2
Department of Computer Science, University of North Carolina at Charlotte, Charlotte, NC 28223, USA
3
Department of Computer Science and Engineering, Hong Kong University of Science and Technology, Hong Kong, China
*
Author to whom correspondence should be addressed.
Information 2018, 9(3), 65; https://doi.org/10.3390/info9030065
Submission received: 24 January 2018 / Revised: 22 February 2018 / Accepted: 9 March 2018 / Published: 14 March 2018
(This article belongs to the Section Information Theory and Methodology)

Abstract

:
Throughout history, storytelling has been an effective way of conveying information and knowledge. In the field of visualization, storytelling is rapidly gaining momentum and evolving cutting-edge techniques that enhance understanding. Many communities have commented on the importance of storytelling in data visualization. Storytellers tend to be integrating complex visualizations into their narratives in growing numbers. In this paper, we present a survey of storytelling literature in visualization and present an overview of the common and important elements in storytelling visualization. We also describe the challenges in this field as well as a novel classification of the literature on storytelling in visualization. Our classification scheme highlights the open and unsolved problems in this field as well as the more mature storytelling sub-fields. The benefits offer a concise overview and a starting point into this rapidly evolving research trend and provide a deeper understanding of this topic.

1. Introduction and Motivation

We believe in the power of science, exploration, and storytelling to change the world”—Susan Goldberg, Editor in Chief of National Geographic Magazine, from “The Risks of Storytelling”, October 2015 [1].
In a world increasingly saturated with data and information, visualizations are a potent way to break through the clutter, tell your story, and persuade people to action” [2]—Adam Singer, Clickz.com, “Data Visualization: Your Secret Weapon in Storytelling and Persuasion”, October 2014.
Throughout history, storytelling has been an effective way of conveying information and knowledge [3]. In the field of visualization, storytelling is rapidly developing techniques that enhance understanding. By visualization, we refer to “interactive data visualization” as defined by and described extensively by Ward et al. [4]. We note that there are many references to interactive visualization throughout the survey. For example, the term “interactive”, appears over 40 times throughout the text. We also note that animated transitions are a major theme in the survey and receive their own section in the text. See Table 1. Many communities have commented on the importance of storytelling in data visualization [5]. Storytellers tend to be integrating complex visualizations into their narratives in growing numbers.
As contributions, we present a survey reviewing storytelling papers in visualization and present an overview of the common and important elements in storytelling visualization. We also describe the challenges in this field and present a novel classification of the literature on storytelling in visualization. Our classification highlights both mature and unsolved problems in this area. The benefit is a concise overview and valuable starting point into this rapidly growing and evolving research trend. Readers will also gain a deeper understanding of this rapidly evolving research direction.

1.1. Definition and Storytelling Elements

A story can be defined as “a narration of the events in the life of a person or the existence of a thing, or such events as a subject for narration” [6] or “a series of events that are or might be narrated” [7]. Storytelling is a popular concept that is used in many fields, such as media [5], education [8] and entertainment [9]. Storytelling is a technique used to present dynamic relationships between story nodes through interaction. According to Zipes [8], storytelling can involve animation and self-discovery, incorporating models, ethical principles, canons of literature, and social standards. In education, a storyteller can improve and strengthen the literacy of students. Also, the storyteller can engage audiences so they feel a desire to read, write, act, and draw. Audience members can learn to express themselves critically and imaginatively with techniques they may learn from the storyteller or teacher.
In the context of the visualization literature. Lee et al. [10] argue that “the community has been using the term ‘storytelling’ in a very broad way without a clear consensus or discussion on what a visual data story encompasses”. They state that a visual data story includes a set of story pieces. Most of the story pieces are visualized to support one or more intended messages. Story pieces are presented with a meaningful order or connection between them to support the author’s high level communication goal.
Furthermore no agreed definition of “visual data story” has yet emerged in the visualization literature [10]. For a full-length 6 page discussion on this topic, we refer the reader to Lee et al. [10].

1.2. Classification of Literature and Challenges in Storytelling and Visualization

Although storytelling has been developing in other fields for years, storytelling is a relatively new subject in visualization. As such, it faces many challenges. In this survey we have extracted the fundamental characteristics of storytelling both as an entity and as a creative process. Our literature classification is based on the logical notions of who are the main subjects involved in storytelling for visualization (authoring tools and audience), how are stories told (narratives and transitions), why can we use storytelling for visualization (memorability and interpretation). From these characteristics we have then developed the following dimensions which are common to storytelling in visualization.
Authoring-Tools: Authorship addresses who creates the story and narrative. Authorship commonly refers to the state or fact of being the writer of a book, article, or document or the creator of a work of art [11] and its source or origin [12]. Central to this definition is the writer or author. Rodgers [13] defines an author as “an individual solely responsible for the creation of a unique body of work”.
User-engagement: Engagement is about the audience and also concerns why we use storytelling. How can we ensure that the message comes across to the audience? Can we measure engagement?
Narratives: Narrative concerns how an author tells a story. Narrative structures include events and visualization of characters. Narrative visuals contain the transition between events. This entails, “Using a tool to visually analyze data and to generate visualizations via vector graphics or images for presentation”, and then deciding “how to thread the representations into a compelling yet understandable sequence” [14].
Transitions: Transitions are about how authors may tell the story. Transitions seamlessly blend events within a story and are key to its flow. Successful transitions vary actions as little as possible to strengthen overall coherence. Transitions in visualization can be either dynamic or static.
Memorability: Memorability addresses why authors present data in the form of a story. Memorability is an important goal of storytelling. A good visualization technique draws the viewer’s attention and increase a story’s memorability [15].
Interpretation: Data interpretation refers to the process of critiquing and determining the significance of important data and information, such as survey results, experimental findings, observations or narrative reports.
When examined in the context of storytelling in visualization each dimension raises interesting questions: Are current storytelling platforms taking into account the role of the author and supporting the authorship process? What forms of narrative structures and visuals best apply to storytelling in visualization? Are static transitions or dynamic transitions more effective for storytelling in visualization? Can visualization increase the memorability of data information or knowledge? Does storytelling and visualization aid with data interpretation? What is the most effective way to engage an audience? Data preparation and enhancement is another challenge for which there is currently no literature. Thus we include it as a future research direction but not in our classification.
Starting from the logical notions of who, how, why, and these open questions we have chosen these dimensions to form the basis of our literature classification on storytelling in visualization. See Table 1. It is important to note that some papers address multiple topics in Table 1 and in our classification. We placed papers by what we determined to be the main focus of the paper. This is very useful for obtaining an overview. However some papers address more than one theme, e.g., authoring tools and narratives.

1.3. Classification of Literature: The Second Dimension

In addition, the literature is also classified by the ordering or sequence of events, which refers to the traversal the path viewer takes through the visualization. This dimension is adapted from Segal and Heer [5]. It forms our second categorization for Table 1. The classification includes:
  • Linear: A story sequence path in linear order is prescribed by the author.
  • User-directed path: The user selects a path among multiple alternatives or creates their own path.
  • Parallel: several paths can be traversed or visualized at the same time.
  • Random access or other: There is no prescribed path. There is currently no literature prescribing random order. Therefore we replace this with a column called “overview”.

1.4. Literature Search Methodology

We search both the IEEE and ACM Digital libraries for the terms “storytelling”, “narrative visualization”, “memorability”, “transitions in visualization”, “user-engagement”, and various combinations of these phrases. We focus primarily on the IEEE TVCG papers. We check the references of each paper and looked for related literature on storytelling. We also search the visualization publication data collection [56] for these major themes in visualization and storytelling. Google scholar is also used as part of our search methodology.
In summary, our literature search includes:
  • IEEE EXPLORE Digital Library
  • ACM Digital Library
  • Visualization publication data collection [56]
  • the annual EuroVis conference
  • the Eurographics Digital Library
Several other papers were discovered by looking at the related work section of the papers we found.

1.5. Survey Scope

The storytelling visualization papers summarized in this survey include the subjects of scientific visualization, information visualization, geo-spatial visualization, and visual analytics. In order to manage the scope of this survey, storytelling papers from other fields are not included, such as:
Virtual reality and augmented reality: For example, Santiago et al. [57] present “mogre-storytelling” as a solution to interactive storytelling. This tool provides different functionalities for creating and the customization of scenarios in 3D, enables the addition of 3D models from the Internet, and enables the creation of a virtual story using multimedia and storytelling elements.
Education: For example, Cropper et al. [58] address the extent of how scientific storytelling benefits our communication skills in the sciences, and the connections they establish with the information itself and others in their circle of influence.
Gaming: Alavesa et al. [59] describe the development of a small scale pervasive game which can take storytelling from camp-fire sites to modern urban environments.
Multi-media and Image Processing: For example, Chu et al. describe a system to transform any temporal image sequence to a comics-based storytelling visualization [60]. Correa and Ma present a narrative system to generate dynamic narrative from videos [61]. Image processing falls outside the scope of this survey. Video processing also falls outside the scope of the survey [34].
Language processing: Theune et al. [62] develop a story generation system. It can create story plots automatically based on the actions of intelligent agents living in a virtual story world. The derived plots are converted to natural language, and presented to the user by an embodied agent that makes use of text-to-speech.
Annotation: The topic of annotation is included in the survey. For example, Annotation is discussed in Section 5.1. Narrative Visualization for Linear Storytelling where Hullman et al. describe a system called contextifier, which automatically produces custom, annotated visualizations from a given article [32]. Hullman et al. is based on previous work in storytelling in visualization [4] and Kandogan’s automatic annotation analytics [63]. It develops a system that can automatically generate custom, annotated visualization from a news article of company. The theme of annotations arises again in Section 5.4 on Narrative Visualization Overviews where we discuss literature on annotated charts.
Details-on-Demand: The theme of details-on-demand is included in the survey and is often used throughout the literature. For example in Section 3.2. Authoring-tools for User-directed and Interactive Storytelling, Figure 1 shows an image sequence taken from a sample linear volumetric story. The distinct story nodes refer to the key events in the story, which provide an overview first, then details on specific features on demand. Again in Section 5.4 Narrative Visualization Overviews, an Afghanistan nation-building development project example shows an interactive geographic visualization with details on-demand sliders that present the status of Afghanistan nation-building development projects [64]. In another example, the Minnesota Employment Explorer shows how mouse-hover provides details-on-demand, double-clicking an industry triggers a drill-down into that sector while an animated transition updates the display to show sub-industry trends [65].
This article is much more up to date than the article by Segel and Heer [5] which is already more than 7 years old now. The field has evolved substantially since then. Also, the article by Segel and Heer is not a comprehensive survey like this one. However it is a highly cited paper and makes a big contribution to narrative visualization.
There are other fields that study storytelling as well. In the next sections we describe the literature on storytelling in visualization. Our classification is presented in Table 1. An alternative classification is presented in Table 2. Figure 2 shows the visualization techniques used in storytelling for data visualization literature.

2. Related Work

Ma et al. [67] state that a story that is well paced exhibits deliberate control over the rate at which plot points occur. They present a selection of scientific storytelling visualizations from NASA related work and describes various examples.
The Scientific Visualization Studio (SVS) at NASA uses storytelling visualization to investigate observational data collected by instruments and sensors and make it more suitable for consumption by the public [68,69].
The science museum presents visualization to the public with complex and abstract geographic phenomena at extreme size scales for explanatory animations. The science museums provide further interpretation through labels, videos, and live demonstrations. See Figure 3 [67].
Storytelling enables the user to interact with geographic data such as the Earth’s climate or the collapse of a star by using a story model, such as story nodes or story transitions [53]. Ma et al. is based on previous scientific visualization work at NASA, based in the scientific research center and scientific museum and describe how visualization can be used to tell a good story, and tell it well. This is a topic that the scientific visualization research community paid little attention to at that time.
Tong et al. [70] published a storytelling visualization survey paper as a short paper in abridged form. It contains no image or paper summaries. This is a full-length, comprehensive, extended version of that survey. It is approximately double the length.

3. Authoring-Tools for Storytelling and Visualization

Authorship refers to writing or creating a book, article, or document, or the creator of a work of art according to The Oxford English dictionary [11], especially with reference to an author, creator or producer [12]. For our purposes, we will adopt a definition of author described by Rodgers [13], “An author is best described as an individual solely responsible for the creation of a unique body of work”. Hullman [14] et al. state, “Story creation involves sequential processes of context definition, information selection, modality selection, and choosing an order to effectively convey the intended narrative”.
An author is best described as an individual solely responsible for the creation of a unique body of work [13]. Presenting the findings of a qualitative study of undergraduate writers at The City University of New York, Hullman explores student perspectives on models of authorship, the relationships between these models and student experiences of authorship in different writing situations, and proposes the importance of distinguishing between the multiple models and definitions of authorship and the rhetorical contexts associated with each [13]. Rodger develops a qualitative study of 800 students on the definition of authorship and their rhetorical contexts over a one-hour interview. Students defined authors as “[people] who see writing as being beyond a hobby”, and as a term that should be applied only to those individuals for whom writing is “something he or she has to do”, “a career”, or “an act that will lead to something being published”.
All papers in this section focus on authoring-tools for storytelling. Wohlfart [19] creates new volume visualization stories for medical applications. Gershon [16] and Cruz [18] present general storytelling for information visualization. Kuhn [27], Lee [22] and Plowman [71] all develop unique creator tools for storytelling visualization.
It is important to note that our survey is not simply a list of papers. Individual papers are summarized according to a special methodology [72]. This process connects related papers together such that the connections and relationship to previously published literature is made clear.

3.1. Authoring-Tools for Linear Storytelling

The literature in this sub-section focus on visual designs for authoring in a linear style that is prescribed, automatic, or semi-automatic (as opposed to interactive) or decided by the users. In other words, creators are provided with assets to formulate a linear story.
Gershon and Page state that storytelling enables visualization to reveal information as effectively and intuitively as if the viewer were watching a movie [16]. They introduce the concept of storytelling and presents advantages of storytelling.
One example presents a situation in which a number of enemy positions surround a school with children trapped inside as de facto hostages as the crossfire fills the space overhead and both sides move toward confrontation. Gershon and Page is based on previous work of Denning [73] and explain the usage of storytelling in information visualization.
Lu and Shen propose an approach to reduce the number of time steps that users required in order to visualize and understand the essential data features by selecting representative datasets. They design a flexible framework for quantifying data differences using multiple dissimilarity matrices [17]. A new visualization approach that filters data analysis results, which is achieved by measuring the degree of data similarity/difference and selecting important datasets that contain essential data features [17]. See Figure 4.
They interactively select representative datasets that include a significant portion of features of scientific data, whose data distribution requires more analysis than time sequence, reduces the amount of data to necessarily visualize and still keeps the essential data information. This can be used to improve the efficiency of time-varying data visualization [17].
An interactive storyboard is used to visualize and explore the overall content of time-varying datasets through composing an appropriate amount of information that can be efficiently understood by users [17].
Lu and Shen [17] is based on the previous work of time-vary visualization [74] and design a general method for comparing data dissimilarities. They do not require a dense sampling frequency to capture the object evolution and their work is not limited to specific feature models, such as geometry or interval volumes, and their attribute designs.
Storytelling, in the context of this article, deals with the core of information visualization by extracting relevant knowledge and enhancing its cognition [18]. Cruz et al. present generative storytelling as a conceptual framework for information storytelling. They create stories from data fabulas using computer graphics as a narrative medium. Data fabulas are a set of time-ordered events caused or experienced by actors [18].
A story is formed by characters. It involves the representation of the fabula’s actors and the definition of a temporal structure. The engine transforming a fabula into story consists of two models. The event model creates a story timeline and an action model creates a set of actors behaviours. For example an empire’s decline visualizing western empire’s decline in the 19th and 20th centuries. See Figure 5.
Cruz et al. is based on previous work of narrative theory [75] and presents generative storytelling as a conceptual framework for information storytelling.

3.2. Authoring-Tools for User-Directed and Interactive Storytelling

A large body of research has been carried out for authors wishing to create their own user-oriented or interactive stories. This literature focuses on interactive, user-driven authorship (as opposed to automatic or semi-automatic authorship). Storytelling is a relatively new form of interactive volume visualization presentation [19]. Wohlfart explores the usefulness of storytelling in the context of volume visualization. He presents a story telling model and divides the concept of volumetric storytelling into story authoring and storytelling constituents. He presents a volumetric storytelling prototype application, which is based on the RTVR (real time volume redering) Java library [76] for interactive volume rendering. See Figure 1. The storytelling model contains a range of hierarchy levels, in top-down order, which are: story node, story transitions, story action group, story action atoms. See Figure 1. The story nodes form the corner marks of the story and store the state of the whole scene. Story nodes are connected by story transitions, each consisting of one or multiple story action groups. Each story action group stores the scene changes relative to its preceding action group (or story node) [19,20].
The story authoring process contains two steps: a story recording process and a story editing process. The outcome of this recording process is a raw prototype of a story told through volume visualization. In the story editing step, this raw story is refined until the final story outline is reached [19,20].
This process presents a volume visualization following the storytelling model. And the key feature is interaction, including viewing interaction, representing interaction and data interaction [19,20]. Wohlfart and Hauser also discuss the paradoxical integration of storytelling and interaction, also called the narrative paradox [20].
Figure 1 shows an image sequence taken from a sample linear volumetric story visualized with their prototype. The distinct story nodes refer to the key events in the story, which provide an overview first, then details on specific features in the dataset, and at the end a conclusion made by the story author. The necessary story transitions are represented as orange arrows from one story node to the next and are animated in the prototype application. The story consumer may take over some story parameters (e.g., camera angle) already during playback or at the end of the story to further investigate the dataset [19,20].
This story guides the observers through the visualization, puts the contained visual representations into context with each other and finally introduces them to important features in the data [20]. See Figure 6. Wohlfart is based on previous work of volume visualization [77,78,79] and interactive visualization [80] and combine these concepts together to develop a storytelling model for volume visualization.
Geological storytelling is a novel graphical approach for capturing and visualizing the reasoning process that leads to a geological model [3,21]. Lidal et al. present a sketch-based interface for rapid modelling and exploration of various geological scenarios. The authors present a concept that handles sketching processed over time and a novel approach for externalizing the mental reasoning process. The process can be presented and evaluated [3,21]. The geological storytelling model contains three main parts. See Figure 7.
The canvas is a sketch-based interface where the geologist can draw the geological story on a 2D seismic slice backdrop, utilizing a pen and paper interaction style. The StoryTree is a tree graph representation of all the geological stories, each with its own subtree of story nodes. Individual story nodes can be selected for editing in the canvas. One or more complete story trees can be selected for playback or comparative visualization in the InspectView. The InspectView serves two purposes. First, it is a view where a story can be played and evaluated. In addition, multiple stories can be played synchronized for a side-by-side visual comparison.
The data-based story is recorded in SketchStory as a sequence of charts in XML files. The charts are linked with specific sketch gestures. The presenter draws an example icon and then draws a sketch gesture for chart invocation. Sketchstory recognizes the gesture and creates the corresponding chart. Lee et al. is based on previous work for storytelling of information visualization [5,16] and sketch-based interaction [81], and develops the SketchStory system to enhance storytelling in a presentation.
Lidal et al. is based on a previous storytelling model [19] for scientific visualization [67] and develops a storytelling model for geological visualization.
Lee et al. present SketchStory, a data-enabled digital white board to support real-time storytelling. It enables the presenter to stay focused on a story and interact with charts created during presentation. See Figure 8 [22].
Storytelling is one of the most impactful ways to teach, learn, and persuade [23]. Lundblad and Jern present geovisual analytics software with integrated storytelling. It can be applied to large spatial-temporal and multivariate data through dynamic visual user interfaces.
Using a scatter plot matrix gives the analyst a good overview of all correlations between the selected indicators. The analyst can use the scatter plot matrix as an overview and then steer the scatter plot for interesting detailed combinations over time. See Figure 9 [23]. The distribution plot presents a special visualization technique that displays the variation within individual European countries [23]. The Motala River map is visualized for different stories divided into different layers, such as a glyph layer, stream layer, polygon layer and background map layer. It shows the local and total water flow, and water path from source to ocean [23].
Lundblad and Jern is based on the previous work of the storytelling concept [16] and work of web-based geovisual tools, integrates storytelling with geovisual analytics software.

3.3. Authoring-Tools for Parallel Storytelling
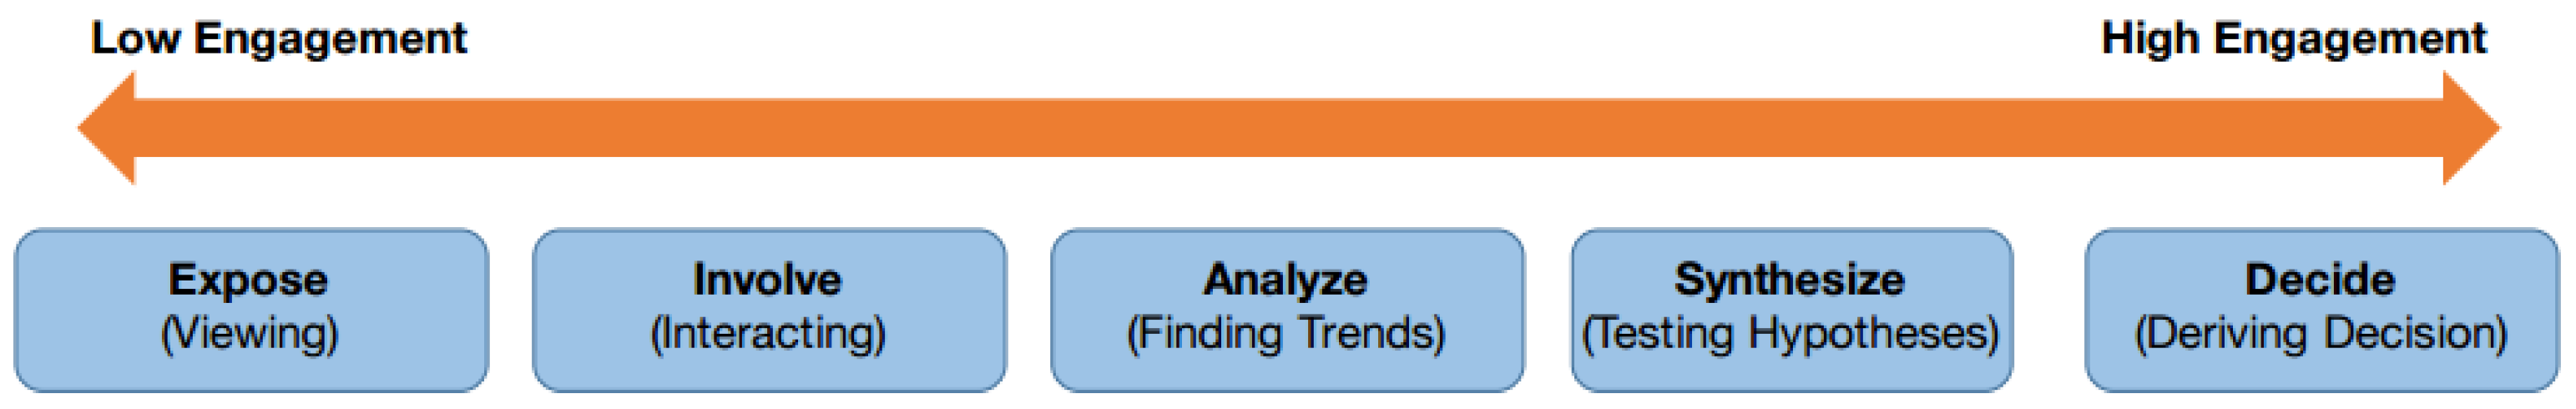
In this category of literature, authors create stories in parallel. In other words there may be multiple authors working in parallel i.e., simultaneously for the final outcome. This is opposed to a single author as in the previous subsection.
GeoTime events are recorded in x, y, t, coordinate space. This is used in observation analysis and can make a major contribution to a storytelling model. Eccles et al. presents the GeoTime stories prototype that combines a geo-spatial map with narrative events to produce a story framework. See Figure 10 [26]. This system provides functions for simple pattern detection in simultaneous movement activity. These functions look at possible interactions between people within the narrative, the speed at which they travel, and the type of location that they visit. Narrative text authoring enables the analyst to create and present stories found within the data. The story window displays this data as well as discovered patterns. The system enables multiple stories to connect together if they follow a linear flow. Also simultaneous narratives can be shown in a single image for a direct comparison.
This system uses a similar approach to Sense.us [82]. Instead of using a blog-type discussion workflow for adding text, Geotime is designed for authoring a single story and annotations are integrated into the data itself.
The CodeTimeline visualization by Kuhn and Stocker [27] enables developers who are new to a team to understand the history of the system they are working on. Designed to show a development team’s tribal memory, the software offers a partial replacement for exhaustive documentation. See Figure 11.
A collaboration view presents visualizes code ownership and historical patterns in collaboration. A sourcecloud flow view presents a word cloud of added and removed vocabulary between software releases. Lifetime events can be added by users as a frame of reference in each of the visualizations. This method of linking also enables new users to learn more about the history of the software development. These events can be include anything from email threads to pictures of the team during work.
Prior to Kuhn and Stocker, Ogawa [83,84] presents “software evolution storylines” and “Code Swarm”, which focus on the interactions between developers on projects but do not focus on telling a story about the software history. Codebook, a concept presented by Begel et al. [85], outlines a social network that connects software engineers with their shared code base. It encourages interaction with their code and others, enabling a broader understanding of the project they share with other developers.

4. User Engagement

The literature in this category addresses an important but less developed research topic, namely user engagement. In other words, who do we engage with storytelling and how can we engage an audience?
Mahyar et al. [31] address how prior research in different domains define and measure user engagement. They discuss existing frameworks for engagement from other related fields and propose a taxonomy based on previous frameworks for information visualization.
They present five levels of user engagement in information visualization. See Figure 12.
  • Expose (Viewing): the user understands how to read and interact with the data.
  • Involve (Interacting): the user interacts with the visualization and manipulates the data.
  • Analyze (Finding trend): the user analyze the data, finds trends, and outliers.
  • Synthesize (Testing Hypotheses): the user is able to form and evaluate hypotheses.
  • Decide (Deriving Decisions): the user is able to make decisions and draw conclusions based on evaluations of different hypotheses.
Their work is based on previous work of Bloom’s taxonomy [86] and adapts it to information visualization.

4.1. User Engagement for User-Directed Visualization

The literature in this subsection focuses on interactive, user-driven visualization for user engagement. Engagement specifically focuses on each user’s investment in the exploration of a visualization [29]. Boy et al. use low-level user interaction e.g., the number of interactions with a visualization that impact the display to quantify user engagement. They present the results of three web-based field experiments, and evaluate the impact of using initial narrative visualization techniques and storytelling on user-engagement with exploratory information visualizations. The main contribution of their work include: the design of three web-based experiments on user-engagement information visualizations. They hypothesize narrative elements should effectively engage the user in exploration of data and analysis the result. They conclude that storytelling does not help engage users in visualizing their experiments.
Boy et al is based on previous work on narrative visualization [37] and user-centred metrics [87]. The negative outcome of their study clearly indicates that more future work is needed to investigate whether or not storytelling increases user engagement.

5. Narrative Visualization and Storytelling

Narrative structures include events and visualization of characters. An example narrative can be a simple interface that presents trends in keywords over time [43]. Narrative visuals contain the transition between events. It involves “using a tool to visually analyze data and to generate visualizations via vector graphics or images for presentation” to decide “how to thread the representations into a compelling yet understandable sequence” [14]. Plowman et al. [26,71] report that a narrative specifically refers to the macro-structure of a document in contrast to the term story which refers to both structure and content. This structuring of evidence, combined with the choice of appropriate rhetorical strategies, is referred to as “the art of storytelling” among literary scholars [71]. Research in narrative visualization points to visualization features that afford storytelling including guided emphasis and structures for reader-driven storytelling. It also includes the principles that govern effective structuring of transitions between consecutive visualizations in narrative presentations, and how different tactics for sequencing visualizations are combined into global strategies in formats like slideshow presentations. We separate transitions into their own section, Section 5 and Section 6, because of their importance.
A narrative can be seen as a macro-structure which creates global coherence, contributes to local coherence and aids recall through its network of causal links and signposting [71]. The focus of Plowman et al.’s research is how students make sense of their learning with multimedia by constructing their own narratives in conjunction with the narrative guidance [71]. The design elements presented by the software constitute narrative guidance and can be a combination of features specific to interactive media, such as the need for clear navigational procedures, with features associated with traditional media, such as recognizable narrative and a clear relationship between tasks and the macro-narrative.
Plowman et al have developed three versions of Galapagos as a research tool, based on extended observation of students using commercially available CD-ROMs in schools [71].
The linear version is designed in such a way that students are led through the eight sections of the CD-ROM in sequence and it is closest to a traditional narrative as presented in educational television. The linear version presents a high degree of narrative guidance and little opportunity for learners to decide their own narrative path so they have relatively little control. The resource-based version offers no guidance through the CD-ROM sections and leaves students to define their own route. There is very little narrative guidance offered and learners have to construct a narrative by making decisions about sequence, so there is a high degree of user control and heavy use of the menu to decide the route. The guided discovery (GDL) version offers guidance in breaking down the task by providing paths through the material, questions to stimulate enquiries, and direction to specific resources. The GDL version was designed to offer a balance between narrative guidance and support for narrative construction and this is reflected in a more even balance between user and system control. Learners are able to determine sequence and their course of action but are offered guidance in doing so. Most sections (seven) are accessed by the GDL users because the guide encourages them to be interactive in their approach and to use the material to support their response.
All papers in this section develop methods or structure on how to improve narrative storytelling visualization. Viegas et al. [36] present methods for improving data memorability. Fisher et al. [43] present ways for tracking narrative events over time. Segal and Heer [5] investigate the design of narrative visualizations and identify techniques for telling stories with data. Hullman et al. [14,32,37] design the structure of a visualization to present storytelling. Figueiras [28,38] studies how to incorporate narrative elements as storytelling elements. Again, these papers may cover more than one topic in Table 1. The borders between categories are not 100% black & white. We place papers in the category reflective their main focus.
An overview of the visualization methods used in storytelling for visualization can be found in Figure 2. We include it in the section on narrative visualization since this is where the most research has been done. We can observe that most of the visualization designs used are familiar.

5.1. Narrative Visualization for Linear Storytelling

The literature in this sub-section focus on narrative visualization using linear automatic or semi-automatic approaches (as opposed to interactive approaches). The research here involves tools and techniques with an emphasis on how stories are created.
Hullman et al. describe a system called contextifier, which automatically produces custom, annotated visualizations from a given article [32]. The system architecture contains four main sections. A news corpus consists of a large set of news articles. A query generator identifies the most-relevant company in the article. An annotation selection engine integrates selected features into an annotation. And the graph generator generates line graphs using annotations and series. The flow of information can be seen in Figure 13 [32].
Hullman et al. is based on previous work in storytelling in visualization [5] and Kandogan’s automatic annotation analytics [63]. It develops a system that can automatically generate custom, annotated visualization from a news article of company. Hullman’s work places more emphasis on providing background information or perspective on the data than Kandogan’s [63].
Hullman et al. [14] outline how automatic sequencing (the order in which to present visualizations) can be approached in designing systems to help non-designers navigate structuring decisions in creating narrative visualizations. Their focus is on how linear, slideshow-style presentation can be optimized using knowledge of sequencing styles and strategies by incorporation.
Hullman et al. argue that analysts using narrated data presentations could be aided by tools for identifying effective sequences for visualizations. They conduct a qualitative analysis of the structural aspects of 42 examples of explicitly-guided professional narrative visualizations. One example is shown in Figure 13. They propose a graph-driven approach for finding effective sequences for narrative visualizations informed by their analysis, including defining data attributes for transitions, labelling, and maintaining consistency. The result suggests a need for more sophisticated global constraints than simply summing local transition costs to determine the best path through a graph of weighted visualization transitions. This paper is based on previous work of narrative sequencing [88] and narrative visualization [5,37], and demonstrates that narrative sequencing can be systematically approached in visualization systems.
Amini et al. [34] identify the high-level narrative structures found in professionally created data videos and identify their key components. They derive broader implications for the design of an authoring tool to enable a wide audience to create data videos. Amini et al perform two studies to enhance understanding data videos. They conduct a qualitative analysis of 50 data videos from 8 reputable online sources, and observe that data video categories are also hierarchical and can be further decomposed into units: sequences that put forward different points contributing to a single category. They design a series of workshops to observe how professional storytellers create data video storyboards. They observe the creation process is non-linear and iterative. Amini et al. is based on previous work on storytelling [16] and storytelling in information visualization [32].
Bach et al. [35] develop graph comics for data-driven storytelling to present and explain temporal changes in networks to an audience. Bach et al. present six steps to guide graph comics design. See Figure 14.
They first collect diagrams, comic literature, and pictures within comics to understand traditional comics structure. The second step is to find possible visual encodings that can represent graph objects, their properties, and the possible changes which they may undergo. They design principles that define when certain visual marks and their attributes can be used and when not. They exploit their design challenges and the structural principles to create comics. They contact two domain experts to collect external feedback and present a qualitative study to check if graphics comics are readable by a wider audience. Bach et al. is based on previous work on network exploration [89] and data-driven storytelling [16].

5.2. Narrative Visualization for User-Directed and Interactive Storytelling

The literature in this subsection focuses on interactive, user-driven narrative visualization (as opposed to automatic or semi-automatic). In other words, the papers focus on techniques that enable users to create narratives interactively. Viegas et al. summarize two methods of visualizing email archives with the aim of improving memorability of the data. Both focus on the higher level patterns of the user’s email habits. The original goal was for these visualizations to uncover social patterns in the archive, but the resulting visualizations caused the user to be more reflective of the data as opposed to analytic. They look at data points and want to recall the story behind it, even share the visualization with friends. See Figure 15 [36].
For visualizing email activity, the two axes stand for time, and the dyadic relationship between user account holder and each human interaction. Pattern recognition includes interaction frequency, interaction rhythm, interaction balance, and archive size. The visualization interface includes two main panels; the calendar panel, showing email intensity, and the contacts panel, showing the names of the people being interacted with. When the user clicks on a day square in the calendar panel, the contact panel highlights the names of the people communicated with that day. A name can be clicked on in the contacts panel and each day where that person had corresponded will be highlighted in the calendar panel. The contact panel can be viewed as an animation transitioning through the year of data. The email header data is used to derive the social context of the communication. Five different relationship types are classified. This can be either directly between correspondents or through mutual recipients in group emails. The Social Network visualization looks at each message and evaluates the role of the user (through the email address used i.e., work, school or personal) and makes connections regarding the interaction accordingly. This data is visualized as an animation that evolves over time. Each second represents one day in the archive. A clustered word cloud is used to display the data. Previous visualizations of online social interaction data have been focused on unravelling the data from the researchers’ perspective, whereas these visualizations are for the benefit of the user [90,91].
Hullman and Diakopoulos state that narrative information visualizations are a style of visualization that often explores the interplay between aspects of both exploratory and communicative visualization [37]. This work contributes to information visualization design and theory by providing insight into the types and forms of given rhetorical techniques in narrative visualizations, and the interaction between those techniques and individual and community characteristics of end users. The authors study how rhetorical techniques are used in visualization. They then investigate the resulting effects of these techniques on user interpretation [37]. The authors collect 51 professional narrative visualizations e.g., from the New York Times and BBC. Each visualization is “coded” using theory form semitics, statistics, decision theory, and media and communication studies. The visualizations are categorized according to a selection of rhetorics information access, provenance rhetoric, mapping rhetoric, procedural rhetoric, and linguistic rhetoric. Their work provides a taxonomy of specific information presentation manipulations used in narrative visualization. See Figure 16.
In the mapping America visualization example, The United Stated Census represents a nation wide attempt to provide an objective view of the demographic of the country. Ethnic group is mapped to color, samples are shown on a map and a single ellipse represents 200 people [92]. The poll visualization summarizes the accuracy of political poll predictions from several years and polling agencies in a small multiplies presentation of vertical line graph [93]. Colored bars representing the political parties are drawn to connect data points positioned on the y-axis according to the amount of time prior to the election and on the x-axis according to whether the predictions fell over (to the right) or under (to the left) a centred vertical line representing complete accuracy (or error of zero).
Hullman and Diakopoulos is based on the previous work of Segel and Heer [82] which makes an initial step towards highlighting how varying degrees of authorial intention and user interaction are achieved by general design components in narrative visualization. This work examines the design and end-user interpretation of narrative visualizations in order to deepen understanding of how common design techniques represent rhetorical strategies that make certain interpretations more probable.
A visualization with a narrative is set apart from a visualization without through both its structure and its content. A narrative-based visualization attempts to create a natural flow whereby the data has an obvious progression and therefore permits easier understanding and memorability [38].
Figueiras takes professionally produced visualizations as case studies to analyze how to incorporate narrative elements as storytelling elements. By presenting prototypes of storytelling in selected case studies, Figueiras presents a design study and model for narrative visualization by using storytelling techniques [38].
In the “How many households are like yours”, users can choose the primary residents and secondary members of a household, then get the number and percentage of households. Figueiras [38] introduces short stories describing different kinds of families instead of having only one article about types of families. This technique engages the user with a focus on creating empathy.
“What does China censor online?” is a tag cloud that only has a title and text shaped on a map of China. Figueiras [38] introduce a tooltips pop up when a user clicks on one region, which provides more detailed information. See Figure 17. Tooltips provide additional context in the form of text which help explain the possible reasons for censorship.
“Death Penalty Statics, Country by Country” figure is a static visualization with different size of bubbles representing the number of death sentence rulings. Figueiras [38] designs an interaction such that when a user chooses a year, a graph displays the number of death sentences handed out that year, which provides extra temporal information and a redesign into a story.
The following Narrative Strategies are described:
  • Context: Providing context to a visualization enables the user to make sense of the data using additional information. Without a sufficient amount of context, less meaning can be derived from the data, whereas the addition of context gives the user more information to explore the data and begin to understand features found within it. This is made easier by the development of interactive visualizations and the ability for users to choose what layers of information they see.
  • Empathy: Although not often associated with information visualization, it has been found that emotive/empathetic visualizations are more memorable and more enjoyable for the user [94].
  • Time Narrative: Utilizing the temporal nature of data in visualization allows users to mentally map the data by adding a sense of story flow. This improves user memorability and aids in the understanding of the data [94].
Figueiras is based on previous work of storytelling [5,37,67] and narrative visualization [43], and develops a model to add storytelling in narrative visualization [38].
Storytelling aims to simplify concepts, create emotional connection, and provides capacity to help retain information [28]. Figueiras presents the results of a focus group study on collecting information on narrative elements. She then suggests strategies for storytelling in visualization [28].
Sixteen participants are asked to study 11 information visualizations of different types and different characteristics (interactive, non-interactive, introductory text, accompanying article, and audio narration). Then they are asked to rate visualizations in terms of comprehension, navigation, and likability. See Figure 18. The participants give high scores to all visualizations, particularly to interactive visualizations. The study suggests that a good storytelling visualization is well-structured and interactive with audience preferences. The results of the user study suggest that interactivity, the option of drilling-down, context, and a sense of relatability and importance for users to feel engaged.
Figueiras is based on previous work of narrative visualization [5], and storytelling visualization [67,94]. The author uses a focus group to examine storytelling effects in information visualization and storytelling visualization.
Nguyen et al. [39] develop a new timeline visualization, SchemaLine, to gather, represent, and analyze information. They then use a preliminary study to evaluate its effectiveness. See Figure 19.
The system contribution includes: a visual design for an interactive timeline that groups notes into schema determined by the analyst; an algorithm to automatically generate a compact and aesthetically pleasing visualization of these schema on the timeline; and a set of fluid interactions with the timeline to support the sensemaking activities defined in the Data-Frame model. Their work is based on previous work of timeline visualization [48,67] and sensemarking with timeline [95].

5.3. Narrative Visualization for Storytelling in Parallel

In this category of literature, the structure of events is layed out in parallel. The research here focuses on tools and techniques that create multiple narratives at once, in other words simultaneously. These can be useful for groups.
Information visualization systems enable users to find patterns, relationships, and structures in data which may help users gain knowledge or confirm hypotheses [42]. The most basic element in a narrative is a character. An event occurs through the interaction of a set of characters. In this paradigm, a scene consists of a chunk of events, a story consists of a sequence of scenes, and a world model is made up of a set of stories. Akaishi et al. propose several methods for visualization of chronological data based on the narrative structure of a document [42]. Akaishi et al. map each narrative component (world model, story, scene, event, character onto elements of a document, set of stories, sequence of scenes, part of sentence, sets of terms). The system features a decomposition unit and a composition unit. A set of stories is stored in a database by the decomposition unit. In the database, each story is divided into scenes, forming a world model. Appropriate scenes are selected and used by the composition unit to compose a new story. When a user accesses the information, the software provides the results as a story. The story is presented in various ways.
The dependency relationship among terms forms a directed graph, called a Word Colony. In a Word Colony, interdependent terms are embedded into the same node. The strength of term dependence is mapped onto the distance between nodes of terms, and term attractiveness is mapped onto the size of node. To visualize this relationship, Akaishi et al. use a spring model graph, which is a visual overview of a document. NANA represents the content of a document as a topic sequence and topic matrix. Topic sequence is regarded as the graphical plot of a document and topic matrix represents the relationships among several topic changes. Akaishi et al. support users’ efforts to find desired parts of documents and to guess the context (plot) of the document.
Narrative is a simple interface that straightforwardly presents trends in keywords over time [43]. Fisher et al. present narrative as a way of presenting temporally dynamic data. In this case, narratives help the user by tracking concepts found in news stories that change over time. Fisher et al. show how to piece together complex information and examine multiple variables, See Figure 20 [43].
The first step is based on a business analysis task to find trends and public relations. In this case study, the requirement is to find out how a topic has developed over time and to see the evolution of the latest and most interesting stories [43]. The system design includes data acquisition, temporal visualization, using other tools for correlation, understanding readership, and adding feature in narratives. The narratives project is based on Microsoft’s Live Labs which provides real time data acquisition. Temporal visualization enables us see how a small group of words evolves over time relative to one another. By analyzing the form of correspondence and understanding readership, additional features can be added into the narrative project [43]. Fisher et al. is based on previous work in topic detection and tracking [96,97], and temporal visualization [98], and presents narrative as a new technique in visualization [43].

5.4. Narrative Visualization Overviews

Segel and Heer state that storytelling is revealing stories with data and using visualization to function in place of written story [5]. The Oxford English Dictionary defines a narrative as “an account of a series of events, facts, etc., given in order and with the establishing of connections between them” [99]. Heer et al. investigate the design of narrative visualizations and identify techniques for telling stories with data graphics and challenges with the salient dimension of visual storytelling. They describe seven genres of narrative visualization: magazine style, annotated chart, partitioned poster, flow chart, comic strip, slide show, and video. See Figure 21. They also discuss directions for future reader-centric research [82].
In the New York Times visualization on steroid usage in sports, one larger image and line chart are combined with small images, line charts, and bar charts to illustrate the usage of steroids status over 30 years. The visualization incorporates visual highlighting and connecting elements leading viewing order [100]. The year is mapped to the x-axis, the amount of steroids is mapped to the y-axis, and different colors represent different players.
In the New York Times visualization on budget forecast, a progress bar is used to describe the accuracy of past White House budgets predictions [101]. The time is mapped to x-axis, and budget situation is mapped to the y-axis.
The Afghanistan nation-building development project example is a interactive geographic visualization with details on-demand sliders that present the status of Afghanistan nation-building development projects [64]. Opium cultivation is mapped to the color, and countries are shown on the map. Time can be changed from 2005 to 2009 by dragging the control bar.
The Gapminder visualization uses animated bubble charts to show possible detrimental effects on a person’s ability to follow trends [65]. Continent is mapped to color, region is mapped to each bubble, and size is mapped to bubble size, and position is mapped to average yearly income.
The Minnesota Employment Explorer shows how mouse-hover provides details-on-demand, double-clicking an industry triggers a drill-down into that sector while an animated transition updates the display to show sub-industry trends [102]. Color represents different industries, the x-axis represents the time, and the y-axis represents employment.
Segel and Heer is based on previous work of narrative structure, visual narratives, and storytelling with data visualization [82] and observes the storytelling potential of data visualization and drawn parallels to more traditional media. This paper identifies salient design dimensions, clarifies how narrative visualization differs from other storytelling forms and how these differences introduce both opportunities and pitfalls for its narrative potential.

6. Static Transitions in Storytelling for Visualization

A transition refers to the process or a period of changing from one state or condition to another according to the Oxford English Dictionary [103]. In the visualization literature, transitions may be the focus of visualization and include both dynamic and static which are alternatives of presenting visualization. Static visualizations are those that do not rely on animation. Transitions may be considered part of narrative storytelling. However, we designate the literature here in its own category to reflect the importance of transitions and to keep related literature on this topic together. Several research papers focus on the transitions in storytelling. This is why they are separated into a special group.
In this section, the visual designs of transitions is generally static. The authors focus on presenting the trend of data along timelines. Robertson et al. [46] evaluate three approaches of using bubble charts and attempts to discover which one works best for presentation and analysis. Tanahashi and Ma [48] presents a storyline visualization which consists of a series of lines, from left to right along the time-axis. Liu et al. [49] design a storyline visualization system, StoryFlow, to generate an aesthetically pleasing and legible storyline visualization. Ferreira et al. [45] propose a method of visualizing a large amount of taxi data consisting of both spatial and temporal dimensions.

6.1. Static Transitions for User-Directed and Interactive Storytelling

The literature in this subsection focuses on interactive user-driven transitions. The user creates static transitions interactively, i.e., using a process they have some control over (as opposed to automatically).
TaxiVis proposes a method of visualizing a large amount of taxi data consisting of both spatial and temporal dimensions. This approach examines trends over time as opposed to individual taxi trips, visualizing data from a day in length, up to a year. Seasonal events such as Thanksgiving and Christmas can be compared in a like-for-like fashion. See Figure 22 [45].
Time selection widget allows the user to change the time frame of the visualization. Maps server as the canvas for the visualization. A graph of the raw data with time plotted to the x-axis and frequency of taxi trips on the y-axis. To reduce clutter, a density heat map is used. This can either be as points on the map or averaging out the data within regions on the map.
Taxi behaviour is a popular focus of research. Among others, Veloso et al. explored patterns and trends in taxi ride data looking at the relationship between pick up and drop off points [104,105]. Liao et al. developed a visual analytics system to error check GPS data streamed from taxis [106].

6.2. Static Transitions for Parallel Storytelling

In this category of literature, the static transitions are shown in parallel. In other words, many transitions can occur simultaneously. Robertson et al. define a trend in data as an observed general tendency. The most common way to see a trend in data is to plot a variable’s change over time on a line chart or bar chart. If there is a general increase or decrease over time, this is perceived as a changing trend [46]. Robertson et al. propose two alternatives to animated bubble charts for visualizing trends in multiple dimensions and describes a user study that evaluates the three approaches for both presentation and analysis. In conclusion, Robertson et al. state that traces and small multiples work best for analysis [46].
The gapminder trendalyzer uses a bubble chart to show four dimensions of data, life expectancy is mapped to the x-axis, infant mortality is mapped to the y-axis, population is mapped to bubble size and continent is mapped to color [107].
An alternative multi-dimensional trend visualization provides the user with the ability to select particular bubbles such that the animation shows a trace line for the selected bubble as it progresses. See Figure 23 [108]. In a small multiples visualization, countries can be clustered based on position, size, and location. They are further grouped by continent and ordered alphabetically within each group [109]. Robertson et al. is based on earlier work by Tversky et al. [110] and Baudisch et al. [111]. Previous work is limited to small data set sizes (200 samples or less). Their work focuses on presentation rather than analysis and relies on animation to show trends over time.
Visual Storylines, by Chen et al. is designed to summarize video storylines in an image composition while preserving the style of the original videos [47]. Chen et al. present a new visual storylines method to assist viewers in understanding important video contents by revealing essential information about video story units and their relationships [47]. The first step of the algorithm is to extract the storylines from a video sequence by segmenting a video into multiple sets of shot sequences and determining their relationships. See Figure 24. The second step is to visualize a movie sequence in a new type of static visualization by using a multi-level visual storyline approach, which selects and synthesizes important story segments according to their relationships in a storyline.
Chen et al. is based on the work of video summarization [112] and first clusters video shots according to both visual and audio data to form semantic video segments.
Storyline visualization is a technique that portrays the temporal dynamics of social interactions by projecting the timeline of the interaction onto an axis [48]. Tanahashi and Ma present a storyline visualization which consists of a series of lines, from left to right along the time-axis, that converge and diverge in the course of their paths [48]. Algorithm overview is shown in Figure 25. The layout is based on a set of horizontal slots that divide the screen space along the y-axis. Each of these slots has the capacity to accommodate blocks of interaction sessions as long as they do not overlap in time [48]. Rearranging lines takes the slot-based layout of interaction sessions derived from a genome and determines the order of the line segments in each interaction session and its alignment in order to reduce unnecessary wiggles and crossovers [48]. In order to prevent such misleading effects, it is critical for the layout computation to include the removal of unnecessary white space to determine the final layout [48]. Tanahashi and Ma [48] is based on the idea of XKCD’s hand-drawn illusion “Movie Narrative Charts” [113] and develops an algorithm for general storyline visualization.
Storyline visualizations, aim to illustrate the dynamic relationships between entities in a story [49]. Liu et al. design a storyline visualization system, StoryFlow, to generate an aesthetically pleasing and legible storyline visualization. It supports real-time user interaction, hierarchical relationships among entities, and the rendering of a large number of entity lines [49]. The layout pipeline consists of four steps: relationship tree generation, session/line ordering, session/line alignment, and layout compaction. In the first step, StoryFlow creates a set of dynamic relationship trees for different time frames, in which the relationship trees are used to order sessions and entity lines. Next, sessions/lines between successive time frames are aligned to maximize the number of straight lines in the layout. Finally, a quadratic optimization algorithm is performed to obtain a compact storyline layout. See Figure 26 [49].
Liu et al. is based on previous work of Tanahashi et al. [48]. Liu et al. add support for real-time interaction, hierarchical relationships, and a large number of entity lines.

7. Animated Transitions in Storytelling for Visualization

Gonzalez and Cleotilde define animation as a series of varying images presented dynamically according to user actions, in ways that help the user to perceive a continuous change over time and develop a more appropriate mental model of the task [114]. The results of their study show that decision making performance is highly contingent on the properties of the animation user interface such as image realism, transition smoothness, and interactivity style, and also sensitive to the task domain and the user’s experience. Values of accuracy, time, ease of use, and enjoyability for the two types of images, transitions, and interactivity styles indicated that realistic images, gradual transitions, and parallel interactivity produced better decisions. Decision making accuracy, time, ease of use, and enjoyability in animated interfaces are influenced by the form of image representation, the transition effects, and the form of interactivity. This research supports the idea that to be an effective decision support tool, animation must be smooth, simple, interactive, and explicitly account for the appropriateness of the user’s mental model of the task. Gonzalez and Cleotilde review selected empirical investigations from the literature in education, psychology, and HCI which suggest that animation may make interfaces easier, more enjoyable and understandable, and study the effect of animation on decision making [115].

7.1. Animated Transitions for Linear Storytelling

The literature in this sub-section focuses on animated transitions using automatic, or semi-automatic approaches (as opposed to interactive techniques to animated transitions).
Heer and Robertson investigate the effectiveness of animated transitions in traditional statistical data graphs, such as bar charts, pie charts, and scatter plots. A visualisation framework called DynaVis is created to test the effectiveness of animation on the user’s preference and information retention. Graph animations are used to keep viewers engaged and to promote creative thinking about the data. See Figure 27 [50].
The software displays animated transitions of statistical data graphs. Sorting and filtering animation provide the user insight into the composition of the data. All transitions take place over a time frame rather than instantaneously so the user can see exactly how the visualisation has changed. Animations between different graph types are implemented by morphing the data from one shape and size to another. Statistically significant differences in user preference were found between static graphs and animated graphs. Animated transitions can improve graphical perception. This is reflected in the findings of the user experiments testing recall and understanding. However, not all transition scenarios are found to be significantly different.
Heer and Robertson is based on the previous work of Bederson and Boltman [52] but builds upon it by testing different transitional events.

7.2. Animated Transitions for User-Directed and Interactive Storytelling

The literature in this subsection focuses on interactive, user-driven transitions. The user or users create animated transitions interactively (as opposed to automatically as in the previous section). Bederson and Boltman examine how animating a viewpoint change in a spatial information system affects a user’s ability to build a mental map of the information in the space. Based on a user-study involving a spatial map of a family tree, animation is found to improve subjects’ ability to learn the spatial position of family members within the tree without a speed penalty [52].
Two different family trees of nine individuals are presented to two groups people with animation and without animation. The subjects were given three kinds of tasks; navigation of family trees, exploratory family trees, and reconstruction of family trees. The speed and accuracy of performance are recorded. In this experiment, there is a statistically significant improvement in accuracy of the reconstruction task over that of other tasks. Animation resulted in fewer task errors. See Figure 28.
Bederson and Boltman is based on Gonzalez [115] and Donskoy and Kaptelinin [116] which address the relationship between animation and users’ understanding. Compared to previous work, Bederson and Boltman focus on animation of the viewpoint. The design of the experiment is to change from a single in-between frame to several in-between frames.
Akiba et al. introduce an animation tool named: AniVis for scientific visualization exploration and communication. This tool can turn the results of data exploration and visualization into animation content and the users can create a complex animation sequence by combining several simple effects [53].
Parameter-space blending operator creates intermediate frames between two instances of frames I 1 and I 2 by interpolating their respective parameters. If I 1 and I 2 do not overlap in time, they generate intermediate frames by interpolating the parameters of the last frame of I 1 and the first frame of I 2 . Otherwise, they generate intermediate frames by interpolating the parameters of their corresponding frames [53].
An image-space blending operator creates the animation content between I 1 and I 2 by interpolating their respective image frames. Similarly to parameter-space blending, if I 1 and I 2 don’t overlap in time, they generate intermediate frames by blending the last frame of I 1 and the first frame of I 2 . The effect is that the last frame of I 1 gradually fades out as the first frame of I 2 gradually fades in. If I 1 and I 2 overlap, they generate intermediate frames by blending [53].
A playback operator lets users repeatedly loop through one or more consecutive instances of interest [53].
A MRI head data case study focuses on highlighting a brain tumor. The animation is comprised of four pieces of dynamic content. The first is a spatial overview that rotates the volume data 360 degrees along the y-axis. The second piece is a spatial exploration in which the user customizes the view. The third is a parameter-space blending between a spatial exploration and a slicing, which reveals a tumor’s inner structure. The parameter-space blending highlights a tumor by varying the opacity while zooming in on the region of interest. See Figure 29. A hurricane data case study has five components. The first is a caption showing the animation’s content, blended with a spatial exploration that zooms in on the data. The second piece is a temporal exploration to show early time steps. The third is a variable overview that browses through three data attributes: vapor, wind speed, and cloud. The fourth piece is a temporal exploration to show later time steps. The fifth is a spatial exploration that zooms in on the hurricane’s eye [53].
Akiba et al. is based on previous animation support [117] and an animation enhanced system [118] and develops template-based visualization tools for animation.
To explore the challenge of gradually moving from interest to insight, Nagel et al. [54] propose the term staged analysis. Invoking temporal and theatrical notions, they define staged analysis as a carefully choreographed process of breaking up a complex whole into its component parts and purposefully preparing the manner of their appearance. In the context of visualization, the concept of staging typically refers to animated transitions broken up to be more easily observed. They build on top of this notion of staging and extend it to a guided analysis process.
As we can see, the literature on transitions is spread amongst information and scientific visualization. Table 2 shows an alternative classification of the literature divided up into information, scientific, and geo-spatial visualization. We can see that most of the storytelling research focuses on information visualization.

8. Memorability for Storytelling and Visualization

Memory refers to the faculty by which things are remembered; the capacity for retaining, perpetuating, or reviving the thought of things past according to the Oxford English Dictionary [119]. Memorability is an important goal of storytelling. A good visualization technique engages the viewer’s attention and increases a story’s memorability [15].
All papers in this section evaluate the effects of visualization on memorability. Bateman et al. [15] explore the effects of embellishment on comprehension and memorability. Saket et al. [55] illustrate that map-based visualization can improve accuracy of recalled data comparing with node-link visualization.
Borkin et al. [66] develop an online memorability study using over 2000 static visualizations that cover a large variety of visualizations and determine which visualization types and attributes are more memorable. They investigate a domain at the interface between human cognition and visualization design.
A visualization taxonomy classifies static visualizations according to the underlying data structures, the visual encoding of the data, and the perceptual tasks enabled by these encodings. It features twelve main visualization categories and several popular sub-types for each category. Borkin et al. run memorability tests via Amazon’s Mechanical Turk with 261 participants and gather memorability scores. The result in memorability comparison test demonstrates that there is memorability consistency with scenes, faces, and also visualizations, thus memorability is a generic principle with possibly similar generic, abstract features. The result in visualization attribute tests illustrates that higher memorability scores were correlated with visualizations containing pictograms, more color, low data-to-ink ratios, and high visual densities.
Borkin et al. show that visualizations are intrinsically memorable with consistency across people. Visualizations with low data-to-ink ratios and high visual densities (i.e., more chart junk and “clutter”) were more memorable than minimal, “clean” visualizations [66].

8.1. Memorability for Linear Visualization

The literature here shows and tests visual designs in linear order. Users are asked to compare the visual designs (e.g., standard bar charts) verses embellished bar charts. In other words, users are tested on their ability to recall one visual design at a time in linear fashion.
Bateman et al. examine whether embellishment is useful for comprehension and memorability of charts. Bateman et al. compare plain and embellished charts, and conclude that a user’s accuracy in describing the embellished charts is no worse than for plain charts and that their recall after a two-to-three week gap is significantly better [15].
Fourteen embellished charts are selected from Nigel Holmes’ book Designer’s Guide to Creating Charts and Diagrams [120], and converted to plain charts. See Figure 30. Twenty participants are presented a chart on a slide, alternating between embellished and plain versions. Participants are required to perform two tasks (reading and describing task and recall task) after five-minutes and after 2–3 weeks. The eye-gaze and task performance of participants are recorded for analysis. This study shows that there is no significant difference between plain and embellished versions for interactive interpretation accuracy and recall accuracy after a five-minute gap, but after a long-term gap, recall of both topic and detail of chart (categories and trend) is significantly better for embellished charts. Participants saw the value in message more often in Holmes’ charts than in the plain charts.
Previous studies have suggested that minor decoration in charts may not hamper interpretation [121], and work in psychology has shown that the use of imagery can affect memorability [122], but there is very little work that looks at how chart imagery can affect the way people view information charts.
Borkin et al. [30] present the first study incorporating eye-tracking as well as cognitive experimental techniques to investigate which elements of visualizations facilitate subsequent recognition and recall. They design a three-phase experiment (See Figure 31) and evaluate the performance of recognition and recall. The conclusion includes visualizations with more memorable content can be memorable ‘at-a-glance’. Titles and text are key elements in a visualization and help recall the message. Pictograms do not hinder the memory or understanding of a visualization. Redundancy facilitates visualization recall and understanding.
Borkin et al. is based on previous work on perception and memorability of visualization [15] and eye-tracking evaluation visualization [123].

8.2. Memorability for Parallel Visualization

In this subsection, users are presented with a large number of relation data in parallel (as opposes to one at a time). Users are tested on their ability to process relationship data in parallel (all relationships simultaneously). This is distinct from memorability for linear visualization where recall focuses on one visual design at a time in linear order.
Saket et al. illustrate that different visualization designs can effect the recall accuracy of data being visualized. Compared to a node-link diagram, a map-based visual design is more effective [55].
Two datasets are examined. A book dataset (small) and LastFM dataset (large) are transformed into a node-link diagram and node-link group (map-based). See Figure 32. Three phrases are performed to examine the difference between node-link diagram and map-based visualization. In phase 1 participants examine two kinds of visual design without task with unlimited time. Phase 2 asks participant to study two kinds of visualization with six tasks in a required time. Phase 3 asks participants to recall what they read in phase 1 and 2, complete 6 tasks similar to phase 2, and 3 new addition tasks [55]. The result of the experiment illustrates that recalling map-based diagrams is more accurate than recalling node-link diagrams, but no faster. The participants spent more time on map-based visualizations than node-link visualizations [55].
Saket et al. is based on previous work of visualization memorability [15] and a recalling experiment [124].

9. Unsolved Problems and Conclusions

This survey provides a novel up-to-date overview of storytelling in visualization. The most important recent literature is included and discussed. Since storytelling in visualization is a recently new subject, we expect an increase in research in the coming years. Moreover we believe it will evolve into a popular topic in the field of visualization.
By reviewing Table 1 and Table 2, we can see storytelling visualization focuses on information visualization more than scientific visualization, which conveys that more challenges are left unsolved in this field. However, by refining a storytelling model for scientific visualization [20], the implementation of storytelling in scientific visualization could increase in the future. We can also see that storytelling in visualization concentrates more on exploration than on presentation. Like Kosara and Mackinlay [94] state: “visualization techniques address the exploration and analysis of data more than presenting data”.
In future work, there are many directions and unsolved problems. Storytelling will gain importance in data presentation and data exploration. Here is a summary of some unsolved problems in storytelling for visualization.
  • It is clear that objective measures of user-engagement is a relatively unexplored area of research. Can we derive a mature classification of user engagement activities? Is user engagement something we can clearly define?
  • Data preparation and enhancement: Virtually no one has addressed the challenge of data preparation and enhancement for storytelling. Moreover, is storytelling data best captured or derived from an existing data set or software system? Can a standard data file format be developed?
  • Narrative visualization for scientific and geo-spatial visualization: Why has there been such an imbalance of research narrative visualization for information visualization but virtually none for scientific and geo-spatial visualization.
  • Transitions for scientific visualization: The benefits of static transition versus dynamic transitions in visualization still remains relatively immature.
  • Memorability for visualization: What are the key elements for making a memorable visualization? This is still an immature research direction.
  • Animated transitions for geo-spatial visualization: Animated transitions for geo-spatial visualization remains an open research direction. This is surprising given the popularity and importance of geo-spatial visualization.
  • Interpretation for scientific information, and geo-spatial visualization: Currently no papers to our knowledge focus on the topic of effective interpretation of stories, this topic remains largely unexplored.
The classification of literature, we present makes it clear that many future research directions remain open in storytelling and visualization.

Acknowledgments

Thanks to Liam McNabb, Dylan Rees and Dave Greten for proofreading this paper. We also thank following for their valuable feedback: Kwan-Liu Ma, Helwig Hauser, Tom Kapler, Benjamin Bach, Narges Mahyar, Mirko Stocker, Ana Figueiras, Phong Nguyen, Danyel Fisher, Ben Bederson and Claudio Silva.

Author Contributions

Chao Tong and Robert S. Laramee conceived the idea and conducted an extensive literature search. Richard Roberts, Rita Borgo, Sean Walton, Kodzo Wegba, Aidong Lu, Yun Wang, Huamin Qu, Qiong Luo and Xiaojuan Ma contributed to the writing, proof-reading, and corrections to the survey.

Conflicts of Interest

The authors declare no conflict of interest.

References

  1. Goldberg, S. The Risks Of Storytelling. National Geographic Magazine, October 2015. [Google Scholar]
  2. Singer, A. Data Visualization: Your Secret Weapon in Storytelling and Persuasion. Available online: https://www.clickz.com/clickz/column/2378704/data-visualization/your-secret-weapon-in-storytelling-and-persuasion (accessed on 13 March 2018).
  3. Lidal, E.M.; Natali, M.; Patel, D.; Hauser, H.; Viola, I. Geological Storytelling. Comput. Graph. 2013, 37, 445–459. [Google Scholar] [CrossRef]
  4. Ward, M.O.; Grinstein, G.; Keim, D. Interactive Data Visualization: Foundations, Techniques, and Applications; CRC Press: Boca Raton, FL, USA, 2010. [Google Scholar]
  5. Segel, E.; Heer, J. Narrative Visualization: Telling Stories with Data. IEEE Trans. Vis. Comput. Graph. 2010, 16, 1139–1148. [Google Scholar] [CrossRef] [PubMed]
  6. Dictionary Reference. Available online: http://dictionary.reference.com/browse/story (accessed on 13 March 2018).
  7. Oxford English Dictionary. Available online: http://www.oed.com/view/Entry/190981?rskey=Wrp9f3&result=1 (accessed on 13 March 2018).
  8. Zipes, J. Creative Storytelling: Building Community/Changing Lives; Routledge: Abingdon, UK, 2013. [Google Scholar]
  9. Schell, J. The Art of Game Design: A Book of Lenses; Morgan Kaufmann Publishers Inc.: San Francisco, CA, USA, 2008. [Google Scholar]
  10. Lee, B.; Riche, N.H.; Isenberg, P.; Carpendale, S. More than Telling a Story: Transforming Data into Visually Shared Stories. IEEE Comput. Graph. Appl. 2015, 35, 84–90. [Google Scholar] [CrossRef] [PubMed]
  11. Oxford Dictionaries. Available online: http://www.oxforddictionaries.com/definition/english/authorship (accessed on 13 March 2018).
  12. The Free Dictionary. Available online: http://www.thefreedictionary.com/authorship (accessed on 13 March 2018).
  13. Rodgers, J. Defining and Experiencing Authorship (s) in the Composition Classroom: Findings from a Qualitative Study of Undergraduate Writing Students at the City University of New York. J. Basic Writ. 2011, 30, 130–155. [Google Scholar]
  14. Hullman, J.; Drucker, S.; Riche, N.H.; Lee, B.; Fisher, D.; Adar, E. A Deeper Understanding of Sequence in Narrative Visualization. IEEE Trans. Vis. Comput. Graph. 2013, 19, 2406–2415. [Google Scholar] [CrossRef] [PubMed]
  15. Bateman, S.; Mandryk, R.L.; Gutwin, C.; Genest, A.; McDine, D.; Brooks, C. Useful Junk: The Effects of Visual Embellishment on Comprehension and Memorability of Charts. In Proceedings of the SIGCHI Conference on Human Factors in Computing Systems, Atlanta, GA, USA, 10–15 April 2010; ACM: New York, NY, USA, 2010; pp. 2573–2582. [Google Scholar]
  16. Gershon, N.; Page, W. What Storytelling Can Do for Information Visualization. Commun. ACM 2001, 44, 31–37. [Google Scholar] [CrossRef]
  17. Lu, A.; Shen, H.W. Interactive storyboard for overall time-varying data visualization. In Proceedings of the IEEE Pacific Visualization Symposium (PacificVIS’08), Kyoto, Japan, 5–7 March 2008; pp. 143–150. [Google Scholar]
  18. Cruz, P.; Machado, P. Generative Storytelling for Information Visualization. IEEE Comput. Graph. Appl. 2011, 31, 80–85. [Google Scholar] [CrossRef] [PubMed]
  19. Wohlfahrt, M. Story Telling Aspects in Medical Applications; Central European Seminar on Computer Graphics: Vienna, Austria, 2006. [Google Scholar]
  20. Wohlfahrt, M.; Hauser, H. Story Telling for Presentation in Volume Visualization. In Proceedings of the 9th Joint Eurographics/IEEE VGTC Conference on Visualization, Norrköping, Sweden, 23–25 May 2007; Eurographics Association: Aire-la-Ville, Switzerland, 2007; pp. 91–98. [Google Scholar]
  21. Lidal, E.M.; Hauser, H.; Viola, I. Geological Storytelling: Graphically Exploring and Communicating Geological Sketches. In Proceedings of the International Symposium on Sketch-Based Interfaces and Modeling, Annecy, France, 4–6 June 2012; Eurographics Association: Aire-la-Ville, Switzerland, 2012; pp. 11–20. [Google Scholar]
  22. Lee, B.; Kazi, R.H.; Smith, G. SketchStory: Telling More Engaging Stories with Data through Freeform Sketching. IEEE Trans. Vis. Comput. Graph. 2013, 19, 2416–2425. [Google Scholar] [PubMed]
  23. Lundblad, P.; Jern, M. Geovisual Analytics and Storytelling Using HTML5. In Proceedings of the IEEE 17th International Conference Information Visualisation (IV), London, UK, 16–18 July 2013; pp. 263–271. [Google Scholar]
  24. Fulda, J.; Brehmel, M.; Munzner, T. TimeLineCurator: Interactive Authoring of Visual Timelines from Unstructured Text. IEEE Trans. Vis. Comput. Graph. 2016, 22, 300–309. [Google Scholar] [CrossRef] [PubMed]
  25. Amini, F.; Riche, N.H.; Lee, B.; Monroy-Hernandez, A.; Irani, P. Authoring Data-Driven Videos with DataClips. IEEE Trans. Vis. Comput. Graph. 2017, 23, 501–510. [Google Scholar] [CrossRef] [PubMed]
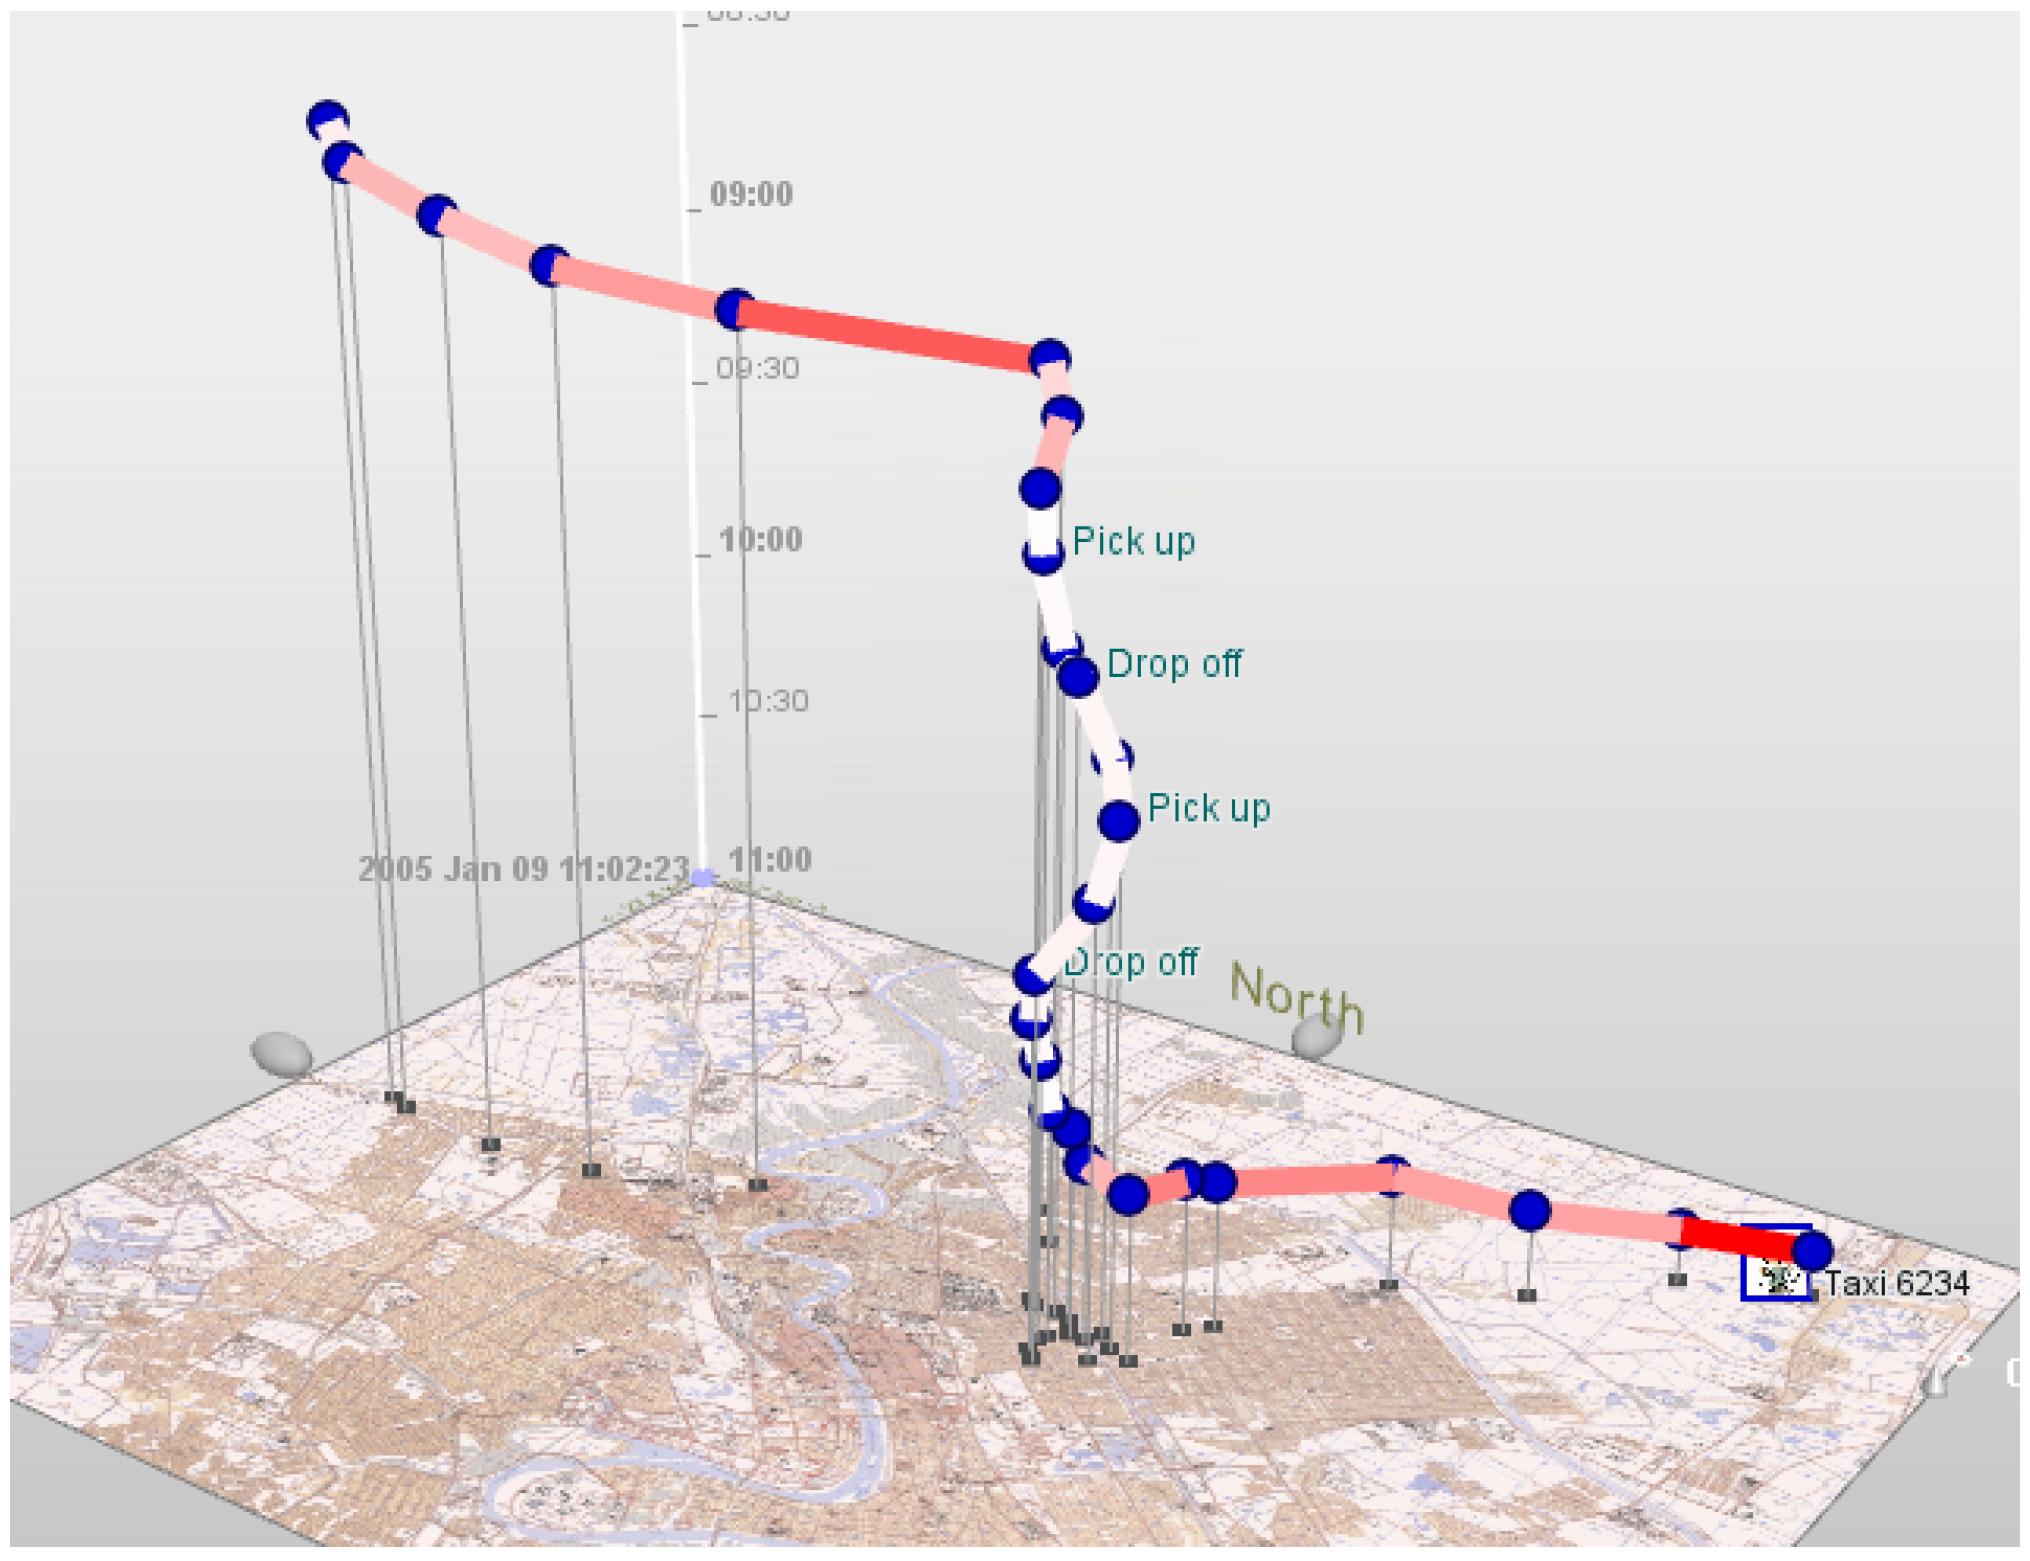
  26. Eccles, R.; Kapler, T.; Harper, R.; Wright, W. Stories in GeoTime. Inf. Vis. 2008, 7, 3–17. [Google Scholar] [CrossRef]
  27. Kuhn, A.; Stocker, M. CodeTimeline: Storytelling with versioning data. In Proceedings of the IEEE 34th International Conference on Software Engineering (ICSE), Zurich, Switzerland, 2–9 June 2012; pp. 1333–1336. [Google Scholar]
  28. Figueiras, A. How to Tell Stories Using Visualization. In Proceedings of the IEEE 18th International Conference on Information Visualisation (IV), Paris, France, 16–18 July 2014; p. 18. [Google Scholar]
  29. Boy, J.; Detienne, F.; Fekete, J.D. Can Initial Narrative VisualizationTechniques and Storytelling help Engage Online-Users with Exploratory Information Visualizations? In Proceedings of the CHI, Seoul, Korea, 18–23 April 2015. [Google Scholar]
  30. Borkin, M.A.; Bylinskii, Z.; Kim, N.W.; Bainbridge, C.M.; Yeh, C.S.; Borkin, D.; Pfister, H.; Oliva, A. Beyond Memorability: Visualization Recognition and Recall. IEEE Trans. Vis. Comput. Graph. 2016, 22, 519–528. [Google Scholar] [CrossRef] [PubMed]
  31. Mahyar, N.; Kim, S.H.; Kwon, B.C. Towards a Taxonomy for Evaluating User Engagement in Information Visualization. In Proceedings of the Workshop on Personal Visualization: Exploring Everyday Life, Chicago, IL, USA, October 2015; Volume 3. [Google Scholar]
  32. Hullman, J.; Diakopoulos, N.; Adar, E. Contextifier: Automatic Generation of Annotated Stock Visualizations. In Proceedings of the SIGCHI Conference on Human Factors in Computing Systems, Paris, France, 27 April–2 May 2013; ACM: New York, NY, USA, 2013; pp. 2707–2716. [Google Scholar]
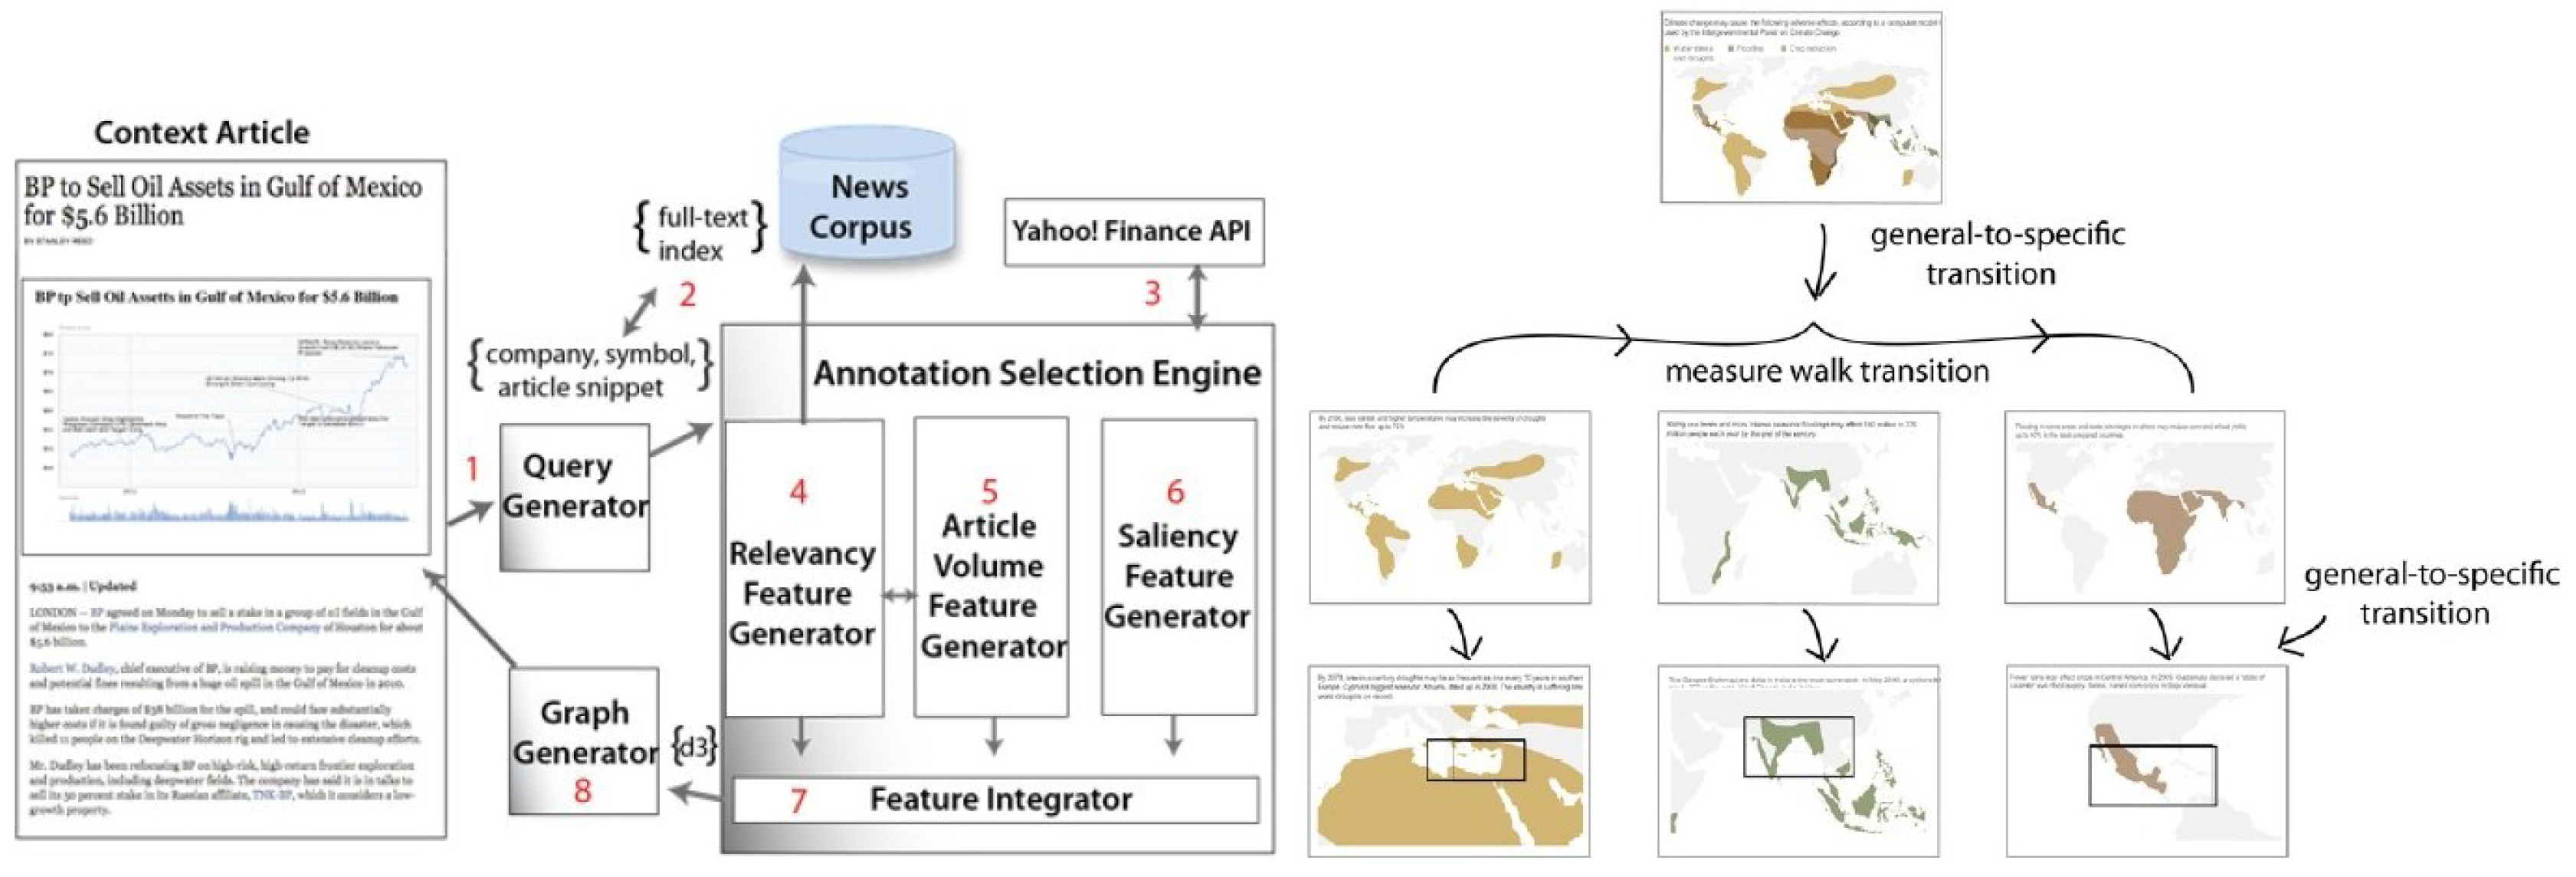
  33. Gao, T.; Hullman, J.R.; Adar, E.; Hecht, B.; Diakopoulos, N. NewsViews: An Automated Pipeline for Creating Custom Geovisualizations for News. In Proceedings of the 32nd Annual ACM Conference on Human Factors in Computing Systems, Toronto, ON, Canada, 26 April–1 May 2014; ACM: New York, NY, USA, 2014; pp. 3005–3014. [Google Scholar]
  34. Amini, F.; Henry Riche, N.; Lee, B.; Hurter, C.; Irani, P. Understanding Data Videos: Looking at Narrative Visualization through the Cinematography Lens. In Proceedings of the 33rd Annual ACM Conference on Human Factors in Computing Systems, Seoul, Korea, 18–23 April 2015; ACM: New York, NY, USA, 2015; pp. 1459–1468. [Google Scholar]
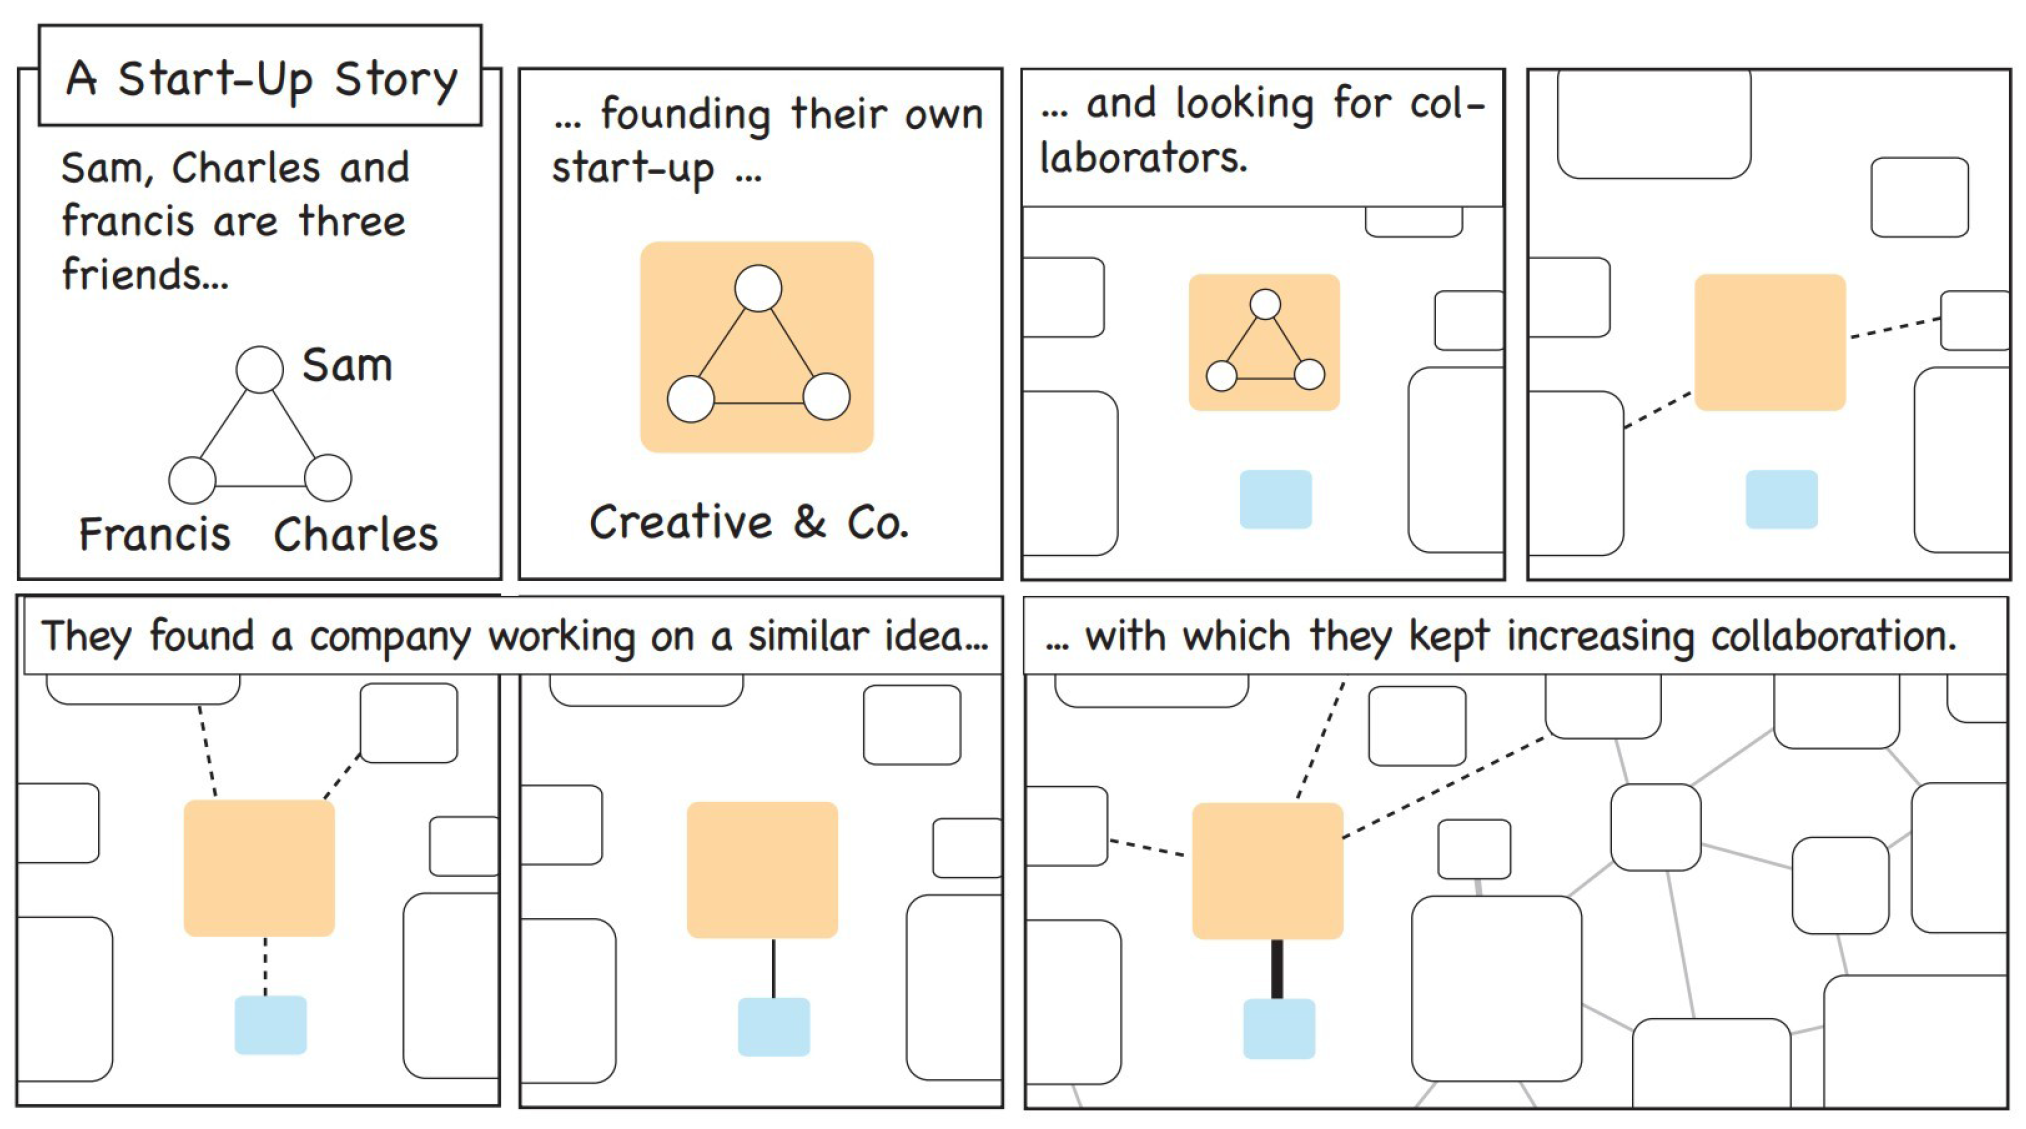
  35. Bach, B.; Kerracher, N.; Hall, K.W.; Carpendale, S.; Kennedy, J.; Riche, N.H. Telling Stories about Dynamic Networks with Graph Comics. In Proceedings of the Conference on Human Factors in Information Systems (CHI), San Jose, CA, USA, 7–12 May 2016; ACM: New York, NY, USA, 2016. [Google Scholar]
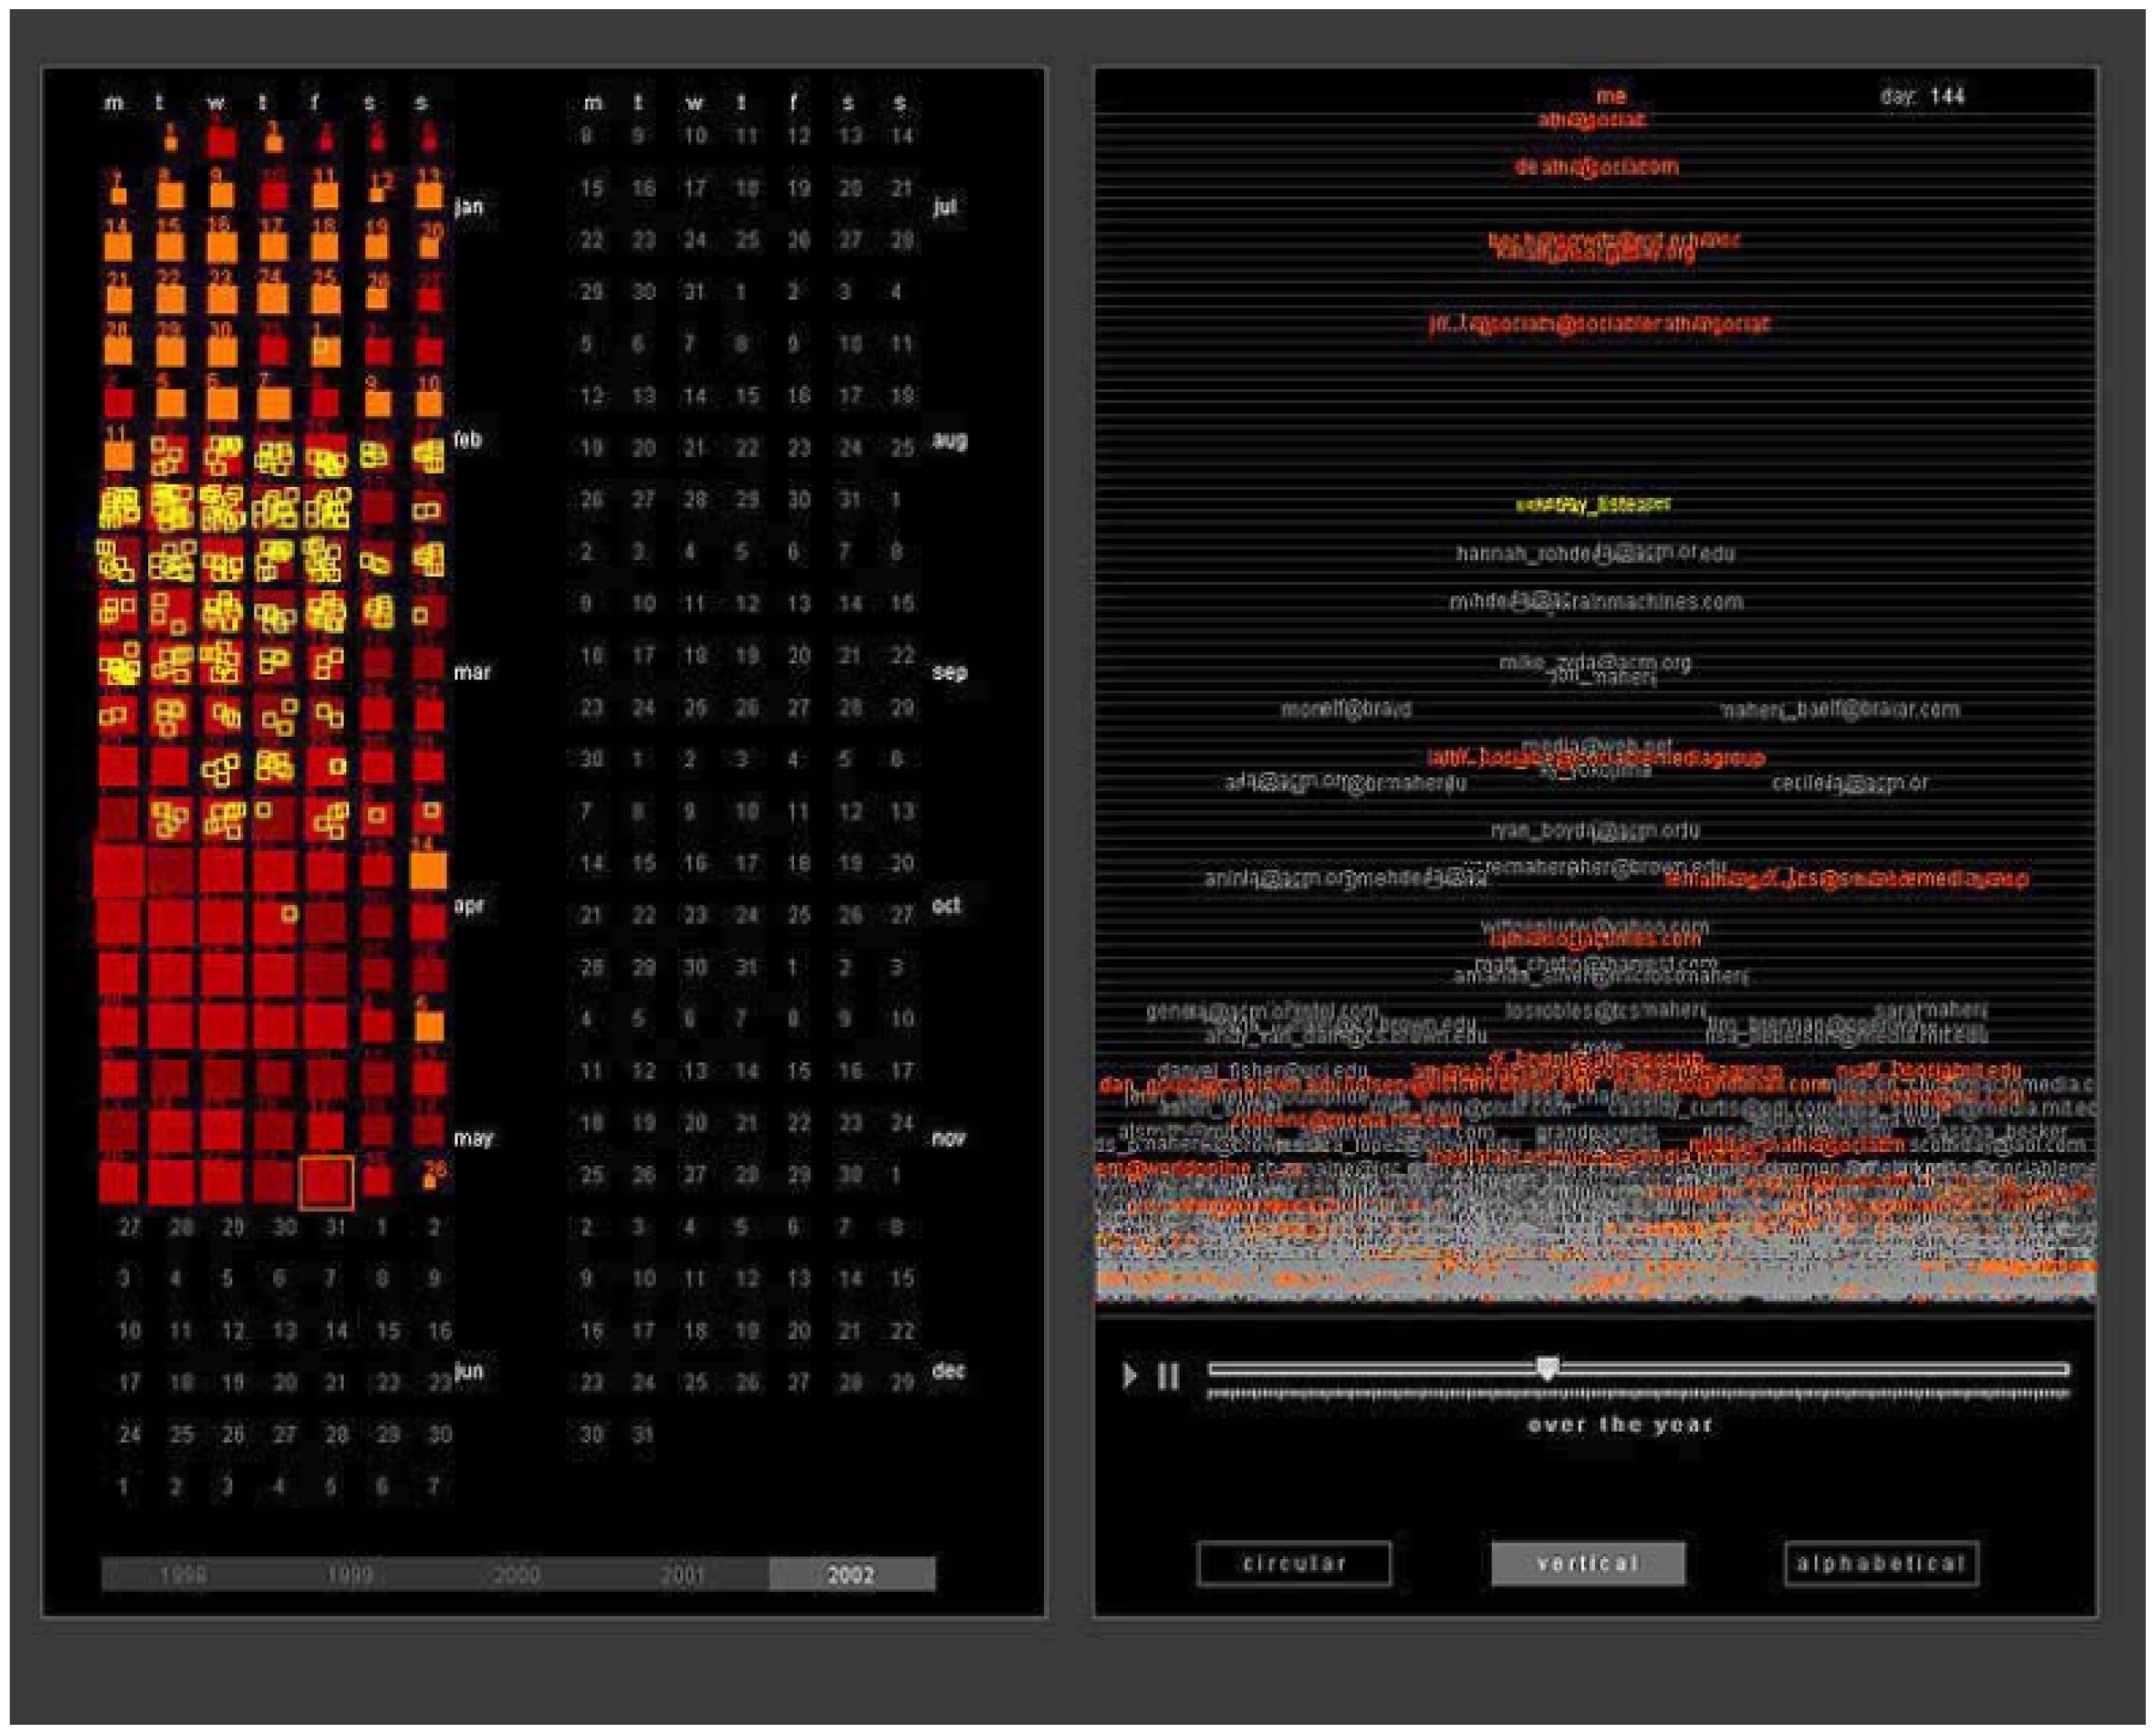
  36. Viégas, F.B.; Boyd, D.; Nguyen, D.H.; Potter, J.; Donath, J. Digital Artifacts for Remembering and Storytelling: Posthistory and social network fragments. In Proceedings of the IEEE 37th Annual Hawaii International Conference on System Sciences, Big Island, HI, USA, 5–8 January 2004; p. 10. [Google Scholar]
  37. Hullman, J.; Diakopoulos, N. Visualization Rhetoric: Framing Effects in Narrative Visualization. IEEE Trans. Vis. Comput. Graph. 2011, 17, 2231–2240. [Google Scholar] [CrossRef] [PubMed]
  38. Figueiras, A. Narrative Visualization: A Case Study of How to Incorporate Narrative Elements in Existing Visualizations. In Proceedings of the IEEE 18th International Conference on Information Visualisation (IV), Paris, France, 16–18 July 2014; pp. 46–52. [Google Scholar]
  39. Nguyen, P.H.; Xu, K.; Walker, R.; Wong, B.W. Schemaline: Timeline visualization for sensemaking. In Proceedings of the IEEE 18th International Conference on Information Visualisation, Paris, France, 16–18 July 2014; pp. 225–233. [Google Scholar]
  40. Satyanarayan, A.; Heer, J. Authoring Narrative Visualizations with Ellipsis. In Computer Graphics Forum; Wiley: Chichester, UK, 2014; Volume 33, pp. 361–370. [Google Scholar]
  41. Gratzl, S.; Lex, A.; Gehlenborg, N.; Cosgrove, N.; Streit, M. From Visual Exploration to Storytelling and Back Again. In Computer Graphics Forum; Wiley: Chichester, UK, 2016; Volume 35, pp. 491–500. [Google Scholar]
  42. Akaishi, M.; Satoh, K.; Kato, Y.; Hori, K. Narrative Based Topic Visualization for Chronological Data. In Proceedings of the 11th International Conference on Information Visualization (IV’07), Zurich, Switzerland, 4–6 July 2007; pp. 139–144. [Google Scholar]
  43. Fisher, D.; Hoff, A.; Robertson, G.; Hurst, M. Narratives: A Visualization to Track Narrative Events as They Develop. In Proceedings of the IEEE Symposium on Visual Analytics Science and Technology (VAST’08), Columbus, OH, USA, 19–24 October 2008; pp. 115–122. [Google Scholar]
  44. Bryan, C.; Ma, K.L.; Woodring, J. Temporal Summary Images: An Approach to Narrative Visualization via Interactive Annotation Generation and Placement. IEEE Trans. Vis. Comput. Graph. 2017, 23, 511–520. [Google Scholar] [CrossRef] [PubMed]
  45. Ferreira, N.; Poco, J.; Vo, H.T.; Freire, J.; Silva, C.T. Visual Exploration of Big Spatio-temporal Urban Data: A study of new york city taxi trips. IEEE Trans. Vis. Comput. Graph. 2013, 19, 2149–2158. [Google Scholar] [CrossRef] [PubMed]
  46. Robertson, G.; Fernandez, R.; Fisher, D.; Lee, B.; Stasko, J. Effectiveness of Animation in Trend Visualization. IEEE Trans. Vis. Comput. Graph. 2008, 14, 1325–1332. [Google Scholar] [CrossRef] [PubMed]
  47. Chen, T.; Lu, A.; Hu, S.M. Visual storylines: Semantic visualization of movie sequence. Comput. Graph. 2012, 36, 241–249. [Google Scholar] [CrossRef]
  48. Tanahashi, Y.; Ma, K.L. Design Considerations for Optimizing Storyline Visualizations. IEEE Trans. Vis. Comput. Graph. 2012, 18, 2679–2688. [Google Scholar] [CrossRef] [PubMed]
  49. Liu, S.; Wu, Y.; Wei, E.; Liu, M.; Liu, Y. StoryFlow: Tracking the Evolution of Stories. IEEE Trans. Vis. Comput. Graph. 2013, 19, 2436–2445. [Google Scholar] [PubMed]
  50. Heer, J.; Robertson, G.G. Animated Transitions in Statistical Data Graphics. IEEE Trans. Vis. Comput. Graph. 2007, 13, 1240–1247. [Google Scholar] [CrossRef] [PubMed]
  51. Liao, I.; Hsu, W.H.; Ma, K.L. Storytelling via Navigation: A Novel Approach to Animation for Scientific Visualization. In Proceedings of the International Symposium on Smart Graphics, Taipei, Taiwan, 27–29 August 2014; Springer: Berlin, Germany, 2014; pp. 1–14. [Google Scholar]
  52. Bederson, B.B.; Boltman, A. Does Animation Help Users Build Mental Maps of Spatial Information? In Proceedings of the IEEE Symposium on Information Visualization (Info Vis’ 99), San Francisco, CA, USA, 24–29 October 1999; pp. 28–35. [Google Scholar]
  53. Akiba, H.; Wang, C.; Ma, K.L. Aniviz: A Template-based Animation Tool for Volume Visualization. IEEE Comput. Graph. Appl. 2010, 30, 61–71. [Google Scholar] [CrossRef] [PubMed]
  54. Nagel, T.; Pietsch, C.; Dörk, M. Staged Analysis: From Evocative to Comparative Visualizations of Urban Mobility. In Proceedings of the IEEE VIS Arts Program (VISAP’16), Baltimore, Maryland, 23–28 October 2016; pp. 23–30. [Google Scholar]
  55. Saket, B.; Scheidegger, C.; Kobourov, S.G.; Börner, K. Map-based Visualizations Increase Recall Accuracy of Data. In Computer Graphics Forum; Wiley: Chichester, UK, 2015; Volume 34, pp. 441–450. [Google Scholar]
  56. Isenberg, P.; Heimerl, F.; Koch, S.; Isenberg, T.; Xu, P.; Stolper, C.; Sedlmair, M.; Chen, J.; Möller, T.; Stasko, J. Visualization Publication Dataset. Available online: http://vispubdata.org/ (accessed on 13 March 2018).
  57. Santiago, A.D.; Sampaio, P.N.; Fernandes, L.R. MOGRE-Storytelling: Interactive Creation of 3D Stories. In Proceedings of the IEEE XVI Symposium on Virtual and Augmented Reality (SVR), Piata Salvador, Brazil, 12–15 May 2014; pp. 190–199. [Google Scholar]
  58. Cropper, A.; Luna, R.E.; Mclean, E.L. Scientific Storytelling: From up in the clouds to down to earth a new approach to mentoring. In Proceedings of the IEEE Integrated STEM Education Conference (ISEC), Princeton, NJ, USA, 7 March 2015; pp. 252–257. [Google Scholar]
  59. Alavesa, P.; Zanni, D. Combining storytelling tradition and pervasive gaming. In Proceedings of the IEEE 5th International Conference on Games and Virtual Worlds for Serious Applications (VS-GAMES), Poole, UK, 11–13 September 2013; pp. 1–4. [Google Scholar]
  60. Chu, W.T.; Yu, C.H.; Wang, H.H. Optimized Comics-Based Storytelling for Temporal Image Sequences. IEEE Trans. Multimed. 2015, 17, 201–215. [Google Scholar] [CrossRef]
  61. Correa, C.D.; Ma, K.L. Dynamic Video Narratives. ACM Trans. Graph. 2010, 29, 88. [Google Scholar] [CrossRef]
  62. Theune, M.; Meijs, K.; Heylen, D.; Ordelman, R. Generating Expressive Speech for Storytelling Applications. IEEE Trans. Audio Speech Lang. Process. 2006, 14, 1137–1144. [Google Scholar] [CrossRef]
  63. Kandogan, E. Just-in-time Annotation of clusters, Outliers, and Trends in Point-based Data Visualizations. In Proceedings of the 2012 IEEE Conference on Visual Analytics Science and Technology (VAST), Seattle, WA, USA, 14–19 October 2012; pp. 73–82. [Google Scholar]
  64. Green, H.M.; Warrell, S.T.; Bernard, S.; Formentini, M. Afghanistan: Behind the Front Line. Available online: http://www.gapminder.org/downloads/human-development-trends-2005/ (accessed on 13 March 2018).
  65. Gapminder. Human Development Trends. 2005. Available online: http://www.gapminder.org/downloads/human-development-trends-2005/ (accessed on 13 March 2018).
  66. Borkin, M.; Vo, A.; Bylinskii, Z.; Isola, P.; Sunkavalli, S.; Oliva, A.; Pfister, H. What Makes a Visualization Memorable? IEEE Trans. Vis. Comput. Graph. 2013, 19, 2306–2315. [Google Scholar] [CrossRef] [PubMed]
  67. Ma, K.L.; Liao, I.; Frazier, J.; Hauser, H.; Kostis, H.N. Scientific Storytelling Using Visualization. IEEE Comput. Graph. Appl. 2012, 32, 12–19. [Google Scholar] [PubMed]
  68. NASA Science Missions. Available online: http://science.nasa.gov/missions (accessed on 13 March 2018).
  69. NASA Scientific Visualization Studio. Available online: http://svs.gsfc.nasa.gov (accessed on 13 March 2018).
  70. Tong, C.; Richard, R.; Rita, B.; Robert, S.L.; Kodzo, W.; Aidong, L.; Wang, Y.; Qu, H.; Luo, Q.; Ma, X. Storytelling and Visualization: A Survey. In Proceedings of the 9th International Conference on Information Visualization Theory and Applications (IVAPP), Funchal, Madira, Portugal, 27–29 January 2018. [Google Scholar]
  71. Plowman, L.; Luckin, R.; Laurillard, D.; Stratfold, M.; Taylor, J. Designing Multimedia for Learning: Narrative Guidance and Narrative Construction. In Proceedings of the SIGCHI conference on Human Factors in Computing Systems, Pittsburgh, PA, USA, 15–20 May 1999; ACM: New York, NY, USA, 1999; pp. 310–317. [Google Scholar]
  72. Laramee, S.R. How to read a visualization research paper: Extracting the essentials. IEEE Comput. Graph. Appl. 2011, 31, 78–82. [Google Scholar]
  73. Denning, S. The Springboard: How Storytelling Ignites Action in Knowledge-era Organizations; Routledge: Abingdon, UK, 2001. [Google Scholar]
  74. Hansen, C.D.; Johnson, C.R. Visualization Handbook; Academic Press: Cambridge, MA, USA, 2011. [Google Scholar]
  75. Bal, M. Narratology: Introduction to the Theory of Narrative; University of Toronto Press: Toronto, ON, Canada, 1985. [Google Scholar]
  76. Mroz, L.; Hauser, H. RTVR: A Flexible Java Library for Interactive Volume Rendering. In Proceedings of the IEEE Computer Society Conference on Visualization’01, San Diego, CA, USA, 21–26 October 2001; pp. 279–286. [Google Scholar]
  77. Gooch, A.; Gooch, B.; Shirley, P.; Cohen, E. A Non-photorealistic Lighting Model for Automatic Technical Illustration. In Proceedings of the 25th Annual Conference on Computer Graphics and Interactive Techniques, Orlando, FL, USA, 19–24 July 1998; ACM: New York, NY, USA, 1998; pp. 447–452. [Google Scholar]
  78. Haber, R.B.; McNabb, D.A. Visualization Idioms: A Conceptual Model for Scientific Visualization Systems. Vis. Sci. Comput. 1990, 74, 93. [Google Scholar]
  79. Viola, I. Importance-Driven Expressive Visualization. Ph.D. Thesis, Comenius University Bratislava, Bratislava, Slovakia, 2005. [Google Scholar]
  80. Donald, M. Prcis of Origins of the Modern Mind: Three Stages in the Evolution of Culture and Cognition. Behav. Brain Sci. 1993, 16, 737–748. [Google Scholar] [CrossRef]
  81. Li, G.; Cao, X.; Paolantonio, S.; Tian, F. SketchComm: A Tool to Support Rich and Flexible Asynchronous Communication of Early Design Ideas. In Proceedings of the ACM 2012 Conference on Computer Supported Cooperative Work, Seattle, WA, USA, 11–15 February 2012; ACM: New York, NY, USA, 2012; pp. 359–368. [Google Scholar]
  82. Heer, J.; Viégas, F.B.; Wattenberg, M. Voyagers and Voyeurs: Supporting Asynchronous Collaborative Information Visualization. In Proceedings of the SIGCHI Conference on Human Factors in Computing Systems, San Jose, CA, USA, 28 April–3 May 2007; ACM: New York, NY, USA, 2007; pp. 1029–1038. [Google Scholar]
  83. Ogawa, M.; Ma, K.L. Software Evolution Storylines. In Proceedings of the 5th International Symposium on Software Visualization, Salt Lake City, UT, USA, 25–26 October 2010; ACM: New York, NY, USA, 2010; pp. 35–42. [Google Scholar]
  84. Ogawa, M.; Ma, K.L. Code_swarm: A design study in organic software visualization. IEEE Trans. Vis. Comput. Graph. 2009, 15, 1097–1104. [Google Scholar] [CrossRef] [PubMed]
  85. Begel, A.; Khoo, Y.P.; Zimmermann, T. Codebook: Discovering and Exploiting Relationships in Software Repositories. In Proceedings of the 2010 ACM/IEEE 32nd International Conference on Software Engineering, Cape Town, South Africa, 2–8 May 2010; Volume 1, pp. 125–134. [Google Scholar]
  86. Bloom, B.S. Taxonomy of Educational Objectives: The Classification of Educational Goals. Handbook 1–2; Longmans: Harlow, UK; McKay: Philadelphia, PA, USA, 1974. [Google Scholar]
  87. Gotz, D.; Wen, Z. Behavior-driven Visualization Recommendation. In Proceedings of the 14th International Conference on Intelligent User Interfaces, Sanibel Island, FL, USA, 8–11 February 2009; ACM: New York, NY, USA, 2009; pp. 315–324. [Google Scholar]
  88. Black, J.B.; Bower, G.H. Episodes as Chunks in Narrative Memory. J. Verbal Learn. Verbal Behav. 1979, 18, 309–318. [Google Scholar] [CrossRef]
  89. Herman, I.; Melançon, G.; Marshall, M.S. Graph Visualization and Navigation in Information Visualization: A survey. IEEE Trans. Vis. Comput. Graph. 2000, 6, 24–43. [Google Scholar] [CrossRef]
  90. Boyd, D.; Lee, H.Y.; Ramage, D.; Donath, J. Developing Legible Visualizations for Online Social Spaces. In Proceedings of the IEEE 35th Annual Hawaii International Conference on System Sciences (HICSS), Big Island, HI, USA, 10 January 2002; pp. 1060–1069. [Google Scholar]
  91. Donath, J.S. Visual Who: Animating the affinities and activities of an electronic community. In Proceedings of the Third ACM International Conference on Multimedia, San Francisco, CA, USA, 5–9 November 1995; ACM: New York, NY, USA, 1995; pp. 99–107. [Google Scholar]
  92. Bloch, M.S.; McLean, A. Mapping America: Every City, Every Block. Available online: http://projects.nytimes.com/census/2010/explorer (accessed on 13 March 2018).
  93. McCandless, D. Poll Dancing: How Accurate are Poll Predictions. Available online: http://www.guardian.co.uk/news/datablog/2010/may/06/general-election-2010-opinion-polls-information-beautiful# (accessed on 13 March 2018).
  94. Kosara, R.; Mackinlay, J. Storytelling: The Next Step for Visualization. Computer 2013, 46, 44–50. [Google Scholar] [CrossRef]
  95. Pirolli, P.; Card, S. The Sensemaking Process and Leverage Points for Analyst Technology as Identified through Cognitive Task Analysis. In Proceedings of the International Conference on Intelligence Analysis, McLean, VA, USA, 2–6 May 2005; Volume 5, pp. 2–4. [Google Scholar]
  96. Dubinko, M.; Kumar, R.; Magnani, J.; Novak, J.; Raghavan, P.; Tomkins, A. Visualizing Tags over Time. ACM Trans. Web 2007, 1, 7. [Google Scholar] [CrossRef]
  97. Swan, R.; Jensen, D. TimeMines: Constructing Timelines with Statistical Models of Word Usage. In Proceedings of the KDD-2000 Workshop on Text Mining, Boston, MA, USA, 20–23 August 2000; pp. 73–80. [Google Scholar]
  98. Van Wijk, J.J.; Van Selow, E.R. Cluster and Calendar Based Visualization of Time Series Data. In Proceedings of the IEEE Symposium on Information Visualization (Info Vis’ 99), San Francisco, CA, USA, 24–29 October 1999; pp. 4–9. [Google Scholar]
  99. Oxford Living Dictionaries. Available online: https://en.oxforddictionaries.com/definition/narrative (accessed on 13 March 2018).
  100. Bond, B. Steroids or Not, the Pursuit Is On. Available online: http://www.nytimes.com/2006/04/02/sports/20060402_BONDS_GRAPHIC.html (accessed on 13 March 2018).
  101. Cox, A. Budget Forecasts VS. Reality. Available online: http://www.nytimes.com/interactive/2010/02/02/us/politics/20100201-budget-porcupine-graphic.html (accessed on 13 March 2018).
  102. Heer, A.H.J.; Agrawala, M. Minnesota Employment Explorer. Available online: http://minnesota.publicradio.org/projects/2008/07/16_minnesota_Slowdown (accessed on 13 March 2018).
  103. Dictionary, O.E. Oxford Living Dictionaries. Available online: http://www.oxforddictionaries.com/definition/english/transition (accessed on 13 March 2018).
  104. Veloso, M.; Phithakkitnukoon, S.; Bento, C. Urban Mobility Study Using Taxi Traces. In Proceedings of the 2011 International Workshop on Trajectory Data Mining and Analysis, Beijing, China, 18 September 2011; ACM: New York, NY, USA, 2011; pp. 23–30. [Google Scholar]
  105. Veloso, M.; Phithakkitnukoon, S.; Bento, C.; Fonseca, N.; Olivier, P. Exploratory Study of Urban Flow Using Taxi Traces. In Proceedings of the First Workshop on Pervasive Urban Applications (PURBA) in conjunction with Pervasive Computing, San Francisco, CA, USA, 12–15 June 2011. [Google Scholar]
  106. Liao, Z.; Yu, Y.; Chen, B. Anomaly Detection in GPS Data Based on Visual Analytics. In Proceedings of the 2010 IEEE Symposium on Visual Analytics Science and Technology (VAST), Salt Lake City, UT, USA, 25–26 October 2010; pp. 51–58. [Google Scholar]
  107. Rosling, H. TED 2006. Available online: http://www.gapminder.org/video/talks/ted-2006--debunking-myth-about-the-third-world.html (accessed on 13 March 2018).
  108. Rosling, H. TED 2007. Available online: http://www.gapminder.org/video/talks/ted-2007--the-seemingly-impossible-is-possible.html (accessed on 13 March 2018).
  109. Tufte, E. Envisioning Information; Graphics Press: Cheshire, CT, USA, 1990. [Google Scholar]
  110. Tversky, B.; Morrison, J.B.; Betrancourt, M. Animation: Can It Facilitate? Int. J. Hum. Comput. Stud. 2002, 57, 247–262. [Google Scholar] [CrossRef]
  111. Baudisch, P.; Tan, D.; Collomb, M.; Robbins, D.; Hinckley, K.; Agrawala, M.; Zhao, S.; Ramos, G. Phosphor: Explaining Transitions in the User Interface Using Afterglow Effects. In Proceedings of the 19th Annual ACM Symposium on User Interface Software and Technology, Montreux, Switzerland, 15–18 October 2006; ACM: New York, NY, USA, 2006; pp. 169–178. [Google Scholar]
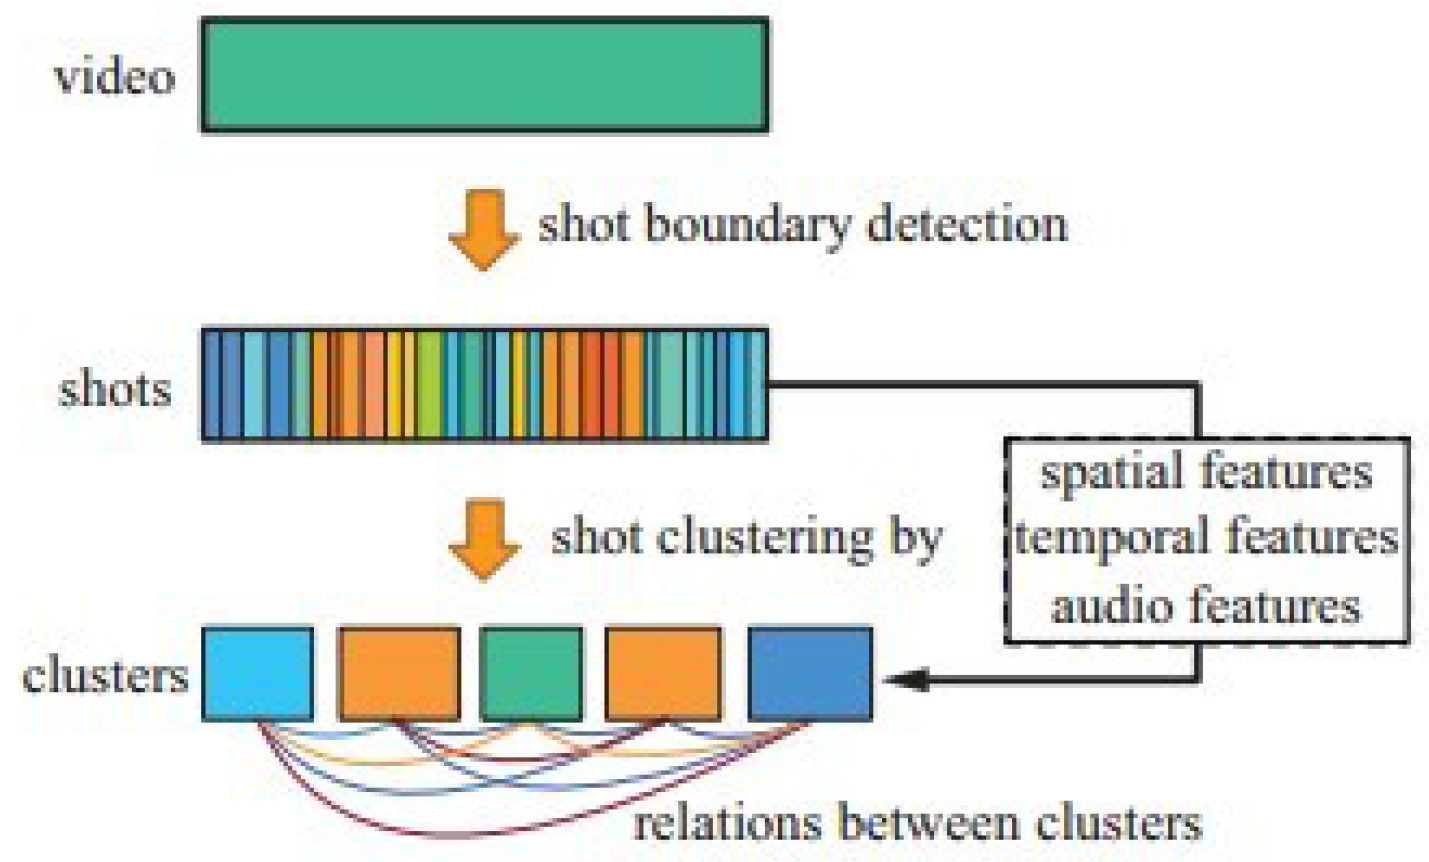
  112. Yahiaoui, I.; Merialdo, B.; Huet, B. Automatic video summarization. Proc. CBMIR Conf. 2001. [Google Scholar] [CrossRef]
  113. Ogievetsky, V. Plotweaver Xkcd/657 Creation Tool. 2009. Available online: https://graphics.stanford.edu/wikis/cs448b-09-fall/FP-OgievetskyVadim (accessed on 13 March 2018).
  114. Gonzalez, C. Animation in User Interface Design for Decision Making: A Research Framework and Empirical Analysis; Texas Tech University: Lubbock, TX, USA, 1995. [Google Scholar]
  115. Gonzalez, C. Does Animation in User Interfaces Improve Decision Making? In Proceedings of the SIGCHI Conference on Human Factors in Computing Systems, Vancouver, BC, Canada, 13–18 April 1996; ACM: New York, NY, USA, 1996; pp. 27–34. [Google Scholar]
  116. Donskoy, M.; Kaptelinin, V. Window Navigation with and without Animation: A Comparison of Scroll Bars, Zoom, and Fisheye View. In Proceedings of the CHI’97 Extended Abstracts on Human Factors in Computing Systems, Atlanta, Georgia, 22–27 March 1997; ACM: New York, NY, USA, 1997; pp. 279–280. [Google Scholar]
  117. Childs, H.; Brugger, E.; Bonnell, K.; Meredith, J.; Miller, M.; Whitlock, B.; Max, N. A Contract Based System for Large Data Visualization. In Proceedings of the IEEE Visualization (VIS 05), Minneapolis, MN, USA, 23–28 October 2005; pp. 191–198. [Google Scholar]
  118. Correa, C.; Silver, D. Dataset Traversal with Motion-controlled Transfer Functions. In Proceedings of the IEEE Visualization (VIS 05), Minneapolis, MN, USA, 23–28 October 2005; pp. 359–366. [Google Scholar]
  119. Dictionary, O.E. Oxford Living Dictionaries. Available online: http://www.oxforddictionaries.com/definition/english/memory (accessed on 13 March 2018).
  120. Holmes, N. Designer’s Guide to Creating Charts and Diagrams; Watson-Guptill: New York, NY, USA, 1984. [Google Scholar]
  121. Blasio, A.J.; Bisantz, A.M. A Comparison of the Effects of Data ink Ratio on Performance with Dynamic Displays in A Monitoring Task. Int. J. Ind. Ergon. 2002, 30, 89–101. [Google Scholar] [CrossRef]
  122. Gambrell, L.B.; Jawitz, P.B. Mental Imagery, Text Illustrations, and Children’s Story Comprehension and Recall. Read. Res. Q. 1993, 28, 265–276. [Google Scholar] [CrossRef]
  123. Blascheck, T.; Kurzhals, K.; Raschke, M.; Burch, M.; Weiskopf, D.; Ertl, T. State-of-the-art of Visualization for Eye Tracking Data. In Proceedings of the EuroVis, Swansea, Wales, 9–13 June 2014; Volume 2014. [Google Scholar]
  124. Isola, P.; Parikh, D.; Torralba, A.; Oliva, A. Understanding the Intrinsic Memorability of Images. In Proceedings of the Advances in Neural Information Processing Systems, Granada, Spain, 12–15 December 2011; pp. 2429–2437. [Google Scholar]
Figure 1. The proposed method to author a story is to record the user’s natural interaction with the visualization software. This image shows the process of the story creation by Wohlfart. Green annotations represent user interaction and red annotations refer to internal system processes. As soon as the software starts recording, a new story is created and all interactions are logged [19]. Image courtesy of Wohlfart [19].
Information 09 00065 g001
Figure 2. A table summarizing the visualization techniques used in each storytelling paper. The papers are sorted alphabetically by the first author’s surname.
Information 09 00065 g002
Figure 3. Ma et al. show the interactive software used at the Exploratorium in San Francisco. The purpose of this software is to educate users on the process of how tides, currents and rivers combine in the estuary of San Francisco bay. A touch-screen is used to place floats into the virtual water so that the user can see the effects of the current on the float. Users can watch the effects of predicted tide and river flow cycles on the floats trajectory. Other contextual information is provided as an animation alongside the visualization [67]. Image courtesy of Ma et al. [67].
Information 09 00065 g003
Figure 4. This figure shows the system architecture from Lu and Shen. It integrates the information of data analysis and a single 3D data visualization method for users to explore and visualize overall time-varying data contents [17]. (a) A time-varying dataset; (b) Selected data features; (c) The distribution of time steps; (d) 3D visualization method; (e) Overall time-varying data contents. Image courtesy of Lu and shen [17].
Information 09 00065 g004
Figure 5. Cruz et al. show the British hegemony and the newly independent South America in 1891. Each empire and independent territory is a circle whose area is proportional to that entity’s land area. Former colonies are unfilled circles with rims in the corresponding empire’s color [18]. Image courtesy of Cruz et al. [18].
Information 09 00065 g005
Figure 6. The top two images show an overview of the CT scan data presented by Wohlfart and Hauser. A partial clipping reveals both the skin layer and bone layer, but shows the full set of data. The middle shows a zoomed view that isolates eye swelling in the image (left), and a filtered view that exposes some blood effusions in the swollen region. The bottom offers a comparison of the non-injured eye with the injured one and shows the cause of the swelling which is attributed to a tripod fracture just below the eye. This design offers the user a macro overview as to lay the foundations of a story background then narrows the scope to view the focal point of the image [20]. Image courtesy of Wohlfart [20].
Information 09 00065 g006
Figure 7. Lidal et al. [3,21] present a sketch-based interface for rapid modelling and exploration of various geological scenarios. The sketch-based interface is split into two windows. The Story Tree (left) which shows a tree graph representation of all the geological stories, and the Canvas (right) which shows the sketching interface which utilises a pen and paper interaction to record geological sedimentary data. A geological story is built using horizontal lines to separate different geological layers, vertical lines to show fault systems, and polygons for highlighting large sedimentary layers. The user can navigate through different geological stories with the story tree and then inspect the geological elements of that story. Image courtesy of Lidal et al. [21].
Information 09 00065 g007
Figure 8. Lee et al. show an example of SketchStory in information visualization presentation [22]. (a) A presenter sketches out a chart axis; (b) SketchStory completes the chart; (c) The presenter interacts with the charts. Image courtesy of Lee et al. [22].
Information 09 00065 g008
Figure 9. Lundblad and Jern show Vislet aimed at a comparative visualization using linked Scatter Matrix and Scatter Plot to analyze national correlation between 6 indicators between 1960 and 2010 from the World Databank [23]. Image courtesy of Lundblad and Jern [23].
Information 09 00065 g009
Figure 10. Eccles et al. show a GeoTime visualisation instance. The l-axis represented by height is temporal. x- and y-axis represent the geospatial location Here you can see a taxi driver’s route over the course of a few hours. Each pick up and drop off is labelled and the route is mapped on the x- and y-axis using the map [26]. Image courtesy of Eccles et al. [26].
Information 09 00065 g010
Figure 11. Kuhn and Stocker show the CodeTimeline collaboration view. Colors denote different user contributions and each line represents the life of files in the code. Sticky notes are added so the users can learn the history of the code beyond the file evolution [27]. Image courtesy of Kuhn and Stocker [27].
Information 09 00065 g011
Figure 12. Mahyar et al. present five levels of user engagement in information visualization [31]. Image courtesy of Mahyar et al. [31].
Information 09 00065 g012
Figure 13. Hullman et al. show the architecture of contextifier [32] (left) and illustrate Parallelism in sequencing in the NYT Copenhagen [14] (right). Image courtesy of Hullman et al. [14,32].
Information 09 00065 g013
Figure 14. Bach et al. present graph comics for data-driven storytelling [35]. Image courtesy of Bach et al. [35].
Information 09 00065 g014
Figure 15. Viegas et al. show the PostHistory visualisation. On the left is the calendar view, showing 365 squares to represent each day of the year (This image only shows data up until May). Size corresponds to the volume of email sent on that day. The colour highlights a specific recipient that has been selected in the contact panel (left). The contact panel shows all the contacts the user has been corresponding with over the year. A contact can be selected to highlight their interaction in the calendar view [36]. Image courtesy of Viegas et al. [36].
Information 09 00065 g015
Figure 16. Hullman and Diakopoulos demonstrate how data can be window dressed to change the viewers opinion of it. These two images visualize the same data but each illustrator has different intended outcomes. The top image shows an unstructured, complicated graph of conflicting colors and shapes, clearly intended to confuse and obstruct the data, whereas the bottom lays the data out in a simple fashion using consistent shapes and colors [37]. Image courtesy of Hullman and Diakopoulos [37].
Information 09 00065 g016
Figure 17. Figueiras shows a visualization of Chinese online censorship enhanced with storytelling. An interactive feature is added so that the user can click on an instance of censorship to learn more about it. This supplies context to the user and also may draw an empathetic response from the user [38]. Image courtesy of Figueiras [38].
Information 09 00065 g017
Figure 18. Figueiras shows the visualizations used in the focus group study and the elements that compose them [28]. Image courtesy of Figueiras et al. [28].
Information 09 00065 g018
Figure 19. Nguyen et al. present the SchemLine system [39]. Image courtesy of Nguyen et al. [39].
Information 09 00065 g019
Figure 20. Fisher et al. show daily references to four US presidential candidates from 1 January to 26 March 2008. Time passes along the x-axis for each candidate; number of mentions of the term along the y-axis [43]. Image courtesy of Fisher et al. [43].
Information 09 00065 g020
Figure 21. The figure shows the seven genres of narrative visualization presented by Segal and Heer [5]. These vary in terms of the number of frames and the ordering of their visual elements. A video, for example has a strict ordering and high frame number, whereas a ‘Magazine Style’ poster may have a few frames in one image that are not strictly ordered. These genre elements dictate if a story is author-driven or reader-driven. Author-driven content uses a linear ordering of scenes and has no interactivity. Reader-driven content has no prescribed order to scenes and a high level of interactivity with the reader [5]. Image courtesy of Segal and Heer [5].
Information 09 00065 g021
Figure 22. The (top-left) image shows the trips rendered on the map. However the cluttered view can be reduced by employing a level-of-detail approach (top right) which takes a subsample based on the order in which the trips occurred. The (bottom-left) image shows a density heat map of the taxi trips whereas the (bottom-right) image averages out the data in each region to make a regional density heat map [45]. Image courtesy of Ferreira et al. [45].
Information 09 00065 g022
Figure 23. Robertson et al. show the trace lines of the graph animation. The traces visualization shows bubbles at all x and y locations throughout the time frame. This is a conversion of an animation into a static image [46]. Image courtesy of Robertson et al. [46].
Information 09 00065 g023
Figure 24. Chen et al. presents video shot clustering algorithm combines both visual and audio features to generate a meaningful storyline [47]. Image courtesy of Chen et al. [47].
Information 09 00065 g024
Figure 25. Tanahashi and Ma present the overview algorithm of generating storyline visualizations [48]. Image courtesy of Tanahashi et al. [48].
Information 09 00065 g025
Figure 26. Comparison of King Lear using both methods of layout; (a) StoryFlow; (b) previous method by Tanahashi and Ma [48]. The StoryFlow layout presented in this paper focuses on minimising white space and efficiently ordering the story lines to ensure the most concise visual representation of a story. Intersecting lines represent interaction between characters and major events in the story are labeled to add clarity to the visualization [49]. Image courtesy of Liu et al. [49].
Information 09 00065 g026
Figure 27. Heer and Robertson show the process of transition for a scatter plot to a bar chart. The top path starts by stretching the points to size and then moving to the right location, whereas the bottom path moves the dots first, then resizes and reshapes them [50]. Image courtesy of Heer and Robertson [50].
Information 09 00065 g027
Figure 28. Bederson and Boltman show the ordering effects when presenting an animated and non-animated graphic. If the animated graphic is shown first then there is little difference in recall error, however, if the animation graphic is shown second then the recall error is significantly higher for the non-animated graphic [52]. Image courtesy of Bederson and Boltman [52].
Information 09 00065 g028
Figure 29. Akiba et al. show the AniVis animation tool displaying MRI scan data. By blending the two layers of data together, a new layer of information is revealed (middle image) [53]. Image courtesy of Akiba et al. [53].
Information 09 00065 g029
Figure 30. Bateman et al. compare two different levels of graphical embellishment of the same data. The top graph is an embellished image but still retains the recognisable features of a bar chart. The bottom image replaces the bars with a silhouette of a person next to a drink where the height of the drink corresponds to the height of the original bar. This method also uses the addition of color to emphasize the data [15]. Image courtesy of Bateman et al. [15].
Information 09 00065 g030
Figure 31. Borkin et al. design three-phase experiment to evaluate viewer performance of recognition and recall [30]. Image courtesy of Borkin et al. [30].
Information 09 00065 g031
Figure 32. Saket et al. show two visualization of the same data: node-link diagram and map-based diagram [55]. Image courtesy of Saket et al. [55].
Information 09 00065 g032
Table 1. Our classification of the storytelling literature. The y-axis categories fall into who-authoring-tools and user-engagement, how-narrative and transitions, why-memorability and interpretation. See Section 1.2 for a complete description.
LinearUser-Directed/InteractiveParallelOverview
WhoAuthoring-ToolsGershon et al., 2001 [16]
Lu and Shen, 2008 [17]
Cruz et al., 2011 [18]
Wohlfart, 2006 [19]
Wohlfart et al., 2007 [20]
Lidal et al., 2012 [21]
Lee et al., 2013 [22]
Lidal et al., 2013 [3]
Lundblad et al., 2013 [23]
Fulda et al., 2016 [24]
Amini et al., 2017 [25]
Eccles et al., 2007 [26]
Kuhn et al., 2012 [27]
User Engagement Figueiras, 2014 [28]
Boy et al., 2016 [29]
Borkin et al., 2016 [30]
Mahyar et al., 2015 [31]
HowNarrativeHullman et al., 2013 [32]
Hullman et al., 2013 [14]
Gao et al., 2014 [33]
Amini et al., 2015 [34]
Bach et al., 2016 [35]
Viegas et al., 2004 [36]
Hullman et al., 2011 [37]
Figueiras, 2014 [28]
Figueiras, 2014 [38]
Nguyen et al, 2014 [39]
Satyanarayan et al., 2014 [40]
Gratzl et al., 2016 [41]
Akashi et al., 2007 [42]
Fisher et al., 2008 [43]
Hullman et al., 2011 [37]
Bryan et al., 2017 [44]
Segel and Heer, 2010 [5]
Lee et al., 2015 [10]
Static Transitions Ferreira et al., 2013 [45]Robertson, 2008 [46]
Chen et al., 2012 [47]
Tanhashi et al., 2012 [48]
Liu et al., 2013 [49]
Ferreira et al., 2013 [45]
Animated TransitionsHeer et al., 2007 [50]
Liao et al., 2014 [51]
Bederson and Boltman, 1999 [52]
Akiba et al., 2010 [53]
Nagel et al., 2016 [54]
WhyMemorabilityBateman et al., 2010 [15]
Borkin et al., 2016 [30]
Saket et al., 2015 [55]
Interpretation
Table 2. An alternative classification of the storytelling literature based on scientific, information, and geo-spatial visualization. Both mature areas and unsolved problems are apparent.
Scientific VisualizationInformation VisualizationGeo-Spatial Visualization
Authoring ToolsWohlfart, 2006 [19]
Wohlfart et al., 2007 [20]
Lu and Shen, 2008 [17]
Gershon et al., 2001 [16]
Cruz et al., 2011 [18]
Kuhn et al., 2012 [27]
Lee et al., 2013 [22]
Fulda et al., 2016 [24]
Amini et al., 2017 [25]
Eccles et al., 2007 [26]
Lidal et al., 2012 [21]
Lidal et al., 2013 [3]
Lundblad et al., 2013 [23]
Narrative Viegas et al., 2004 [36]
Akashi et al., 2007 [42]
Fisher et al., 2008 [43]
Segel and Heer, 2010 [5]
Hullman et al., 2011 [37]
Hullman et al., 2013 [32]
Hullman et al., 2013 [14]
Figueiras, 2014 [38]
Figueiras, 2014 [28]
Nguyen et al., 2014 [39]
Amini et al., [34]
Lee et al., 2015 [10]
Bach et al., [35]
Bryan et al., 2017 [44]
Gratzl et al., 2016 [41]
Gao et al., 2014 [33]
Satyanarayan et al., 2014 [40]
Static Transitions Robertson, 2008 [46]
Chen et al.,2012 [47]
Tanhashi et al., 2012 [48]
Liu et al., 2013 [49]
Ferreira et al., 2013 [45]
Animated TransitionsAkiba et al., 2010 [53]
Liao et al., 2014 [51]
Bederson and Boltman, 1999 [52]
Heer et al., 2007 [50]
Nagel et al., 2016 [54]
Memorability Bateman et al., 2010 [15]
Borkin et al., 2013 [66]
Saket et al., 2015 [55]
Interpretation
Engagement Figueiras, 2014 [28]
Mahyar et al., 2015 [31]
Boy et al., 2016 [29]
Borkin et al., 2016 [30]

