Leveraging Distrust Relations to Improve Bayesian Personalized Ranking

School of Software Engineering, South China University of Technology, Guangzhou 510641, China
*
Authors to whom correspondence should be addressed.
†
These authors contributed equally to this work.
Information 2018, 9(8), 191; https://doi.org/10.3390/info9080191
Submission received: 6 June 2018
/
Revised: 25 July 2018
/
Accepted: 25 July 2018
/
Published: 27 July 2018
(This article belongs to the Section Information Systems)
Abstract
:Distrust based recommender systems have drawn much more attention and became widely acceptable in recent years. Previous works have investigated using trust information to establish better models for rating prediction, but there is a lack of methods using distrust relations to derive more accurate ranking-based models. In this article, we develop a novel model, named TNDBPR (Trust Neutral Distrust Bayesian Personalized Ranking), which simultaneously leverages trust, distrust, and neutral relations for item ranking. The experimental results on Epinions dataset suggest that TNDBPR by leveraging trust and distrust relations can substantially increase various performance evaluations including score, , , , and .
1. Introduction
Recommendation tasks have been divided into two types: rating prediction and item ranking. In reality, item ranking is more important since explicit ratings may not always be available [1,2]. “Social relations” is a vital source of information which informs us about users’ preferences. In the Epinions (www.epinions.com) dataset, the users’ social relations include “trust relations” that user pairs with positive ratings, “distrust relations” that user pairs with negative ratings, and “neutral relations” that user pairs without any ratings. That is, social relations not only refer to trust relations as usual but also include distrust relations. In this regard, if we would like to recommend items to a user, we should understand what she prefers as well as what she dislikes.
Many works have been proposed to leverage social relations for rating prediction tasks [3,4,5,6], For example, Bharadwaj et al. [7] proposed a collaborative filtering model based on user trust computation. Forsati et al. [8] proposed a matrix factorization-based recommendation model by considering distrust as reversing the deviation of latent features. However, few works have focused on item ranking tasks with trust information. For example, Jamali and Ester [9] proposed the Trust-Walker method, which is possibly the first trust-based ranking method by adapting a nearest neighborhood approach to item recommendation. Zhao et al. [10] distinguished the active users’ preference from the one she trusted, which is termed as SBPR. Unlike existing ranking models, which only consider the user’s trust and neutral relations, we also incorporate distrust relations.
In this work, we try to dig out more the user’s preferences reflected in the user’s social relations for certain items. Specifically, we propose a Bayesian Personalized Ranking model, called TNDBPR (Trust Neutral Distrust Bayesian Personalized Ranking), which takes full consideration about users’ social relations. TNDBPR incorporates users’ trust, neutral, and distrust relations to better predict users’ preference and disgust, thereby boosting the performance of item recommendation. Our main contributions are as follows:
- We propose a TNDBPR method for item recommendation tasks. To the best of our knowledge, it is the first work incorporating distrust relations to evaluate users’ item ranking preference.
- We conduct experiments to compare the proposed TNDBPR with its variations and four other representative models on Epinions dataset. The results verify that distrust relations has a significant impact on improving item recommendation results.
Main contents of this article are as follows. Related work is shown in Section 2. Section 3 presents the datasets in our research, defines the problem and presents the result of some observations related to the problem. The proposed models and algorithms are established in Section 4. Section 5 gives the results and verifies the contribution of the TNDBPR algorithm to ranking recommendation problems. Section 6 summarizes the whole work and puts forward the future ideas.
2. Related Work
Many previous works have been performed on ranking recommender systems incorporating social trust relations. Shen et al. [11] proposed the joint model of individual and social potential factors recommended by society. Ye et al. [12] proposed a quantitative generative model to capture social impact of friends and exploit social impact to dig the users’ preference. Du et al. [13] improved ranking recommendation performance by putting social normalization terms in the BPR framework. Pan and Chen [14] loosened the hypothesis and proposed a Group Bayesian Personalized Ranking (GBPR) method. In [15], a similar assumption is made for user connection, and multi relational BPR (MR-BPR) is proposed for item recommendation. Guo et al. [16] focused on how to use the geographical features and access frequency to improve POI recommendation, and proposed a neighborhood perception recommendation approach from the point of view of NBPR. De Meo et al. [17] combined skills, interactions, and trust relationships to manage the class formation in e-Learning. Considering that people often trust different subsets of friends according to different domains, Liu et al. [18] proposed a novel TruCom model for this multicategory item recommendation issue. TruCom organizes a domain-specific trust network and incorporates the direct and indirect trust information into a matrix factorization model for better rating prediction. Zhang et al. [19] employed matrix factorization techniques to fuse direct trust, indirect trust, trust propagation, and user similarity in a coherent model, namely CETrust for rating prediction. In the context of a Social Internetworking System (SIS), De Meo et al. [20] introduced a trust-based model to represent and handle trust and reputation. Fotia et al. [21] used two different types of trust measures, namely the reliability and the local reputation, to better form cohesive groups. Albanese et al. [22] introduced a multimedia recommendation model for computing customized recommendations by originally combining the inherent characteristics of multimedia objects, past behavior of individual users, and overall behavior of the entire users’ community.
Besides, many studies have been tried to incorporate distrust relations into rating recommendation. Ma et al. [23] firstly suggested that the introduction of distrust of information can help to make recommendations. Victor et al. [24] introduced a distrust-enhanced recommendation algorithm which has its roots in TidalTrust. Note that it is a memory-based method. Forsati et al. [8] proposed a MF based social rating network recommendation model, which is appropriate to trust and distrust. It aims to enhance the recommendation quality, reduce data sparsity and cold start user problems. However, the algorithm ignores the neutral users who have none relation with others. Therefore, Forsati et al. [25] proposed a collaborative social ranking model, dubbed PushTrust to grade the userrs latent features based on the simultaneously leverage of trust, distrust, and neutral relations. Ghaznavi et al. [26] considered positive, zero and negative similarities, as well as trust, distrust and zero trust information on the precision of recommendations. It demonstrates that distrust and negative similarity data boosts rating prediction. Fei et al. [27] combined existing trust/distrust information and inferred trust/distrust information to improve collaborative filtering algorithm. The improved cosine similarity is used for measuring the degree of trust and distrust. Mahtar et al. [28] provided five views of trusted users, including cold start user, heavy user, opinionated user, etc. They conducted experiments on two models [1,7] with different types of view and demonstrates the effectiveness on MAE and rating coverage. Chug et al. [29] proposed trust-distrust enhanced recommendations method based on a novel similarity measurement considering ratings and trust values. For more efficient neighbors, it has filtered out distrusted user from the neighborhood set. It also investigates the use of trust-distrust based propagation in resolving the new user and sparsity problems.
3. Definitions and Data Description
3.1. Definitions
Concepts and definitions we use are introduced in this section. We assume that there is a set of users U and a set of items I, where and . We define a trust network , where suggests u and v established trust relations. We define a distrust network , where suggests u and established distrust relations. Some important terminologies are defined as follows:
Observed items / Unobserved items: Observed items are the items that user u provides ratings while unobserved items are the remaining items.
Positive feedback: Positive feedback is the set of items that user u have rated, which is denoted as .
Trust feedback: Trust feedback is the set of items, which is denoted as . These items could be those user u did not choose but at least one of her trusted users selected.
Distrust feedback: Distrust feedback is the set of items that user u and her trusted users did not choose but at least one of her distrusted users selected, which is defined as .
Neutral feedback: Neutral feedback is defined as the set of items, which is denoted by . These items could be those that neither user u nor any of her trusted or distrusted users chose.
It shows that and contains the total item set.
We then introduce two social coefficients: a trust coefficient for to estimate the preference range of positive and trust feedback, and a distrust coefficient for estimates the preference distance of neutral and distrust feedback. In more detail:
Trust coefficient: Trust coefficient represents the attitude from u’s trust relations to a particular item k. We define that calculates how many trusted people of user u have selected item k. Larger s indicate that more of u’s trusted users like this item, which makes u show more preferences on this item.
Distrust coefficient: Distrust coefficient represents the attitude from u’s distrust relations to a particular item z. We define that calculates how many distrust people of user u have selected item z. A large value of the distrust coefficient suggests that u’s distrusted users have strong preferences for item z, so we may assume that user u does not like the item.
3.2. Data Description
Epinions dataset originates from a popular online consumer reviews website (www.epinions.com). It provides “distrust network” which is not considered in other datasets such as Ciao, Flim Trust, etc. In Epinions dataset, users mark their trust user as “1” and distrust users as “−1”. To simplify our work, we collected 103,286 users and 415,877 items from the original dataset. The dataset contains trust and distrust relations. In addition, we removed all negative ratings of less than 4 stars, as suggested by Zhao et al. [10], and eventually obtained 1,255,757 positive feedback and 297,781 trust and distrust relations (See Table 1).
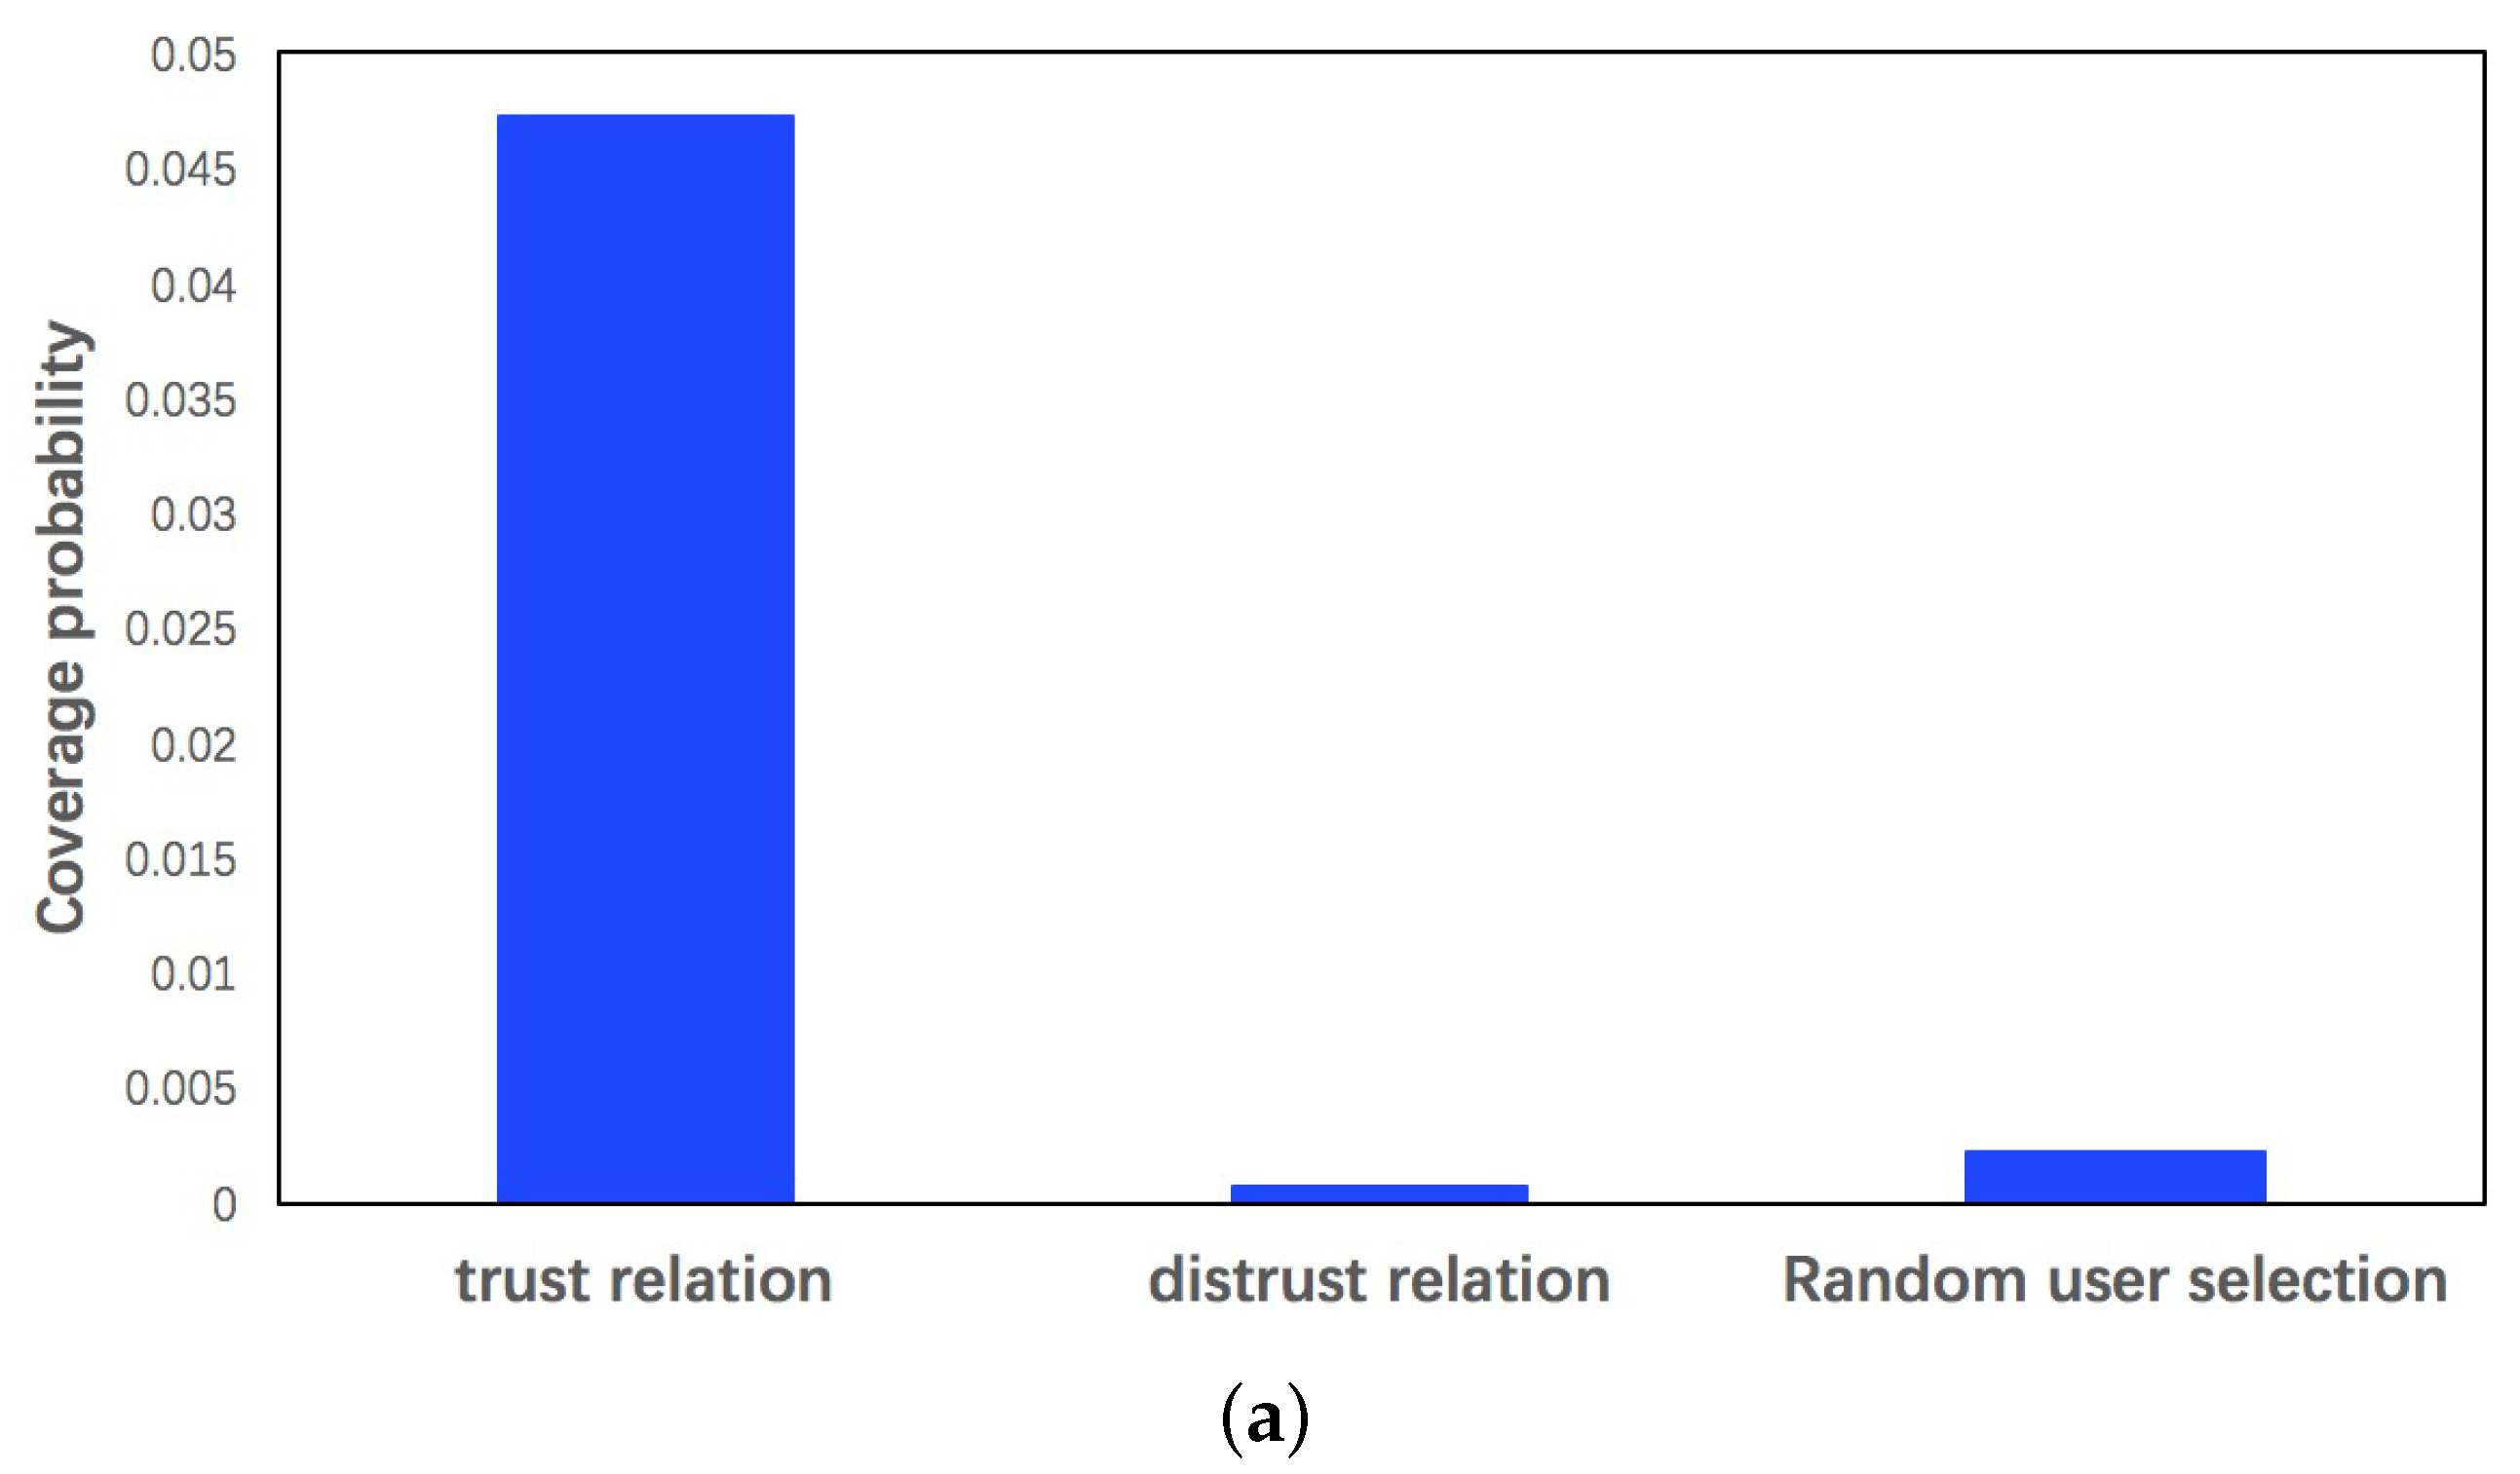
Figure 1a shows the item possibility which preferred by the user and her distrusted users. To make our analysis more convincing, we make a comparisons in three different settings: items preferred by the user and her trusted users, an item preferred by the user and her distrusted users, and items preferred by the user and random users. In all cases, we can clearly see that the second possibility is the lowest. It indicates that a user would prefer items that selected by random users rather than by her distrusted users. Figure 1b indicates the probability of preferring an item increases as the number of trusted users who have prefer it increases, and the probability of a user not preferring an item increases as more and more distrusted users prefer the item.
4. The Proposed Method
Our model assumptions about positive feedback, trust feedback, distrust feedback, and neutral feedback are investigated in detail in this section, and the proposed TNDBPR model is discussed thoroughly. Unlike existing ranking models, we leverage distrust feedback from users’ social networks.
4.1. Model Assumptions
Irwin King et al. [10] described their hypothesis based on the comparison of the users’ two pairwise preferences:
where , and represent a user u’s preference on positive feedback i, trust feedback k, and neutral feedback j, respectively. indicates that the user prefers item k to item j.
In our work, we extend the two pairwise preferences presented in [10] resulting in three pairwise preferences assumptions. They are expressed in Assumptions 1 and 2, respectively:
Assumption 1.
A user would prefer positive feedback to trust feedback, prefer trust feedback to neutral feedback, and prefer neutral feedback to distrust feedback.
where , , and represent the preference on positive feedback i, trust feedback k, neutral feedback j, and distrust feedback z, respectively. The “unobserved” feedback consists of trust feedback, neutral feedback and distrust feedback. Obviously, the assumption we propose is more reasonable and comprehensive than the assumption in Equation (5) since it fully considered the impact of trust, distrust, and positive feedback on user preferences.
Alternatively, considering that users’ distrust feedback may not be worse than that of the neutral feedback, we also take the following assumption and verify it in the experiments.
Assumption 2.
A user would prefer positive feedback to trust feedback, prefer trust feedback to neutral feedback, and prefer trust feedback to distrust feedback.
The main difference between Assumptions 1 and 2 is the preference order of neutral feedback and distrust feedback. However, their model structure and learning method are the same. Note that we focus on discuss formal assumption and will experimentally compare them in Section 5.
4.2. Model Formulation
We take Equation (6) as the task to maximize the value of . Therefore, the optimization criteria for each user u are stated as follow:
where , , . , and are indicator functions. They are equal to 1 if , , and , and 0 otherwise. Equation (8) expresses the major hypothesis for specific user that the ranking of preference from large to small is positive feedback, trust feedback, neutral feedback and distrust feedback, successively.
The formula above can be changed to Equation (9) for maximizing value due to the integrity and antisymmetry of a pairwise ordering scheme discussed in [30].
When optimizing , we use a sigmoid function to approximate the function . Therefore, we maximize the objective function as follow.
In Equation (10), a regularization term is used to prevent overfitting. Matrix factorization is used to build the preference function model, , , , and . Here, , and d is the number of latent factors. The coefficients and are used to control the achievements of sampling training to the objective function. In more detail, calculates how many distrusted users of user u have selected item z. The more user’s distrusted users choose the item, the larger the will be, and thus the more likely that u will not choose this item. calculates how many trusted users of user u have selected item k. The more user’s trusted users choose the item, the larger the will be, and thus the more likely that the user will choose this item.
4.3. Model Learning and Complexity
We optimize the objective function Equation (10) with stochastic gradient descent . Algorithm 1 describes the procedure and gradient descent rules of TNDBPR in detail. Particularly, all the variables are initialized with random small values in (0, 0.1) (Line 1). For each iteration (Lines 3–23), we randomly select (positive, trust), (trust, neutral), and (neutral, distrust) feedback pairs from , , and , to test the model. The variables b, P, and Q are renewed based on SGD rules (Lines 11–22). The process is repeated until the loss value converges reach the maximum number of iterations. Finally, all learning variable quantities return to output state (Line 25). The calculation time of TNDBPR is mainly divided into two stages: (1) Model training for computing gradients and updating rules (Line 5–27, Algorithm 1). The whole complexity in Algorithm 1 is O() where f and l are the number of iterations and training samples, respectively. We set the number of training samples l to . (2) In model testing process, we calculate ranking scores for candidate items. The complexity is O(), where is the number of testing users and is the number of testing items.
| Algorithm 1 The learning algorithm of TNDBPR model. |
input: and a social network
|
5. Experiments
5.1. Experiment Settings
We conducted a serial of experiments on the Epinions dataset to verify the effectiveness of our proposed method. The five-fold cross validation method was used. That is, the dataset was split into five folds with one randomly used for test sets and others for training sets.
We adopted (F1 Score @N), , , , and to evaluate the recommendation performance. Among these metrics, NDCG is used to evaluate ranked list as it gives higher reward for the top items in a recommended list. is defined as:
where , is 1 if recommended item at position i in the ranking is a hit item, and 0 otherwise. IDCG@N is the DCG@N of the sorted optimal ranked list.
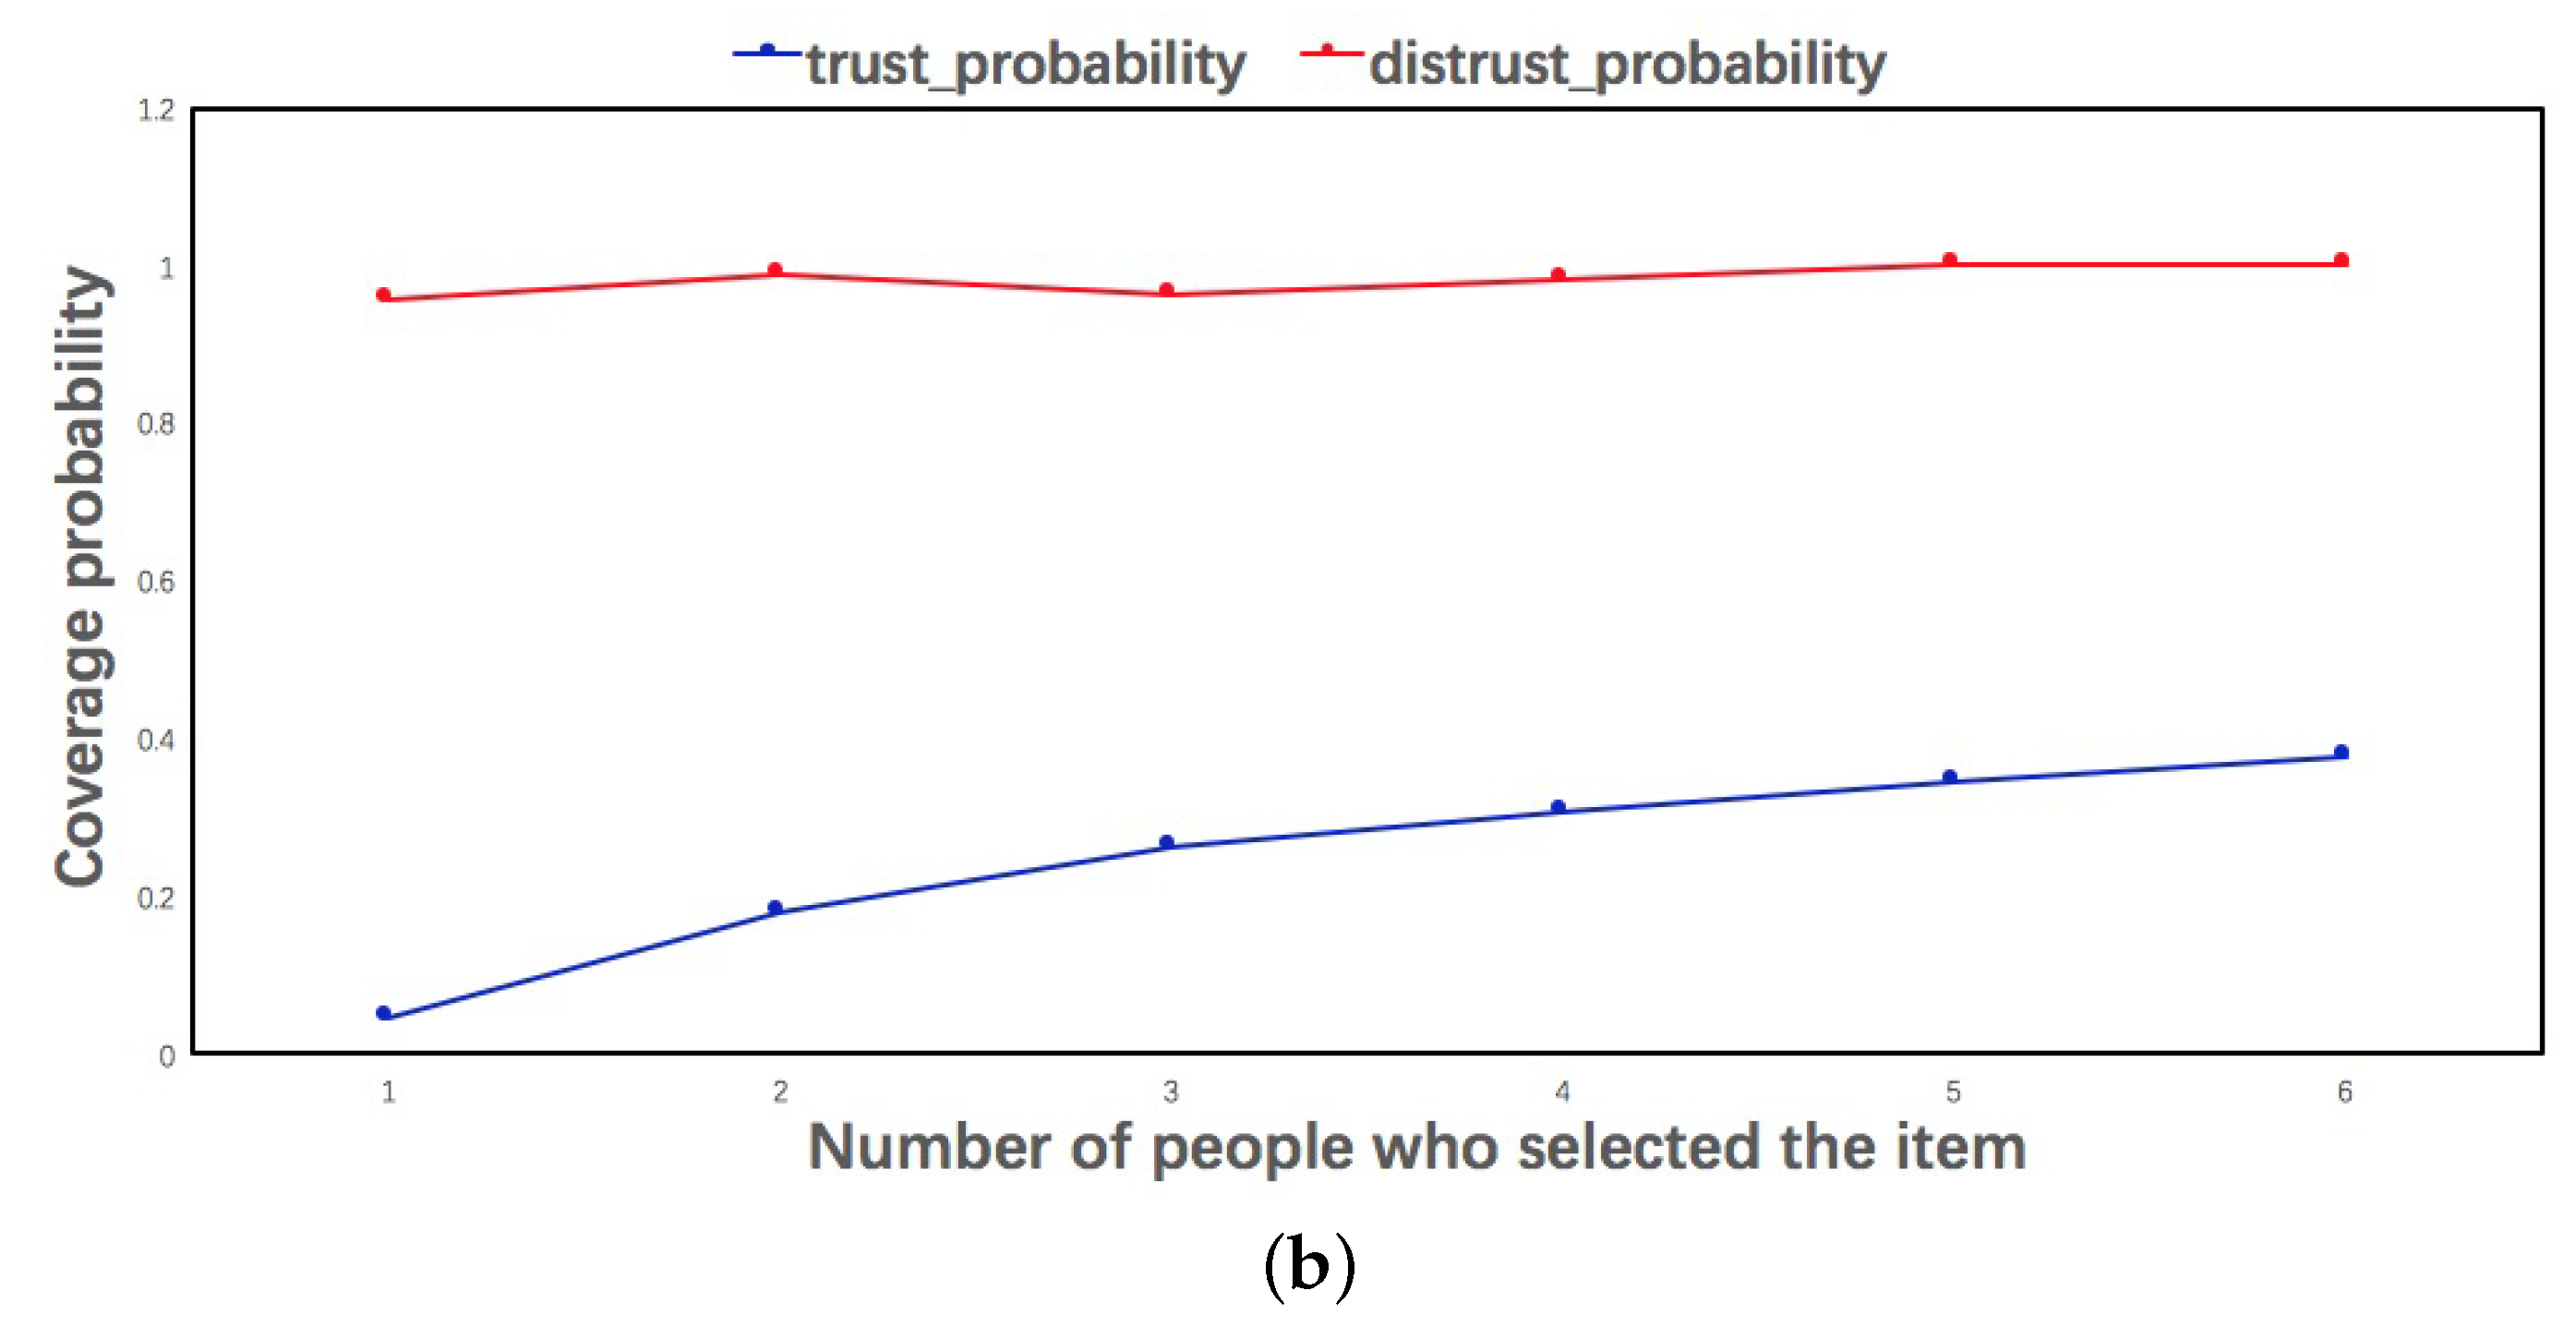
We applied grid search to obtain the optimal regularization parameter . As can be seen in Figure 2, when the parameters was set to 0.1, the model TNDBPR achieves the best performance.
5.2. Comparison Methods
To verify the advantages of our method, we compared TNDBPR with the following recommendation approaches. Note that we only compared with ranking methods, because our target is item ranking not rating prediction.
RankSGD [31]: Based on the matrix decomposition model and the stochastic gradient descent optimizer, a SVD and AFM based on sorting objective function are proposed.
SBPR [10]: The model uses trust relations to effectively estimate users’ rankings.
GBPR [14]: This work relaxes the assumption of BPR into a pair of preference hypotheses. The personal positive feedback model is smoothed by aggregating a set of user preferences, and increase the confidence of pairwise classification. Here, we fixed the number of users to 5.
MostPop: This approach provides a list of non-personalized ranked items based on the frequency the items are selected among all users.
TNDBPR-1 and TNDBPR-2 correspond to Assumptions 1 and 2 in Section 4, respectively. TNDBPR-3 corresponds to the case in which distrust coefficient is set to constant 1 in Assumption 1.
5.3. Recommendation Performance
The recommendation performance comparisons on various estimations are shown in Table 2. Specially, the number of latent factors are fixed as 10, and “Improve” represents the improvement of our algorithm TNDBPR-1 over SBPR. Table 2 shows that TNDBPR-1 is the best method in all of approaches including SBPR and GBPR. One possible reason is that SBPR and GBPR cannot simulate how distrust feedback directly affects users’ preferences for items, especially when both the users’ positive feedback and trust feedback are sparse. In this case, distrust feedback can have a great influence on the recommendation result. The better performance of TNDBPR-1 compared to TNDBPR-3 indicates that the distrust coefficient may have great influence of the model.
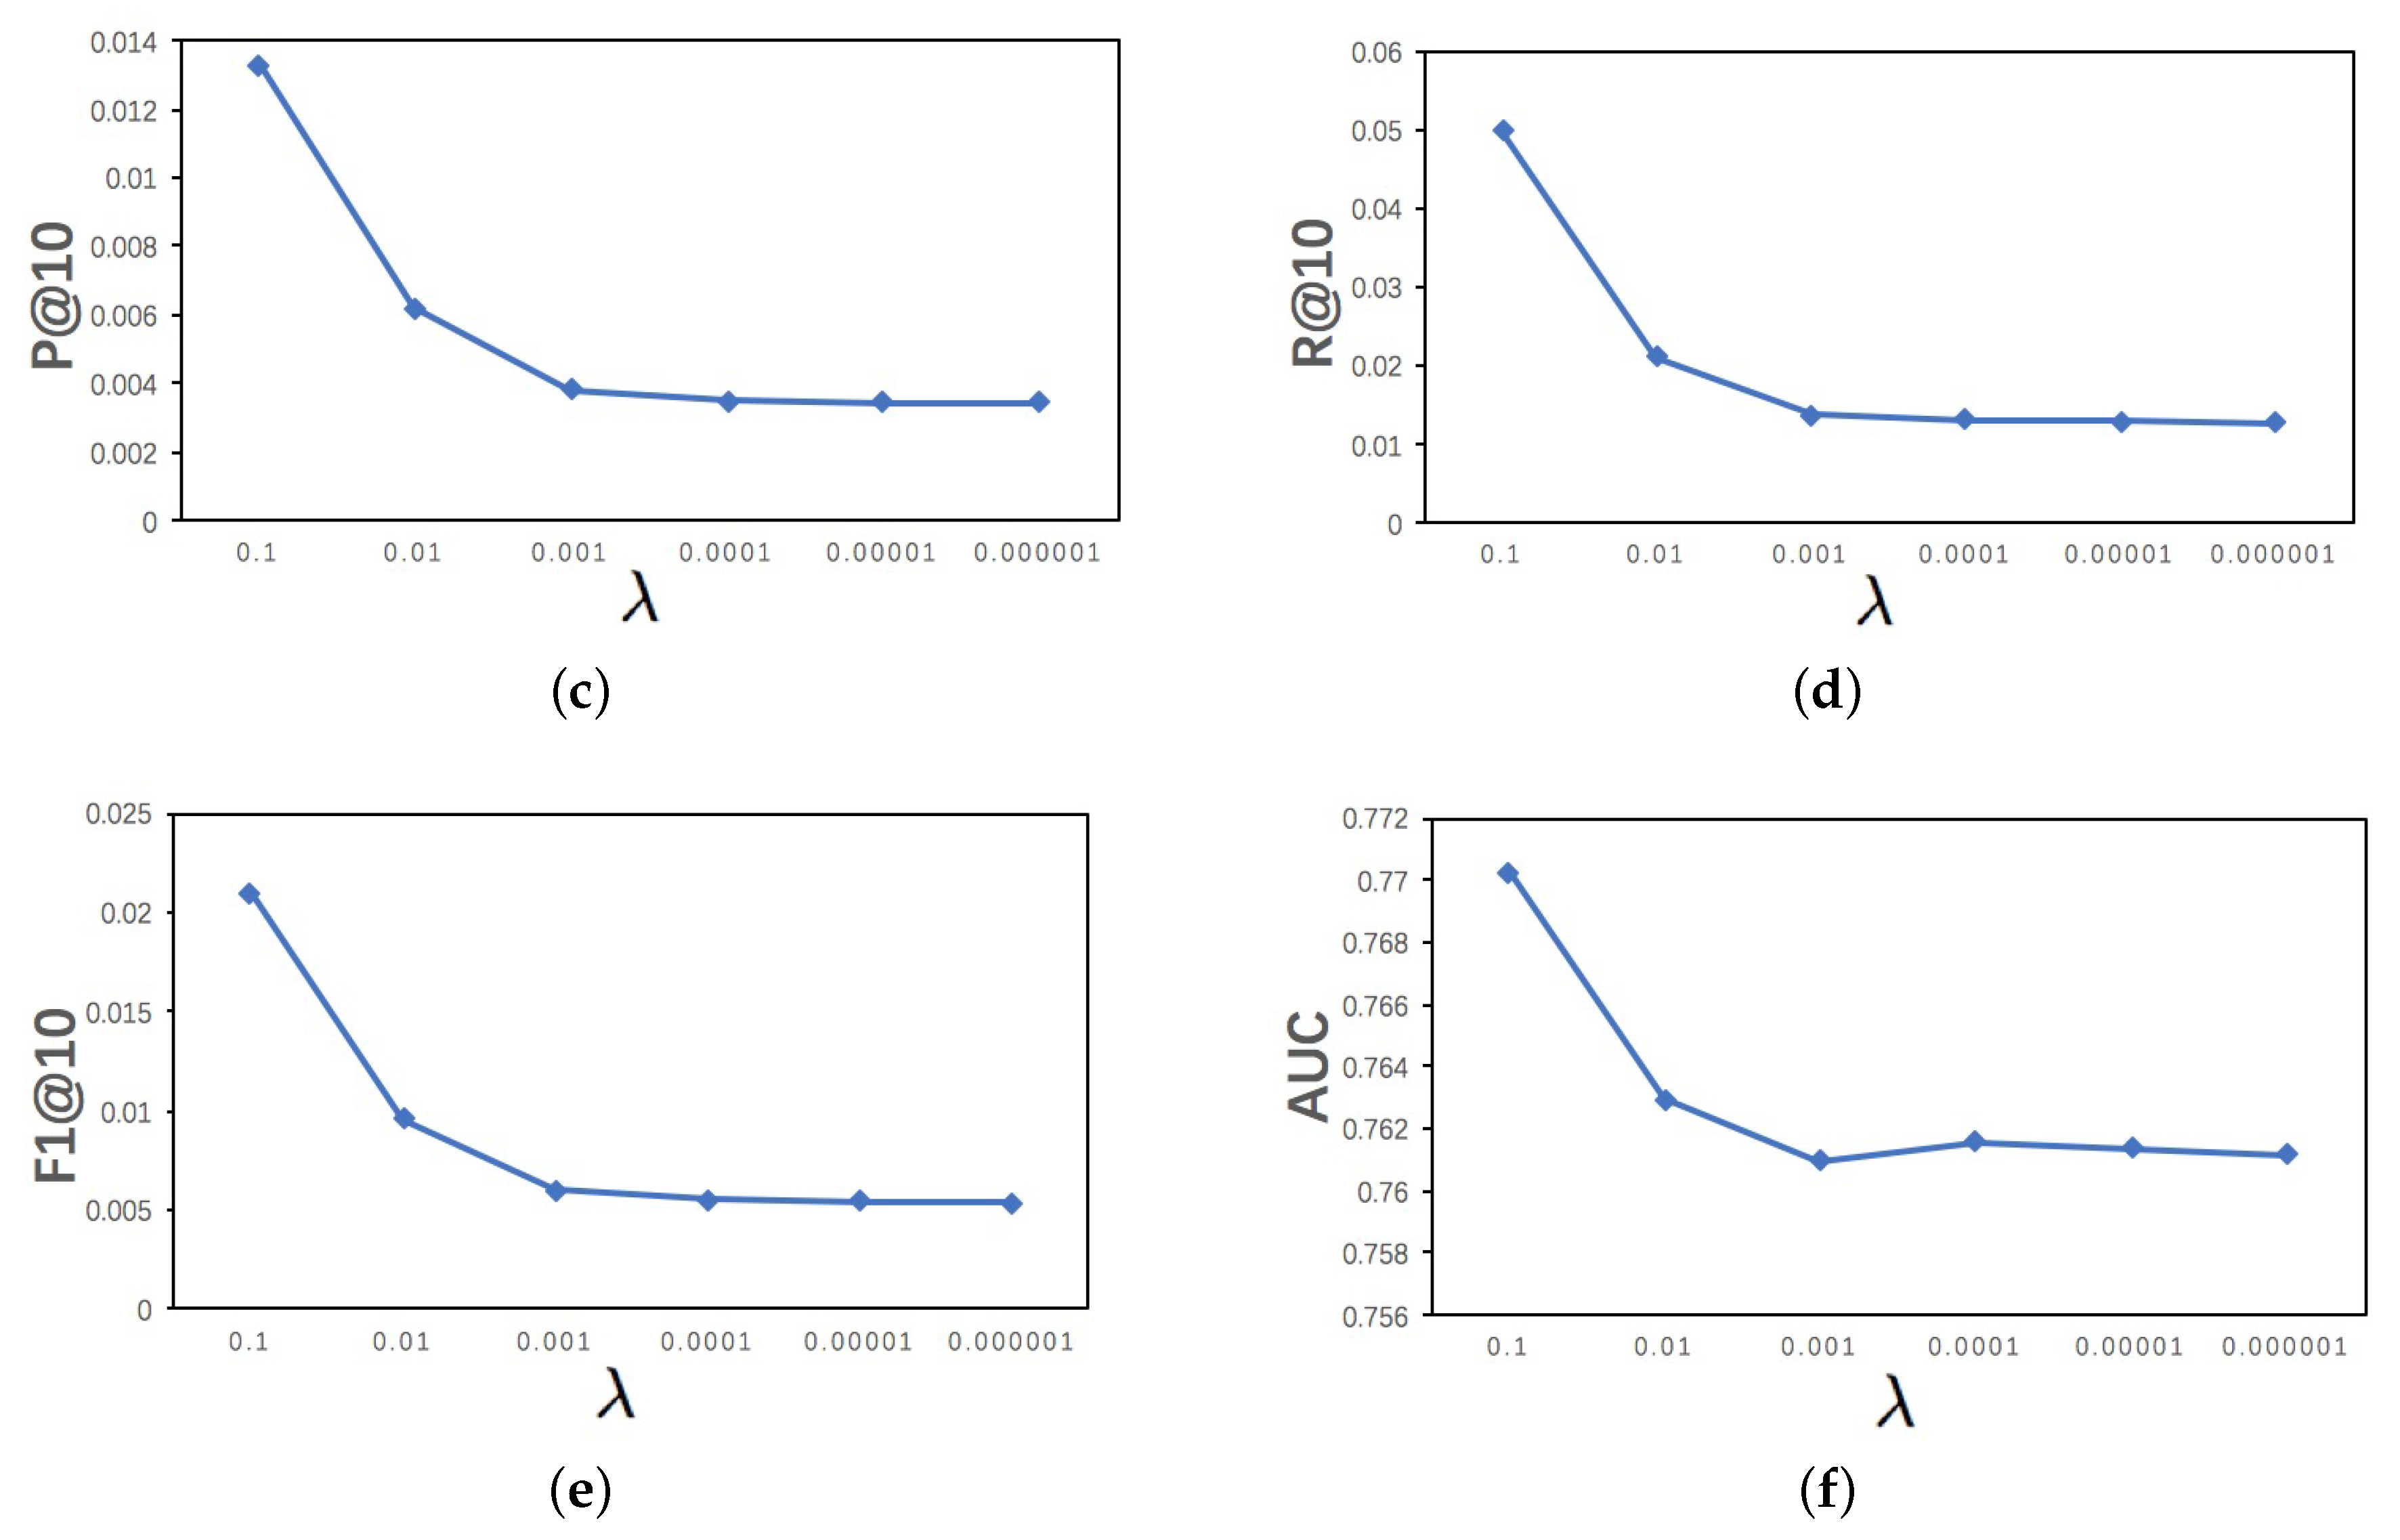
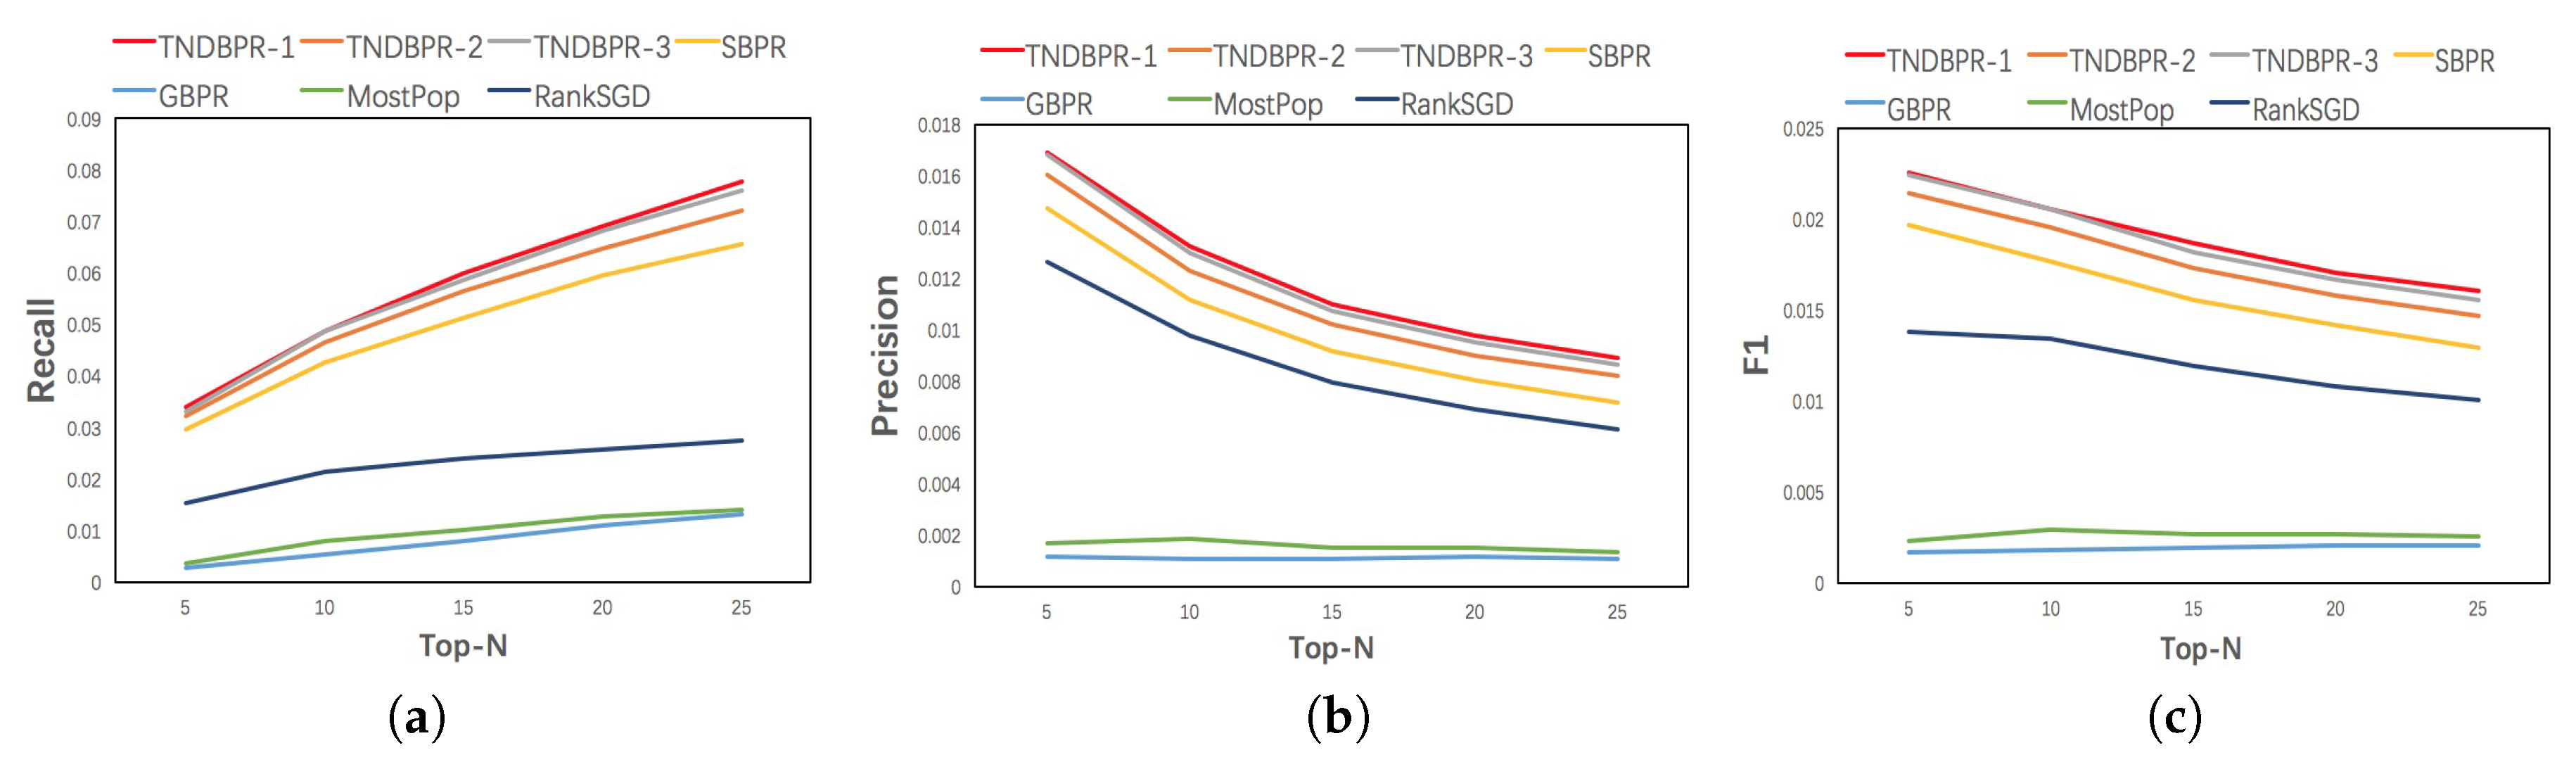
In fact, the length of the list of recommended items (Top-N) for the user also has a great impact on users’ experience. Therefore, we performed experiments on TNDBPR and other algorithms by changing N from 5 to 25. The results are presented in Figure 3. We can observe that the performance of our TNDBPR is always better than other methods as N increases. In addition, the performance gap between TNDBPR-1 and TNDBPR-3 on R@N, P@N and F1@N becomes larger and larger. When N changes from 5 to 25, TNDBPR-1 on R@N rises from 0.033 to 0.077, and SBPR on R@N rises from 0.027 to 0.065. When N changes from 5 to 25, TNDBPR-1 on P@N reduces from 0.017 to 0.009, and SBPR on P@N reduces from 0.014 to 0.007. When N changes from 5 to 25, TNDBPR-1 on F1@N reduces from 0.022 to 0.016, and SBPR on F1@N reduces from 0.019 to 0.012. Compared with the best method SBPR, TNDBPR-1 increases R@25 by 18.4%, P@25 by 28.5%, and F1@25 by 25%. The advantage of TNDBPR-1 is more obvious with the increase of N. It indicates the effectiveness of incorporating both distrust feedback and distrust coefficient in our model.
In Section 4, we have proposed two preference sorting assumptions based on neutral and distrust feedback and compare the performance of them. From the experimental results, we find that TNDBPR-1 always outperforms TNDBPR-2, which indicates that users prefer to choose neutral feedback rather than distrust feedback. These results are also consistent with the observational analysis in Section 3.
As suggested in Section 3, we removed all negative ratings which are less than 4 stars to collect positive feedback. However, whether dropping these low ratings will affect the performance of our model is still a question. Therefore, we experimentally explored this issue and present the results in Table 3. Note that every model with right superscript “−” (such as ) represents its running in the dataset without dropping low ratings. We can observe that and perform worse than TNDBPR-1 and SBPR in the original dataset, respectively. It indicates that keeping low ratings confuses positive feedback collection, which could have an adverse impact on TNDBPR-1 and SBPR. In addition, the results also show that, without dropping low ratings, our proposed TNDBPR-1 still outputs best results in comparison with all the other methods.
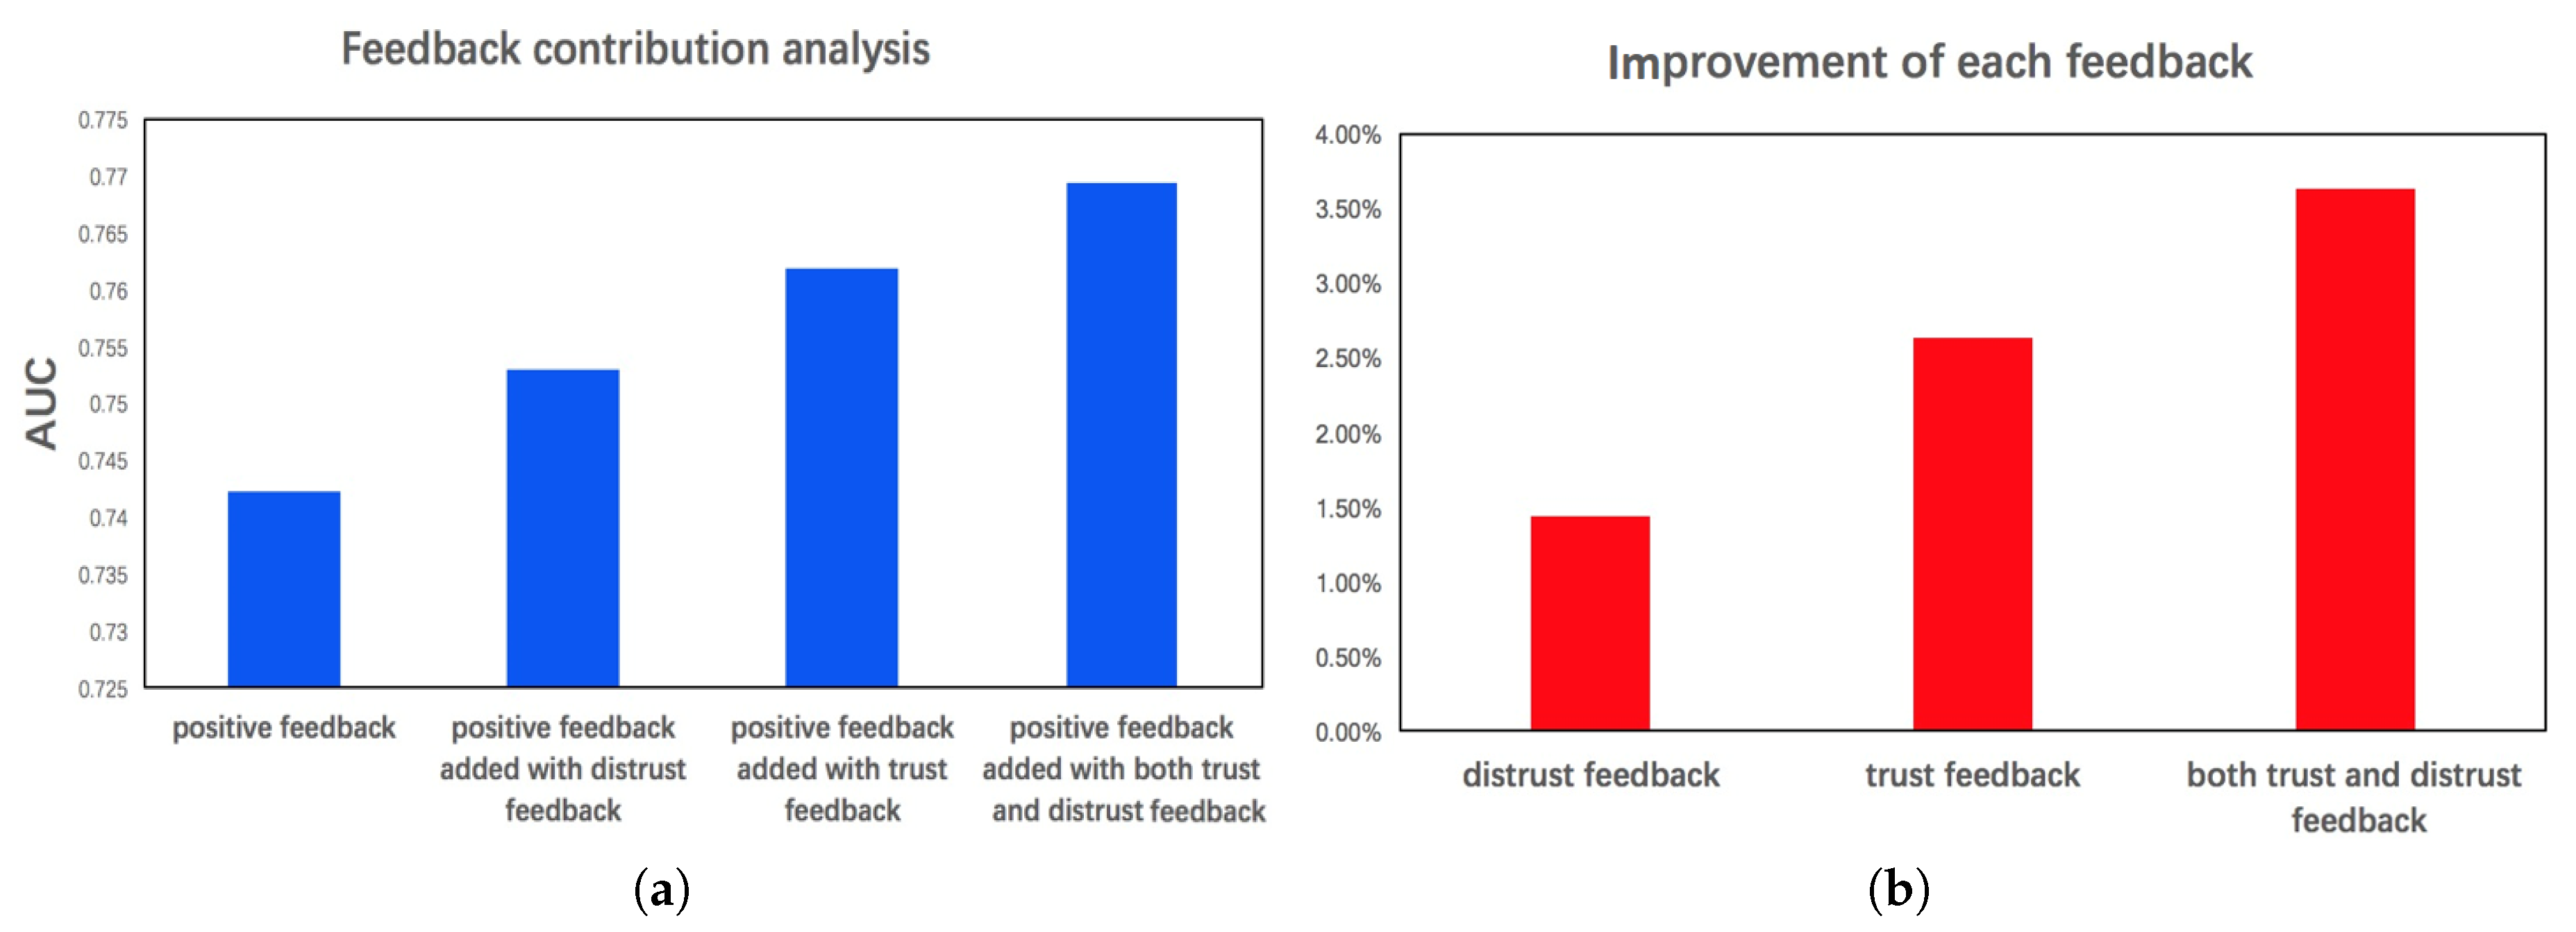
5.4. Feedback Analysis
Different from other ranking models, social feedback based on users’ trust and distrust relations is defined in TNDBPR model. We perform some comparison experiments to explore the effect of various feedback, including only positive feedback, positive feedback added with distrust feedback, positive feedback added with trust feedback, and positive feedback added with both trust and distrust feedback. results are presented in Figure 4. The best result is obtained by simultaneously using trust and distrust relations of users to identify social feedback. This demonstrates that combining both trust and distrust feedback can maximize the performance of our proposed model.
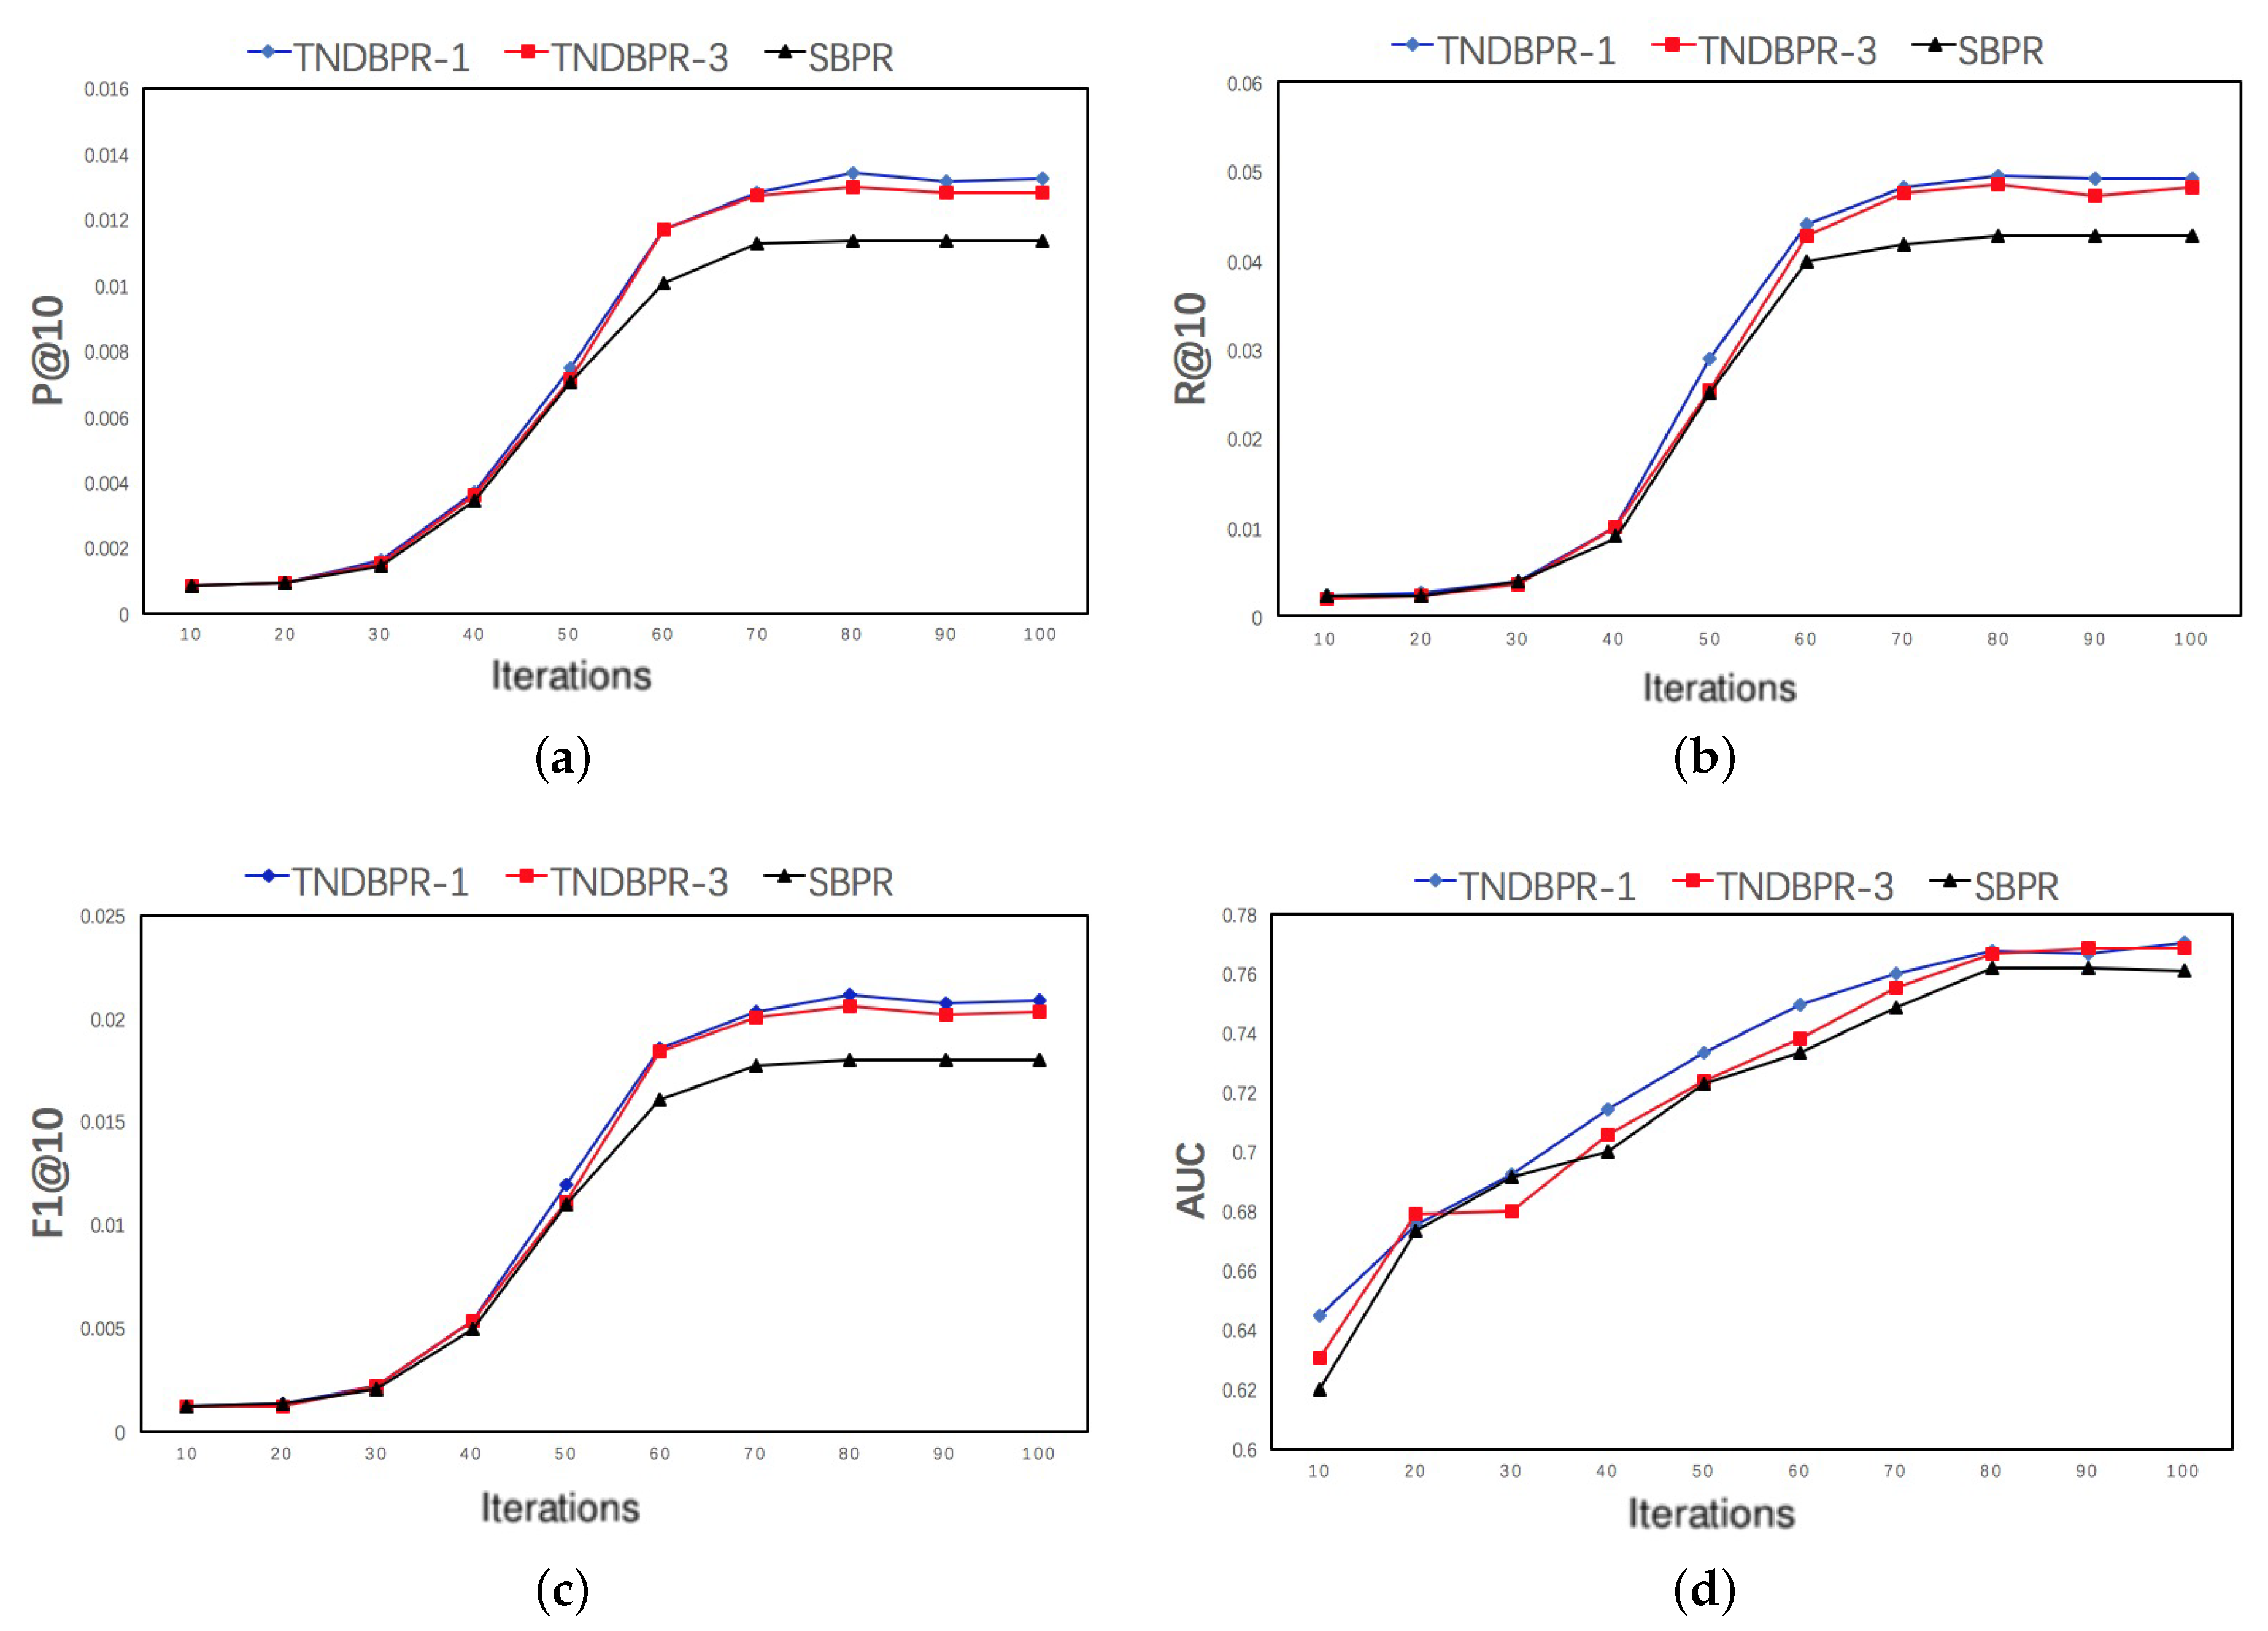
5.5. Convergence Analysis
The convergence of the SBPR, TNDBPR-1 and TNDBPR-3 were analyzed to further explore the efficiency of the models. To make them comparable, we set their learning rate to 0.001. Figure 5 shows the results of the comparison. We can find that, at the same number of iterations, our model TNDBPR-1 is always better than SBPR and TNDBPR-3. Figure 5a–c shows the convergence trends based on P@10, R@10 and F1@10, respectively. The convergence trends of three models are basically the same, and there is a great improvement in 40–60 iterations. Figure 5d shows the convergence trend of , which is relatively flat. Generally, the four evaluations all converge at 70–80 iterations. Therefore, by comparing convergence trend of TNDBPR-1 with SBPR and TNDBPR-3 respectively, we can conclude that the distrust feedback and distrust coefficient have little effect on convergence performance.
5.6. Run Time Comparisons
We executed all experiments on a server with 32 Genuine Intel(R) CPUs (2.6 GHz), 64 GB memory. The average running time of each model on Epinions dataset is shown in Table 4. We can observe that: (1) RankSGD takes the longest time to execute, whereas MostPop takes the shortest time; and (2) the three Bayesian personalized ranking models (TNDBPR, SBPR, and GBPR) spend almost the same running time cost. Comprehensively, TNDBPR is the optimal model since it achieves the highest recommendation accuracy.
6. Conclusions and Future Work
In this article, we designed a Bayesian personalized ranking model, called TNDBPR. Different from existing methods, TNDBPR leverages both trust relations and distrust relations for Top-N item recommendation. It adopts three Bayesian pairwise ordering scheme among trust feedback, neutral feedback, and distrust feedback of users. In addition, a trust coefficient and a distrust coefficient are introduced to enhance our model. We evaluated the performance of the proposed TNDBPR for different numbers of Top-N recommendations. In addition, we examined the ranking performance comparing with other methods. Our experiments on Epinions dataset showed that TNDBPR is constantly superior over all the competitive methods in all evaluations and in all settings. These results suggested that simultaneously leveraging users’ trust relations and distrust relations boosts item recommendation.
The limitation of this work include: (1) we focused on using users’ direct trust and distrust relations, and neglected users’ implicit trust and distrust relations for recommendation; (2) Only one dataset (Epinions) was used for the experiments. Therefore, we would like to extend TNDBPR as follows: (1) trying to use implicit trust and distrust relations in the model; and (2) preparing other datasets including both trust and distrust information and conduct extensive experiments to extrapolate our results.
Author Contributions
K.X., Y.X. and Y.C. designed the problem definition and theoretical analysis. Y.X., K.X. and Y.C. designed and performed the experiments. Y.X. and K.X. analyzed the data and wrote the paper. H.M. conceived the theoretical analysis. All authors have read and approved the final manuscript.
Funding
This work was supported by the Guangdong Provincial Scientific and Technological Fund (2017B090910005), the Fundamental Research Funds for the Central Universities, SCUT (No. 2017ZD048), the Tiptop Scientific and Technical Innovative Youth Talents of Guangdong special support program (No. 2015TQ01X633), the Science and Technology Planning item of Guangdong Province (Nos. 2016A030310423 and 2017B050506004), the Science and Technology Program of Guangzhou International Science Technology Cooperation Program (No. 201704030076) and the Science and Technology Planning Major item of Guangdong Province (No. 2015A070711001).
Acknowledgments
We thank the anonymous reviewers for their comments and suggestions.
Conflicts of Interest
The authors declare no conflict of interest.
References
- Burke, M.; Kraut, R. Mopping up: Modeling wikipedia promotion decisions. In Proceedings of the 2008 ACM Conference on Computer Supported Cooperative Work, San Diego, CA, USA, 8–12 November 2008; pp. 27–36. [Google Scholar]
- Yang, S.H.; Long, B.; Smola, A.; Sadagopan, N.; Zheng, Z.; Zha, H. Like like alike:joint friendship and interest propagation in social networks. In Proceedings of the 20th International Conference on World Wide Web, Hyderabad, India, 28 March–1 April 2011; pp. 537–546. [Google Scholar]
- Pan, R.; Zhou, Y.; Cao, B.; Liu, N.N.; Lukose, R.; Scholz, M. One-class collaborative filtering. In Proceedings of the 2008 Eighth IEEE International Conference on Data Mining, Pisa, Italy, 15–19 December 2008; pp. 502–511. [Google Scholar]
- Rendle, S.; Schmidt-Thieme, L. Pairwise interaction tensor factorization for personalized tag recommendation. In Proceedings of the Third ACM International Conference on Web Search and Data Mining, New York, NY, USA, 3–6 February 2010; pp. 81–90. [Google Scholar]
- Krohn-Grimberghe, A.; Drumond, L.; Freudenthaler, C.; Schmidt-Thieme, L. Multi-relational matrix factorization using Bayesian personalized ranking for social network data. In Proceedings of the Fifth ACM International Conference on Web Search and Data Mining, Seattle, WA, USA, 8–12 February 2012; pp. 173–182. [Google Scholar]
- Yang, S.H.; Long, B.; Smola, A.J.; Zha, H.; Zheng, Z. Collaborative competitive filtering: Learning recommender using context of user choice. In Proceedings of the 34th International ACM SIGIR Conference on Research and Development in Information Retrieval, Beijing, China, 25–29 July 2011; pp. 295–304. [Google Scholar]
- Anand, D.; Bharadwaj, K.K. Pruning trust–distrust network via reliability and risk estimates for quality recommendations. Soc. Netw. Anal. Min. 2013, 31, 65–84. [Google Scholar] [CrossRef]
- Forsati, R.; Mahdavi, M.; Shamsfard, M.; Sarwat, M. Matrix Factorization with Explicit Trust and Distrust Side Information for Improved Social Recommendation. ACM Trans. Inf. Syst. 2014, 32, 17. [Google Scholar] [CrossRef]
- Jamali, M.; Ester, M. Using a trust network to improve top-n recommendation. In Proceedings of the Third ACM Conference on Recommender Systems, New York, NY, USA, 22–25 October 2009; pp. 181–188. [Google Scholar]
- Zhao, T.; Mcauley, J.; King, I. Leveraging Social Connections to Improve Personalized Ranking for Collaborative Filtering. In Proceedings of the 23rd ACM International Conference on Information and Knowledge Management, Shanghai, China, 3–7 November 2014; pp. 261–270. [Google Scholar]
- Shen, Y.; Jin, R. Learning personal + social latent factor model for social recommendation. In Proceedings of the 18th ACM SIGKDD International Conference on Knowledge Discovery and Data Mining, Beijing, China, 12–16 August 2012; pp. 1303–1311. [Google Scholar]
- Ye, M.; Liu, X.; Lee, W.C. Exploring social influence for recommendation: A generative model approach. In Proceedings of the 35th International ACM SIGIR Conference on Research and Development in Information Retrieval, Portland, OR, USA, 12–16 August 2012; pp. 671–680. [Google Scholar]
- Du, L.; Li, X.; Shen, Y.D. User graph regularized pairwise matrix factorization for item recommendation. In Proceedings of the International Conference on Advanced Data Mining and Applications, Beijing, China, 17–19 December 2011; pp. 372–385. [Google Scholar]
- Pan, W.; Chen, L. GBPR: Group preference based Bayesian personalized ranking for one-class collaborative filtering. In Proceedings of the Twenty-Third International Joint Conference on Artificial Intelligence, Beijing, China, 3–19 August 2013; pp. 2691–2697. [Google Scholar]
- Hong, L.; Bekkerman, R.; Adler, J.; Davison, B.D. Learning to rank social update streams. In Proceedings of the 35th International ACM SIGIR Conference on Research and Development in Information Retrieval, Portland, OR, USA, 12–16 August 2012; pp. 651–660. [Google Scholar]
- Guo, L.; Jiang, H.; Wang, X. Location Regularization-Based POI Recommendation in Location-Based Social Networks. Information 2018, 9, 85. [Google Scholar] [CrossRef]
- De Meo, P.; Messina, F.; Rosaci, D.; Sarnéc, G.M.L. Combining trust and skills evaluation to form e-Learning classes in online social networks. Inf. Sci. Int. J. 2017, 405, 107–122. [Google Scholar] [CrossRef]
- Liu, H.; Xia, F.; Chen, Z.; Asabere, N.Y.; Ma, J.; Huang, R. TruCom: Exploiting Domain-Specific Trust Networks for Multicategory Item Recommendation. IEEE Syst. J. 2017, 11, 295–304. [Google Scholar] [CrossRef]
- Zhang, Z.; Xu, G.; Zhang, P.; Wang, Y. Personalized recommendation algorithm for social networks based on comprehensive trust. Appl. Intell. 2017, 47, 659–669. [Google Scholar] [CrossRef]
- De Meo, P.; Nocera, A.; Rosaci, D.; Ursino, D. Recommendation of reliable users, social networks and high-quality resources in a Social Internetworking System. AI Commun. 2011, 24, 31–50. [Google Scholar]
- Fotia, L.; Messina, F.; Rosaci, D.; Sarnéc, G.M.L. Using Local Trust for Forming Cohesive Social Structures in Virtual Communities. Comput. J. 2017, 60, 1717–1727. [Google Scholar] [CrossRef]
- Albanese, M.; Moscato, V.; Persia, F.; Picariello, A. A multimedia recommender system. Acm Trans. Internet Technol. 2013, 13, 3. [Google Scholar] [CrossRef]
- Ma, H.; Lyu, M.R.; King, I. Learning to recommend with trust and distrust relationships. In Proceedings of the Third ACM Conference on Recommender Systems, New York, NY, USA, 23–25 October 2009; pp. 189–196. [Google Scholar]
- Victor, P.; Verbiest, N.; Cornelis, C.; Cock, M.D. Enhancing the trust-based recommendation process with explicit distrust. Acm Trans. Web 2013, 7, 6. [Google Scholar] [CrossRef]
- Forsati, R.; Barjasteh, I.; Masrour, F.; Esfahanian, A.H.; Radha, H. PushTrust: An Efficient Recommendation Algorithm by Leveraging Trust and Distrust Relations. In Proceedings of the 9th ACM Conference on Recommender Systems, Vienna, Austria, 16–20 September 2015; pp. 51–58. [Google Scholar]
- Ghaznavi, F.; Alizadeh, S.H. Assessing Usage of Negative Similarity and Distrust Information in CF-Based Recommender System. In Proceedings of the 2017 Artificial Intelligence and Robotics (IRANOPEN), Qazvin, Iran, 9 April 2017; pp. 132–138. [Google Scholar]
- Fei, Z.Q.; Sun, W.; Sun, X.X.; Feng, G.Z.; Zhang, B.Z. Recommendation Based on Trust and Distrust Social Relationships. In Proceedings of the 2017 6th International Conference on Computer Science and Network Technology (ICCSNT), Dalian, China, 21–22 October 2017. [Google Scholar]
- Mahtar, S.N.A.M.; Masrom, S.; Omar, N.; Khairudin, N.; Rahim, S.K.N.A.; Rizman, Z.I. Trust aware recommender system with distrust in different views of trusted users. J. Fundam. Appl. Sci. 2017, 9, 168–182. [Google Scholar] [CrossRef]
- Chug, S.; Kant, V.; Jadon, M. Trust Distrust Enhanced Recommendations Using an Effective Similarity Measure. In Proceedings of the International Conference on Mining Intelligence and Knowledge Exploration, Hyderabad, India, 13–15 December 2017. [Google Scholar]
- Rendle, S.; Freudenthaler, C.; Gantner, Z.; Schmidt-Thieme, L. Bpr: Bayesian personalized ranking from implicit feedback. In Proceedings of the Twenty-Fifth Conference on Uncertainty in Artificial Intelligence, Montreal, QC, Canada, 18–21 June 2009; pp. 452–461. [Google Scholar]
- Jahrer, M. Collaborative filtering ensemble for ranking. In Proceedings of the International Conference on KDD Cup, San Diego, CA, USA, 21 August 2011; pp. 153–167. [Google Scholar]
Figure 1.
Preference Analysis: (a) coverage probability analysis; and (b) influence of social relations on selection probability.
Figure 1.
Preference Analysis: (a) coverage probability analysis; and (b) influence of social relations on selection probability.


Figure 2.
Analysis in Epinions DataSet: (a) effect on P@10 when varying the ; (b) effect on R@10 when varying the ; (c) effect on F1@10 when varying the ; and (d) effect on when varying the .
Figure 2.
Analysis in Epinions DataSet: (a) effect on P@10 when varying the ; (b) effect on R@10 when varying the ; (c) effect on F1@10 when varying the ; and (d) effect on when varying the .

Figure 3.
Top-N Analysis. (a) Recall; (b) Precision; (c) F1.

Figure 4.
Feedback Analysis. (a) Feedback contribution analysis; (b) Improvement of each feedback.

Figure 5.
Convergence Analysis in Epinions DataSet: (a) effect on P@10 when varying the iteration; (b) effect on R@10 when varying the iteration; (c) effect on F1@10 when varying the iteration; and (d) effect on when varying the iteration.
Figure 5.
Convergence Analysis in Epinions DataSet: (a) effect on P@10 when varying the iteration; (b) effect on R@10 when varying the iteration; (c) effect on F1@10 when varying the iteration; and (d) effect on when varying the iteration.


Table 1.
Statistics of the Epinions dataset.
| Statistics | Quantity |
|---|---|
| Number of Users | 103,286 |
| Number of Item | 415,877 |
| Number of Observed feedback | 1,255,757 |
| Number of Social relations | 297,781 |
| Number of Average Positive feedback | 12 |
| Number of Average trust | 6 |
| Number of Average distrust | 3 |
Table 2.
Comparison results on Epinions dataset.
| Method | P@10 | R@10 | AUC | F1@10 | NDCG@10 |
|---|---|---|---|---|---|
| Improve | 14.30% | 13.90% | 1.10% | 14.20% | 2.50% |
| TNDBPR-1 | 0.01327 | 0.04978 | 0.77027 | 0.02096 | 0.14364 |
| TNDBPR-2 | 0.01195 | 0.04500 | 0.763187 | 0.01888 | 0.141392 |
| TNDBPR-3 | 0.01302 | 0.04863 | 0.76992 | 0.02054 | 0.142687 |
| SBPR | 0.01138 | 0.04286 | 0.76191 | 0.01798 | 0.14001 |
| GBPR | 0.00100 | 0.00539 | 0.74040 | 0.00169 | 0.10895 |
| MostPop | 0.00180 | 0.00803 | 0.70412 | 0.00294 | 0.10207 |
| RankSGD | 0.00979 | 0.02120 | 0.54189 | 0.01339 | 0.10583 |
Table 3.
Comparison results on Epinions dataset without dropping low ratings.
| Method | P@10 | R@10 | AUC | F1@10 | NDCG@10 |
|---|---|---|---|---|---|
| TNDBPR-1 | 0.01327 | 0.04978 | 0.77027 | 0.02076 | 0.14364 |
| 0.01133 | 0.04178 | 0.76607 | 0.01782 | 0.01374 | |
| SBPR | 0.01138 | 0.04286 | 0.76191 | 0.01798 | 0.14001 |
| 0.00997 | 0.03442 | 0.75647 | 0.01546 | 0.13270 | |
| GBPR | 0.00100 | 0.00539 | 0.74040 | 0.00169 | 0.10895 |
| 0.00103 | 0.00566 | 0.72690 | 0.00172 | 0.10120 | |
| MostPop | 0.00180 | 0.00803 | 0.70412 | 0.00294 | 0.10207 |
| 0.00153 | 0.00741 | 0.70944 | 0.00253 | 0.10124 | |
| RankSGD | 0.00979 | 0.02120 | 0.54189 | 0.01339 | 0.10583 |
| 0.00981 | 0.02193 | 0.50420 | 0.01355 | 0.11412 |
Table 4.
Average execution time on Epinions dataset.
| TNDBPR | SBPR | GBPR | MostPop | RankSGD | |
|---|---|---|---|---|---|
| Average time | 61 min | 59 min | 55 min | 39 min | 574 min |
© 2018 by the authors. Licensee MDPI, Basel, Switzerland. This article is an open access article distributed under the terms and conditions of the Creative Commons Attribution (CC BY) license (http://creativecommons.org/licenses/by/4.0/).
Share and Cite
MDPI and ACS Style
Xu, Y.; Xu, K.; Cai, Y.; Min, H. Leveraging Distrust Relations to Improve Bayesian Personalized Ranking. Information 2018, 9, 191. https://doi.org/10.3390/info9080191
AMA Style
Xu Y, Xu K, Cai Y, Min H. Leveraging Distrust Relations to Improve Bayesian Personalized Ranking. Information. 2018; 9(8):191. https://doi.org/10.3390/info9080191
Chicago/Turabian StyleXu, Yangjun, Ke Xu, Yi Cai, and Huaqing Min. 2018. "Leveraging Distrust Relations to Improve Bayesian Personalized Ranking" Information 9, no. 8: 191. https://doi.org/10.3390/info9080191
Note that from the first issue of 2016, this journal uses article numbers instead of page numbers. See further details here.