Article

Predicting Fluid Intelligence by Components of Reaction Time Distributions from Simple Choice Reaction Time Tasks

by
Yoanna Schulz-Zhecheva
1,
Manuel C. Voelkle
2,3,
André Beauducel
4,
Monica Biscaldi
1 and
Christoph Klein
1,5,6,*
1
Department of Child and Adolescent Psychiatry, University of Freiburg, Hauptstrasse 8, Freiburg D-79104, Germany
2
Department of Psychology, Humboldt University, Unter den Linden 6, Berlin D-10099, Germany
3
Max Planck Institute for Human Development, Lentzallee 94, Berlin D-14195, Germany
4
Department of Psychology, University of Bonn, Kaiser-Karl-Ring 9, Bonn D-53111, Germany
5
Department of Child and Adolescent Psychiatry, Medical Faculty, University of Cologne, Robert-Koch-Straße 10, Cologne D-50931, Germany
6
School of Psychology, Bangor University, Penrallt Rd, Bangor LL57 2AS, Wales, UK
*
Author to whom correspondence should be addressed.
Submission received: 20 May 2016 / Revised: 11 July 2016 / Accepted: 13 July 2016 / Published: 18 July 2016
(This article belongs to the Special Issue Mental Speed and Response Times in Cognitive Tests)

Abstract

:
Mean reaction times (RT) and the intra-subject variability of RT in simple RT tasks have been shown to predict higher-order cognitive abilities measured with psychometric intelligence tests. To further explore this relationship and to examine its generalizability to a sub-adult-aged sample, we administered different choice RT tasks and Cattell’s Culture Fair Intelligence Test (CFT 20-R) to n = 362 participants aged eight to 18 years. The parameters derived from applying Ratcliff’s diffusion model and an ex-Gaussian model to age-residualized RT data were used to predict fluid intelligence using structural equation models. The drift rate parameter of the diffusion model, as well as σ of the ex-Gaussian model, showed substantial predictive validity regarding fluid intelligence. Our findings demonstrate that stability of performance, more than its mere speed, is relevant for fluid intelligence and we challenge the universality of the worst performance rule observed in adult samples.

1. Introduction

The empirical link between performance in elementary speed tasks and higher order cognition such as intelligence or reasoning ability has been consistently reported for a variety of populations and paradigms [1,2], including tasks with minimal cognitive demands [3], and has been the primary topic of research into the mental chronometry of individual differences for decades. While this mental speed approach to intelligence can now refer to a substantial body of evidence, other views emphasize the cross-temporal consistency of attentional performance as beneficial [4] and an increased fluctuation or “intra-subject variability” (ISV) of performance as detrimental to the successful solving of complex intelligence test items [5,6]. Thus, although mean processing speed and its variability constitute highly positively correlated constructs [7], they may exhibit a considerable amount of non-shared variance, independently related to intelligence [5,8]. In direct comparisons, however, the correlation between the ISV of reaction times (RT) (typically measured as the intra-subject RT standard deviation (RTSD)), and intelligence appears to be larger compared to the correlation of the mere speed (mean or median) of RT and intelligence [6,8].
One of the manifestations of the close link between ISV and intelligence is the observation that the slowest reaction times (RTs) of a person predict intelligence better than the fastest or average RTs. This regularity, termed the Worst Performance Rule (WPR) by Larson and Alderton [9], has been repeatedly reported for different populations, RT measures, tasks and modalities and does not appear to be a consequence of data artifacts such as outliers, variance restriction or reliability problems (for a review see [10]). Not all studies, however, were able to support the WPR [11,12].
While the research published so far clearly suggests some link between ISV and intelligence, the common use of fairly non-specific measures of ISV—that is, RTSD and the analysis of individual RT bands or percentile ranks—has prevented determination of the specific quality of this link (for an exception, see the study by Schmiedek, Oberauer, Wilhelm, Süss and Wittmann [13], which will be discussed in more detail further below). RTSD, the ISV parameter employed in the majority of the published work, is sensitive to all kinds of ISV (e.g., trends, recurrent slow responses, quasi-periodic fluctuations) and thus specific to none [14]. The analysis of RT band or percentile ranks, conversely, may provide more specific intelligence-related parameters (as expressed in the WPR), but cannot be considered as a model of the entire RT distribution.
There are, however, at least two approaches to model the entire RT distribution as the primary manifestation of ISV, with one of them further accounting for the (in)stability of response accuracy, or error rate, as another important facet of ISV. These models are the ex-Gaussian model (eGM) and Ratcliff’s Diffusion Decision Model (DDM), which will be briefly introduced in the following paragraphs.
The eGM is a general mathematical model that has been adopted to model RT data and accounts for the right-skewed shape of empirical RT distributions by differentiating between a Gaussian and an exponential part of the distribution. The mean and the standard deviation of the Gaussian part are denoted μ and σ, while the exponential part is reflected by the parameter τ, which is closely related to the thickness of the tail and characterizes rather long RTs (for a more detailed description and a graphical illustration see [15], p. 429). This model has repeatedly been shown to adequately describe empirical data in a number of paradigms [16,17] and to differentiate clinical groups with increased ISV from controls [14,18]. Less clear, however, is the theoretical interpretation of the ex-Gaussian parameters. It has been suggested that the exponential part reflects rather controlled attention-demanding processes (e.g., decision-making), while the Gaussian part is closer related to more stimulus-driven automatic processes (e.g., motor response) [19,20]. However, there are considerable theoretical and empirical inconsistencies regarding the interpretation of the ex-Gaussian parameters in terms of cognitive processes [21].
In contrast to the eGM, which is not a genuine psychological model of RT, the DDM [22], excellently explained and graphically illustrated by Ratcliff and McKoon [23] (p. 31), provides such theoretical foundations and makes assumptions about the underlying processes responsible for RT distributions. In addition, it models not only response latencies but also accuracies, therefore accounting for speed accuracy trade-offs. DDM assumes that RTs rise from a noisy process of information accumulation until a criterion level for a decision is reached. The mean rate of the accumulation process (drift rate, v) is considered to reflect cognitive ability. The response criterion (boundary separation, a) reflects the amount of information needed for a decision and is considered to be a measure for conservatism. The duration of encoding and motor processes is reflected by an additive non-decisional component (non-decisional time, t0). Trial-to-trial variabilities of the drift rate (sv), the starting point for the accumulation of information (szr) and non-decision time (st0) can also be estimated. DDM parameters have been shown to provide a good empirical fit for RT distributions from different tasks and show differential sensitivity to experimental manipulations [24,25,26,27].
Despite the described advantages, so far only one study has investigated the relationship between ISV and higher cognition using the eGM and the DDM. In their seminal work, Schmiedek et al. [13] were able to identify common latent factors for the main eGM and DDM parameters for eight different choice reaction time tasks (CRTs) using a multivariate approach based on structural equation modeling (SEM) and accounting for parameter dependency by allowing correlated measurement errors between parameters within the same task. While the eGM parameters τ, σ and μ showed significant negative correlations with working memory and reasoning, τ was the only significant unique predictor of higher cognition. Of the DDM parameters, drift rate was the strongest predictor of working memory and reasoning, followed by boundary separation. In an additional simulation study, the authors were able to reproduce the relationship between τ and working memory solely based on the empirical data of individual differences in drift rate and hypothesized that individual differences in τ are caused by individual differences in drift rate.
While the study by Schmiedek et al. [13] offered important new insights into the relationship between components of RT distributions and higher cognition, the generalizability of their results is limited by the homogeneity of their sample of university students with regard to age and probably intelligence (mean age = 25.8 years, SD = 3.8; IQ not reported). Martin, Burns and Wittert [28] were able to replicate some of the results of Schmiedek et al. [13] regarding the eGM in a sample of middle- to older-aged men using RT distributions from CRTs of different complexity to predict processing speed, working memory and executive functions. While τ and, to some extent, σ were significant predictors of processing speed and only τ from a CRT with four alternatives was able to predict working memory, no eGM parameter predicted executive functioning significantly. However, both the CRTs and the cognitive performance measures used by Martin et al. [28] showed strong conceptual differences compared to Schmiedek et al. [13]. Thus, the comparability of both studies is limited. In addition, so far there are no reports regarding the generalizability of the results of Schmiedek et al. [13] to children and adolescents.
On the basis of these considerations, the present study aimed to investigate the relationships between speed and ISV on the one side and fluid intelligence (gf) on the other. We tried to keep all statistical analyses closely in line with Schmiedek et al. [13], so that the present paper may be considered a conceptual replication of their work. Our study, however, exhibits noteworthy differences regarding sample characteristics. Most importantly, testing a large sample of participants in the sub-adult age range (eight to 18 years) and spanning a fairly broad range of individual differences in gf (IQ range from 69 to 155), we aimed to investigate the generalizability of the results reported by Schmiedek et al. [13]. To that end, we determined eGM and DDM parameters from four different CRTs and administered CFT 20-R to measure gf. In line with Schmiedek et al. [13], our analyses were based on a multivariate SEM approach, which allows controlling for statistical dependencies of estimated parameters within the same tasks.
Due to the large age range of our sample, we first tested measurement invariance between the age groups, differentiating between children, young adolescents and older adolescents. Second, we sought to examine the results of Schmiedek et al. [13] considering the generalizability of the eGM and DDM parameters across tasks for a sub-adult age sample of broad gf range. Third, we aimed to investigate the relations between the common latent factors delivered from the eGM and the DMM parameters. Finally, our main goal was to specify the relationship between gf and characteristics of RT distributions on a latent level for a sample of children and adolescents.

2. Methods

The study was approved by the ethics committee of the University of Freiburg, Germany. Prior to participation all participants and their parents gave a written informed consent.

2.1. Participants

The sample included n = 362 healthy children and adolescents aged between eight and 18 years (M ± SD = 12.79 ± 2.87, 48% male, age-normed IQ: M ± SD = 109 ± 14.43) without any present neurological or psychiatric conditions. Age and age-normed IQ were not significantly correlated (r = 0.07), indicating a consistent distribution of mean IQ scores across age groups (participants ≤ 11 years: M ± SD = 106.91 ± 15.04; participants > 11 and < 15 years: M ± SD = 111.64 ± 14.35; participants ≥ 15 years: M ± SD = 107.89 ± 13.20). Participants were recruited through advertisements in schools and announcements in local newspapers and social media.

2.2. Procedure and Measures

Participants were administered an extensive computer-based test battery including working memory, coordination and processing speed tasks as well as an IQ test. Only the results of the processing speed tasks and the IQ test will be presented here. Computer-based testing sessions took part in groups of two to five participants, wearing headphones and separated by partitions. IQ testing duration was approximately 60 min and took part in groups of two to eight participants.

2.2.1. Choice Reaction Time Tasks

Four parallel CRTs, adapted from Oberauer, Süß, Wilhelm and Wittman [29], were conducted as a measure of processing speed. In the two numerical CRTs (CRT odd-even and CRT large-small) participants were presented with two-digit numbers and were asked to categorize them as either odd/even or larger/smaller than 50, respectively. In the first spatial CRT (CRT up-down) participants had to decide whether an arrow presented in the center of the computer screen was pointing upward or downward. In the second spatial CRT (CRT above-below) participants were asked to decide whether a sloping line was presented in the upper or in the lower half of the screen. Every task started with 11 practice trials which were repeated if participants made more than two (18%) errors. 52 (14%) participants repeated the practice trials at least once. These participants were characterized by lower age-normed IQ (M = 102.56, SD = 15.53) compared to the participants who did not need to repeat the practice trials (M = 110.17, SD = 13.97); t (360) = 3.54, p < .001. Eleven (3%) participants repeated the practice trials for more than one CRT. Subsequently, 128 trials were presented in a pseudo-randomized order with an inter-stimulus interval of 2 s. Participants were asked to categorize the stimulus as quickly and as accurately as possible. The category-response button assignment was visible during the entire task. The duration of every task was approximately 6 min (including instruction and practice trials).

2.2.2. Fluid Intelligence Test

Gf was assessed using the German adaptation of the Culture Fair Intelligence Test by Cattell and Cattell [30] CFT 20-R [31]. The test includes four figural subtests (series, classifications, matrices and topologies). In order to improve reliability, the full version of the test with two parallel test halves was administered under speeded power conditions.

2.3. Data Preparation and Analysis

Basic data analyses were conducted using the software package R version 3.1.1. [32]. Intra-individual outliers were defined as reaction times faster than 200 ms or slower than four intra-individual standard deviations above the intra-individual mean for every participant and were eliminated in an iterative procedure until no further outliers were identified. This procedure was executed separately for correct reactions and errors and resulted in the exclusion of 0.5% of trials. The reported procedure was used by Schmiedek et al. [13] and was applied to ensure comparability of the results. However, reanalyzing the data without excluding any outliers besides anticipations faster than 100 ms did not change the result pattern.
Ex-Gaussian μ, σ and τ for every participant based on correct reactions were derived using the GAMLSS package for R [33]. Separate diffusion models were fitted for each participant based on correct and erroneous reaction times. Parameters of the DDM were estimated using fast-dm [34], a program for fast parameter estimation of Ratcliff’s diffusion model [22]. All parameters were set free except for the starting point (z), which was fixed to 0.5, and the differences in speed of response execution (d), which was fixed to 0. Parameter estimation was based on the Kolmogorov-Smirnov statistic, as recommended by Voss, Nagler and Lerche [35] for the number of trials in the administered CRTs.
Inter-individual outliers of the eGM and DDM parameters were defined as values larger/smaller than four standard deviations above/below the inter-individual mean and were removed in a case-wise fashion from further analyses. This iterative procedure was executed separately for each age group, assuring that, for example, an eight-year-old was compared to other eight-year-old children. As a result 0.001% of data points (18 out of 13,032) were excluded. Subsequently, confirmatory factor analyses (CFA) were computed in order to investigate the latent structure of the eGM and the DDM parameters and their relationships with gf were examined in SEM using Mplus, version 7.31 [36]. In order to reduce the statistical dependencies among the parameters estimated from the same data, correlated errors between the eGM as well as the DDM parameters within the same task were allowed (see Schmiedek et al. [13]). The indicators for the latent gf factor were the raw scores from the four subtests of the CFT 20-R (see Figure 1 and Figure 2). In order to account for non-normality, robust maximum likelihood estimation and the Satorra-Bentler scaled χ2 statistic (χ2S-B) were used for parameter estimation and model comparison. Bootstrapped confidence intervals based on 5,000 bootstrap samples were reported.
Due to the age heterogeneity of the sample, the invariance of the measurement models between the different age groups was estimated for the eGM and the DDM parameters prior to further analysis. Three age groups were built: group 1 (≤11 years; n = 122, Age: M ± SD = 9.61 ± 0.89), group 2 (>11 years and <15 years; n = 147, Age: M ± SD = 12.95 ± 1.19) and group 3 (≥15 years; n = 93, Age: M ± SD = 16.71 ± 1.20). Model fit dropped significantly when assuming metric measurement invariance between the age groups for the eGM (Δχ2S-B(24) = 121.77, p < 0.001) and the DDM parameters (Δχ2S-B(24) = 116.30, p < 0.001), indicating differential measurement models across the age range of eight to 18 years. In order to investigate the effect of the grouping procedure on this result, we reexamined measurement invariance for two age groups: children (≤13 years, n = 200, Age: M ± SD = 10.53 ± 1.39) and adolescents (>13 years, n = 162, Age: M ± SD = 15.58 ± 1.63). Assuming metric measurement invariance led to a significant drop in model fit for both, the eGM (Δχ2S-B(12) = 52.80, p < .001) and the DDM parameters (Δχ2S-B(12) = 74.10, p < .001). Therefore, measurement invariance could not be assumed and linear and curvilinear (1/age, see [37]) age effects were partialed out in a preprocessing step prior to the actual analyses.

3. Results

The means and standard deviations of the central parameters across the four CRTs are presented in Table 1. While the numerical tasks were characterized by larger mean RTs and non-decision times, no systematic differences between task types were observed in ISV parameters (RTSD, σ and τ), drift rate or boundary separation. The DDM variability parameters showed little variance across tasks.

3.1. Measurement Models for the eGM and the DDM Parameters

In order to account for the statistical dependencies between the parameters estimated from the same tasks, correlated errors for μ, σ and τ within each task were allowed. A CFA for the ex-Gaussian model with correlated latent factors and correlated error terms showed the following fit: χ2(39) = 98.32, p < .001, χ2/df = 2.52; RMSEA = .07 (90% CI = .05–.08); CFI = .96; SRMR = .08. Due to the overlapping of stimulus material between pairs of tasks (numerical in CRT odd-even and CRT large-small and spatial in CRT up-down and CRT above-below), the necessity to allow further correlated measurement errors between tasks with similar material was tested as described by Schmiedek et al. [13]. The modification indices revealed that the model fit could be improved by allowing correlated measurement errors between μ in the two numeric tasks (Δχ2S-B(1) = 5.55, p < .05). No further correlated measurement errors were suggested. The final measurement model fitted the data well (χ2(38) = 91.42, p < .001, χ2/df = 2.41; RMSEA = .06 (90% CI = .05–.08); CFI = .97; SRMR = .08). All factor loadings were significant and substantial (see Table 2). All latent factors were significantly and positively correlated: rμ,τ = .38 (95% CI: .25, .52), rμ,σ = .68 (95% CI: .58, .77), rσ,τ = .48 (95% CI: .33, .65), indicating that participants who reacted faster also tended to show less general variability and a smaller amount of slow responses.
Regarding the main DDM parameters drift rate, boundary separation and non-decision time, a CFA with correlated measurement errors within tasks yielded the following fit: χ2(39) = 102.92, p < .001, χ2/df = 2.64; RMSEA = .07 (90% CI = .05–.08); CFI = .94; SRMR = .04. As revealed by the modification indices, the model fit could be improved by allowing correlated measurement errors between non-decision time in the two spatial CRTs (since the non-decision time represents an unspecific process in the DDM, the fact that residual correlations occurred for the non-decision times of the spatial CRTs for the main DDM parameters and the full set of DDM parameters may indicate that these tasks measure a common variance that cannot be completely accounted for by the DDM; however, since the drift rate of the numerical CRTs had no residual correlations we conclude that the central component of the DDM was not affected by this common process): (Δχ2S-B(1) = 24.80, p < .001). The final model yielded a good fit (χ2(38) = 71.56, p < .001, χ2/df = 1.88; RMSEA = .05 (90% CI = .03–.07); CFI = .97; SRMR = .04). All factor loadings were significant and substantial (see Table 3). Drift rate and boundary separation (rv,a = −.37, 95% CI: −.48, −.25) as well as drift rate and non-decision time (rv,t0 = −.20, 95% CI: −.34, −.07) were negatively correlated, while boundary separation and non-decision time were positively correlated (ra,t0 = .25, 95% CI: .12, .37), indicating that higher drift rates were associated with less conservative boundary separation and faster non-decision times.
A CFA with the full set of DDM parameters, including drift rate, boundary separation and non-decision time as well as the between-trial variability of drift rate, starting point and non-decision time, revealed the following fit: χ2(177) = 267.56, p < .001, χ2/df = 1.51; RMSEA = .04 (90% CI = .03–.05); CFI = .96; SRMR = .04. Allowing correlated residuals between non-decision time from the spatial tasks improved the model fit significantly (Δχ2S-B(1) = 19.65, p < .001), resulting in a well-fitting final model (χ2(176) = 239.50, p < .001, χ2/df = 1.36; RMSEA = 0.03 (90% CI = .02–.04); CFI = .97; SRMR = .04). The variances of the latent factors’ variability of drift rate (Varsv = .02, 95% CI: −.003, .06) and variability of starting point (Varszr < .01, 95% CI: −.04, .001), however, were not significantly different from 0, contradicting the assumption that the variabilities of drift rate and starting point constitute separable latent factors. In addition, the indicators for these two factors showed low and mainly non-significant correlations with each other (variability of drift rate: .01 to .12; variability of starting point: −.002 to −.07). Therefore, in the further analyses regarding the relations of DDM parameters to reasoning ability, only the main DDM parameters will be considered.

3.2. Associations of eGM and DDM Parameters with GF

A model investigating the relationships between the latent eGM factors and a latent gf factor revealed a satisfactory fit (χ2(85) = 156.97, p < .001, χ2/df = 1.85; RMSEA = .05 (90% CI = .04–.06); CFI = .97; SRMR = .07). All eGM parameters were significantly negatively correlated with gf: rμ,gf = −.25 (95% CI: −.39, −.12), rσ,gf = −.47 (95% CI: −.57, −.37), and rτ,gf = −.33 (95% CI: −.45, −.20), indicating that faster and less variable reaction times and a lower amount of slow responses were associated with higher reasoning ability. In a latent regression model, the only significant predictor of gf was σ (b = −0.05; 95% CI: −0.07, −0.03; β = −.51), whereas the effects of μ (b = −0.006; 95% CI: −0.001, 0.01; β = .15) and τ were not significant (b = −0.01; 95% CI: −0.02, 0.002; β = −.15) (Figure 1). Overall, the eGM parameters accounted for 25% of the factor variance of gf.
Regarding the relationships between DDM parameters and gf, the corresponding model showed a satisfactory fit (χ2(85) = 146.74, p < .001, χ2/df = 1.73; RMSEA = .05 (90% CI = .03–.06); CFI = .96; SRMR = .05). Drift rate (r = .41, 95% CI: .30, .52) was positively correlated with gf, indicating that higher gf scores were associated with higher drift rates. Non-decision time (r = −.20, 95% CI: −.05, −.35) and boundary separation (r = −.13, 95% CI: −.25, .002) were negatively correlated with gf. Of the DDM parameters, drift rate was the only significant predictor of gf (b = 0.45; 95% CI: 0.28, 0.62; β = .41) (Figure 2). The total gf factor variance accounted for was 19%.

4. Discussion

In this study, we used SEM to examine the concurrent validity of components of RT distributions yielded by the eGM and the DDM regarding gf on a latent level for a large sample of children and adolescents spanning a broad range of individual differences in intellectual abilities. We measured intelligence by means of the CFT 20-R, which is typically regarded as a measure of gf. However, it has been emphasized that gf closely matches reasoning [38,39], so the present results can be related to the results of Schmiedek et al. [13] who investigated the association of eGM and DDM parameters with reasoning ability. Our study revealed the following main results: First, we observed separable and meaningfully correlated latent factors for the eGM and the main DDM parameters. Second, of the eGM parameters, σ and, to some extent, μ but not τ were able to predict gf. Third, drift rate was the only DDM parameter that was significantly related to gf. These main results will be discussed in the following.

4.1. Separable Latent Factors for the eGM and the Main DDM Parameters

We were able to identify separate common factors for the three eGM parameters and the three main DDM parameters. Thus, individual differences in components of RT distributions of participants aged between eight and 18 years appear to be generalizable across different tasks and separable from the statistical dependencies among the parameters within the tasks. This result is in accordance with Schmiedek et al. [13], who reported comparable fit indices for their data of young adults. However, regarding the DDM variability parameters, the observed pattern was less clear. Particularly the variability of drift rate and the variability of starting point showed very small correlations across the tasks, not delivering convincing evidence for the existence of underlying latent factors. However, these parameters have been described as particularly difficult to estimate and their estimation appears to require a very large number of trials [40]. Thus, a probable explanation for this result is the insufficient reliability of the variability parameters due to imprecise estimation. Further studies administering much more extensive tasks (>1000 trials) are required to address this issue.
In addition, we observed meaningful correlations between the latent factors for the different eGM and DDM parameters. For the eGM, all correlations were positive, indicating that children and adolescents whose average reactions were faster also showed more stable RTs around the leading edge of the distribution and a smaller amount of rather slow RTs. This result is in accordance with Schmiedek et al. [13]; thus, the eGM parameters appear to be similarly related to each other for children, adolescents and young adults.
Regarding DDM, we found a negative correlation between drift rate and boundary separation, indicating that participants with slower information accumulation also demanded more information to make a decision. This result is also in line with Schmiedek et al. [13] and can be interpreted as a compensating strategy in order to produce an adequate accuracy level. In contrast to Schmiedek et al. [13], we found non-decision time to be negatively correlated with drift rate and positively correlated with boundary separation. Thus, people who spent more time on encoding and motor processes seem to be characterized by lower drift rates and needed more information for a decision. This effect may be the reason for the residual variance of the non-decision times of the spatial CRTs. While the reported correlations appear comprehensible, the differences compared to Schmiedek et al. [13] may be caused by methodological differences in the estimation procedure. Schmiedek et al. [13] used the simplified EZ-diffusion model [41] which omits the DDM variability parameters, and interpreted some of the observed relations in their data as possible consequences of biases due to this simplification.

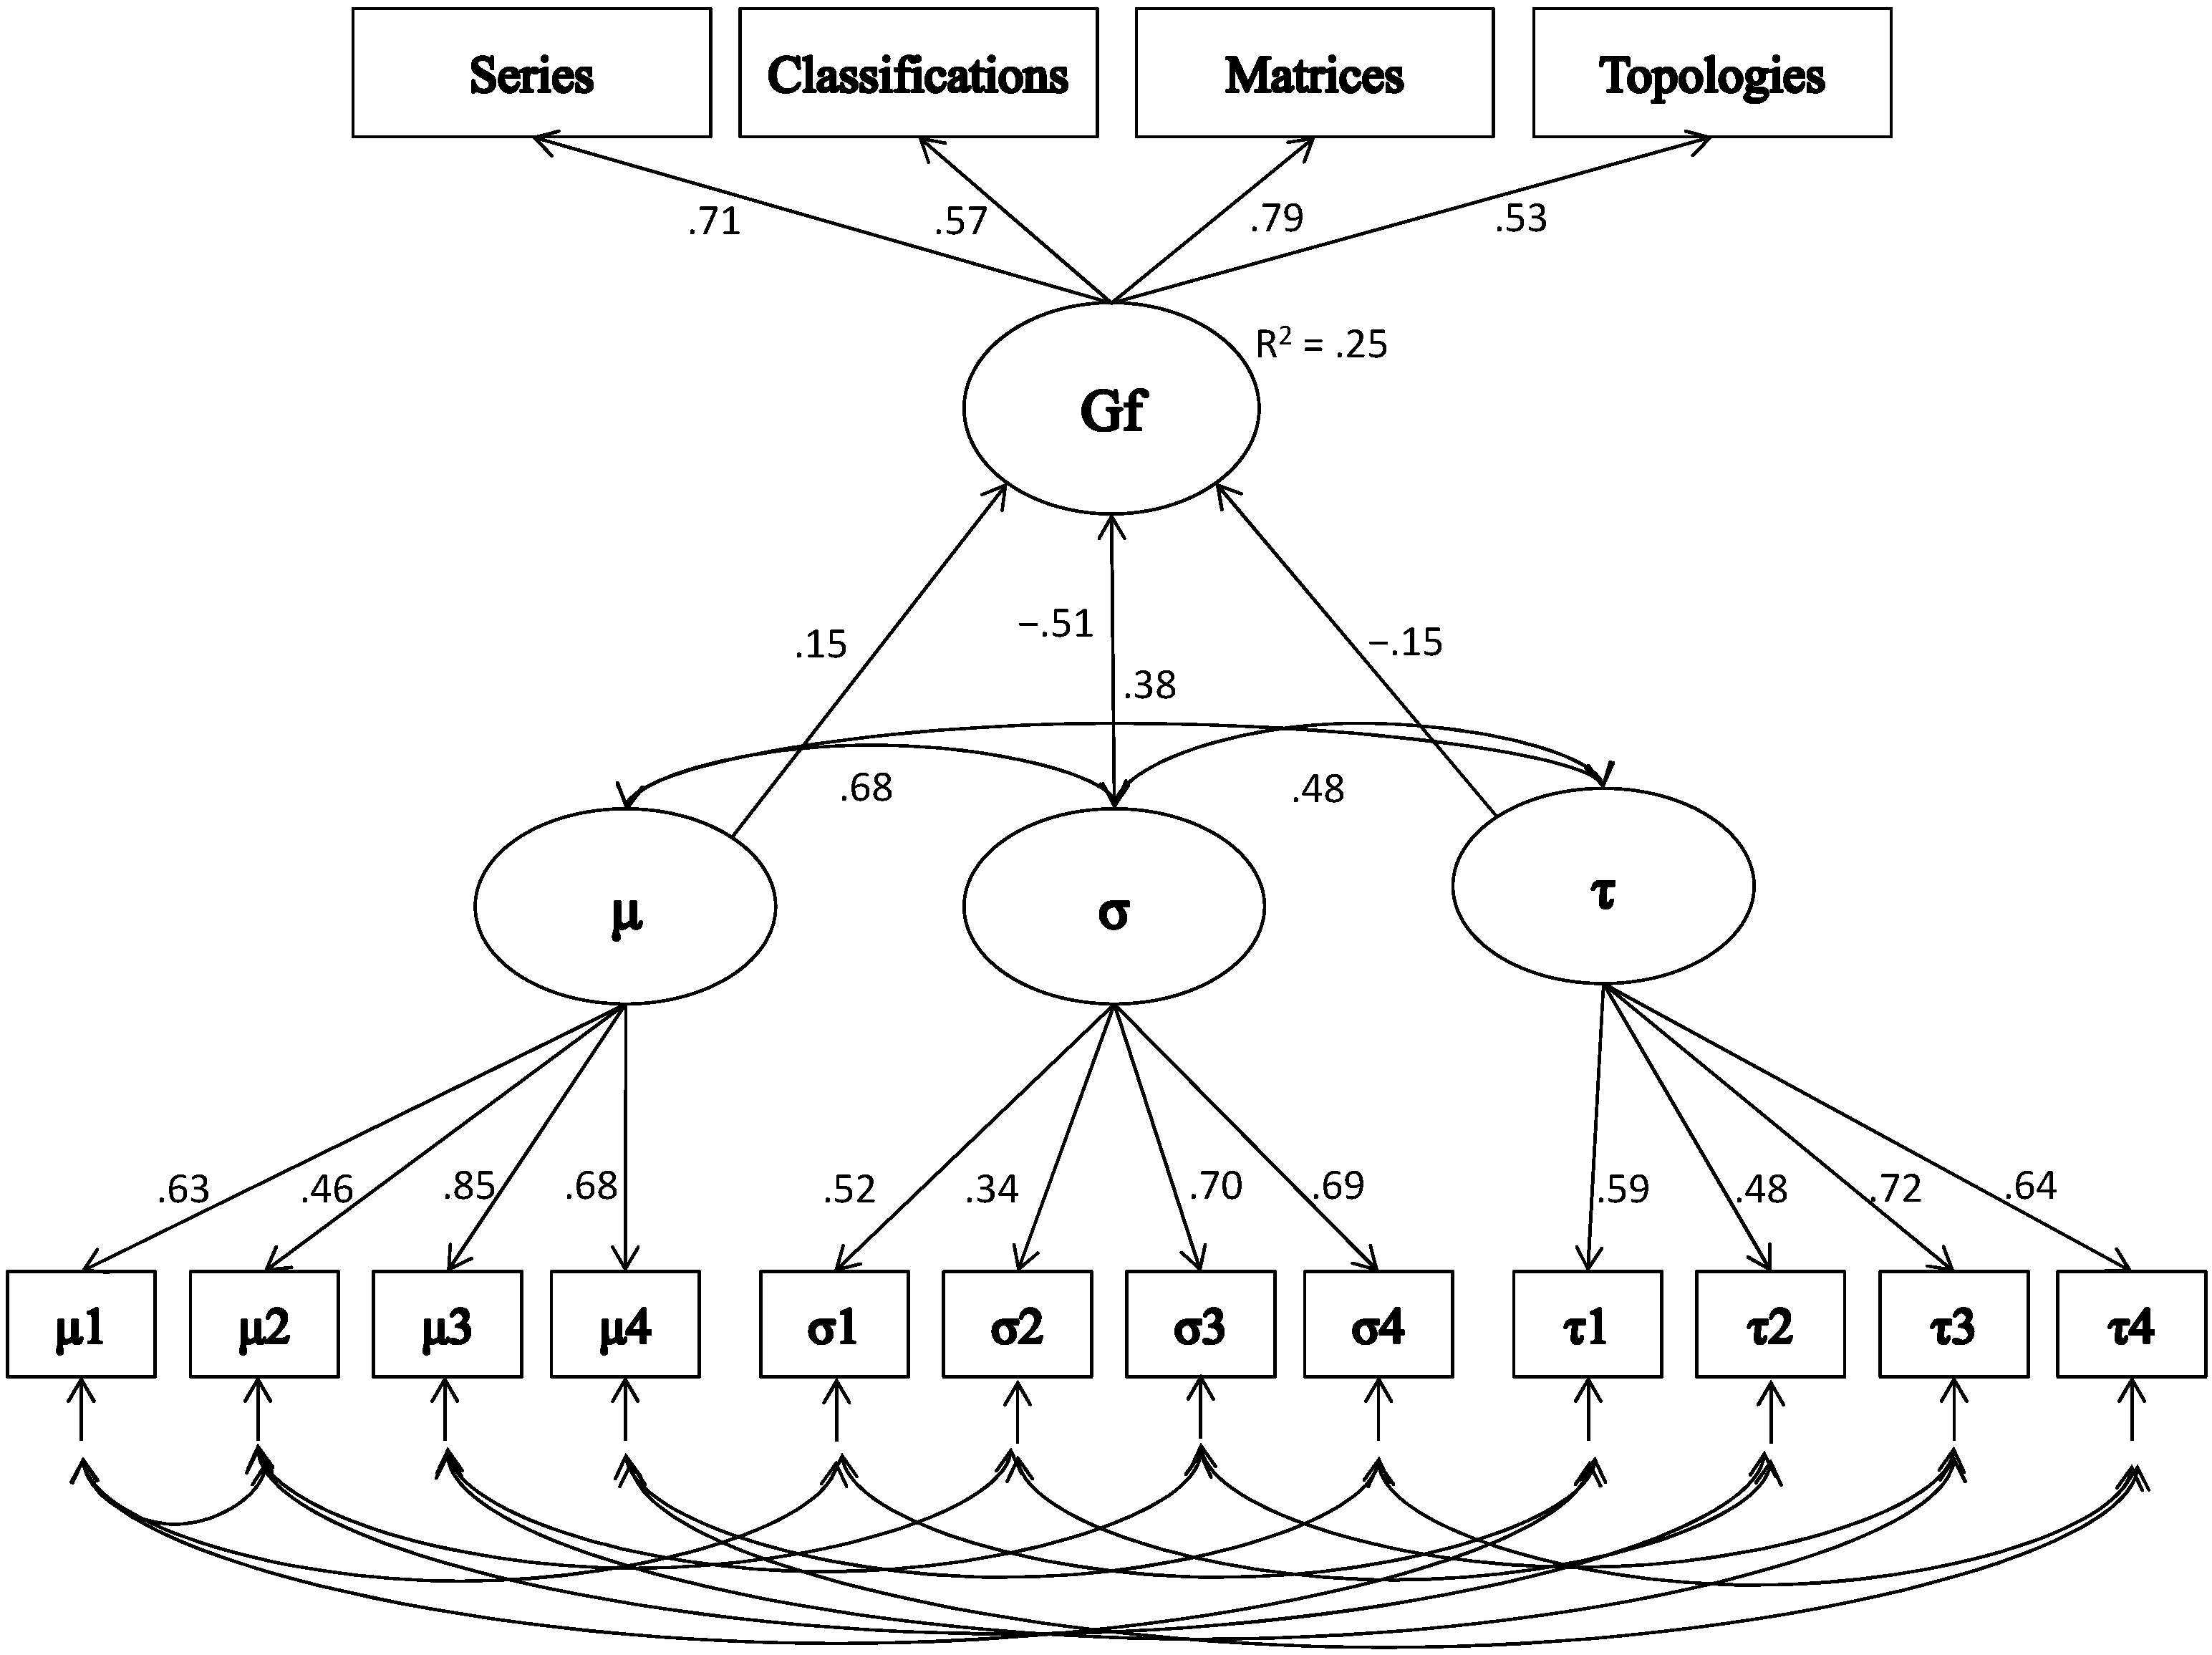
4.2. The eGM Parameter σ Predicts Gf

Regarding the relation between the eGM parameters and gf, we found that σ and, to a lesser degree, μ but not τ were able to predict gf in children and adolescents. Therefore, we were able to confirm the superiority of measures of ISV (σ) compared to measures of mean speed (μ) in predicting gf. However, our results stand in contradiction to Schmiedek et al. [13], who reported a strong relationship between intelligence and τ, which can be interpreted as evidence for the WPR [13,42]. Although the WPR has received substantial empirical support [10], this is not the first study which failed to replicate it. Salthouse [11] found comparable correlations between intelligence and different RT bands in the age-residualized data of 383 adults aged between 18 and 88 years. Ratcliff, Thapar and McKoon [43] confirmed the WPR in different tasks only for a group of older adults but not for college students. Similarly, Saville et al. [12] did not observe the WPR in n-back-task data from 50 university students. These reports challenge the universality of the WPR and suggest that it may only manifest under specific conditions. Since our CRTs and data preparation (e.g., outlier treatment) were very closely aligned to the study by Schmiedek et al. [13], the most probable explanation for the reported differences is sample differences. While most WPR studies were based on data from young adults, evidence from children is scarce. In the first of two WPR studies with children published so far, Coyle [44] used a memory task and not an RT task, which makes their results difficult to compare. In the second study, Fernandez et al. [42] reported evidence for the WPR in a sample of 198 children aged nine to twelve years. However, RTSD and the 90th RT percentile were similar in their predictive validity regarding gf and only in the children, but not in the adult sample, measurements of central tendency accounted for significant variance in gf over and above the 90th RT percentile. Thus, components of RT distributions may show differential sensitivities for individual differences in intelligence in different age groups. With regard to the proposed interpretation of the eGM parameters, these differences may be caused by differences in information processing between children and adults, indicating that for the same task, children with high intelligence may be mainly characterized by their ability to control automatic stimulus-driven processes (reflected by μ and σ), whereas adults scoring high on intelligence tests may be rather distinguished by their attentional control (possibly closer reflected by τ). This suggestion is, however, rather speculative and should be tested in further studies.
In addition, since the tasks we administered are partly overlapping but not identical to the ones used by Schmiedek et al. [13], the possibility that the reported differences were caused by different testing material cannot be completely ruled out. For example, while intelligence was measured with numerical, figural and verbal tasks by Schmiedek et al. [13], the CFT 20-R used in this study includes exclusively figural tasks. Further research including the CFT 20-R as well as verbal and numerical reasoning tasks with children and adolescents should be conducted to elucidate the effect of the content facet on the results.

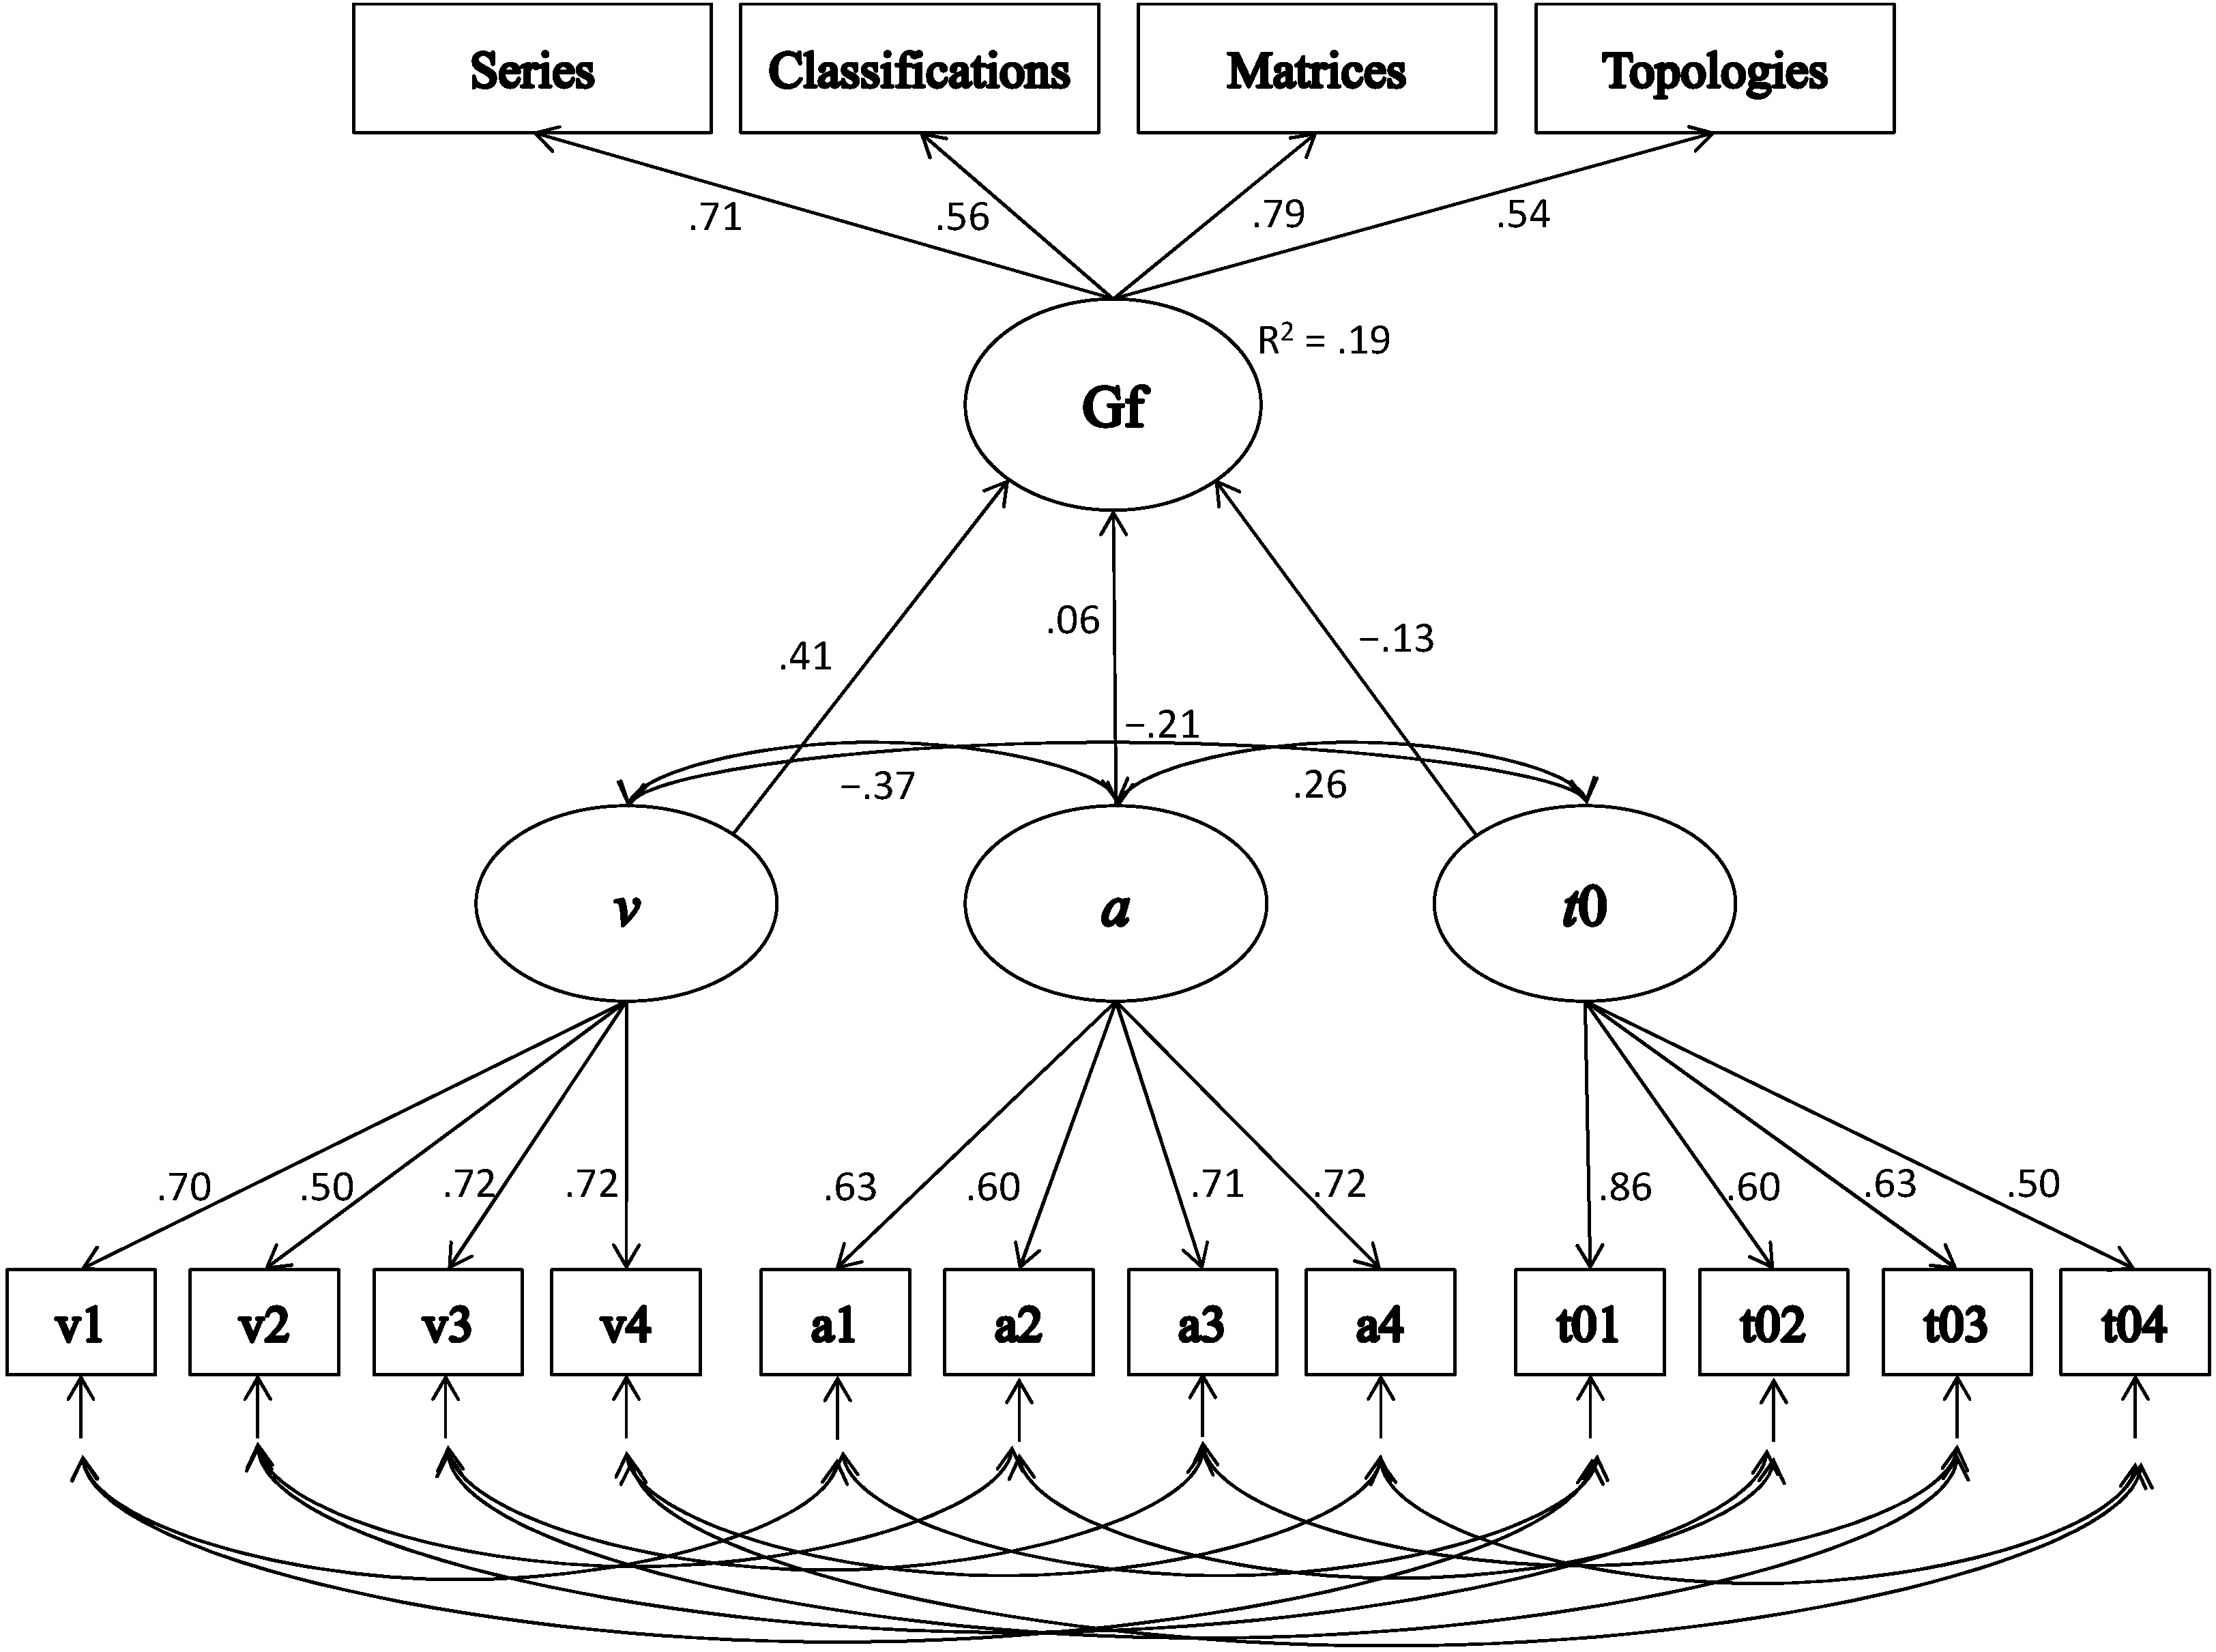
4.3. The DDM Parameter Drift Rate Predicts Gf

Regarding DDM, our results showed that drift rate was the only significant predictor of gf in children and adolescents, which is in line with previous findings [13,43]. Since drift rate is typically interpreted as a measurement of cognitive abilities, the reported link is not surprising. However, the fact that our results were similar to Schmiedek et al. [13] regarding the link between drift rate and gf but not regarding the link between τ and gf in a sample of sub-adult age challenges the generalizability of the proposed association between τ and drift rate. In fact, other studies have also questioned this link by demonstrating that the eGM parameters are sensitive to a variety of DDM parameters and thus no clear correspondence can be assumed [21,22]. Our results support this observation and extend it into childhood and adolescence.
Another noteworthy finding in our study, compared to Schmiedek et al. [13], is the smaller amount of explained variance in gf by the eGM (25% compared to 51%) and the DDM (19% compared to 68%) parameters. A possible explanation could be that gf and parameters of RT distributions in children and adolescents are less related than in adults. However, since other studies report an equal or even stronger association between RT measures and gf in children compared to adults [42], this suggestion appears unlikely. A more probable explanation is methodological influences due to the preparation of our data by controlling age effects. In the study by Fernandez et al. [42], residualizing age resulted in a drop of explained variance in gf by the 90th RT percentile from 22% to 8%. Since overlapping variance between constructs due to age effects may produce empirical associations in a similar way as process-related true correlations, not controlling for age effects in samples characterized by high age heterogeneity may result in a systematic overestimation of the size of true correlations. While the decision of Schmiedek et al. [13] not to residualize age effects appears justified due to the smaller age range of their sample, controlling for age effects in the present study is necessary in order to remove possible overlapping variance due to age. However, the possibility that a part of the associations described by Schmiedek et al. [13] are caused by age heterogeneity cannot be completely ruled out. Therefore, future research should address the issue of differential age effects regarding the relationship between characteristics of RT distributions and higher cognition.

5. Conclusions

We were able to confirm that individual differences in the eGM and the main DDM parameters are generalizable across different tasks and are meaningfully correlated with each other for a sample of children and adolescents aged between 8 and 18. In addition, we observed that latent factors related to ISV predict gf better than latent factors related to mean speed. We found that σ but not τ from simple CRTs was a significant predictor of gf. The DDM drift rate parameter was closely related to gf. Our results suggest that the WPR may not hold for a sample of children and adolescents of broad age and that drift rate and τ may be less associated with intelligence than expected.

Acknowledgments

Research was supported by the Deutsche Forschungsgemeinschaft (Kl 985/13-1; BE 2443/5-1). We are grateful to Eva Ordowski, Nadja Buch, Haili Jutglar, Vanessa Thoma, Lena Schneider, Lena Sendzik, Gabriela Jung, Nicholas Lanig, Maren Seydack, Tanja Zivkovic, Tina Kohler, Christoph Oser, Nathalie Geiger, Caroline Fierle, Jule Schmitt, Anna Wagner and Anna Kroboth for assisting with data collection and to Andreas Hochrath for programming the experiments. Finally, we thank all participants and their families.

Author Contributions

André Beauducel, Manuel Voelkle, Christoph Klein and Yoanna Schulz-Zhecheva conceived and designed the experiments; Yoanna Schulz-Zhecheva, Monica Biscaldi and Christoph Klein performed the experiments; Yoanna Schulz-Zhecheva and Manuel Voelkle analyzed the data; Yoanna Schulz-Zhecheva, Christoph Klein, André Beauducel and Manuel Voelkle wrote the paper.

Conflicts of Interest

The authors declare no conflict of interest.

References

  1. Deary, I.J. Looking down on Human Intelligence: From Psychometrics to the Brain; Oxford University Press: Oxford, UK, 2001. [Google Scholar]
  2. Jensen, A.R. Clocking the Mind: Mental Chronometry and Individual Differences; Elsevier: Oxford, UK, 2006. [Google Scholar]
  3. Nissan, J.; Liewald, D.; Deary, I.J. Reaction time and intelligence: Comparing associations based on two response modes. Intelligence 2013, 41, 622–630. [Google Scholar] [CrossRef]
  4. Schweizer, K.; Moosbrugger, H. Attention and working memory as predictors of intelligence. Intelligence 2004, 32, 329–347. [Google Scholar] [CrossRef]
  5. Jensen, A.R. The importance of intraindividual variation in reaction-time. Personal. Individ. Differ. 1992, 13, 869–881. [Google Scholar] [CrossRef]
  6. Baumeister, A.A. Intelligence and the “personal equation”. Intelligence 1998, 26, 255–265. [Google Scholar] [CrossRef]
  7. Wagenmakers, E.-J.; Brown, S. On the linear relation between the mean and the standard deviation of a response time distribution. Psychol. Rev. 2007, 114, 830–841. [Google Scholar] [CrossRef] [PubMed]
  8. Rammsayer, T.H.; Troche, S.J. Effects of age and the relationship between response time measures and psychometric intelligence in younger adults. Personal. Individ. Differ. 2010, 48, 49–53. [Google Scholar] [CrossRef]
  9. Larson, G.E.; Alderton, D.L. Reaction time variability and intelligence: A “worst performance” analysis of individual differences. Intelligence 1990, 14, 309–325. [Google Scholar] [CrossRef]
  10. Coyle, T.R. A review of the worst performance rule: Evidence, theory and alternative hypotheses. Intelligence 2003, 31, 567–587. [Google Scholar] [CrossRef]
  11. Salthouse, T. Relation of successive percentiles of reaction time distributions to cognitive variables and adult age. Intelligence 1998, 26, 153–166. [Google Scholar] [CrossRef]
  12. Saville, C.W.N.; Beckles, K.D.; Macleod, C.A.; Feige, B.; Biscaldi, M.; Beauducel, A.; Klein, C. A neural analogue of the worst performance rule: Insights from single-trial event-related potentials. Intelligence 2016, 55, 95–103. [Google Scholar] [CrossRef]
  13. Schmiedek, F.; Oberauer, K.; Wilhelm, O.; Süss, H.-M.; Wittmann, W.W. Individual differences in components of reaction time distributions and their relations to working memory and intelligence. J. Exp. Psychol. Gen. 2007, 136, 414–429. [Google Scholar] [CrossRef] [PubMed]
  14. Feige, B.; Biscaldi, M.; Saville, C.W.N.; Kluckert, C.; Bender, S.; Ebner-Priemer, U.; Klein, C. On the temporal characteristics of performance variability in attention deficit hyperactivity disorder (ADHD). PLoS ONE 2013, 8, e69674. [Google Scholar] [CrossRef]
  15. Heathcote, A. RTSYS: A DOS application for the analysis of reaction time data. Behav. Res. Methods Instrum. Comput. 1996, 28, 427–445. [Google Scholar] [CrossRef]
  16. Heathcote, A.; Popiel, S.J.; Mewhort, D.J.K. Analysis of response time distributions: An example using the Stroop task. Psychol. Bull. 1991, 109, 340–347. [Google Scholar] [CrossRef]
  17. Mewhort, D.J.K.; Braun, J.G.; Heathcote, A. Response time distributions and the Stroop task: A test of the Cohen, Dunbar, and McClelland (1990) model. J. Exp. Psychol. Hum. 1992, 18, 872–882. [Google Scholar] [CrossRef]
  18. Biscaldi, M.; Bednorz, N.; Weissbrodt, K.; Saville, C.W.N.; Feige, B.; Bender, S.; Klein, C. Cognitive endophenotypes of attention deficit/hyperactivity disorder and intra-subject variability in patients with autism spectrum disorder. Biol. Psychol. 2016, 118, 25–34. [Google Scholar] [CrossRef] [PubMed]
  19. Hohle, R.H. Inferred components of reaction times as functions of foreperiod duration. J. Exp. Psychol. 1965, 4, 382–386. [Google Scholar] [CrossRef]
  20. Balota, D.A.; Spieler, D.H. Word frequency, repetition, and lexicality effects in word recognition tasks: Beyond measures of central tendency. J. Exp. Psychol. Gen. 1999, 128, 32–55. [Google Scholar] [CrossRef] [PubMed]
  21. Matzke, D.; Wagenmakers, E.-J. Psychological interpretation of the ex-Gaussian and shifted Wald parameters: A diffusion model analysis. Psychon. Bull. Rev. 2009, 16, 798–817. [Google Scholar] [CrossRef] [PubMed]
  22. Ratcliff, R. A theory of memory retrieval. Psychol. Rev. 1978, 85, 59–108. [Google Scholar] [CrossRef]
  23. Ratcliff, R.; McKoon, G. The diffusion decision model: Theory and data for two-choice decision tasks. Neural. Comput. 2008, 20, 873–922. [Google Scholar] [CrossRef] [PubMed]
  24. Ratcliff, R.; Smith, P.L. A comparison of sequential sampling models for two-choice reaction time. Psychol. Rev. 2004, 111, 333–367. [Google Scholar] [CrossRef] [PubMed]
  25. Ratcliff, R.; Thapar, A.; McKoon, G. Aging, practice, and perceptual tasks: A diffusion model analysis. Psychol. Aging 2006, 21, 353–371. [Google Scholar] [CrossRef] [PubMed]
  26. Klauer, K.C.; Voss, A.; Schmitz, F.; Teige-Mocigemba, S. Process components of the implicit association test: A diffusion-model analysis. J. Personal. Soc. Psychol. 2007, 93, 353–368. [Google Scholar] [CrossRef] [PubMed]
  27. Schmitz, F.; Voss, A. Decomposing task-switching costs with the diffusion model. J. Exp. Psychol. Hum. 2012, 38, 222–250. [Google Scholar] [CrossRef] [PubMed]
  28. Martin, D.M.; Burns, N.R.; Wittert, G. Free testosterone levels, attentional control, and processing speed performance in aging men. Neuropsychology 2009, 23, 158–167. [Google Scholar] [CrossRef] [PubMed]
  29. Oberauer, K.; Su, H.; Wilhelm, O.; Wittman, W.W. The multiple faces of working memory: Storage, processing, supervision, and coordination. Intelligence 2003, 31, 167–193. [Google Scholar] [CrossRef]
  30. Cattell, R.B.; Cattell, A.K.S. Culture Fair Intelligence Test, Scale 2; Institute for Personality and Ability Testing: Champaign, IL, USA, 1960. [Google Scholar]
  31. Weiß, R.H. CFT-20-R Grundintelligenztest Skala 2—Revidierte Fassung; Hogrefe: Goettingen, Germany, 2006. (In German) [Google Scholar]
  32. R Development Core Team. R: A Language and Environment for Statistical Computing; R Foundation for Statistical Computing: Vienna, Austria, 2014. [Google Scholar]
  33. Stasinopoulos, D.M.; Rigby, R.A. Generalized additive models for location scale and shape (GAMLSS). J. Stat. Softw. 2007, 23, 1–46. [Google Scholar] [CrossRef]
  34. Voss, A.; Voss, J. Fast-dm: A free program for efficient diffusion model analysis. Behav. Res. Methods 2007, 39, 767–775. [Google Scholar] [CrossRef] [PubMed]
  35. Voss, A.; Nagler, M.; Lerche, V. Diffusion models in experimental psychology: A practical introduction. Exp. Psychol. 2013, 60, 385–402. [Google Scholar] [CrossRef] [PubMed]
  36. Muthén, L.K.; Muthén, B.O. Mplus [Computer Software]; Muthén & Muthén: Los Angeles, CA, USA, 2010. [Google Scholar]
  37. Klein, C. Developmental functions for saccadic eye movement parameters derived from pro- and antisaccade tasks. Exp. Brain Res. 2001, 139, 1–17. [Google Scholar] [PubMed]
  38. Cattell, R.B. Intelligence: Its Structure, Growth and Action; North-Holland: New York, NY, USA, 1987. [Google Scholar]
  39. Süß, H.-M.; Oberauer, K.; Wittmann, W.W.; Wilhelm, O.; Schulze, R. Working memory capacity explains reasoning ability—And a little bit more. Intelligence 2002, 30, 261–288. [Google Scholar] [CrossRef]
  40. Voss, A.; Voss, J.; Lerche, V. Assessing cognitive processes with diffusion model analyses: A tutorial based on fast-dm-30. Front. Psychol. 2015, 6, 1–14. [Google Scholar] [CrossRef] [PubMed]
  41. Wagenmakers, E.-J.; van der Maas, H.L.J.; Grasman, R.P.P.P. An EZ-diffusion model for response time and accuracy. Psychon. Bull. Rev. 2007, 14, 3–22. [Google Scholar] [CrossRef] [PubMed]
  42. Fernandez, S.; Fagot, D.; Dirk, J.; de Ribaupierre, A. Generalization of the worst performance rule across the lifespan. Intelligence 2014, 42, 31–43. [Google Scholar] [CrossRef]
  43. Ratcliff, R.; Thapar, A.; McKoon, G. Individual differences aging and IQ in two choice tasks. Cognit. Psychol. 2010, 60, 127–157. [Google Scholar] [CrossRef] [PubMed]
  44. Coyle, T.R. IQ is related to the worst performance rule in a memory task involving children. Intelligence 2001, 29, 117–129. [Google Scholar] [CrossRef]
Figure 1. Simplified graphic of the prediction of fluid intelligence (gf) with the eGM parameters μ (represents the mean of the Gaussian part), σ (represents the standard deviation of the Gaussian part) and τ (represents the standard deviation of the exponential part).
Jintelligence 04 00008 g001
Figure 2. Simplified graphic of the prediction of fluid intelligence (gf) with the DDM parameters drift rate (v), boundary separation (a) and non-decision time (t0).
Jintelligence 04 00008 g002
Table 1. Descriptive statistics for the ex-Gaussian and Ratcliff’s Diffusion Decision Model parameters.
TaskM (SD)RTSD (SD)μ (SD)σ (SD)τ (SD)v (SD)a (SD)t0 (SD)sv (SD)szr (SD)st0 (SD)
CRT LS750.72 (169.78)190.11 (62.68)581.52 (147.71)85.31 (57.10)169.29 (67.14)2.80 (0.97)1.42 (0.23)0.50 (0.12)0.62 (0.44)0.27 (0.17)0.23 (0.18)
CRT OE801.87 (179.53)181.11 (63.59)658.46 (167.13)101.15 (63.33)142.62 (58.39)2.76 (1.08)1.29 (0.22)0.58 (0.14)0.60 (0.40)0.27 (0.19)0.28 (0.17)
CRT UD696.55 (148.98)195.52 (64.09)519.19 (114.42)83.11 (47.51)176.26 (65.28)2.77 (1.01)1.39 (0.26)0.44 (0.10)0.69 (0.52)0.26 (0.18)0.22 (0.15)
CRT AB642.19 (154.08)187.19 (68.00)476.21 (125.08)82.69 (51.13)165.24 (70.27)2.93 (1.15)1.39 (0.26)0.40 (0.10)0.72 (0.50)0.25 (0.17)0.22 (0.16)
Note: CRT = Choice reaction time task; LS = large-small; OE = odd-even; UD = up-down; AB = above-below; M = mean; SD = standard deviation; RTSD = standard deviation of reaction times; v = drift rate; a = boundary separation; t0 = non-decision time; sv = trial-to-trial variability of drift rate; szr = trial-to-trial variability of starting point; st0 = trial-to-trial variability of non-decision time.
Table 2. Factor loadings and residual correlations from the confirmatory factor analysis with the ex-Gaussian parameters.
TaskUnstandardized Factor Loading (95% CI)Standardized Factor LoadingResidual Correlation
μστμστμ − σμ − τσ − τ
CRT LS59.26 (50.93–69.30)23.68 (18.27–29.98)36.02 (29.40–42.07).62.52.59.81−.49−.56
CRT OE44.65 (34.65–54.89)14.67 (10.00–19.25)27.99 (21.77–34.17).45.34.48.76−.33−.47
CRT UD62.71 (56.12–69.76)25.48 (20.28–31.55)43.98 (37.28–49.83).86.71.72.64−.53−.50
CRT AB63.97 (56.05–73.18)29.92 (24.88–36.11)41.58 (34.78–48.14) .67.68.64.83−.48−.48
Note: CRT = Choice reaction time task; LS = large-small; OE = odd-even; UD = up-down; AB = above-below; CI = confidence interval.
Table 3. Factor loadings and residual correlations from the confirmatory factor analysis with the parameters of Ratcliff’s Diffusion Decision Model.
TaskUnstandardized Factor Loading (95% CI)Standardized Factor LoadingResidual Correlation
vat0vat0v − av − t0a − t0
CRT LS0.53 (0.46–0.60)0.14 (0.11–0.17)0.07 (0.06–0.08).71.63.87−.02−.05−.31
CRT OE0.40 (0.29–0.51)0.14 (0.11–0.16)0.05 (0.04–0.06) .48.60.59−.02−.24−.26
CRT UD0.62 (0.54–0.72)0.19 (0.16–0.21)0.04 (0.03–0.05).73.71.62.27.02−.38
CRT AB0.67 (0.58–0.77)0.19 (0.16–0. 21)0.04 (0.03–0.05).71.72.50.07−.01−.25
Note: CRT = Choice reaction time task; LS = large-small; OE = odd-even; UD = up-down; AB = above-below; CI = confidence interval; v = drift rate; a = boundary separation; t0 = non-decision time.

