1. Introduction
In recent years, nanoprobes with multimodal functionality have been investigated extensively for a range of biomedical applications, such as optical imaging (OI), magnetic resonance imaging (MRI), bioseparation, controlled drug delivery, etc. [
1,
2,
3,
4]. Among them, gadolinia nanoprobes are used widely to improve the T
1-weighted contrast between different tissues [
5,
6,
7,
8]. These gadolinia nanoprobes can efficiently induce the longitudinal relaxation of water protons and brighten the imaging place. On the other hand, the main limitation for industrial applications of gadolinia nanoprobes is the high production cost of gadolinium due mainly to its rarity on Earth. To resolve this limitation, gadolinium ions can be doped into another earth-abundant and low-cost host matrix. Surface-localized gadolinium ions in the low-cost host matrix can also change the longitudinal relaxation of the nearby water protons for MRI contrast enhancement. The similarity in chemical properties make the matrix of yttrium oxide Y
2O
3 (yttria) a promising host candidate for lanthanide doping [
9,
10]. For example, recent studies have suggested that a homogeneous yttria-lanthanides solid mixture can be obtained using the homogeneous urea precipitation method [
11,
12]. In addition, yttria-based nanostructures can potentially be used for optical biomaging purposes [
13,
14].
To the best of the authors’ knowledge, Eu3+ and Gd3+ codoped yttrium oxide nanospheres were not utilized as potential nanoprobes for simultaneous optical and magnetic resonance imaging. Therefore, the main aim of this study was to explore the possibilities of lanthanide-doped Y2O3 nanoprobes for bimodal imaging. The optical properties and MR relaxivity rate of the prepared lanthanide-doped Y2O3 nanoprobes were examined as a function of the Gd3+ concentration. The results are expected to make a strong contribution to other nanoprobes’ development.
2. Results and Discussion
For a comparative study of the optical and magnetic properties, samples with different Gd
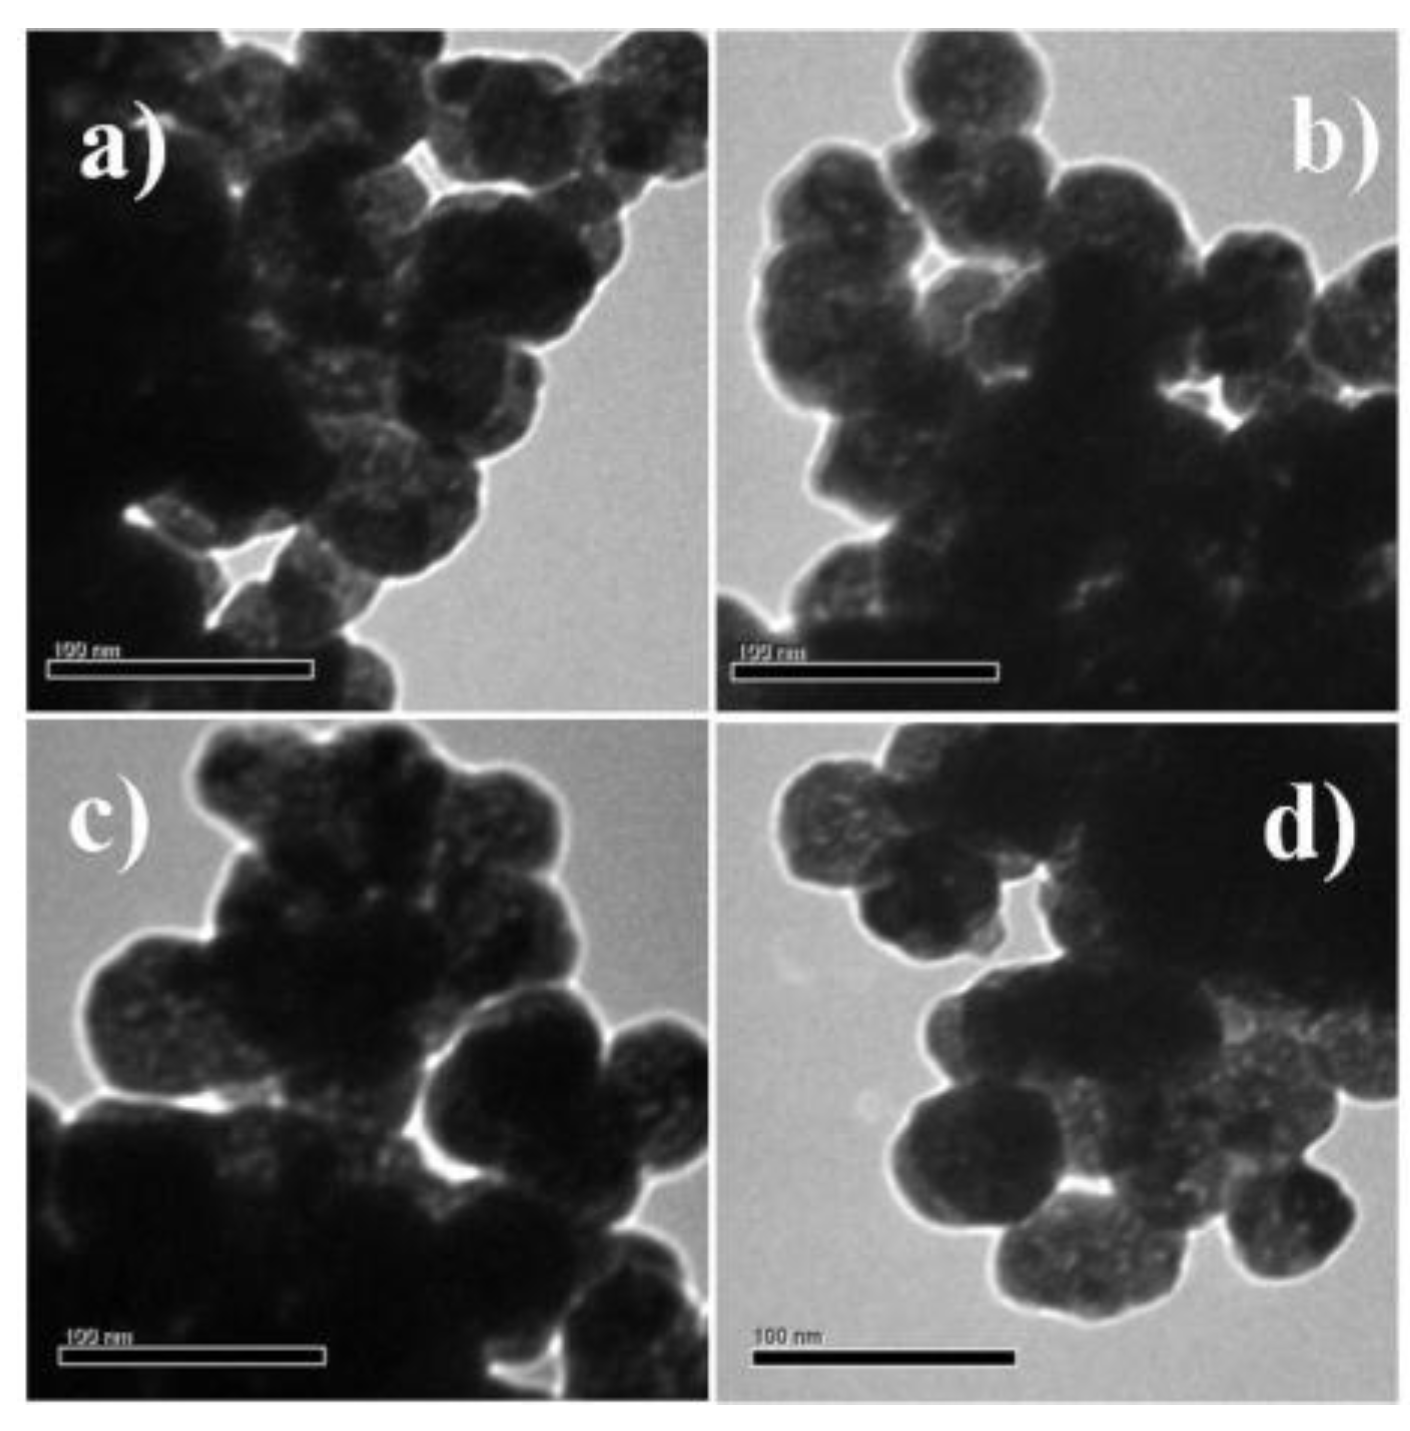
3+ codoping concentrations (0, 3, 7 and 10 mol %) were prepared. Transmission electron microscope (TEM), field emission scanning electron microscope (FESEM) and energy-dispersive X-ray (EDX) were used to examine the morphology and chemical composition of the samples.
Figure 1a–d shows that all nanoprobes prepared had a spherical morphology within the range, 61–69 nm. For example, the mean diameters of the 10 mol % Gd
3+ codoped nanoprobes, as measured by dynamic light scattering (DLS) (
Figure S1, Supplementary Materials) were in accordance with the estimated sizes from FESEM analysis (
Figure S2, Supplementary Materials). Obviously, codoping with Gd
3+ did not alter the morphology, even at relatively high Gd
3+ codoping concentrations as shown by FESEM measurements (
Figure S2, Supplementary Materials). Bare Y
2O
3:Eu
3+ and 3 mol % Gd
3+ codoped Y
2O
3:Eu
3+ nanoparticles were used to determine the elemental composition. EDX (
Figure S3, Supplementary Materials) clearly indicated the presence of specific dopants (Eu in Y
2O
3:Eu
3+) and (Eu, Gd in Y
2O
3:Eu
3+, Gd
3+) in the synthesized nanoparticles. Zeta potential was further measured at pH 7.5 to check the colloidal stability of the prepared samples. Measurement results show that zeta potential for all nanoprobes were in the range of 7–9 mV. Thus, prepared colloidal solutions of nanoprobes were stable for several hours only. However, homogeneous suspensions were formed again when solutions were ultrasonicated for several seconds. It is worth to mention that special surface coating can increase their colloidal stability in biological environment [
6,
8]. However, one should keep in mind that surface coating may affect the T
1-relaxivity of these nanoprobes.
Figure S4 (Supplementary Materials) shows typical XRD patterns of the prepared samples. The X-ray diffraction (XRD) peaks for bare Y
2O
3:Eu
3+ were assigned to the standard cubic structure of Y
2O
3 (JCPDS No. 86-1107, space group
Ia3 (206)). A careful examination of the Gd-codoped samples showed that the position of all the XRD peaks shifted slightly towards lower angles. On the other hand, the samples still retained the cubic structure of Y
2O
3. The observed similarity with the Y
2O
3 structure suggests that the Gd-codoped samples are solid Y
2O
3-based solutions rather than mechanical mixtures of Y
2O
3, Eu
2O
3, and Gd
2O
3.
The prepared samples were tested further by photoluminescence (PL) at room temperature. Although the main reason for Gd-codoping was to achieve the paramagnetic functionality of bare Y
2O
3:Eu
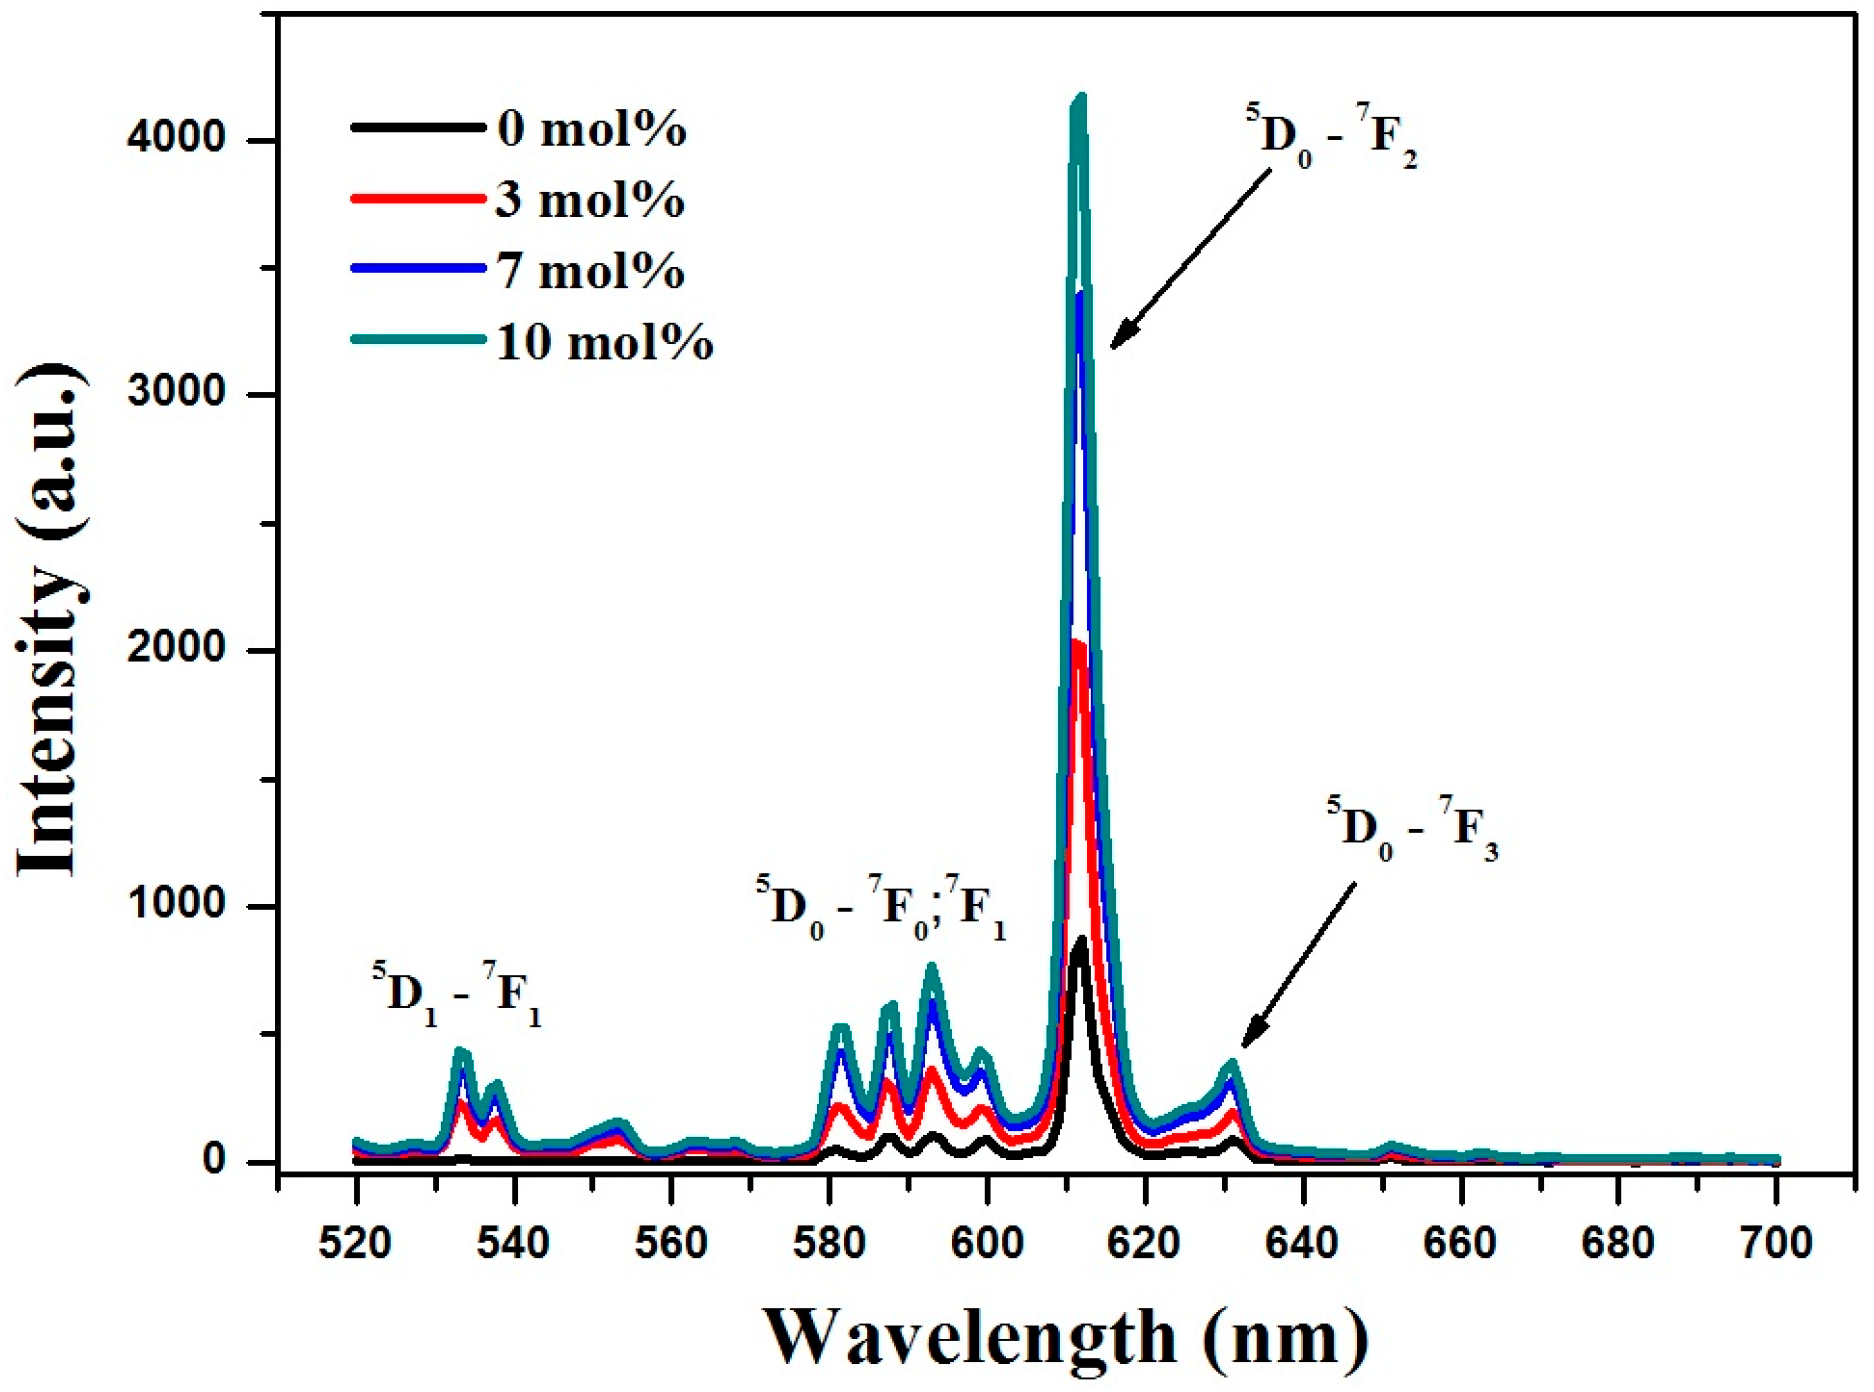
3+, Gd-codoping had some interesting effects on PL emission. All samples were measured under identical conditions so that the emission ratio could be compared.
Figure 2 shows the PL emission spectrum revealed several main groups of emission lines, which were assigned to the
5D
1 →
7F
1 and
5D
0 →
7F
j (where
j = 0, 1, 2, 3) transitions within the Eu
3+ [
12,
13,
14]. Partial replacement of Y
3+ with Gd
3+ in the host matrix allows easier charge transfer from Gd
3+ to Eu
3+ [
15]. Therefore, Gd-codoping does not alter the peak position, but greatly improves the PL emission intensity. For example, the relative intensity of the strongest
5D
0 →
7F
2 (at 612 nm) peak increased monotonically with increasing Gd-concentration, which is in good agreement with the previously reported study [
12].
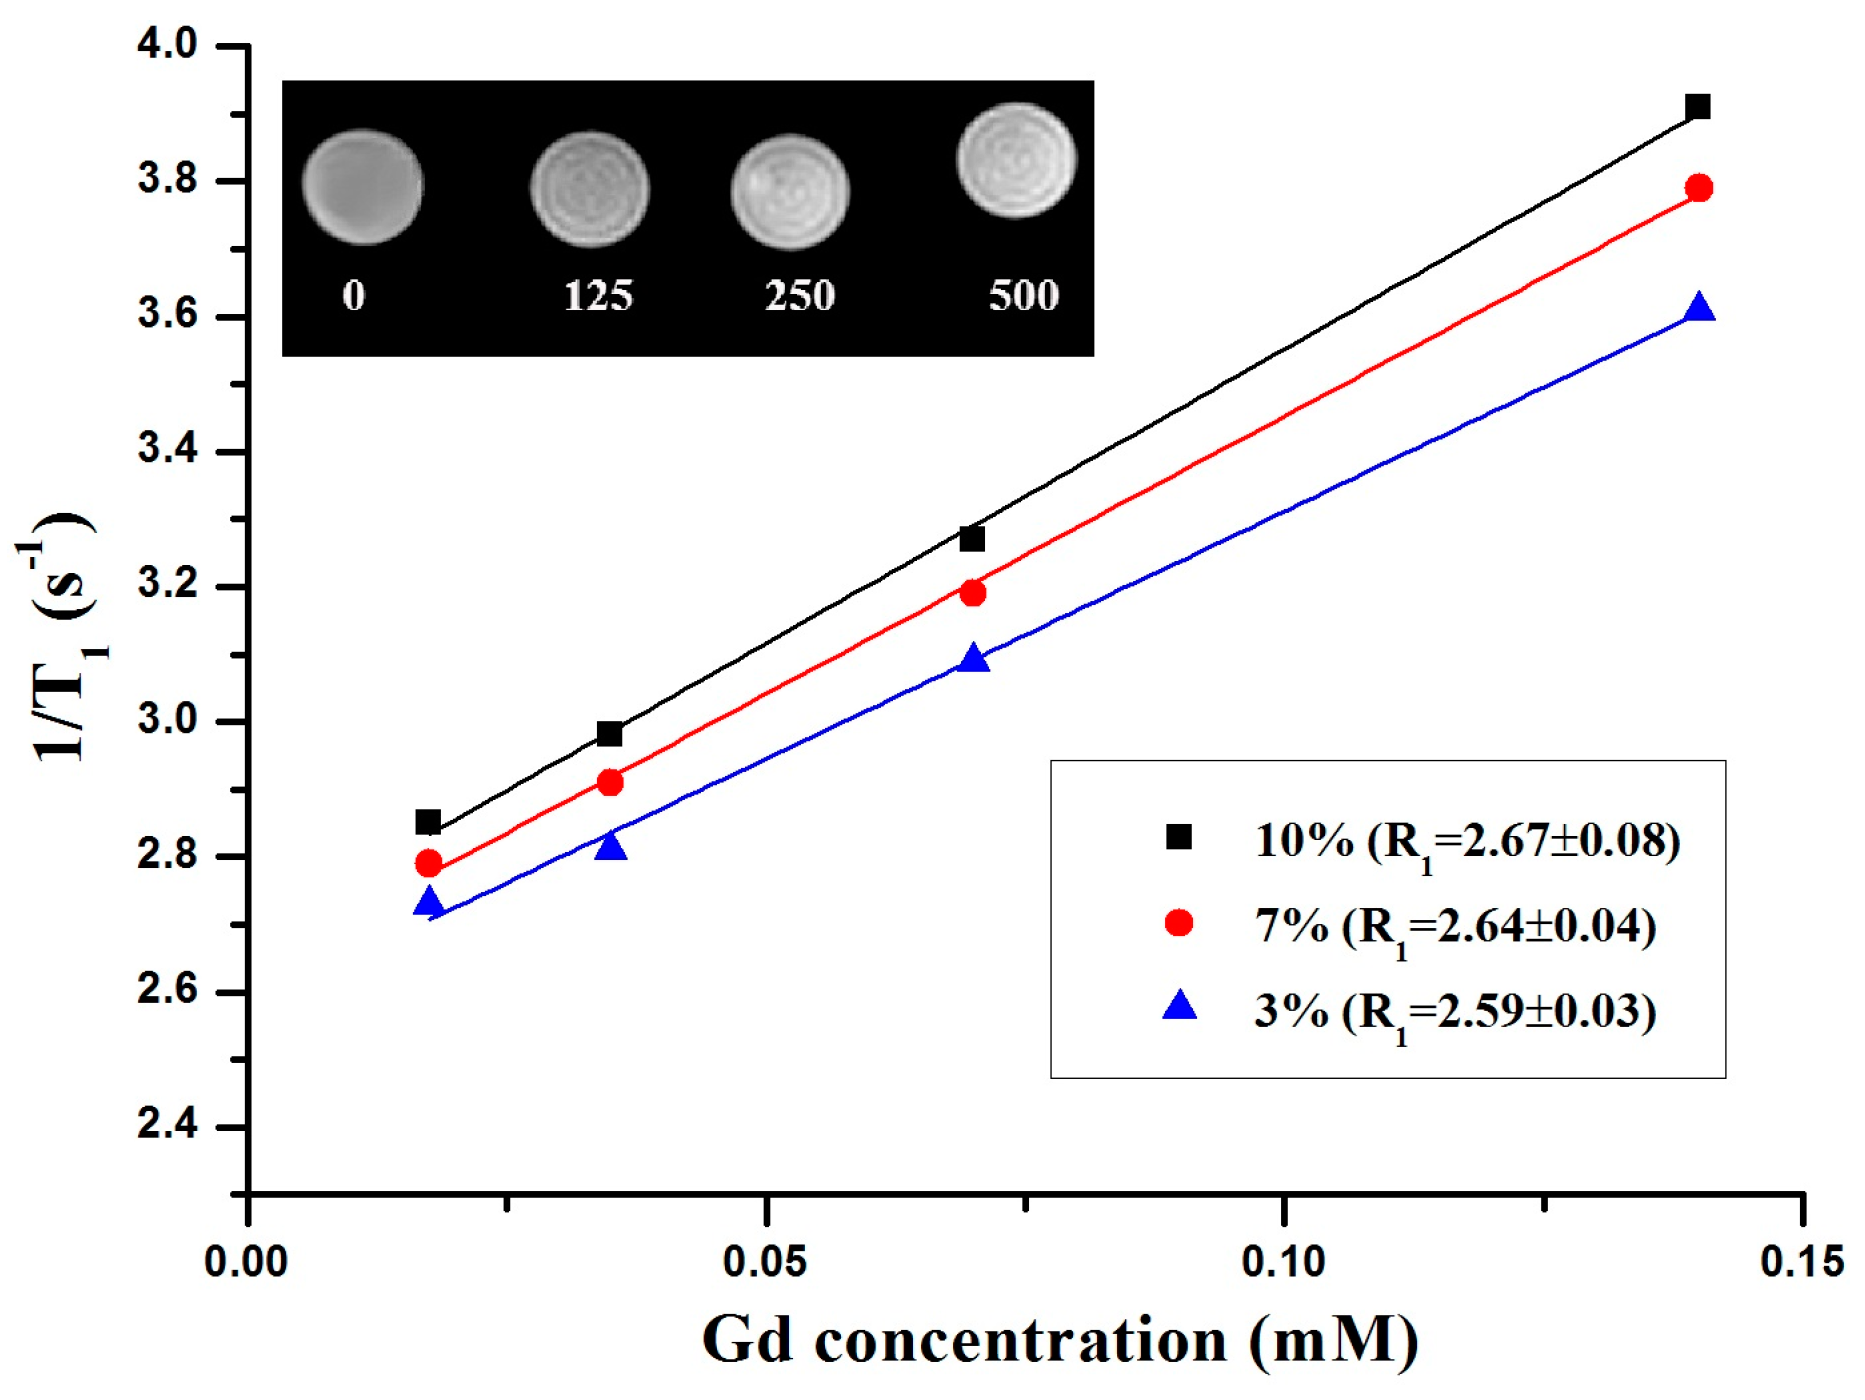
A 1.5 T clinical MRI scanner was used to demonstrate the applicability of the Gd-codoped samples for T
1-weighted MR imaging. The slope of the linear fit of 1/T
1 vs. the nanoparticle concentration yielded a longitudinal relaxivity (R
1) of the samples.
Figure 3 shows that the R
1 values of the 3%, 7%, and 10% codoped samples were approximately 2.59 ± 0.03, 2.64 ± 0.04, and 2.67 ± 0.08 s
−1·mM
−1 respectively. As expected, the R
1 value increased with increasing Gd-concentration in the samples.
Figure 3 (inset) shows that the T
1-relaxation time of the water protons was reduced significantly, and the T
1-weighted images became brighter with increasing concentration of 10 mol % Gd
3+ codoped nanoparticles. The resulting R
1 values were comparable to commercially available Gd chelates, such as gadopentetic acid Gd-DTPA (~3 s
−1·mM
−1) [
16], which means that these nanoparticles can be used as bimodal contrast agents for MR and optical imaging.
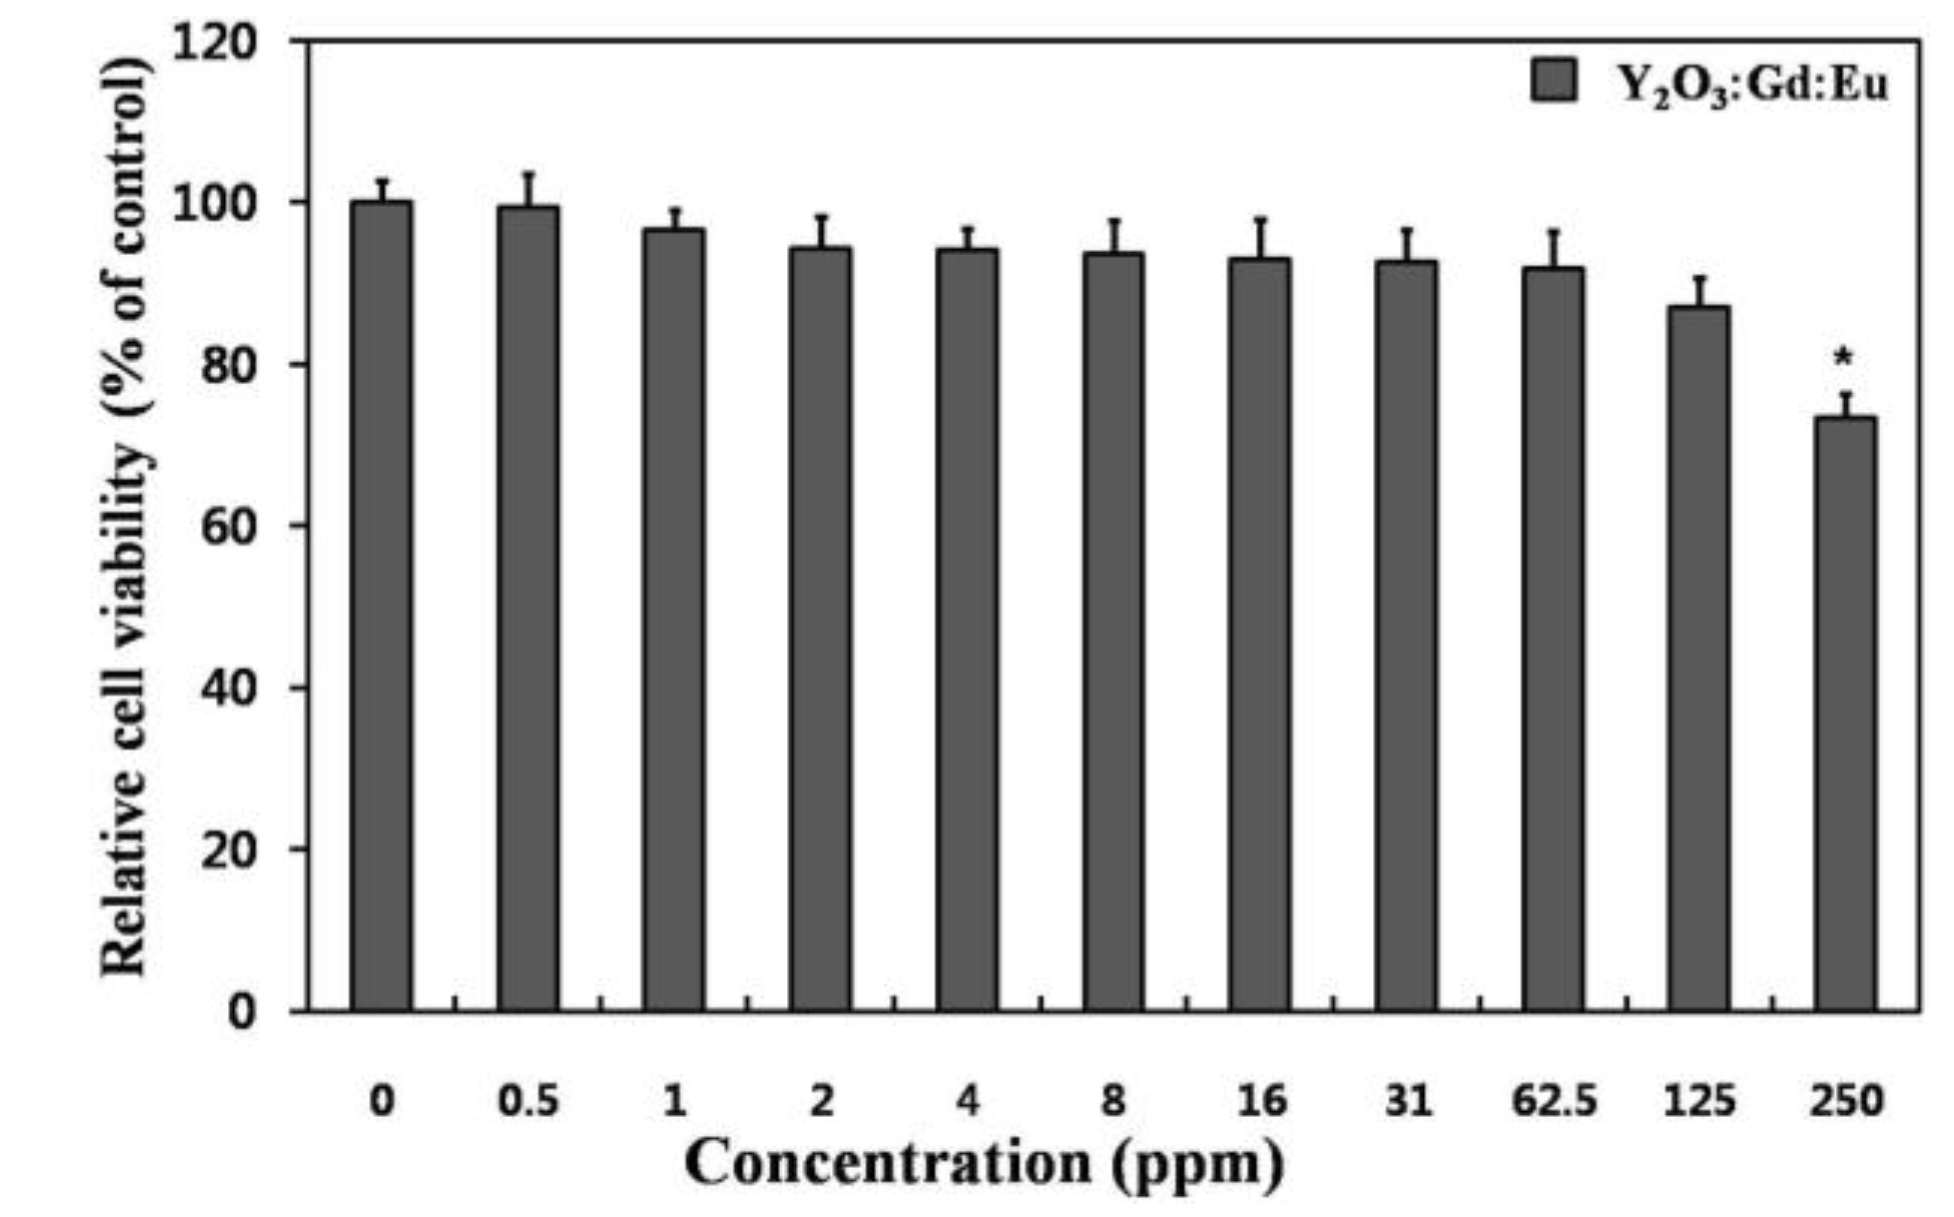
The cytotoxicity was measured to test the biosafety of the 10 mol % Gd
3+ codoped nanoparticles.
Figure 4 shows the cytotoxicity profiles of the nanoparticles in L-929 fibroblastic cells, which were determined using a WST-8 assay. The L-929 fibroblastic cells showed a noticeable concentration-dependent decrease in their relative cell viability. The prepared nanoparticles caused no significant decrease in cell viability at concentrations less than 60 ppm. This value is much higher than reported 8–10 ppm for Gd
2O
3-based nanoparticles [
6,
8]. Therefore, considering the in vitro cytotoxicity only, 10 mol % Gd
3+ codoped nanoparticles can be used safely for bio-imaging at doses lower than 60 ppm.
To reveal the optical imaging potential of the 10 mol % Gd
3+ codoped nanoparticles, a cultured monolayer of L-929 cells was incubated in the culture medium with a nanoparticle suspension at 10 ppm.
Figure 5 shows that the L-929 cells grow with normal fibroblast-like morphologies after labeling with nanoparticles. The bright red fluorescence from the nanoparticles was observed mainly in the cytoplasm rather than inside the nuclei, suggesting that the nanoparticles could make cell imaging possible through efficient internalization into the cells with a uniform distribution in the cytoplasm. Therefore, the Gd-codoped nanoparticles can be utilized easily for clinical MRI applications and optical cell tracking.
3. Materials and Methods
3.1. Nanoprobes Preparation
Analytical graded Y
2O
3 (99.99%), Eu
2O
3 (99.99%), Gd
2O
3 (99.99%), HNO
3 (70.0%), and urea (99.0%–100.5%) were purchased from Sigma-Aldrich (St. Louis, MO, USA) and used as received. Spherical Y
2O
3 nanoprobes co-doped with Eu
3+ and Gd
3+ were fabricated using a urea homogeneous precipitation method using the reported protocols [
8,
9,
10,
11,
12]. Briefly, a sealed beaker with a freshly prepared aqueous solution of rare-earth nitrates (0.0005 mol in 40 mL of H
2O) was placed into an electrical furnace and heated to 90 °C for 1.5 h. The dried synthesized precipitates were then calcined in air at 800 °C for 1 h to produce the oxide NPs. In all cases, the Eu
3+ doping concentration was kept constant at 1 mol %, whereas the Gd
3+ concentration was varied from 0 to 10 mol %.
3.2. Characterization
The structure of the prepared powders was examined by XRD Bruker D8 Discover (Billerica, MA, USA) using Cu-Kα radiation (λ = 0.15405 nm) at a 2θ scan range 20°–60° 2θ. The morphology of the particles was characterized by field emission scanning electron microscopy FESEM Carl Zeiss Supra 25 (Oberkochen, Germany) equipped with EDX. Size distribution and zeta potentials of the obtained nanoprobes were measured using a Nano ZS Zetasizer (Malvern, UK). The photoluminescence PL measurements were performed using a Hitachi F-7000 (Tokyo, Japan) spectrophotometer equipped with a 150 W Xenon lamp as the excitation source. The T1-weighted images were obtained using a 1.5 T MRI scanner Siemens (Munich, Germany) using the T1-weighted spin-echo method (TR/TE = 500 ms/15 ms, field of view (FOV) = 100 mm × 100 mm, slice thickness = 2 mm, matrix = 256 × 204, number of excitations (NEX) = 2). All measurements were performed at a room temperature of 22 ± 1 °C.
3.3. Cell Culture and Cytotoxicity Assay
A murine fibroblast cell line (L-929 cells from subcutaneous connective tissue) was obtained from the American Type Culture Collection (ATCC CCL-1™, Rockville, MD, USA). The cells were routinely maintained in Dulbecco’s modified Eagle’s medium (Sigma-Aldrich, St. Louis, MO, USA), supplemented with 10% fetal bovine serum (Sigma-Aldrich, St. Louis, MO, USA) and 1% antibiotic antimycotic solution (including 10,000 units penicillin, 10 mg streptomycin and 25 mg amphotericin B per mL, Sigma-Aldrich, St. Louis, MO, USA) at 37 °C in 95% humidity and 5% CO2. The number of viable cells was indirectly quantified using highly water-soluble tetrazolium salt [WST-8,2-(2-methoxy-4-nitrophenyl)-3-(4-nitrophenyl)-5-(2,4-disulfophenyl)-2H-tetrazolium, monosodium salt] (Dojindo Lab., Kumamoto, Japan), reduced to a water-soluble formazan dye by mitochondrial dehydrogenases. The cell viability was found to be directly proportional to the metabolic reaction products obtained in WST-8. Briefly, the WST-8 assay was conducted as follows. L-929 cells were treated with increasing concentration (0–250 ppm) of nanoprobes and then incubated with WST-8 for the last 4 h of the culture periods (24 h) at 37 °C in the dark. Parallel sets of wells containing freshly cultured nontreated cells were regarded as negative controls. The absorbance was determined to be 450 nm using an ELISA reader (SpectraMax® 340, Molecular Device Co., Sunnyvale, CA, USA). The relative cell viability was determined as the percentage ratio of the optical densities in the medium (containing the nanoprobes at each concentration) to that of the fresh control medium.
3.4. Fluorescence Microscopy
To examine the cellular uptake and distribution of nanoprobes within the L-929 cells and subsequent cell imaging, the cells were treated with 10 ppm of nanoprobes for 4 h. After treatment, the cells were fixed with 3.5% paraformaldehyde (Sigma-Aldrich) in 0.1 M phosphate buffer (pH = 7) for 10 min at room temperature and immediately observed under a fluorescence microscope (IX81-F72, Olympus Optical, Osaka, Japan).
3.5. Statistical Analysis
All variables were tested in three independent cultures for cytotoxicity assay, which was repeated twice (n = 6). Quantitative data are expressed as the mean ± standard deviation (SD). Data were tested for homogeneity of variances using the test of Levene, prior to statistical analysis. Statistical comparisons were carried out by a one-way analysis of variance (ANOVA), followed by a Bonferroni test for multiple comparisons. A value of p < 0.05 was considered statistically significant.


 ,
, 
