Laminated Copper Nanocluster Incorporated Antioxidative Paper Device with RGB System-Assisted Signal Improvement


Department of Chemistry, National Taiwan University, Taipei 10617, Taiwan
*
Author to whom correspondence should be addressed.
†
These authors contributed equally to this work.
Nanomaterials 2018, 8(2), 97; https://doi.org/10.3390/nano8020097
Submission received: 3 January 2018
/
Revised: 30 January 2018
/
Accepted: 7 February 2018
/
Published: 9 February 2018
Abstract
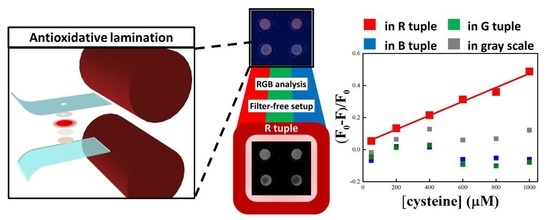
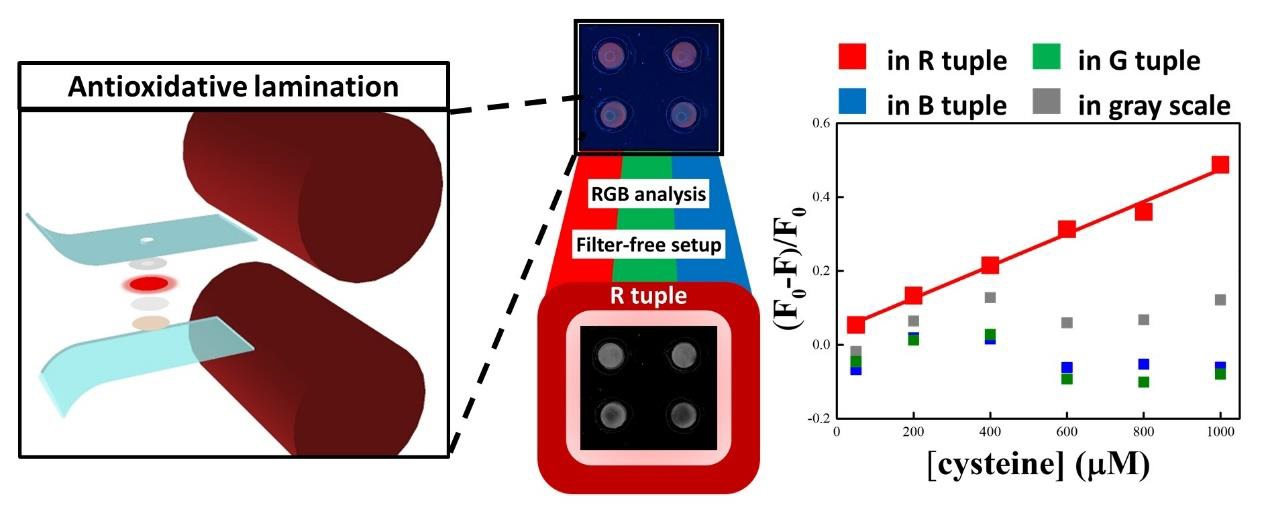
:Paper-based analytical devices are an emerging class of lightweight and simple-to-use analytical platform. However, challenges such as instrumental requirements and chemical reagents durability, represent a barrier for less-developed countries and markets. Herein, we report an advanced laminated device using red emitting copper nanocluster and RGB digital analysis for signal improvement. Upon RGB system assistance, the device signal-to-background ratio and the calibration sensitivity are highly enhanced under a filter-free setup. In addition, the calibration sensitivity, limit of detection, and coefficient of determination are on par with those determined by instrumental fluorescence analysis. Moreover, the limitation of using oxidation-susceptible fluorescent nanomaterials is overcome by the introduction of protecting tape barriers, antioxidative sheets, and lamination enclosing. The robustness of device is highly advanced, and the durability is prolonged to more than tenfold.
1. Introduction
Paper-based analytical devices have gained considerable attention due to several attractive attributes, such as low cost, lightweight, disposable, biocompatible, environment-friendly, and ease of modification [1,2,3,4]. Their inexpensiveness and simple-to-use properties offer underserved communities an opportunity to improve life quality in healthcare, environmental safety, and disease control [5,6,7]. However, remaining challenges, including robust quantitative and sensitive detection, elongated device durability, and straightforward manufacturing processes restrict the widespread usage of such devices [8,9]. Moreover, paper devices, in conjunction with fluorescence-based approaches that possess lower background and higher sensitivity than colorimetric methods, are still very limited. This is due to the requirement of not only indispensable excitation sources, but also suitable optical filter setups to cut off background fluorescence from original excitation, scattering light of paper substrates, and other presented fluorophores in sample matrix [5,6,7,10,11]. These limitations have restricted their use in less-developed countries and increased marketing barriers.
A good choice of optical sensing probe is a straightforward approach to solve the aforementioned device fabrication problems. Metal nanocluster (NC) (e.g., Au [12,13], Ag [14,15], and Cu [16,17]) is an emerging class of nanomaterial with large Stokes shifts fluorescence emission that can be used as sensors toward a wide range of targets, such as DNA/RNA [17,18,19], small biomolecules [20], metal ions [16,21], pH sensing [22,23,24], and cancer cells [25,26,27]. Due to sub-nanometer to 10 nm size range, their continuous electronic bands break into discrete energy levels, leading to dramatically different optical, electrical, and chemical properties, as compared to nanoparticles [28,29]. The molecule-like fluorescent properties are determined by size, capping ligands, and oxidation state of metals [30,31,32]. Their high photostability, large Stokes shifts, and good biocompatibility properties make them highly potent nanomaterials for applications in paper-based analytical devices [16,25,27]. For instance, filter paper strips embedded with Tb3+/AuNC applied to Hg2+ detection exhibited 500-fold higher sensitivity than that of the fluorescent dye-based approach [33,34]. A wax patterned plate-format paper-based device conjugated with size-tunable CuNC aggregates was also demonstrated to provide faster and more cost-effective H2S sensing than instrumental photoluminescence analysis [35]. However, the concerns of environment-induced harms on sensing reagents performance and device durability remains on these paper-based platforms.
In addition to probe picking, quantitative analysis with minimal instrumental requirements is another important task. Among digital analysis methods, RGB system is the most common mode [36,37,38,39,40], which represents colors through three tuples, red (R), green (G), and blue (B) [41,42]. The idea of three-color system was first reported by Jakob Christoffel Le Blon in 1722 [43]. The color reproduction can be adjusted by red, green, and blue lights, whose wavelengths are around 700 nm, 550 nm, and 440 nm, respectively [44]. Although the RGB color analysis is too simple to represent certain hues [45], it is still an easy and adequate approach to separate tints of images for quantitative analysis. The intensity scale of each monochrome is defined from 0 (dark) to 255 (bright). For example, blue color can be displayed by 255 of B value, while R and G values are 0. Similarly, red color represents 255 of R value, as its G and B values are 0. The RGB digital processing was therefore applied to colorimetric paper-based devices for convenient analysis [38,39,40].
In this study, the use of RGB system to assist a large Stokes shift nanomaterial-incorporated paper-based device for practical and promising quantitative analysis without requiring optical filters is investigated for the first time. A CuNC-incorporated antioxidative laminated paper device with RGB digital analysis is developed, where CuNC is selected as the model nanomaterial, due to its ease of oxidation, compared to Au and Ag [23,25,46]. The RGB digital analysis eliminates the matrix background without any complicated optical filter setup for convenient target detection. Owing to the red emitting color of CuNC, blue to green color regions of fluorescence interference can be easily removed by image conversion into R tuple. Not only the calibration sensitivity, but also the coefficient of determination is highly improved under this filter-free setup by observing the R tuple only. The design, moreover, integrates lamination strategy and antioxidative sheets to protect oxidation-susceptible CuNC, prolonging the device shelf life to more than tenfold.
2. Results and Discussion
A red-emitting CuNC synthesis method using commercially available bovine serum albumin (BSA) under ascorbic acid-assisted reduction is employed in this study, as displayed in Figure 1A. BSA provides not only steric protection via the strong Cu–S bonding during the encapsulation process [22], but also performs as a reductant when the reaction pH is adjusted to ~12 [12]. After 30 min of BSA and copper ion solution incubation, ascorbic acid is introduced into the mixture as an assisting reductant for rapid CuNC formation. As shown in inset of Figure 1B, the prepared solution is pale brown with red fluorescence emission under 365 nm of excitation, suggesting the formation of CuNC. The distinct UV–vis absorption peak of CuNC at ~350 nm (Figure S1, Supplementary Materials) indicates molecule-like optical transition attributed to quantum confinement effect [47,48], which is significantly different from localized surface plasmon resonance of copper nanoparticles [49,50]. The fluorescence property (Figure 1B) of synthesized CuNC displays maximum excitation and emission peaks at 392 and 648 nm, respectively, with a large Stokes shift of 256 nm. To characterize the synthesized 3 nm nanocluster, fluorescence lifetime, XPS, HRTEM, DLS (Figures S2–S5, Supplementary Materials) analysis were carried out, and the results are carefully discussed in the Supplementary Materials. The capability of synthesized CuNC as a sensing probe is demonstrated by detecting cysteine, a critical disease indicator, via the strong interaction between them [51,52,53,54]. As shown in Figure S6 (Supplementary Materials), fluorescence spectra reveal that cysteine addition lowers the fluorescence emission intensity of CuNC solution. Meanwhile, a slight blue shift in the emission spectra is also observed resulting from size change of CuNC. The observations of different thiol group-containing small molecules test and DLS characterization (Figures S5, S7, and S8, Supplementary Materials) suggest that the cysteine-induced CuNC fluorescence quenching is attributed to the decomposition of CuNC into smaller clusters or metal complexes, as depicted in Figure S9 (Supplementary Materials). (Detailed mechanism discussions are illustrated in the Supplementary Materials).
To build a fluorescent nanomaterial-based sensing device, the problem of oxidation-induced material property change needs to be solved. A lamination strategy is proposed to overcome this restriction and prolong device lifetime. As illustrated in Figure 1C, the device enclosed within thermoplastic films consists of a detection zone containing CuNC, an antioxidant sheet (loaded with ascorbic acid), and two protecting tapes. The analytical data of the fabricated device is collected as photographs recorded with a digital camera (Leica D-LUX 6, Leica Camera AG, Wetzlar, Germany) as shown in Figure 1D. Under UV lamp (6 W, 365 nm) illumination, the CuNC–paper composite shows clear red color emission, whereas the raw paper material does not. After cysteine introduction, this red emission reduces, due to cysteine-induced metal cluster etching. As can be seen in Figure 1D, the blue color background in the original image complicates the visualization detection and interferes with following quantitative analysis. The use of previously-studied gray scale conversion [55,56,57], however, still gives independent assay brightness reading regardless of CuNC existence. This indicates that the background interference stands unresolved when only gray scale analysis is employed without filter setups. On the other hand, photograph colors can be separated into R, G, and B tuples under the RGB system analysis. In Figure 1D, similar intensities in G and B tuples, regardless of cysteine addition, indicate severe background interference, because of scattering and reflection of excitation light and matrix auto-fluorescence, which mostly appear in the blue-green region. By contrast, these background noise levels are drastically lower under R tuple with the existence of CuNC, which emit red color due to the large Stokes shift of over 250 nm. Moreover, the image contrast change of CuNC–paper composites under cysteine addition is highly enhanced comparing to the original one without any digital analysis processing. Since the signal-to-background (S/B) ratio is defined as the intensity ratio of CuNC–paper composite over raw paper [15,58], the S/B ratio in R tuple is enhanced over 4 times as compared to other color tuples. This RGB analysis is therefore a useful tool to greatly reduce the fluorescence background of laminated paper device without requiring any optical filter setup.
The capability of CuNC-based paper device fluorescence emission in R tuple is further tested by different concentrations of cysteine ranging from 0 to 2000 µM, as presented in Figure 2A. The red emission of CuNC–paper composite reduces when cysteine concentration is raised. After R tuple analysis, the contrast difference is highly improved especially at lower concentrations. It is found that the intensity of R value dramatically decreases along with increasing cysteine concentration, whereas the G and B values exhibit no obvious change as shown in Figure 2B. It is important to mention that the calibration sensitivity (the slope of calibration curve) of R value changes is over 4-fold higher than others as displayed in Figure S10 (Supplementary Materials). In addition, the coefficient of determination (R2) in R tuple is higher than 0.99, while others are lower than 0.50. The calibration curve is constructed from the intensity value in R tuple of the RGB system, and represents a linear response within the 10–1000 µM cysteine range (Figure 2C). Based on the limit of detection (LOD) definition as the standard deviation of y-intercept to the slope of calibration curve ratio over 3 [59], the LOD is calculated to be 70 μM. The cysteine quantification by fluorescence spectrometer is also carried out, as shown in Figure 2D. The calibration sensitivity, coefficient of determination, and LOD of this device are on par with those obtained from instrumental fluorescence analysis. These results indicate that the RGB system can improve quantitative analysis and minimize the instrumental requirements in the optical filter-free paper device using red-emitting nanomaterials as sensing probes.
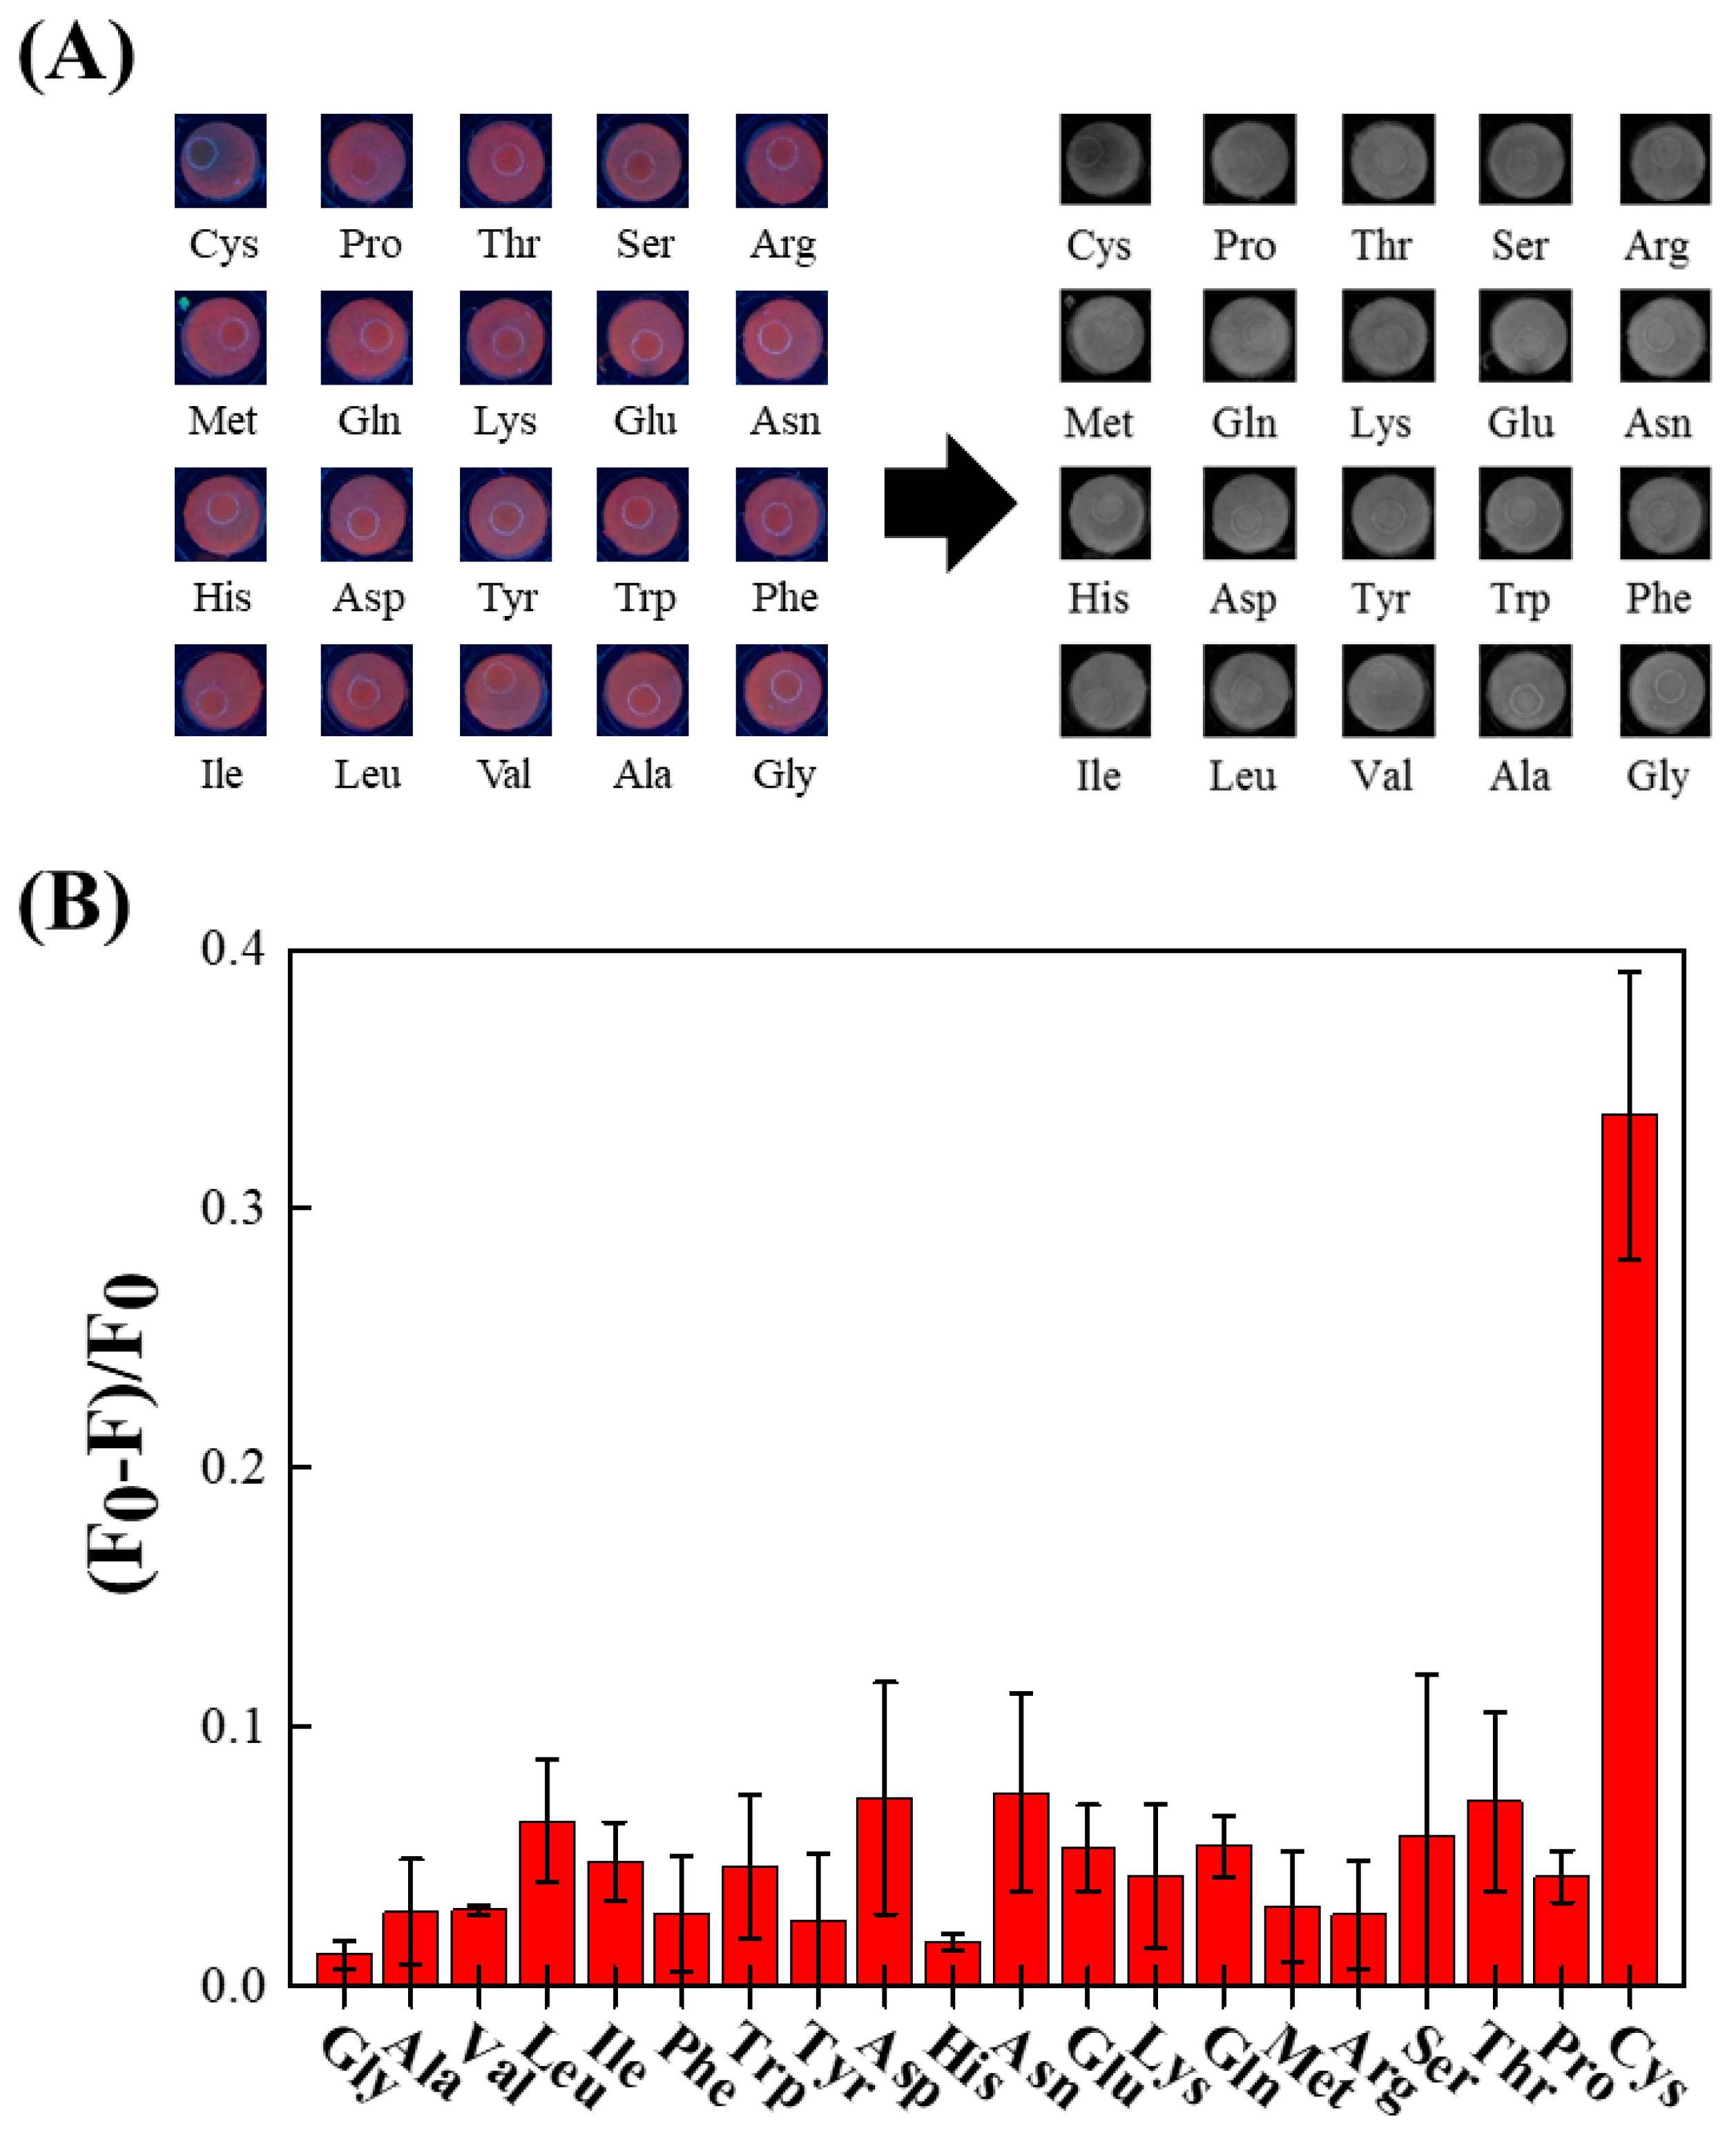
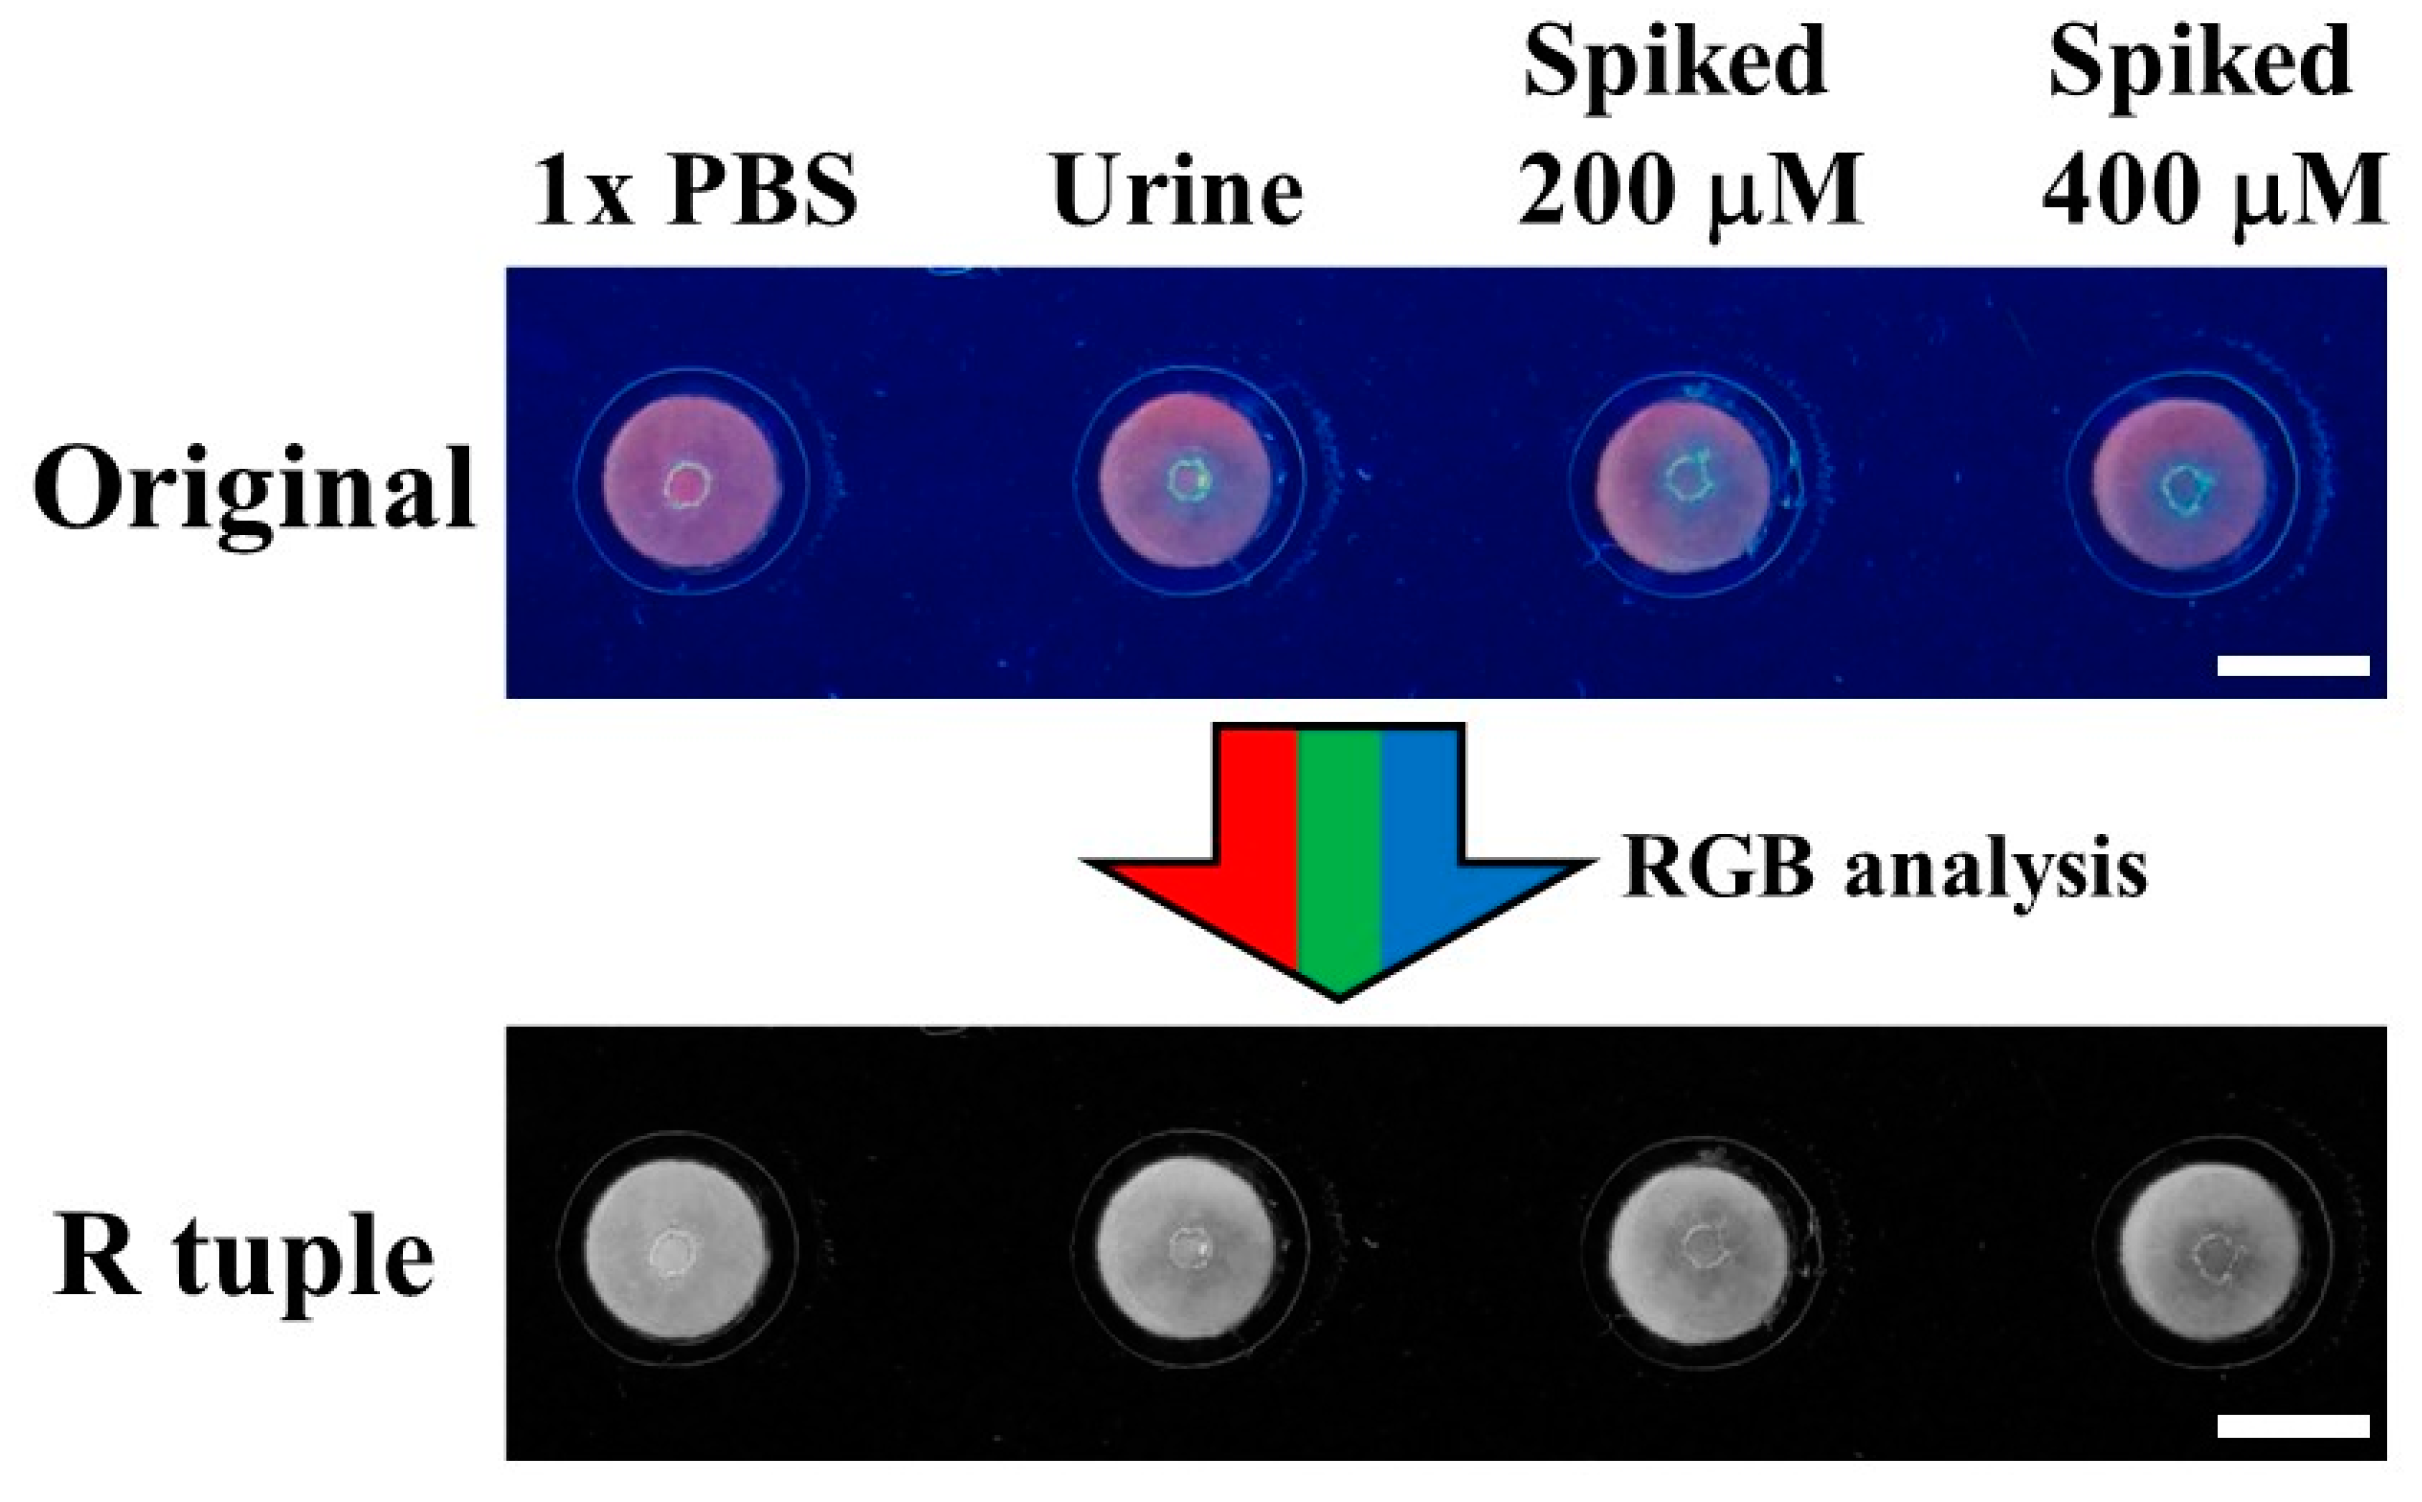
The fabricated devices also present excellent selectivity toward cysteine over other natural amino acids, as shown Figure 3. To test the proposed device for real samples, the direct determination of cysteine in complex matrixes such as urine is studied. The physiological level of cysteine in urine can mirror its content in plasma, while this non-invasive detection has several advantages, including patient compliance, easy sample handling, and convenient collection [60]. As shown in Figure 4, the fresh urine sample donated by the healthy volunteer is introduced onto the CuNC-based paper device without any pretreatment. The detected average urinary cysteine concentration is calculated to be 130.90 ± 9.18 μM (Table 1), which is in good agreement with the reported results [61,62]. The recovery of cysteine by standard addition in urine samples ranges from 102% to 104% with a < 10% relative error, indicating the high accuracy and acceptable reproducibility of our device.
Using environment sensitive materials as sensing probes in paper-based devices may result in reactivity loss, due to oxidative degradation with exposed reagents. To conquer this hindrance, the lamination strategy can be utilized to improve the reagent durability, as well as device mechanical properties. Compared to recently reported laminated paper devices [63,64], two main significant advances are presented in this study: (1) tape barriers, and (2) antioxidative sheets.
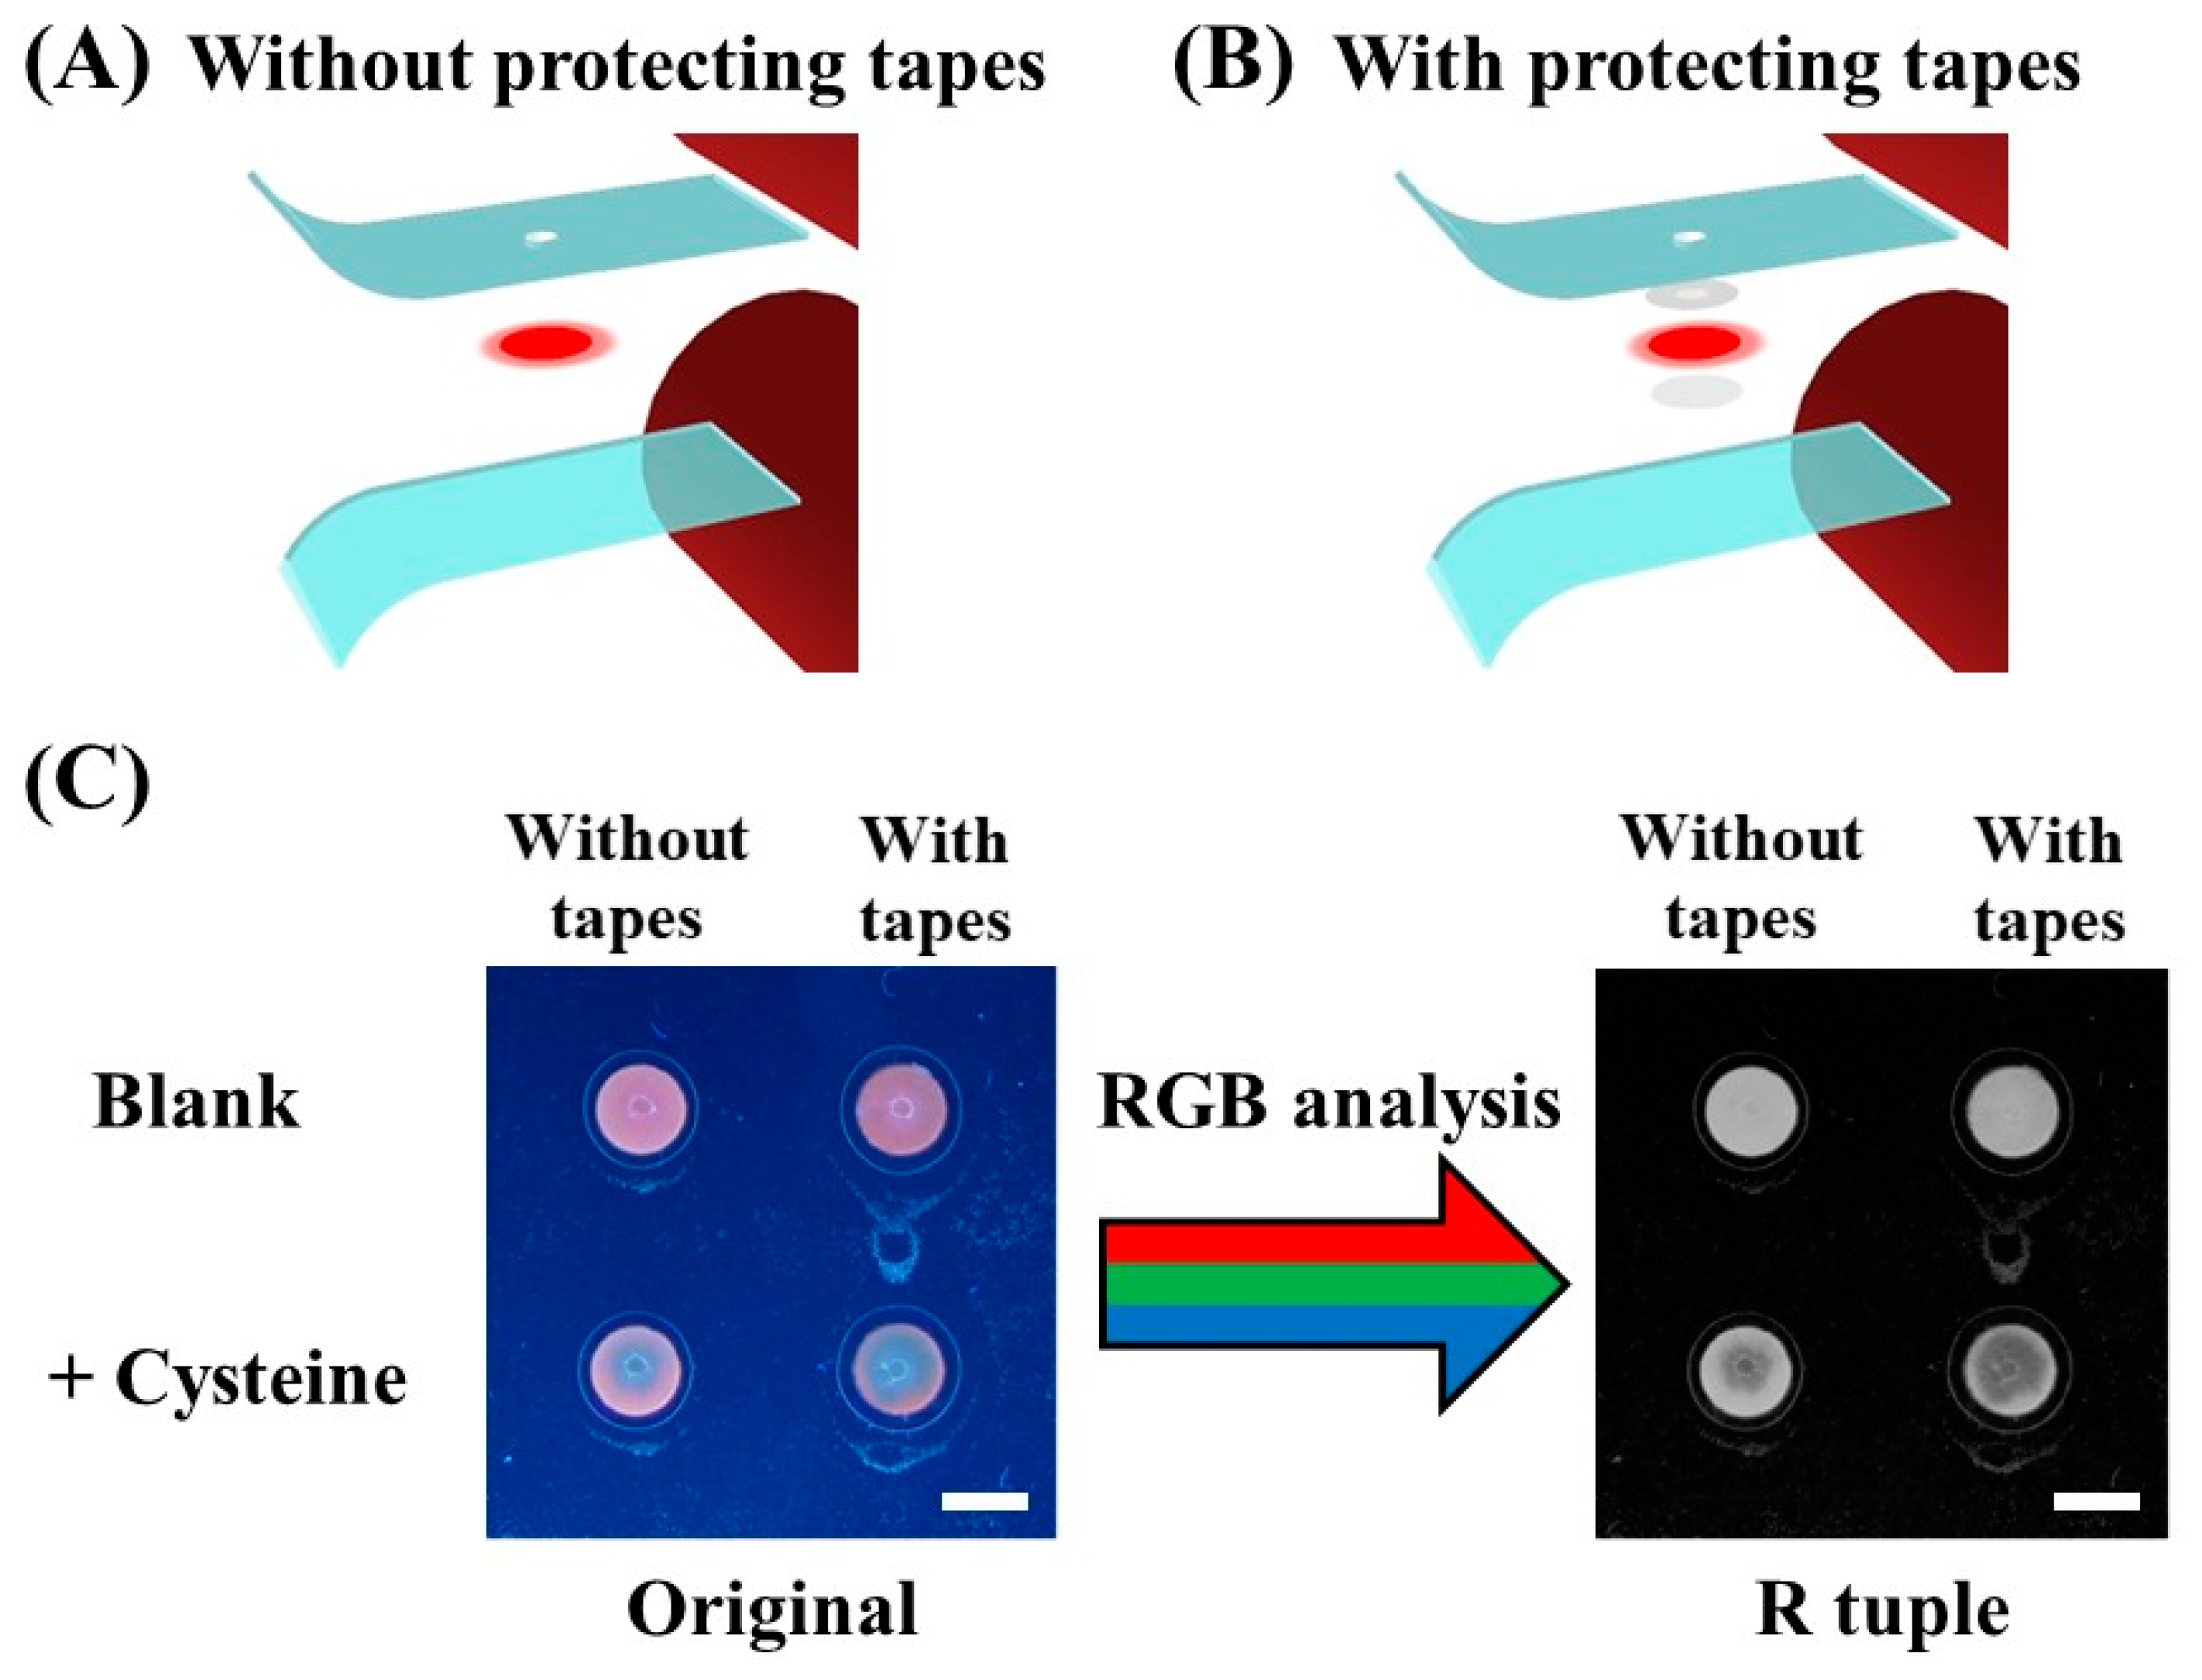
The introduced tape layers protect reagents in the detection area from lamination material interferences. As illustrated in Figure 1C and Figure 5B, the tape above the detection zone is employed to avoid the cover film adhesive contamination, while the other one is a barrier to prevent the antioxidant sheet from direct contact. Furthermore, these layers also highly reduce the thermoplastic adhesives’ permeation into paper substrates, preventing reaction inhomogeneity. As shown in Figure 5, the analyte solution is difficult to wick through paper substrates, and react with CuNC homogeneously without the use of tape barriers.
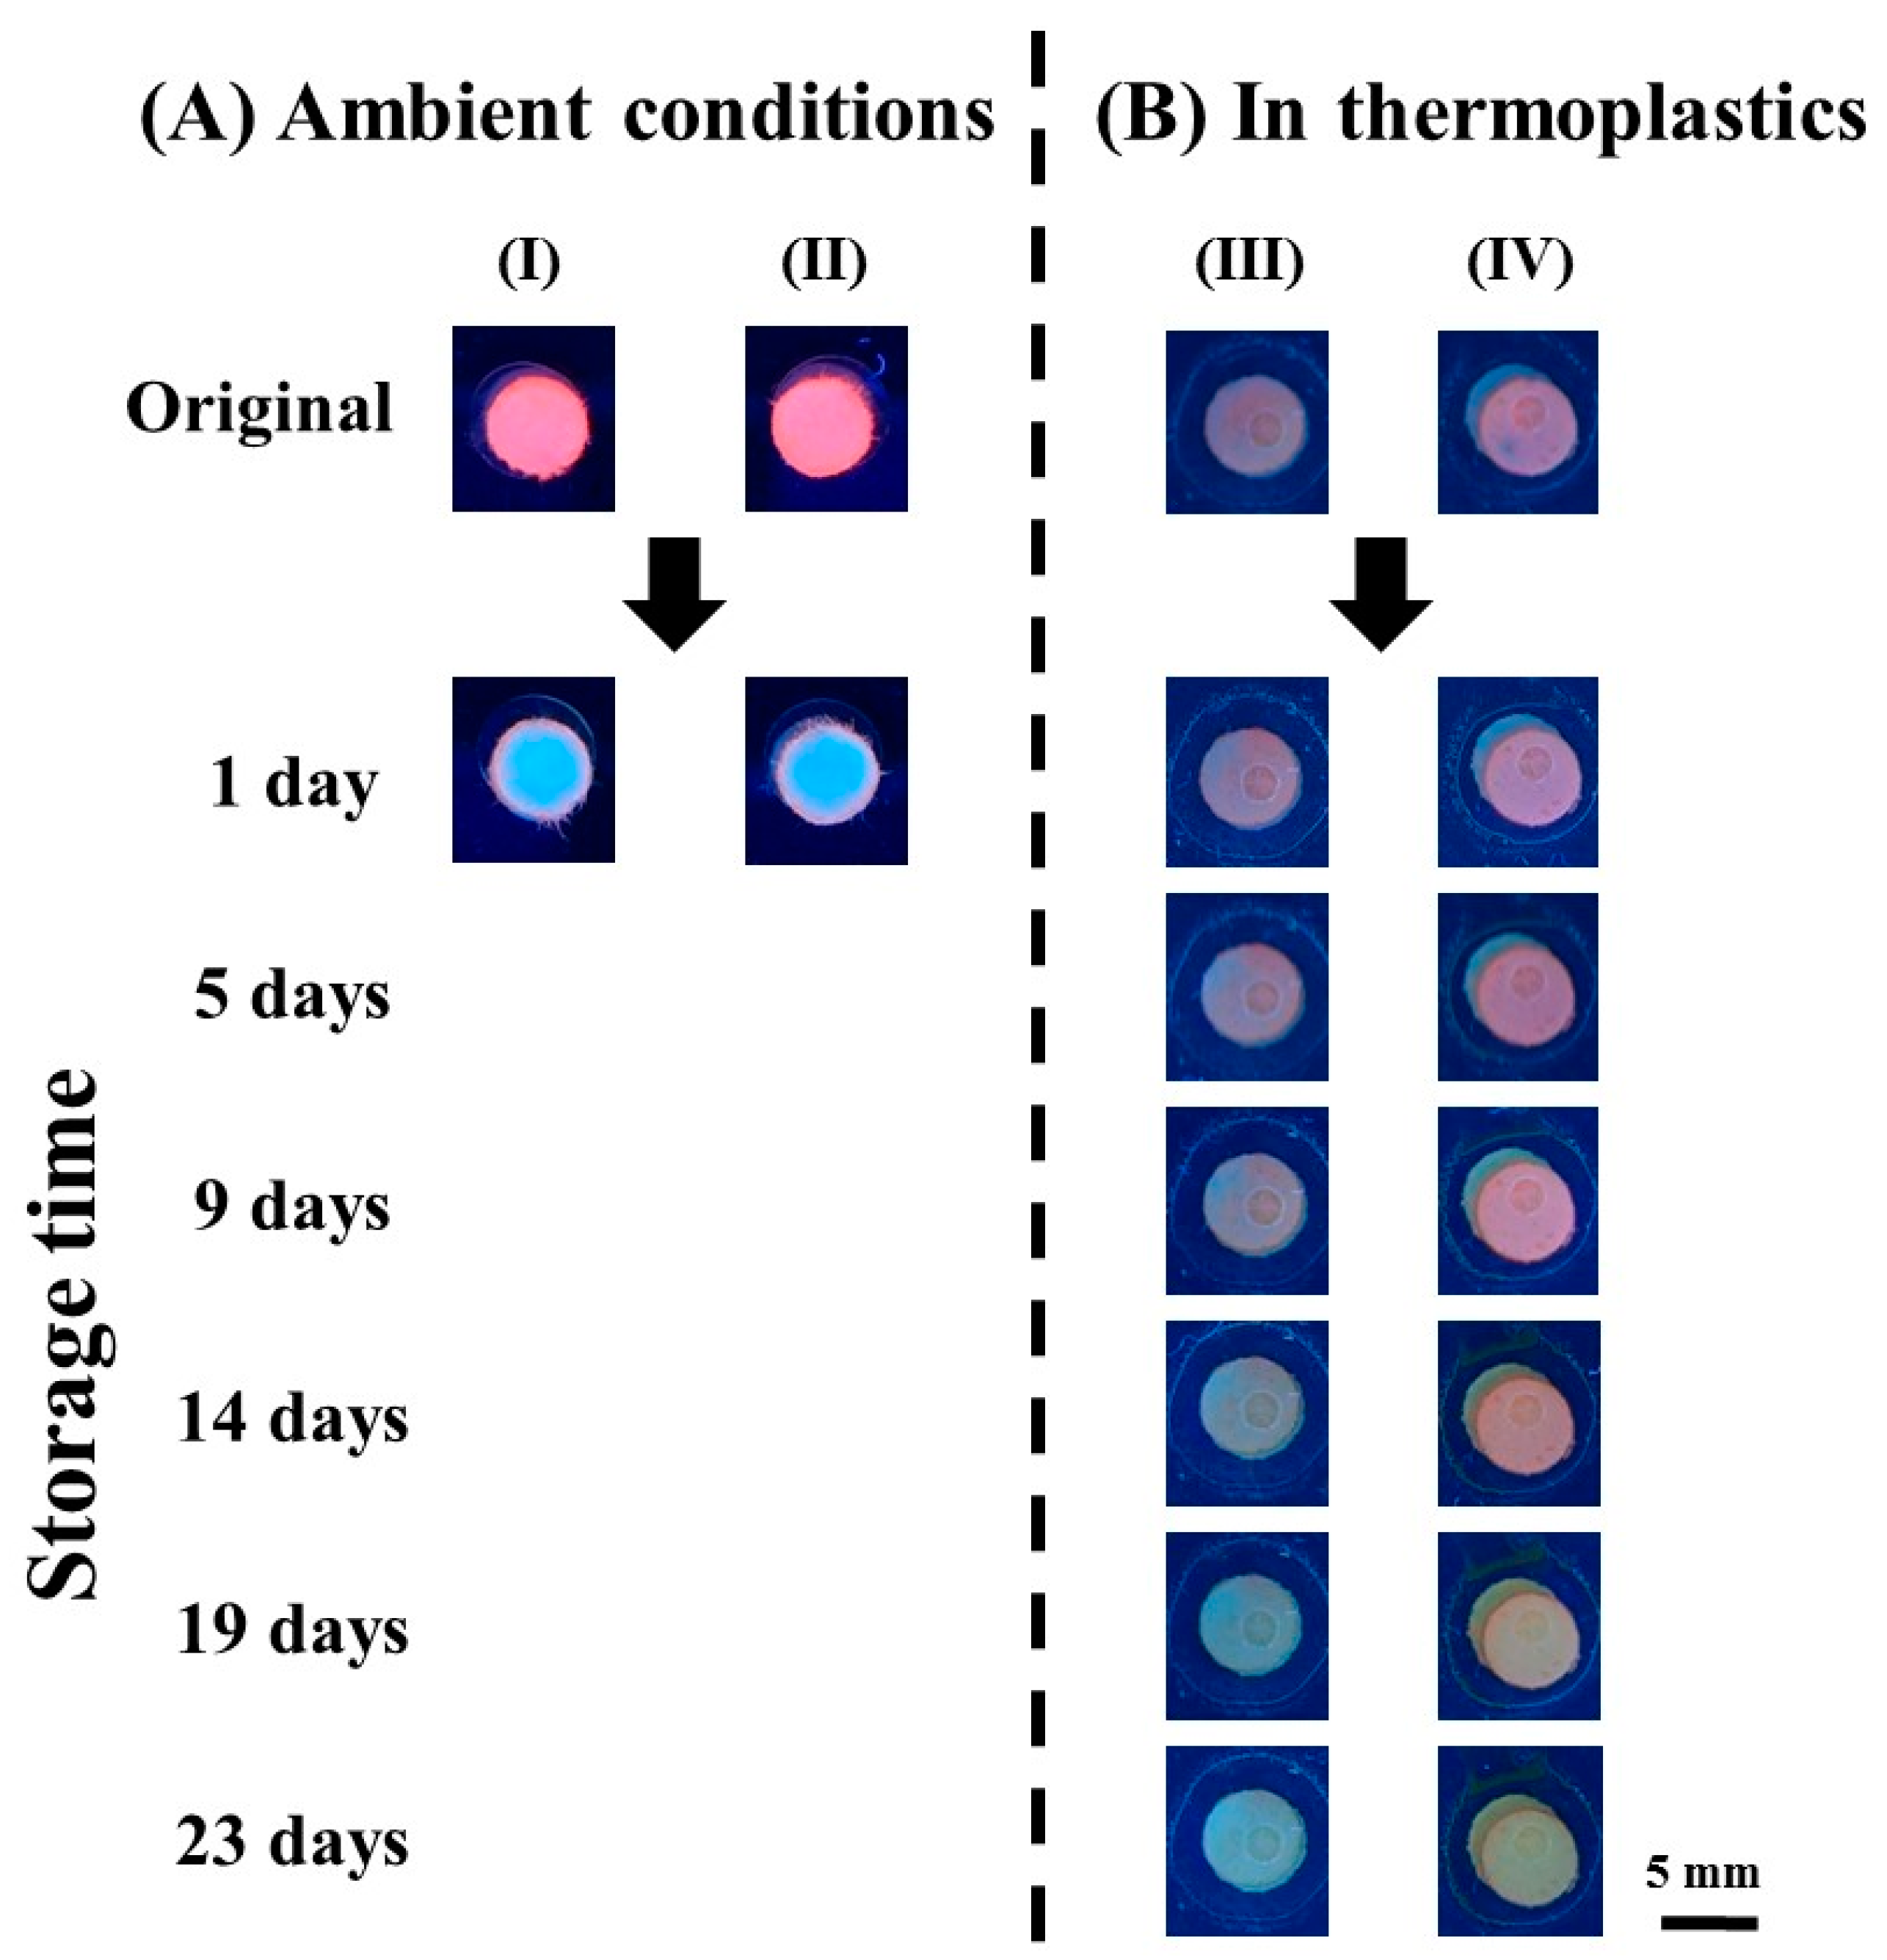
The advantage of antioxidative sheets insertion in laminated platforms is demonstrated in Figure 6. The red fluorescence emission of CuNC–paper composites without lamination protection (column I) and with antioxidative sheets (column II) disappear after just one day of ambient storage. This fast degradation can be attributed to CuNC oxidation, owing to their low oxidation potential (E0 = 0.34 V) [25]. On the other hand, the protection provided by thermoplastic films can extend CuNC lifetime, as displayed in Figure 6B. Without antioxidative sheets (column III), the CuNC–paper composites keep their fluorescence emission property only up to 5 days via laminated PET film protection. The low oxygen transmission rate of PET films (8.4 cm3 m−2 day−1 atm−1) [65] effectively slows down the cluster degradation, but cannot prevent air penetration completely. Inspired by common food packaging techniques, antioxidative sheets are placed underneath the CuNC–paper composites, and enclosed by thermoplastic films altogether, to greatly prolong the device shelf life more than 20 days, as displayed in column IV of Figure 6B. This suggests that thermoplastic films can lower the influence from air transmission, while the antioxidative reagent is able to devour the penetrated oxygen from atmosphere. Although the desired durability of disposable analytical devices depends on the reagents used [63,66,67], we achieved significant improvement as the shelf life of easily oxidized model nanomaterial CuNC is extended to more than tenfold. It should be noted that this antioxidation strategy is also promising for other devices via simple operation and requirements, without any substrate chemical modification. In addition, the effect of varied temperatures and humidity levels on detected results are expected to be minimal, due to protection from the antioxidative sheets and polymer films. Thus, upon the combination of thermoplastic films, protecting tape barriers, and antioxidative sheets, the use of oxidation-susceptible nanomaterials in RGB analysis-assisted paper device is achieved.
3. Experimental Section
Materials. Whatman filter paper (No. 40) with 8 µm pores was selected as the platform material. Thermal bonding lamination films (polyethylene terephthalate–ethylene-vinyl acetate, PET–EVA) with 80 µm thickness were purchased from Taiwan Halee international Co., Ltd. (Taipei, Taiwan). Bovine serum albumin (BSA) was provided by Bioman Scientific (Taipei, Taiwan). Twenty natural amino acids, l-glutathione, 3-mercaptopropionic acid, cysteamine, copper(II) nitrate (Cu(NO3)2), ascorbic acid, and chitosan were purchased from Sigma-Aldrich (St. Louis, MO, USA). Sodium hydroxide (NaOH), sodium dihydrogen phosphate, and sodium hydrogen phosphate were obtained from SHOWA (Tokyo, Japan). Ultrapure water (>18.2 MΩ cm), generated from ELGA PURELAB classic system (Taipei, Taiwan), was used in all experiments.
Synthesis of Red-Emitting Fluorescent CuNC. BSA solution (2.5 mL of 40 mg/mL) was first mixed with 2.5 mL Cu(NO3)2 solution (10 mM), and stirred for 5 min at 37 °C. Five hundred microliters of 1 M NaOH solution was then introduced to adjust the solution pH to 12, changing the color of the solution from green to violet. After 30 min, 1 mL freshly prepared ascorbic acid solution (0.5 M) was slowly dropped into the mixture under vigorous stirring. After 2 h of incubation, the solution color changed from violet to pale brown, which suggested the formation of CuNC. This CuNC solution was stored at 4 °C in the dark before use.
Characterization of CuNC. Absorption and fluorescence spectra of CuNC solutions were measured by the Thermo Evolution UV-220 spectrophotometer (Thermo Fisher Scientific Inc., Waltham, MA, USA) and the Varian Cary Eclipse fluorescence spectrophotometer (Varian Inc., Palo Alto, CA, USA), respectively. Dynamic light scattering (DLS) measurements were recorded by the Malvern Zetasizer Nano S Instrument (Malvern Instruments Ltd., Malvern, Worcs, UK) and all the scattered photons were collected at the scattering angle of 173°. High-resolution transmission electron microscopy (HRTEM) experiments were performed on the Philips Tecnai F20 G2 field-emission high-resolution transmission electron microscope (Thermo Fisher Scientific Inc., Waltham, MA, USA) with the use of 200 kV electron beams. X-ray photoelectron spectra (XPS) were collected by the Kratos Axis Ultra DLD X-ray photoelectron spectrometer microprobe (Kratos Analytical Ltd., Stretford, Manchester, UK) with a mono Al Kα radiation source (1486.71 eV).
Fabrication of Laminated CuNC–Paper Composite Devices. As shown in Figure 1C, each paper-based sensing strip enclosed within thermoplastic films consists of a detection zone with CuNC, an antioxidant sheet, and two protecting tapes. Detection zones were prepared by introducing 6.0 µL of CuNC solution onto a 5 mm diameter circular paper piece shaped by a commercial hole puncher, and vacuum dried in a desiccator for 20 min. The antioxidant sheet was fabricated by immersing a circular paper piece into the 0.5 M ascorbic acid/chitosan hydrogel for 4 min soaking. The porous tape (fabricated by a hole puncher) above the detection zone was employed to avoid the cover film adhesive contamination, while the other one was a barrier to prevent the antioxidant sheet direct contact. Before lamination, a 2 mm hole was drilled on the cover thermoplastic film for detection zone sample introduction. Finally, all components from top to down: cover film with the inlet hole, porous tape, detection zone loaded with CuNC, barrier tape, antioxidant sheet, and bottom film, were aligned and enclosed together through a heated roll laminator (TCC-6000, Tah Hsin Industrial Corp., Taichung, Taiwan). The lamination process was controlled under a constant rolling speed of 3 cm/s at 130 °C. The multi-layer components were therefore enclosed inside the thermoplastic films when heated through the roll laminator. An extra layer of thermoplastic film was adhered on top of the device to protect the detection zone from air exposure for storage purpose. Due to less adhesive of a single layer thermoplastic film, this additional layer can be easily peeled off from the device at the time of usage.
Analytical Assays with a Digital Camera. During target analysis, 6.0 µL of sample was introduced through the inlet, and the solution transited to the detection zones by capillary wicking. After 5 min of reaction, the CuNC emission color change was visualized under handheld 365 nm UV lamp (6 W) illumination from a UVP UVGL-58 lamp (Analytik Jena US, Upland, CA, USA). The device was placed in the dark to minimize ambient light influences, and the photo images were captured with a Leica D-LUX 6 digital camera (Leica Camera AG, Wetzlar, Germany). The collected images were analyzed by Adobe Photoshop CC 2014 (Adobe Systems Incorporated, San Jose, CA, USA), which separated the color into RGB tuples, or in gray value. The value in R tuple was selected for analyte quantification, due to its high S/B ratio and great coefficient of determination.
4. Conclusions
In conclusion, a laminated paper-based device using oxidation-susceptible CuNC for filter-free fluorescence detection of cysteine with RGB system-assisted signal improvement is reported. With the assistance of the RGB analysis, the S/B ratio and calibration sensitivity of CuNC-based paper device are enhanced for more than 4 times without using any optical filter, while the coefficient of determination stays above 0.99, suggesting great potential for quantitative analysis. The challenges of using environment sensitive materials are also overcome with the incorporation of protecting tape barriers, antioxidative sheets, and lamination enclosing design, which greatly improves the device durability to more than tenfold. The integrated nanomaterial-based sensor design, device lamination process, and RGB system-assisted signal improvement have further expanded the opportunity of paper sensing devices with lowered instrumental requirements. We envision this design to be potent in integrating with common portable devices, such as cellular phones, for real time and on-site diagnosis applications.
Supplementary Materials
The following are available online at https://www.mdpi.com/2079-4991/8/2/97/s1, Figure S1: UV–Vis absorption spectra, Figure S2: Fluorescence decay profile, Figure S3: X-ray photoelectron spectra, Figure S4: HRTEM image, Figure S5: DLS spectra, Figure S6: Fluorescence emission spectra of CuNC mixed with cysteine, Figure S7: Fluorescence emission spectra of CuNC mixed with different thiol group-containing molecules, Figure S8: DLS spectra of CuNC mixed with different thiol group-containing molecules, Figure S9: Schematic illustration of the cysteine detection mechanism, Figure S10: The correlation in between cysteine concentration and device image intensity in different digital analysis system.
Acknowledgments
This work was supported by the Taiwan Ministry of Science and Technology (MOST 104-2113-M-002-010-MY2, MOST 105-2622-M-002-003-CC2, MOST 106-2622-M-002-002-CC2, and MOST 106-2113-M-002-015-MY2). The authors would like to thank Huan-Tsung Chang and Chung-Yuan Mou at National Taiwan University for instrument supports; Tsung-Shing Wang at National Taiwan University, Chih-Ching Huang at National Taiwan Ocean University, Mei-Lin Ho at Soochow University, and Paul S. Weiss at University of California, Los Angeles for helpful discussions.
Author Contributions
The experiments were conducted by Chong-You Chen and Chia-Lin Chen. The manuscript was prepared by Chong-You Chen, Chang-Ming Wang, and Wei-Ssu Liao.
Conflicts of Interest
The authors declare no conflict of interest.
References
- Zhao, W.A.; van den Berg, A. Lab on Paper. Lab Chip 2008, 8, 1988–1991. [Google Scholar] [PubMed]
- Liana, D.D.; Raguse, B.; Gooding, J.J.; Chow, E. Recent Advances in Paper-Based Sensors. Sensors 2012, 12, 11505–11526. [Google Scholar] [CrossRef] [PubMed]
- Cate, D.M.; Adkins, J.A.; Mettakoonpitak, J.; Henry, C.S. Recent Developments in Paper-Based Microfluidic Devices. Anal. Chem. 2015, 87, 19–41. [Google Scholar] [CrossRef] [PubMed]
- Ju, Q.; Uddayasankar, U.; Krull, U. Paper-Based DNA Detection Using Lanthanide-Doped LiYF4 Upconversion Nanocrystals as Bioprobe. Small 2014, 10, 3912–3917. [Google Scholar] [CrossRef] [PubMed]
- Martinez, A.W.; Phillips, S.T.; Whitesides, G.M.; Carrilho, E. Diagnostics for the Developing World: Microfluidic Paper-Based Analytical Devices. Anal. Chem. 2010, 82, 3–10. [Google Scholar] [CrossRef] [PubMed]
- Yetisen, A.K.; Akram, M.S.; Lowe, C.R. Paper-Based Microfluidic Point-of-Care Diagnostic Devices. Lab Chip 2013, 13, 2210–2251. [Google Scholar] [CrossRef] [PubMed]
- Hu, J.; Wang, S.; Wang, L.; Li, F.; Pingguan-Murphy, B.; Lu, T.J.; Xu, F. Advances in Paper-Based Point-of-Care Diagnostics. Biosens. Bioelectron. 2014, 54, 585–597. [Google Scholar] [CrossRef] [PubMed]
- Chin, C.D.; Linder, V.; Sia, S.K. Lab-on-a-chip Devices for Global Health: Past Studies and Future Opportunities. Lab Chip 2007, 7, 41–57. [Google Scholar] [CrossRef] [PubMed]
- Lee, W.G.; Kim, Y.-G.; Chung, B.G.; Demirci, U.; Khademhosseini, A. Nano/Microfluidics for Diagnosis of Infectious Diseases in Developing Countries. Adv. Drug Deliv. Rev. 2010, 62, 449–457. [Google Scholar] [CrossRef] [PubMed]
- Li, X.; Ballerini, D.R.; Shen, W. A Perspective on Paper-Based Microfluidics: Current Status and Future Trends. Biomicrofluidics 2012, 6, 011301. [Google Scholar] [CrossRef] [PubMed]
- Scida, K.; Li, B.; Ellington, A.D.; Crooks, R.M. DNA Detection Using Origami Paper Analytical Devices. Anal. Chem. 2013, 85, 9713–9720. [Google Scholar] [CrossRef] [PubMed]
- Xie, J.P.; Zheng, Y.G.; Ying, J.Y. Protein-Directed Synthesis of Highly Fluorescent Gold Nanoclusters. J. Am. Chem. Soc. 2009, 131, 888–889. [Google Scholar] [CrossRef] [PubMed]
- Lin, C.-A.J.; Yang, T.-Y.; Lee, C.-H.; Huang, S.H.; Sperling, R.A.; Zanella, M.; Li, J.K.; Shen, J.-L.; Wang, H.-H.; Yeh, H.-I.; et al. Synthesis, Characterization, and Bioconjugation of Fluorescent Gold Nanoclusters toward Biological Labeling Applications. ACS Nano 2009, 3, 395–401. [Google Scholar] [CrossRef] [PubMed]
- Zhou, T.; Huang, Y.; Li, W.; Cai, Z.; Luo, F.; Yang, C.J.; Chen, X. Facile Synthesis of Red-Emitting Lysozyme-Stabilized Ag Nanoclusters. Nanoscale 2012, 4, 5312–5315. [Google Scholar] [CrossRef] [PubMed]
- Yeh, H.-C.; Sharma, J.; Han, J.J.; Martinez, J.S.; Werner, J.H. A DNA-Silver Nanocluster Probe that Fluoresces upon Hybridization. Nano Lett. 2010, 10, 3106–3110. [Google Scholar] [CrossRef] [PubMed]
- Goswami, N.; Giri, A.; Bootharaju, M.S.; Xavier, P.L.; Pradeep, T.; Pal, S.K. Copper Quantum Clusters in Protein Matrix: Potential Sensor of Pb2+ Ion. Anal. Chem. 2011, 83, 9676–9680. [Google Scholar] [CrossRef] [PubMed]
- Jia, X.; Li, J.; Han, L.; Ren, J.; Yang, X.; Wang, E. DNA-Hosted Copper Nanoclusters for Fluorescent Identification of Single Nucleotide Polymorphisms. ACS Nano 2012, 6, 3311–3317. [Google Scholar] [CrossRef] [PubMed]
- Wang, Z.; Si, L.; Bao, J.; Dai, Z. A Reusable MicroRNA Sensor Based on the Electrocatalytic Property of Heteroduplex-Templated Copper Nanoclusters. Chem. Commun. 2015, 51, 6305–6307. [Google Scholar] [CrossRef] [PubMed]
- Mao, X.; Liu, S.; Yang, C.; Liu, F.; Wang, K.; Chen, G. Colorimetric Detection of Hepatitis B Virus (HBV) DNA Based on DNA-Templated Copper Nanoclusters. Anal. Chim. Acta 2016, 909, 101–108. [Google Scholar] [CrossRef] [PubMed]
- Hu, L.; Yuan, Y.; Zhang, L.; Zhao, J.; Majeed, S.; Xu, G. Copper Nanoclusters as Peroxidase Mimetics and Their Applications to H2O2 and Glucose Detection. Anal. Chim. Acta 2013, 762, 83–86. [Google Scholar] [CrossRef] [PubMed]
- Feng, J.; Ju, Y.; Liu, J.; Zhang, H.; Chen, X. Polyethyleneimine-Templated Copper Nanoclusters via Ascorbic Acid Reduction Approach as Ferric Ion Sensor. Anal. Chim. Acta 2015, 854, 153–160. [Google Scholar] [CrossRef] [PubMed]
- Wang, C.; Wang, C.; Xu, L.; Cheng, H.; Lin, Q.; Zhang, C. Protein-Directed Synthesis of pH-Responsive Red Fluorescent Copper Nanoclusters and Their Applications in Cellular Imaging and Catalysis. Nanoscale 2014, 6, 1775–1781. [Google Scholar] [CrossRef] [PubMed]
- Wang, W.; Leng, F.; Zhan, L.; Chang, Y.; Yang, X.X.; Lan, J.; Huang, C.Z. One-Step Prepared Fluorescent Copper Nanoclusters for Reversible pH-Sensing. Analyst 2014, 139, 2990–2993. [Google Scholar] [CrossRef] [PubMed]
- Bhamore, J.R.; Jha, S.; Mungara, A.K.; Singhal, R.K.; Sonkeshariya, D.; Kailasa, S.K. One-Step Green Synthetic Approach for the Preparation of Multicolor Emitting Copper Nanoclusters and Their Applications in Chemical Species Sensing and Bioimaging. Biosens. Bioelectron. 2016, 80, 243–248. [Google Scholar] [CrossRef] [PubMed]
- Ghosh, R.; Sahoo, A.K.; Ghosh, S.S.; Paul, A.; Chattopadhyay, A. Blue-Emitting Copper Nanoclusters Synthesized in the Presence of Lysozyme as Candidates for Cell Labeling. ACS Appl. Mater. Interfaces 2014, 6, 3822–3828. [Google Scholar] [CrossRef] [PubMed]
- Huang, H.; Li, H.; Wang, A.-J.; Zhong, S.-X.; Fang, K.-M.; Feng, J.-J. Green Synthesis of Peptide-Templated Fluorescent Copper Nanoclusters for Temperature Sensing and Cellular Imaging. Analyst 2014, 139, 6536–6541. [Google Scholar] [CrossRef] [PubMed]
- Zhao, T.; He, X.-W.; Li, W.-Y.; Zhang, Y.-K. Transferrin-Directed Preparation of Red-Emitting Copper Nanoclusters for Targeted Imaging of Transferrin Receptor Over-Expressed Cancer Cells. J. Mater. Chem. B 2015, 3, 2388–2394. [Google Scholar] [CrossRef]
- Diez, I.; Ras, R.H.A. Fluorescent Silver Nanoclusters. Nanoscale 2011, 3, 1963–1970. [Google Scholar] [CrossRef] [PubMed]
- Chen, L.-Y.; Wang, C.-W.; Yuan, Z.; Chang, H.-T. Fluorescent Gold Nanoclusters: Recent Advances in Sensing and Imaging. Anal. Chem. 2015, 87, 216–229. [Google Scholar] [CrossRef] [PubMed]
- Le Guevel, X.; Hotzer, B.; Jung, G.; Hollemeyer, K.; Trouillet, V.; Schneider, M. Formation of Fluorescent Metal (Au, Ag) Nanoclusters Capped in Bovine Serum Albumin Followed by Fluorescence and Spectroscopy. J. Phys. Chem. C 2011, 115, 10955–10963. [Google Scholar] [CrossRef]
- Zheng, J.; Zhou, C.; Yu, M.; Liu, J. Different Sized Luminescent Gold Nanoparticles. Nanoscale 2012, 4, 4073–4083. [Google Scholar] [CrossRef] [PubMed]
- Yuan, Z.; Chen, Y.-C.; Li, H.-W.; Chang, H.-T. Fluorescent Silver Nanoclusters Stabilized by DNA Scaffolds. Chem. Commun. 2014, 50, 9800–9815. [Google Scholar] [CrossRef] [PubMed]
- Qi, Y.-X.; Zhang, M.; Zhu, A.; Shi, G. Terbium(iii)/gold nanocluster conjugates: The development of a novel ratiometric fluorescent probe for mercury(ii) and a paper-based visual sensor. Analyst 2015, 140, 5656–5661. [Google Scholar] [CrossRef] [PubMed]
- Xu, L.Q.; Neoh, K.-G.; Kang, E.-T.; Fu, G.D. Rhodamine derivative-modified filter papers for colorimetric and fluorescent detection of Hg2+ in aqueous media. J. Mater. Chem. A 2013, 1, 2526–2532. [Google Scholar] [CrossRef]
- Chen, P.-C.; Li, Y.-C.; Ma, J.-Y.; Huang, J.-Y.; Chen, C.-F.; Chang, H.-T. Size-tunable copper nanocluster aggregates and their application in hydrogen sulfide sensing on paper-based devices. Sci. Rep. 2016, 6, 24882. [Google Scholar] [CrossRef] [PubMed]
- Vrekoussis, T.; Chaniotis, V.; Navrozoglou, I.; Dousias, V.; Pavlakis, K.; Stathopoulos, E.N.; Zoras, O. Image Analysis of Breast Cancer Immunohistochemistry-stained Sections Using ImageJ: An RGB-based Model. Anticancer Res. 2009, 29, 4995–4998. [Google Scholar] [PubMed]
- Wang, X.; Gorris, H.H.; Stolwijk, J.A.; Meier, R.J.; Groegel, D.B.M.; Wegener, J.; Wolfbeis, O.S. Self-referenced RGB Colour Imaging of Intracellular Oxygen. Chem. Sci. 2011, 2, 901–906. [Google Scholar] [CrossRef]
- Soga, T.; Jimbo, Y.; Suzuki, K.; Citterio, D. Inkjet-Printed Paper-Based Colorimetric Sensor Array for the Discrimination of Volatile Primary Amines. Anal. Chem. 2013, 85, 8973–8978. [Google Scholar] [CrossRef] [PubMed]
- Lopez-Ruiz, N.; Curto, V.F.; Erenas, M.M.; Benito-Lopez, F.; Diamond, D.; Palma, A.J.; Capitan-Vallvey, L.F. Smartphone-Based Simultaneous pH and Nitrite Colorimetric Determination for Paper Microfluidic Devices. Anal. Chem. 2014, 86, 9554–9562. [Google Scholar] [CrossRef] [PubMed]
- Komatsu, T.; Mohammadi, S.; Busa, L.S.A.; Maeki, M.; Ishida, A.; Tani, H.; Tokeshi, M. Image analysis for a microfluidic paper-based analytical device using the CIE L*a*b* color system. Analyst 2016, 141, 6507–6509. [Google Scholar] [CrossRef] [PubMed]
- Abbaspour, A.; Khajehzadeh, A.; Ghaffarinejad, A. A Simple and Cost-Effective Method, as an Appropriate Alternative for Visible Spectrophotometry: Development of a Dopamine Biosensor. Analyst 2009, 134, 1692–1698. [Google Scholar] [CrossRef] [PubMed]
- Pang, S.; Cui, X.; DeModena, J.; Wang, Y.M.; Sternberg, P.; Yang, C. Implementation of a Color-Capable Optofluidic Microscope on a RGB CMOS Color Sensor Chip Substrate. Lab Chip 2010, 10, 411–414. [Google Scholar] [CrossRef] [PubMed]
- Hunt, R.W.G. The Reproduction of Colour, 6th ed.; John Wiely & Sons, Ltd.: Hoboken, NJ, USA, 2004. [Google Scholar]
- Liu, Y.; Ling, J.; Huang, C.Z. Individually Color-Coded Plasmonic Nanoparticles for RGB Analysis. Chem. Commun. 2011, 47, 8121–8123. [Google Scholar] [CrossRef] [PubMed]
- Schwaebel, T.; Trapp, O.; Bunz, U.H.F. Digital Photography for the Analysis of Fluorescence Responses. Chem. Sci. 2013, 4, 273–281. [Google Scholar] [CrossRef]
- Lin, Y.-J.; Chen, P.-C.; Yuan, Z.; Ma, J.-Y.; Chang, H.-T. The Isomeric Effect of Mercaptobenzoic Acids on the Preparation and Fluorescence Properties of Copper Nanoclusters. Chem. Commun. 2015, 51, 11983–11986. [Google Scholar] [CrossRef] [PubMed]
- Wei, W.; Lu, Y.; Chen, W.; Chen, S. One-Pot Synthesis, Photoluminescence, and Electrocatalytic Properties of Subnanometer-Sized Copper Clusters. J. Am. Chem. Soc. 2011, 133, 2060–2063. [Google Scholar] [CrossRef] [PubMed]
- Wang, T.-Y.; Chen, C.-Y.; Wang, C.-M.; Tan, Y.Z.; Liao, W.-S. Multicolor Functional Carbon Dots via One-Step Refluxing Synthesis. ACS Sens. 2017, 2, 354–363. [Google Scholar] [CrossRef] [PubMed]
- Chan, G.H.; Zhao, J.; Hicks, E.M.; Schatz, G.C.; Van Duyne, R.P. Plasmonic Properties of Copper Nanoparticles Fabricated by Nanosphere Lithography. Nano Lett. 2007, 7, 1947–1952. [Google Scholar] [CrossRef]
- Hambrock, J.; Becker, R.; Birkner, A.; Weiss, J.; Fischer, R.A. A Non-Aqueous Organometallic Route to Highly Monodispersed Copper Nanoparticles Using [Cu(OCH(Me)CH2NMe2)2]. Chem. Commun. 2002, 68–69. [Google Scholar] [CrossRef]
- Qian, Q.; Deng, J.; Wang, D.; Yang, L.; Yu, P.; Mao, L. Aspartic Acid-Promoted Highly Selective and Sensitive Colorimetric Sensing of Cysteine in Rat Brain. Anal. Chem. 2012, 84, 9579–9584. [Google Scholar] [CrossRef] [PubMed]
- Shahrokhian, S. Lead Phthalocyanine as a Selective Carrier for Preparation of a Cysteine-Selective Electrode. Anal. Chem. 2001, 73, 5972–5978. [Google Scholar] [CrossRef] [PubMed]
- Wang, W.H.; Rusin, O.; Xu, X.Y.; Kim, K.K.; Escobedo, J.O.; Fakayode, S.O.; Fletcher, K.A.; Lowry, M.; Schowalter, C.M.; Lawrence, C.M.; et al. Detection of Homocysteine and Cysteine. J. Am. Chem. Soc. 2005, 127, 15949–15958. [Google Scholar] [CrossRef] [PubMed]
- Yuan, X.; Tay, Y.; Dou, X.; Luo, Z.; Leong, D.T.; Xie, J. Glutathione-Protected Silver Nanoclusters as Cysteine-Selective Fluorometric and Colorimetric Probe. Anal. Chem. 2013, 85, 1913–1919. [Google Scholar] [CrossRef] [PubMed]
- Jokerst, J.C.; Adkins, J.A.; Bisha, B.; Mentele, M.M.; Goodridge, L.D.; Henry, C.S. Development of a Paper-Based Analytical Device for Colorimetric Detection of Select Foodborne Pathogens. Anal. Chem. 2012, 84, 2900–2907. [Google Scholar] [CrossRef] [PubMed]
- Lu, Y.; Shi, W.W.; Qin, J.H.; Lin, B.C. Fabrication and Characterization of Paper-Based Microfluidics Prepared in Nitrocellulose Membrane by Wax Printing. Anal. Chem. 2010, 82, 329–335. [Google Scholar] [CrossRef] [PubMed]
- Martinez, A.W.; Phillips, S.T.; Carrilho, E.; Thomas, S.W.; Sindi, H.; Whitesides, G.M. Simple Telemedicine for Developing Regions: Camera Phones and Paper-Based Microfluidic Devices for Real-Time, Off-Site Diagnosis. Anal. Chem. 2008, 80, 3699–3707. [Google Scholar] [CrossRef] [PubMed]
- Moerner, W.E.; Fromm, D.P. Methods of single-molecule fluorescence spectroscopy and microscopy. Rev. Sci. Instrum. 2003, 74, 3597–3619. [Google Scholar] [CrossRef]
- Miller, J.N. Basic statistical methods for Analytical Chemistry. Part 2. Calibration and regression methods. A review. Analyst 1991, 116, 3–14. [Google Scholar] [CrossRef]
- Selvarajan, S.; Alluri, N.R.; Chandrasekhar, A.; Kim, S.-J. Direct detection of cysteine using functionalized BaTiO3 nanoparticles film based self-powered biosensor. Biosens. Bioelectron. 2017, 91, 203–210. [Google Scholar] [CrossRef] [PubMed]
- Wu, S.; Song, H.; Song, J.; He, C.; Ni, J.; Zhao, Y.; Wang, X. Development of Triphenylamine Functional Dye for Selective Photoelectrochemical Sensing of Cysteine. Anal. Chem. 2014, 86, 5922–5928. [Google Scholar] [CrossRef] [PubMed]
- Kaniowska, E.; Chwatko, G.; Głowacki, R.; Kubalczyk, P.; Bald, E. Urinary excretion measurement of cysteine and homocysteine in the form of their S-pyridinium derivatives by high-performance liquid chromatography with ultraviolet detection. J. Chromatogr. A 1998, 798, 27–35. [Google Scholar] [CrossRef]
- Wang, C.-M.; Chen, C.-Y.; Liao, W.-S. Paper-polymer composite devices with minimal fluorescence background. Anal. Chim. Acta 2017, 963, 93–98. [Google Scholar] [CrossRef] [PubMed]
- Liu, W.; Cassano, C.L.; Xu, X.; Fan, Z.H. Laminated paper-based analytical devices (LPAD) with origami-enabled chemiluminescence immunoassay for cotinine detection in mouse serum. Anal. Chem. 2013, 85, 10270–10276. [Google Scholar] [CrossRef] [PubMed]
- Tzeng, P.; Stevens, B.; Devlaming, I.; Grunlan, J.C. Polymer-Graphene Oxide Quadlayer Thin-Film Assemblies with Improved Gas Barrier. Langmuir 2015, 31, 5919–5927. [Google Scholar] [CrossRef] [PubMed]
- Ramachandran, S.; Fu, E.; Lutz, B.; Yager, P. Long-term dry storage of an enzyme-based reagent system for ELISA in point-of-care devices. Analyst 2014, 139, 1456–1462. [Google Scholar] [CrossRef] [PubMed]
- Kannan, B.; Jahanshahi-Anbuhi, S.; Pelton, R.H.; Li, Y.; Filipe, C.D.M.; Brennan, J.D. Printed Paper Sensors for Serum Lactate Dehydrogenase using Pullulan-Based Inks to Immobilize Reagents. Anal. Chem. 2015, 87, 9288–9293. [Google Scholar] [CrossRef] [PubMed]
Figure 1.
(A) Schematic illustration of the CuNC probe synthesis. (B) Overlapping excitation and emission spectra of CuNC and emission spectrum of BSA solution. Inset: photographs of the CuNC solution under visible light (left) and 365 nm UV illumination (right). (C) The device operation setup (left) and schematic illustration of laminated CuNC–paper composite sensing device (right). (D) Photograph analysis of different laminated paper substrates including raw paper material, CuNC–paper composite, and CuNC–paper composite with cysteine under different color tuples. The photo image (left) is converted into numerical histograms (right), representing their corresponding intensity values at gray scale, red (R), green (G), and blue (B) tuples. The scale bar is 5 mm.
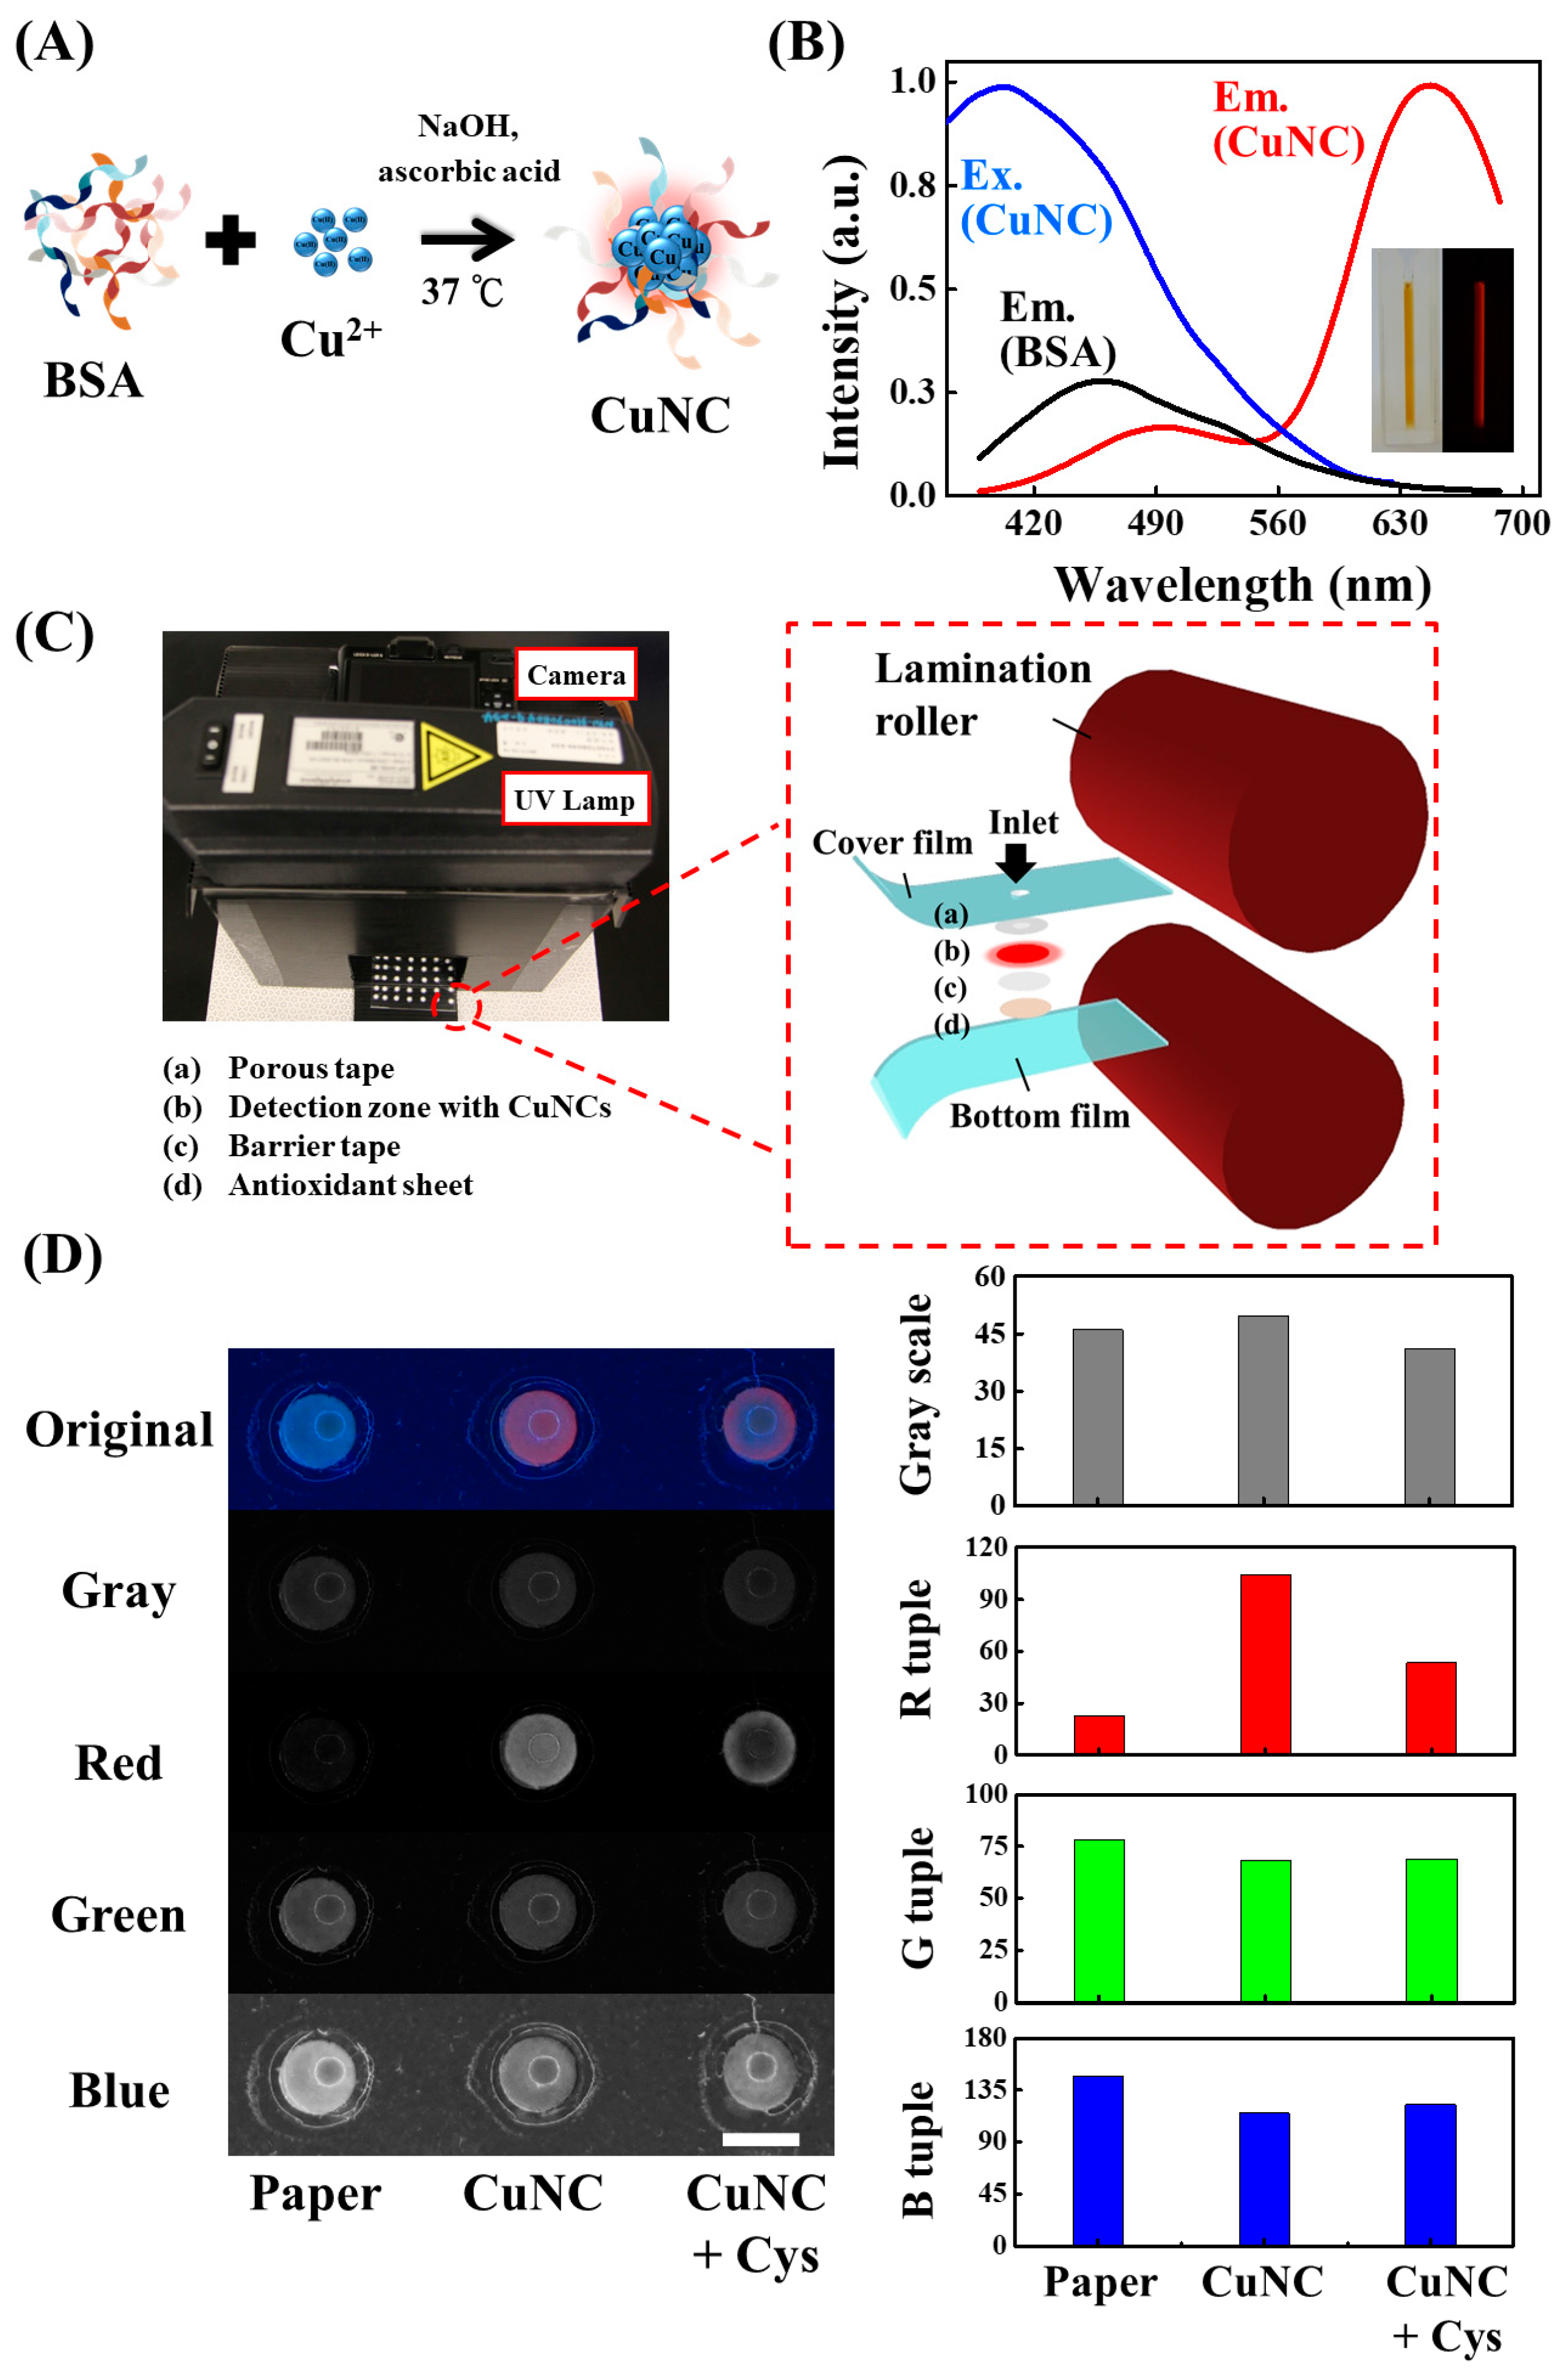
Figure 2.
(A) Photographs of a laminated CuNC–paper composite device under different cysteine concentration treatments. Upper image: the device under 365 nm UV illumination. Lower image: the image after conversion into the R tuple. The scale bars are 5 mm. (B) The correlation in between the device image intensity and cysteine concentration, where F0 and F respectively represent the value in the absence and presence of cysteine. (C) The calibration curve derived from the R tuple analysis. (D) The calibration curve of cysteine detection by a fluorescence spectrometer (SpectraMax® i3x Multi-Mode microplate reader, Molecular Devices, San Jose, CA, USA). Each data point is obtained from average value of three samples (N = 3). The error bars indicate the standard deviation.
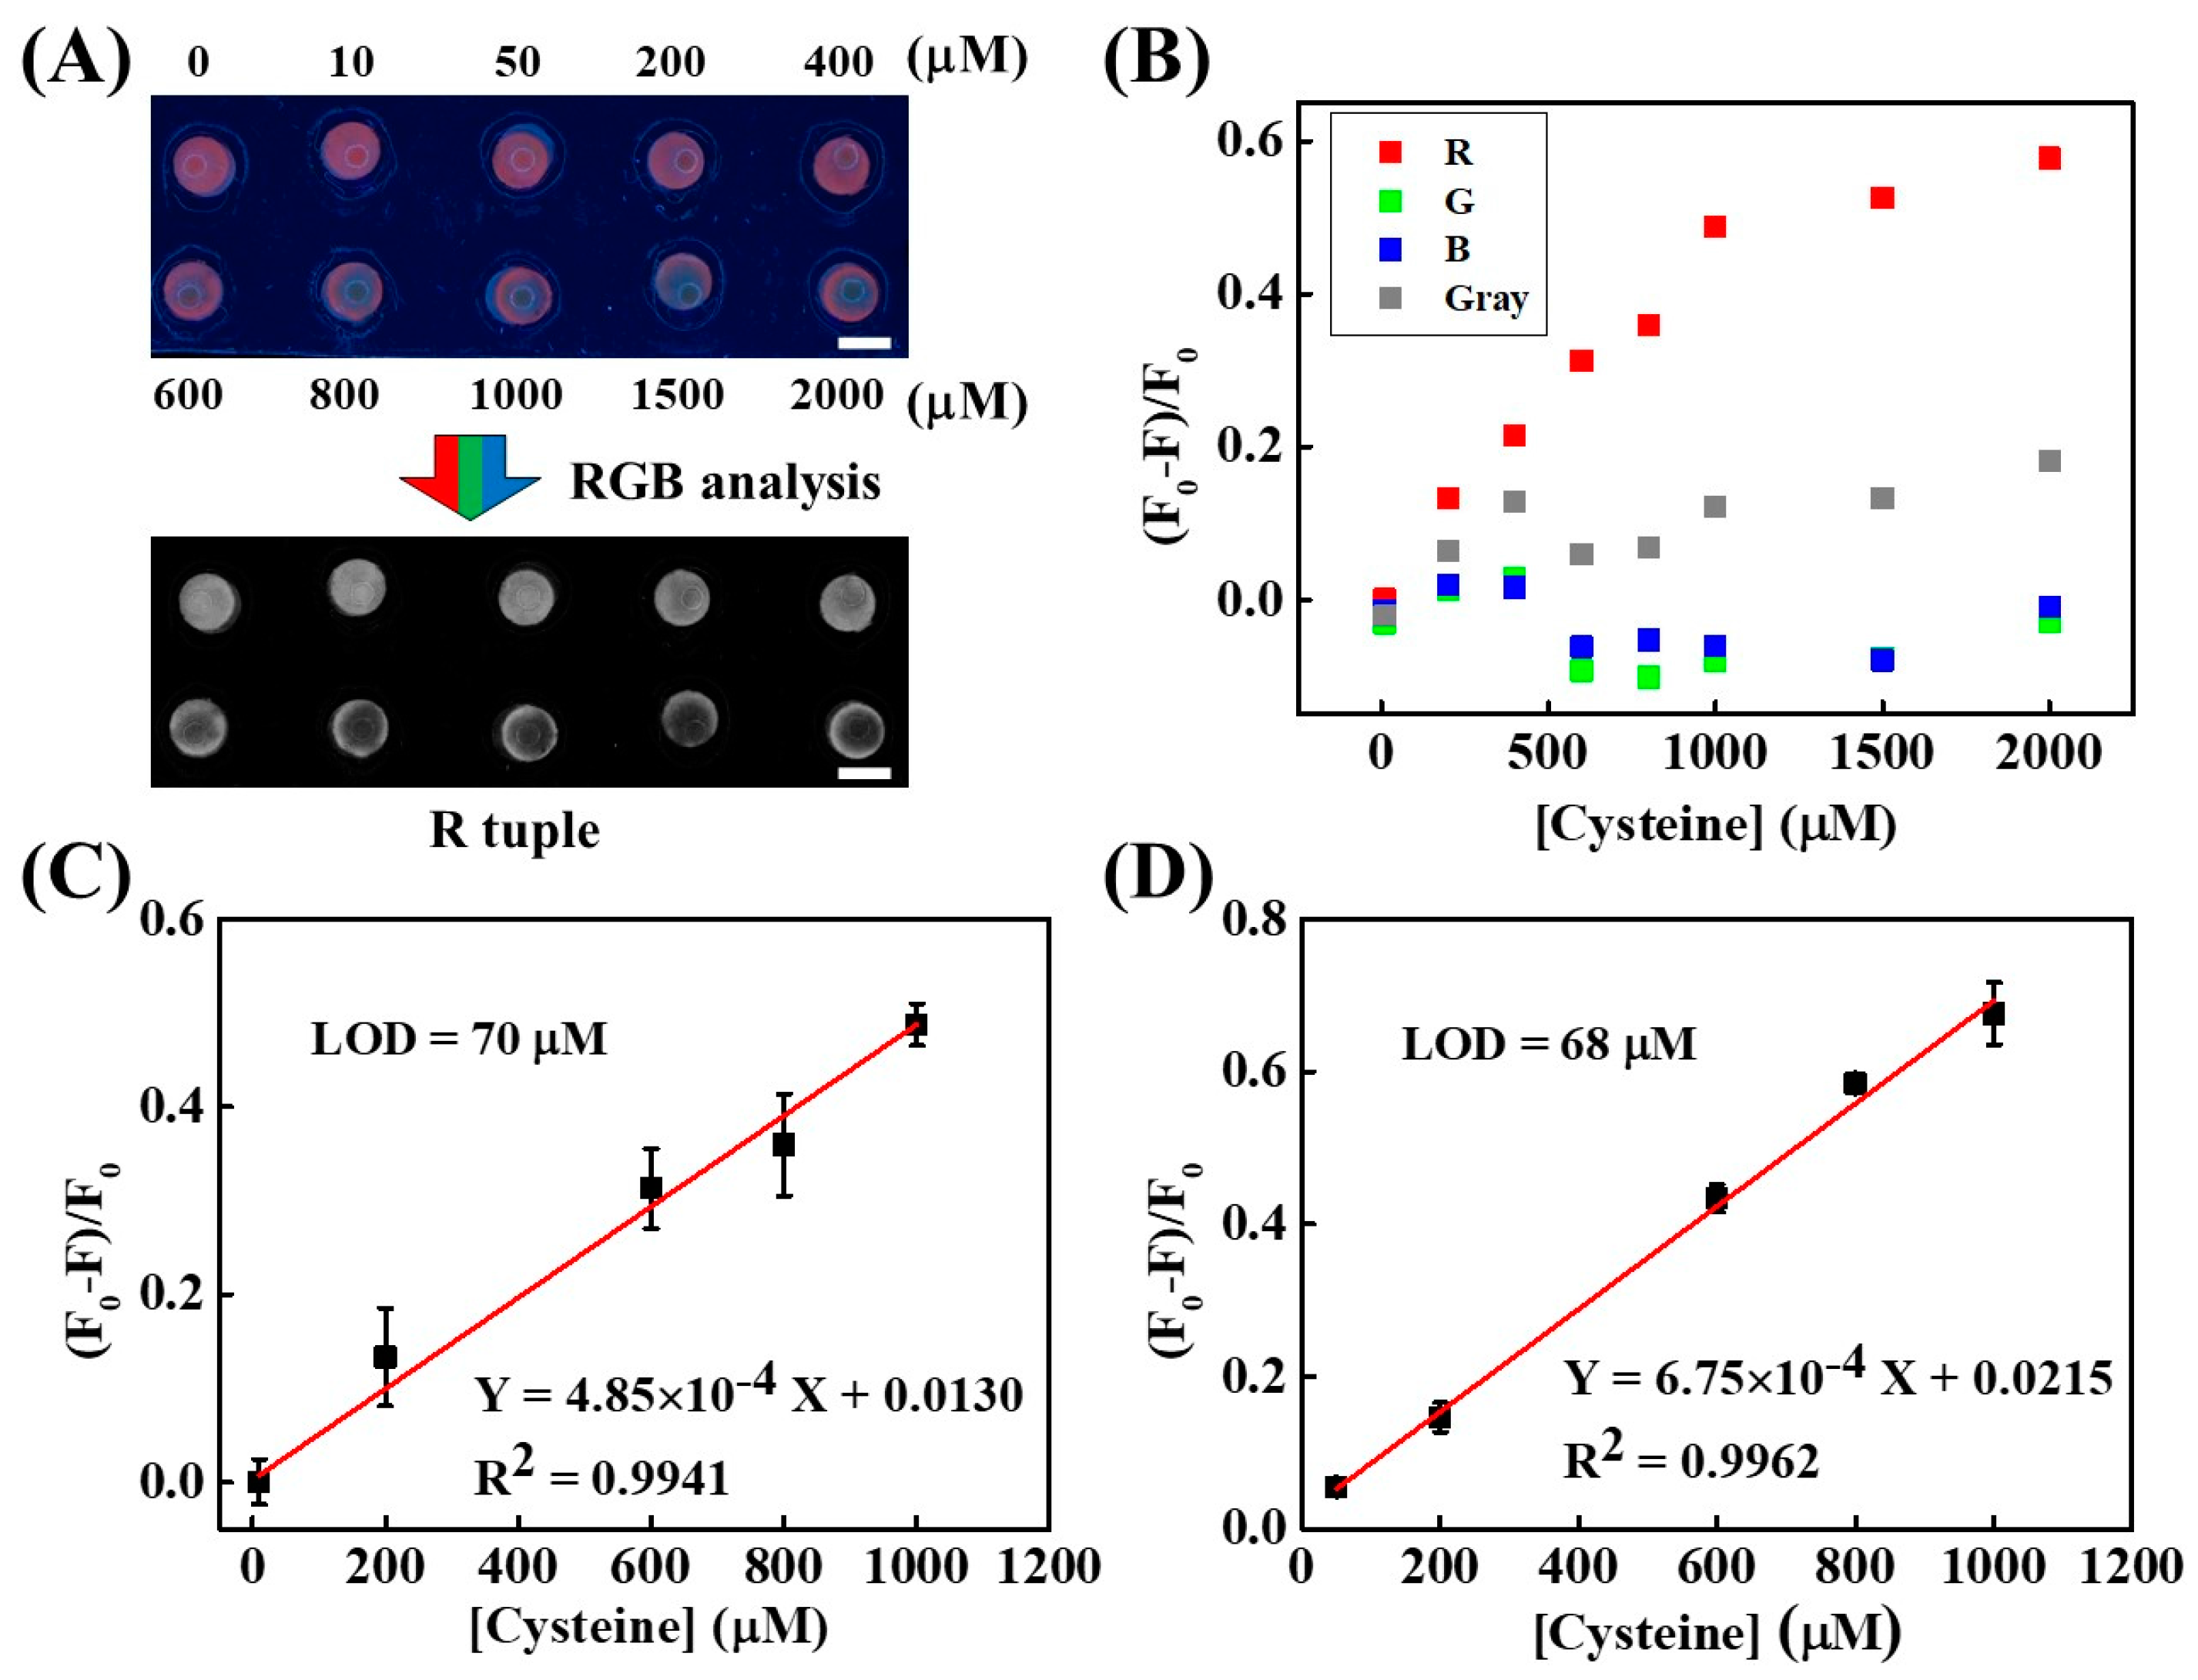
Figure 3.
(A) Photographs representing device responses to various amino acids. All the tested amino acids are prepared as 500 μM aqueous solutions. Left: the device under 365 nm UV illumination. Right: the image after conversion into the R tuple. (B) The device fluorescence responses in R tuple under various amino acid treatments.

Figure 4.
Photographs of a laminated CuNC–paper composite device under different treatments. From left to right: PBS buffer, urine, urine spiked with 200 μM cysteine, urine spiked with 400 μM cysteine. Upper image: the device under 365 nm UV illumination. Lower image: the image after conversion into the R tuple. The scale bars are 5 mm.

Figure 5.
Schematic illustrations of the lamination process without (A) and with (B) tape barriers. (C) Photographs of the laminated CuNC–paper composite device without/with the use of protecting tapes for cysteine detection (1 mM). Left image: photo image under 365 nm UV illumination. Right image: the same photo image after conversion into the R tuple. The scale bars are 5 mm.

Figure 6.
(A) CuNC–paper composites were placed under ambient condition for one day without (I) and with (II) the use of antioxidative sheets. (B) CuNC–paper composites were enclosed in thermoplastics without (III) and with (IV) the use of antioxidative sheets. The scale bars are 5 mm.
Figure 6.
(A) CuNC–paper composites were placed under ambient condition for one day without (I) and with (II) the use of antioxidative sheets. (B) CuNC–paper composites were enclosed in thermoplastics without (III) and with (IV) the use of antioxidative sheets. The scale bars are 5 mm.


Table 1.
Determination of cysteine in urine samples.
| Spiked (μM) | Found a (μM) | Recovery a (%) |
|---|---|---|
| 0 | 130.90 ± 9.18 | - |
| 200 | 204.71 ± 11.18 | 102.36 ± 5.59 |
| 400 | 416.21 ± 39.17 | 104.05 ± 9.79 |
a Average of three determinations ± standard deviation.
© 2018 by the authors. Licensee MDPI, Basel, Switzerland. This article is an open access article distributed under the terms and conditions of the Creative Commons Attribution (CC BY) license (http://creativecommons.org/licenses/by/4.0/).
Share and Cite
MDPI and ACS Style
Chen, C.-Y.; Chen, C.-L.; Wang, C.-M.; Liao, W.-S. Laminated Copper Nanocluster Incorporated Antioxidative Paper Device with RGB System-Assisted Signal Improvement. Nanomaterials 2018, 8, 97. https://doi.org/10.3390/nano8020097
AMA Style
Chen C-Y, Chen C-L, Wang C-M, Liao W-S. Laminated Copper Nanocluster Incorporated Antioxidative Paper Device with RGB System-Assisted Signal Improvement. Nanomaterials. 2018; 8(2):97. https://doi.org/10.3390/nano8020097
Chicago/Turabian StyleChen, Chong-You, Chia-Lin Chen, Chang-Ming Wang, and Wei-Ssu Liao. 2018. "Laminated Copper Nanocluster Incorporated Antioxidative Paper Device with RGB System-Assisted Signal Improvement" Nanomaterials 8, no. 2: 97. https://doi.org/10.3390/nano8020097
Note that from the first issue of 2016, this journal uses article numbers instead of page numbers. See further details here.