A Novel Prototype Biosensor Array Electrode System for Detecting the Bacterial Pathogen Salmonella typhimurium
 ,
,  ,
,  and
and
Abstract
:1. Introduction
2. Methods
2.1. Equipment and Chemicals
2.1.1. Measuring Equipment—Hewlett Packard-Agilent, HP34401A 6.5 Digital Multimeter
2.1.2. Chemicals
2.1.3. Buffer Solutions
2.1.4. Formulation of Specific Anti-Salmonella Antibody
2.1.5. Formulation of HRP Conjugated Secondary Antibody
2.1.6. Formulation of Substrate
2.2. Preparation of Salmonella Antigen and Source of Cultures
2.3. Growth of Cultures
2.4. Determination of Cell Concentration
2.5. Electrode Preparation
2.5.1. Method for Antigen Preparation
2.5.2. Electrode Fabrication
2.5.3. Immobilization of Monoclonal Antibodies
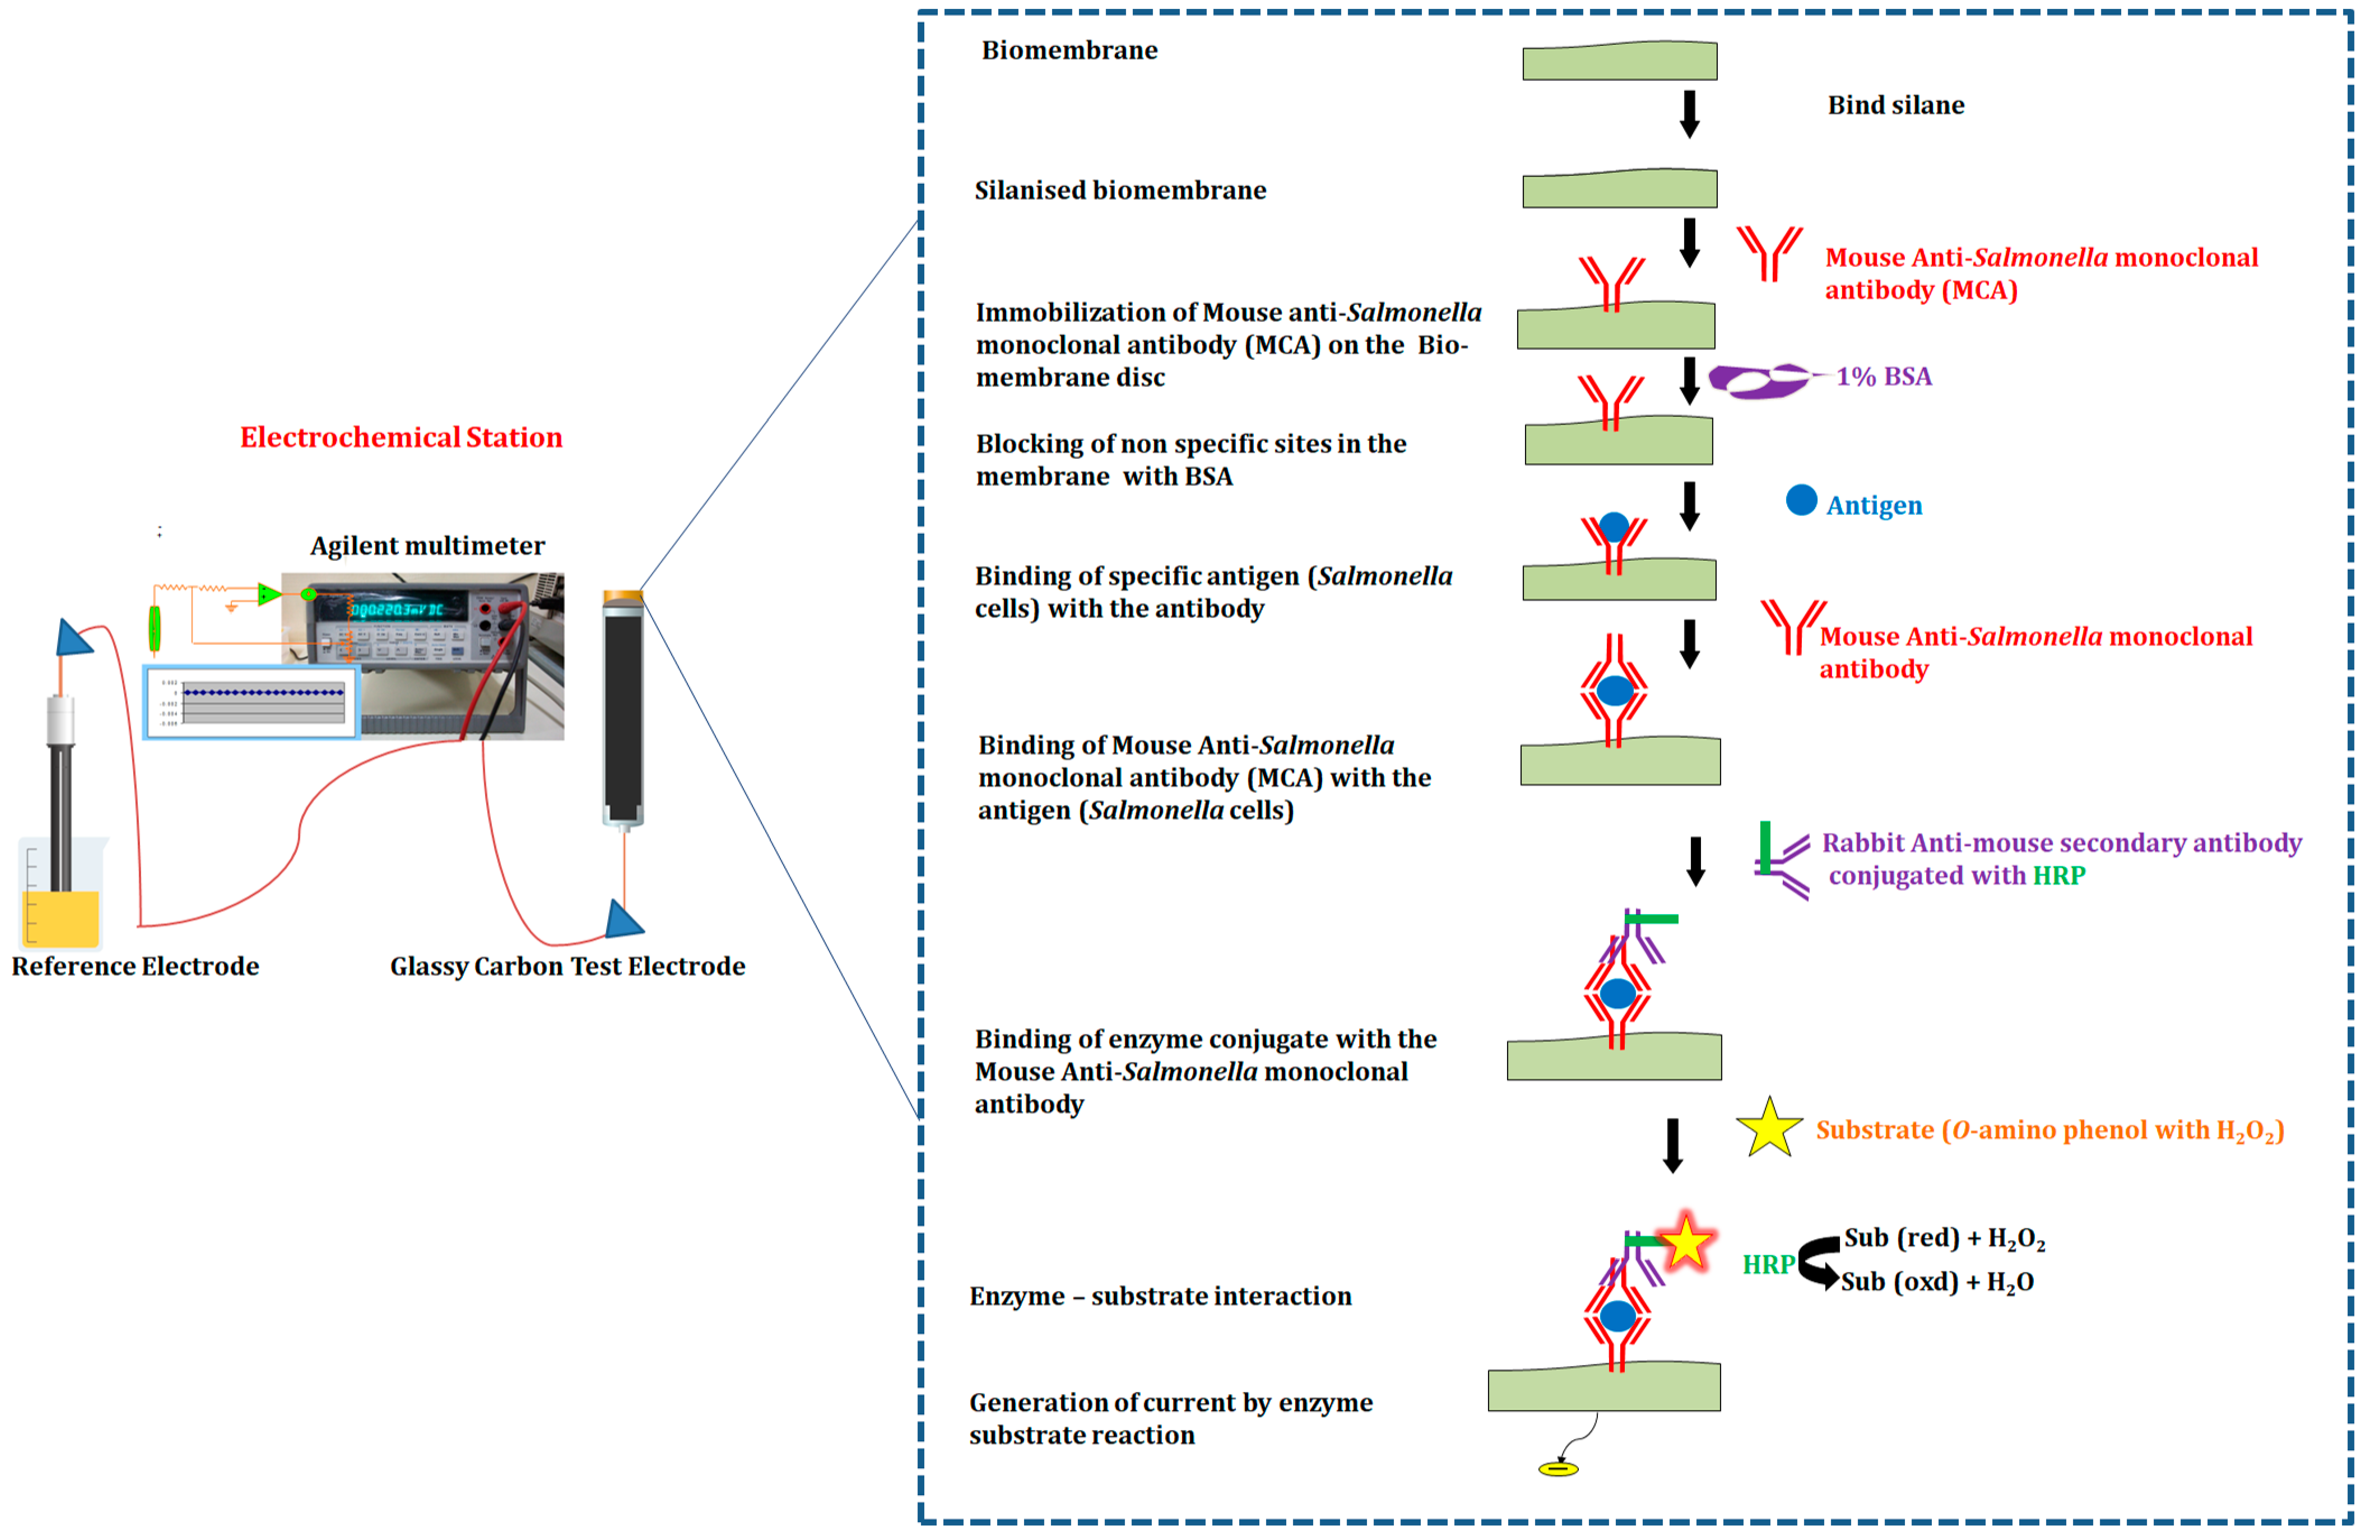
sub(red) + H2O2 → sub(oxd) + H2O
2.5.4. Bacteria Binding Measurements
2.6. Experiments
2.6.1. Experiment 1
2.6.2. Experiment 2
2.6.3. Experiment 3
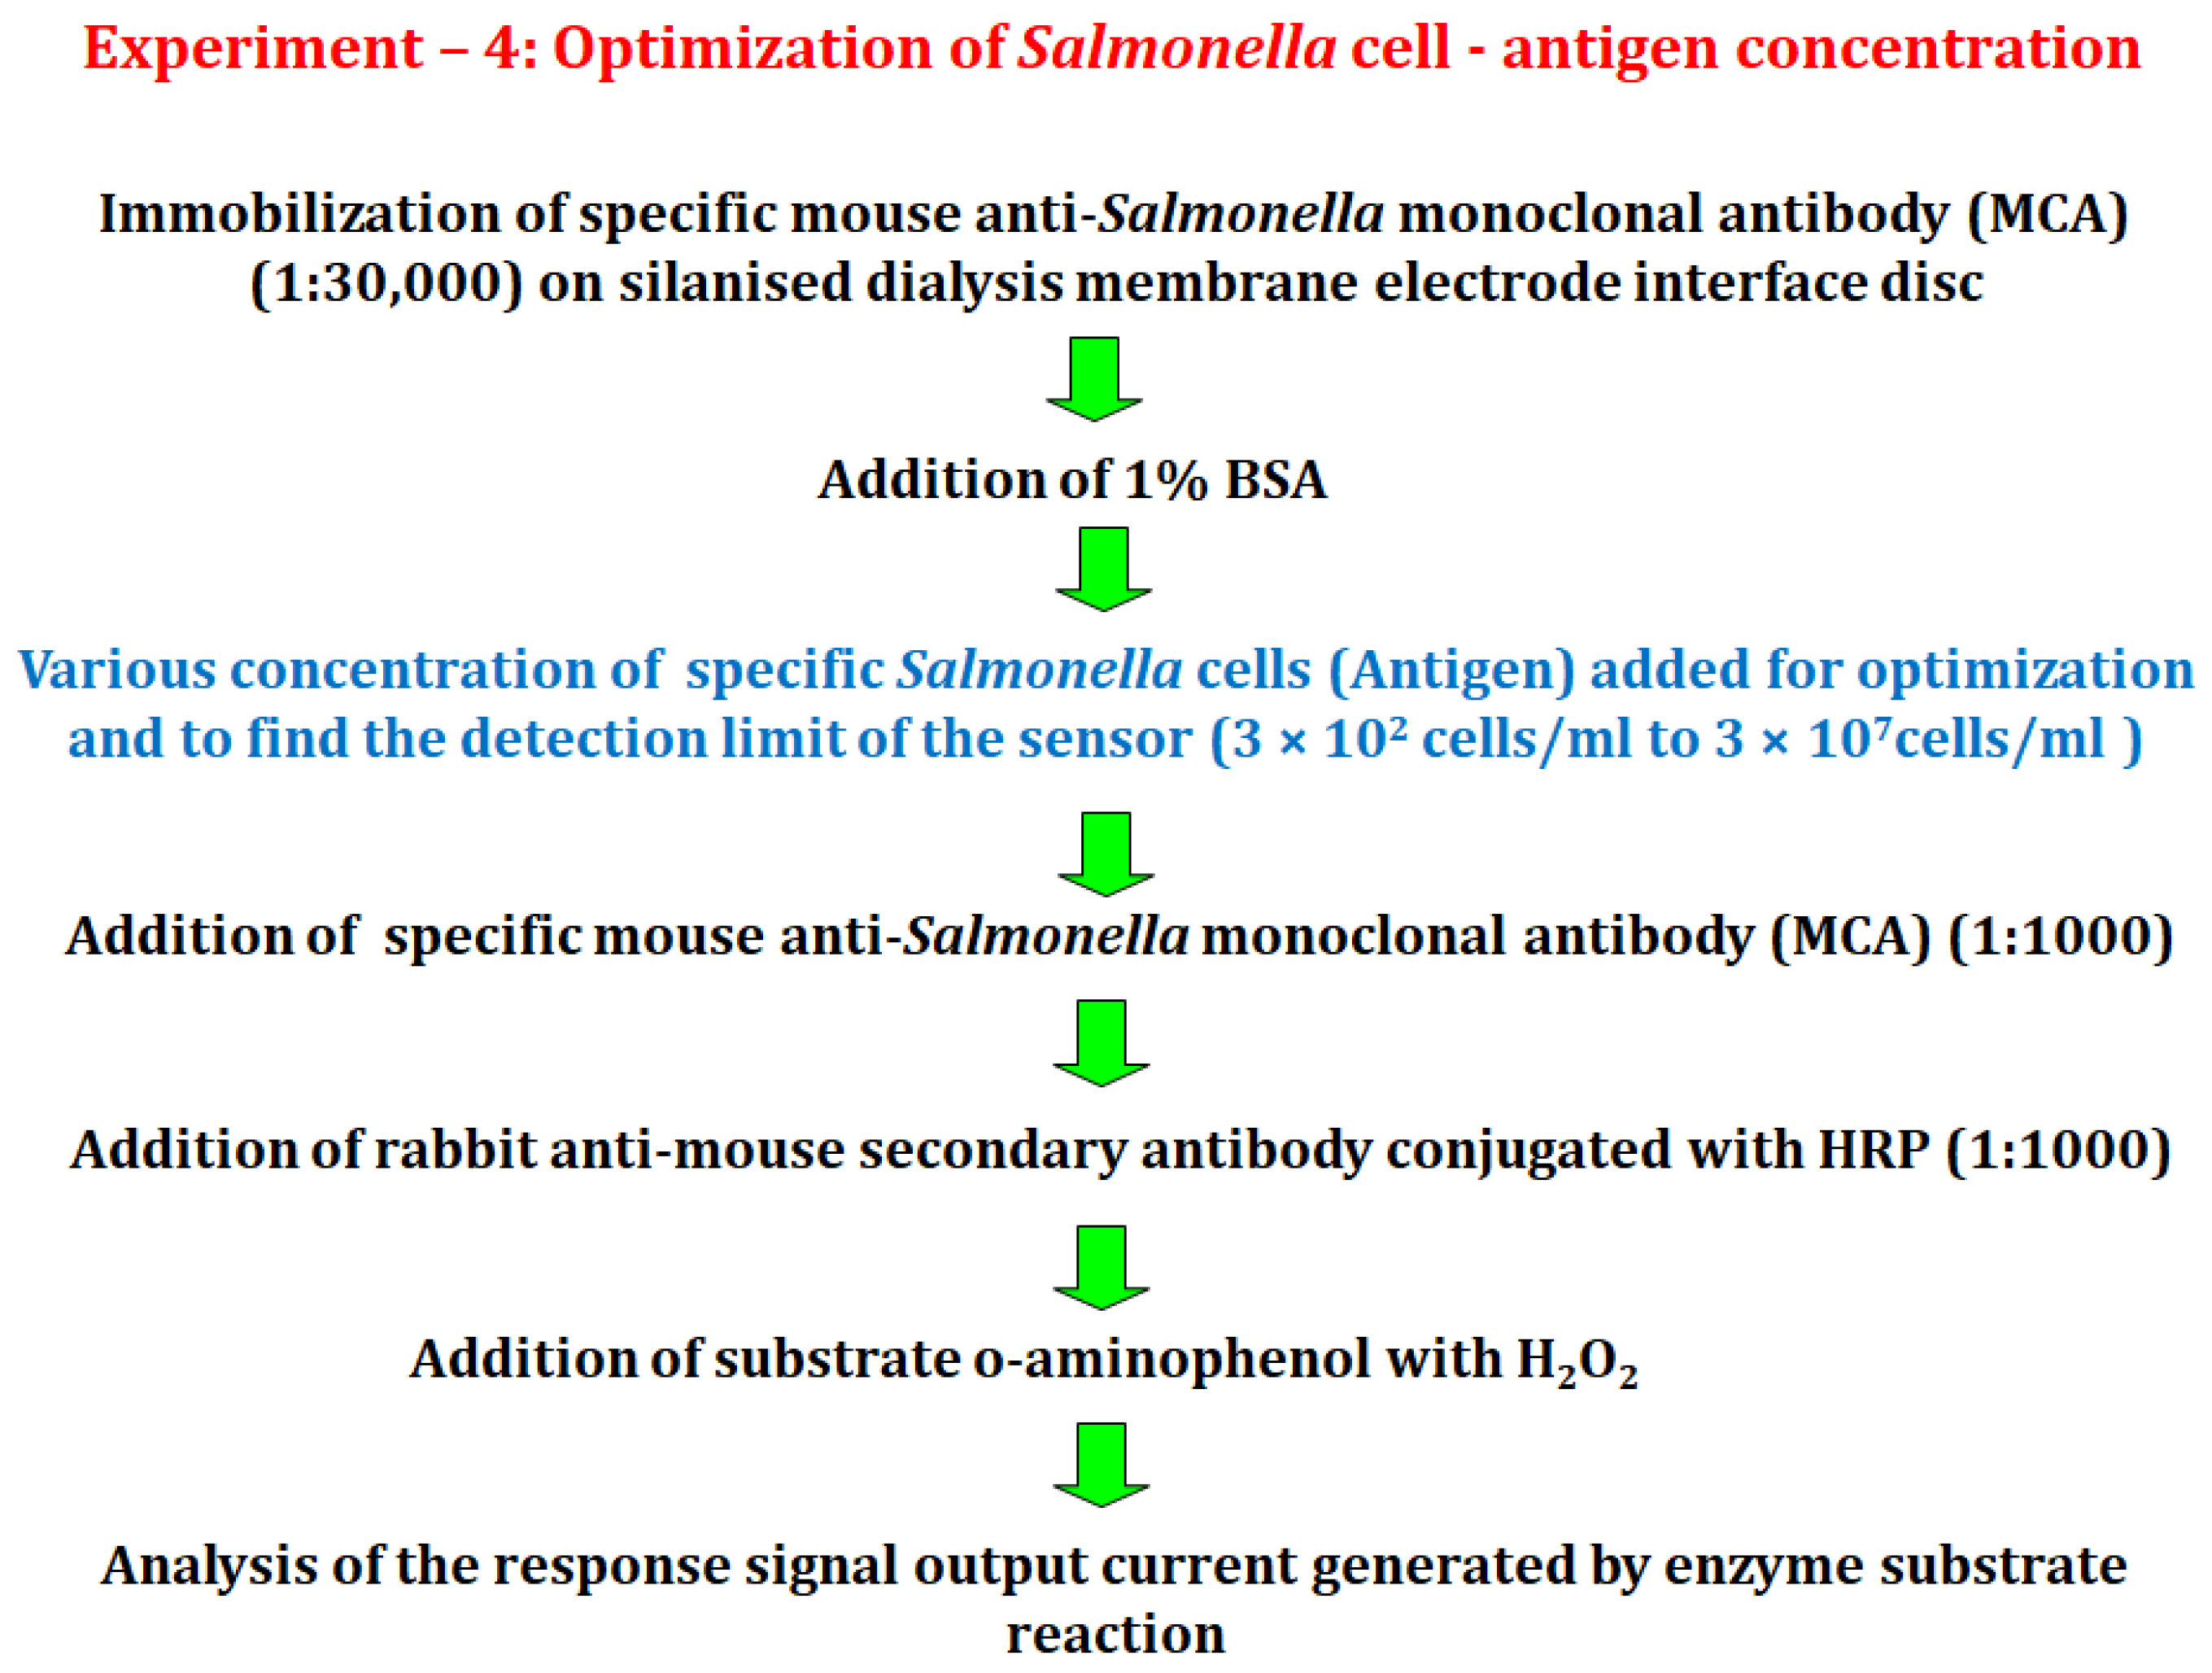
2.6.4. Experiment 4
2.6.5. Experiment 5
2.7. Electrochemical Experimental Procedure
2.8. Statistical Analysis and Graphs
3. Results
3.1. Electrodes and Electrochemical Measurement Device
3.2. Fabrication of Biomembrane Electrode Interface
3.3. Response Curves for the Immuno-Enzyme-Substrate Reaction
3.4. Optimization of the Primary Monoclonal Antibody Concentration
3.5. Optimization of Specific Salmonella Antigen Concentration
3.6. Determination of the Specificity of the Immunosensor
4. Discussion
4.1. Electrodes and Electrochemical Measurement Device
4.2. Selection of Biomembrane
4.3. Determination of Immuno-Enzyme Substrate Reaction
4.4. Optimization of Primary Monoclonal Salmonella Antibody Concentration
4.5. Optimization of Salmonella Antigen Concentration
4.6. Specificity of the Immunosensor
5. Conclusions
Author Contributions
Funding
Institutional Review Board Statement
Informed Consent Statement
Data Availability Statement
Acknowledgments
Conflicts of Interest
References
- WHO. Salmonella (Non-Typhoidal); WHO Press—World Health Organization: Geneve, Switzerland, 2018. [Google Scholar]
- WHO. Multi-Country Outbreak of Salmonella typhimurium Linked to Chocolate Products—Europe and the United States of America; WHO Press—World Health Organization: Geneve, Switzerland, 2022. [Google Scholar]
- Hinton, J.C.; Santos, D.S.; Seirafi, A.; Hulton, C.S.; Pavitt, G.D.; Higgins, C.F. Expression and Mutational Analysis of the Nucleoid-Associated Protein H-NS of Salmonella typhimurium. Mol. Microbiol. 1992, 6, 2327–2337. [Google Scholar] [CrossRef] [PubMed]
- Awang, M.S.; Bustami, Y.; Hamzah, H.H.; Zambry, N.S.; Najib, M.A.; Khalid, M.F.; Aziah, I.; Manaf, A.A. Advancement in Salmonella Detection Methods: From Conventional to Electrochemical-Based Sensing Detection. Biosensors 2021, 11, 346. [Google Scholar] [CrossRef] [PubMed]
- Gizeli, E.; Lowe, C.R. Immunosensors. Curr. Opin. Biotechnol. 1996, 7, 66–71. [Google Scholar] [CrossRef]
- Wang, M.; Zhang, Y.; Tian, F.; Liu, X.; Du, S.; Ren, G. Overview of Rapid Detection Methods for Salmonella in Foods: Progress and Challenges. Foods 2021, 10, 2402. [Google Scholar] [CrossRef]
- Lee, K.-M.; Runyon, M.; Herrman, T.J.; Phillips, R.; Hsieh, J. Review of Salmonella Detection and Identification Methods: Aspects of Rapid Emergency Response and Food Safety. Food Control 2015, 47, 264–276. [Google Scholar] [CrossRef]
- Cheung, P.Y.; Kwok, K.K.; Kam, K.M. Application of BAX System, Tecra Unique Salmonella Test, and a Conventional Culture Method for the Detection of Salmonella in Ready-to-Eat and Raw Foods. J. Appl. Microbiol. 2007, 103, 219–227. [Google Scholar] [CrossRef]
- Tietjen, M.; Fung, D.Y.C. Salmonellae and Food Safety. Crit. Rev. Microbiol. 1995, 21, 53–83. [Google Scholar] [CrossRef]
- Uyttendaele, M.; Vanwildemeersch, K.; Debevere, J. Evaluation of Real-Time PCR vs Automated ELISA and a Conventional Culture Method Using a Semi-Solid Medium for Detection of Salmonella. Lett. Appl. Microbiol. 2003, 37, 386–391. [Google Scholar] [CrossRef] [Green Version]
- Afonso, A.S.; Pérez-López, B.; Faria, R.C.; Mattoso, L.H.C.; Hernández-Herrero, M.; Roig-Sagués, A.X.; Maltez-da Costa, M.; Merkoçi, A. Electrochemical Detection of Salmonella Using Gold Nanoparticles. Biosens. Bioelectron. 2013, 40, 121–126. [Google Scholar] [CrossRef]
- Das, R.; Sharma, M.K.; Rao, V.K.; Bhattacharya, B.K.; Garg, I.; Venkatesh, V.; Upadhyay, S. An Electrochemical Genosensor for Salmonella Typhi on Gold Nanoparticles-Mercaptosilane Modified Screen Printed Electrode. J. Biotechnol. 2014, 188, 9–16. [Google Scholar] [CrossRef]
- Dill, K.; Stanker, L.H.; Young, C.R. Detection of Salmonella in Poultry Using a Silicon Chip-Based Biosensor. J. Biochem. Biophys. Methods 1999, 41, 61–67. [Google Scholar] [CrossRef]
- Mason, H.-Y.; Lloyd, C.; Dice, M.; Sinclair, R.; Ellis, W.; Powers, L. Taxonomic Identification of Microorganisms by Capture and Intrinsic Fluorescence Detection. Biosens. Bioelectron. 2003, 18, 521–527. [Google Scholar] [CrossRef]
- Quinn, J.; Patel, P.; Fitzpatrick, B.; Manning, B.; Dillon, P.; Daly, S.; Okennedy, R.; Alcocer, M.; Lee, H.; Morgan, M.; et al. The Use of Regenerable, Affinity Ligand-Based Surfaces for Immunosensor Applications. Biosens. Bioelectron. 1999, 14, 587–595. [Google Scholar] [CrossRef]
- Skládal, P.; Kovář, D.; Krajíček, V.; Šišková, P.; Přibyl, J.; Švábenská, E. Electrochemical Immunosensors for Detection of Microorganisms. Int. J. Electrochem. Sci. 2013, 8, 1635–1649. [Google Scholar]
- Wang, D.; Wang, Z.; Chen, J.; Kinchla, A.J.; Nugen, S.R. Rapid Detection of Salmonella Using a Redox Cycling-Based Electrochemical Method. Food Control 2016, 62, 81–88. [Google Scholar] [CrossRef] [Green Version]
- Braiek, M.; Rokbani, K.B.; Chrouda, A.; Mrabet, B.; Bakhrouf, A.; Maaref, A.; Jaffrezic-Renault, N. An Electrochemical Immunosensor for Detection of Staphylococcus Aureus Bacteria Based on Immobilization of Antibodies on Self-Assembled Monolayers-Functionalized Gold Electrode. Biosensors 2012, 2, 417–426. [Google Scholar] [CrossRef] [PubMed] [Green Version]
- Mutreja, R.; Jariyal, M.; Pathania, P.; Sharma, A.; Sahoo, D.K.; Suri, C.R. Novel Surface Antigen Based Impedimetric Immunosensor for Detection of Salmonella typhimurium in Water and Juice Samples. Biosens. Bioelectron. 2016, 85, 707–713. [Google Scholar] [CrossRef] [PubMed]
- Valderrama, W.B.; Dudley, E.G.; Doores, S.; Cutter, C.N. Commercially Available Rapid Methods for Detection of Selected Food-Borne Pathogens. Crit. Rev. Food Sci. Nutr. 2016, 56, 1519–1531. [Google Scholar] [CrossRef] [PubMed]
- Zhang, D.; Huarng, M.C.; Alocilja, E.C. A Multiplex Nanoparticle-Based Bio-Barcoded DNA Sensor for the Simultaneous Detection of Multiple Pathogens. Biosens. Bioelectron. 2010, 26, 1736–1742. [Google Scholar] [CrossRef] [PubMed]
- Zhang, P.; Liu, H.; Ma, S.; Men, S.; Li, Q.; Yang, X.; Wang, H.; Zhang, A. A Label-Free Ultrasensitive Fluorescence Detection of Viable Salmonella Enteritidis Using Enzyme-Induced Cascade Two-Stage Toehold Strand-Displacement-Driven Assembly of G-Quadruplex DNA. Biosens. Bioelectron. 2016, 80, 538–542. [Google Scholar] [CrossRef]
- Weber, J.E.; Pillai, S.; Ram, M.K.; Kumar, A.; Singh, S.R. Electrochemical Impedance-Based DNA Sensor Using a Modified Single Walled Carbon Nanotube Electrode. Mater. Sci. Eng. C 2011, 31, 821–825. [Google Scholar] [CrossRef]
- Singh, A.; Sinsinbar, G.; Choudhary, M.; Kumar, V.; Pasricha, R.; Verma, H.N.; Singh, S.P.; Arora, K. Graphene Oxide-Chitosan Nanocomposite Based Electrochemical DNA Biosensor for Detection of Typhoid. Sensors Actuators B Chem. 2013, 185, 675–684. [Google Scholar] [CrossRef]
- Amouzadeh Tabrizi, M.; Shamsipur, M. A Label-Free Electrochemical DNA Biosensor Based on Covalent Immobilization of Salmonella DNA Sequences on the Nanoporous Glassy Carbon Electrode. Biosens. Bioelectron. 2015, 69, 100–105. [Google Scholar] [CrossRef] [PubMed]
- Bokken, G.C.A.M.; Corbee, R.J.; Van Knapen, F.; Bergwerff, A.A. Immunochemical Detection of Salmonella Group B, D and E Using an Optical Surface Plasmon Resonance Biosensor. FEMS Microbiol. Lett. 2003, 222, 75–82. [Google Scholar] [CrossRef] [Green Version]
- Wagner, T.; Schöning, M.J. Chapter 5 Light-Addressable Potentiometric Sensors (LAPS): Recent Trends and Applications. In Comprehensive Analytical Chemistry; Alegret, S., Merkoçi, A., Eds.; Elsevier: Amsterdam, The Netherlands, 2007; Volume 49, pp. 87–128. ISBN 0166-526X. [Google Scholar]
- Fei, J.; Dou, W.; Zhao, G. Amperometric Immunoassay for the Detection of Salmonella pullorum Using a Screen—Printed Carbon Electrode Modified with Gold Nanoparticle-Coated Reduced Graphene Oxide and Immunomagnetic Beads. Microchim. Acta 2016, 183, 757–764. [Google Scholar] [CrossRef]
- Sheikhzadeh, E.; Chamsaz, M.; Turner, A.P.F.; Jager, E.W.H.; Beni, V. Label-Free Impedimetric Biosensor for Salmonella typhimurium Detection Based on Poly [Pyrrole-Co-3-Carboxyl-Pyrrole] Copolymer Supported Aptamer. Biosens. Bioelectron. 2016, 80, 194–200. [Google Scholar] [CrossRef] [Green Version]
- Farka, Z.; Juřík, T.; Pastucha, M.; Kovář, D.; Lacina, K.; Skládal, P. Rapid Immunosensing of Salmonella typhimurium Using Electrochemical Impedance Spectroscopy: The Effect of Sample Treatment. Electroanalysis 2016, 28, 1803–1809. [Google Scholar] [CrossRef]
- Jia, F.; Duan, N.; Wu, S.; Dai, R.; Wang, Z.; Li, X. Impedimetric Salmonella Aptasensor Using a Glassy Carbon Electrode Modified with an Electrodeposited Composite Consisting of Reduced Graphene Oxide and Carbon Nanotubes. Microchim. Acta 2016, 183, 337–344. [Google Scholar] [CrossRef]
- Cheung, P.Y.; Kam, K.M. Salmonella in Food Surveillance: PCR, Immunoassays, and Other Rapid Detection and Quantification Methods. Food Res. Int. 2012, 2, 802–808. [Google Scholar] [CrossRef]
- Freitas, M.; Viswanathan, S.; Nouws, H.P.A.; Oliveira, M.B.P.P.; Delerue-Matos, C. Iron Oxide/Gold Core/Shell Nanomagnetic Probes and CdS Biolabels for Amplified Electrochemical Immunosensing of Salmonella typhimurium. Biosens. Bioelectron. 2014, 51, 195–200. [Google Scholar] [CrossRef] [Green Version]
- Silva, N.F.D.; Magalhães, J.M.C.S.; Oliva-Teles, M.T.; Delerue-Matos, C. A Potentiometric Magnetic Immunoassay for Rapid Detection of Salmonella typhimurium. Anal. Methods 2015, 7, 4008–4011. [Google Scholar] [CrossRef]
- Kim, G.; Moon, J.-H.; Moh, C.-Y.; Lim, J. A Microfluidic Nano-Biosensor for the Detection of Pathogenic Salmonella. Biosens. Bioelectron. 2015, 67, 243–247. [Google Scholar] [CrossRef] [PubMed]
- Xu, M.; Wang, R.; Li, Y. Rapid Detection of Escherichia Coli O157:H7 and Salmonella typhimurium in Foods Using an Electrochemical Immunosensor Based on Screen-Printed Interdigitated Microelectrode and Immunomagnetic Separation. Talanta 2016, 148, 200–208. [Google Scholar] [CrossRef] [PubMed]
- Fei, J.; Dou, W.; Zhao, G. A Sandwich Electrochemical Immunosensor for Salmonella pullorum and Salmonella gallinarum Based on a Screen-Printed Carbon Electrode Modified with an Ionic Liquid and Electrodeposited Gold Nanoparticles. Microchim. Acta 2015, 182, 2267–2275. [Google Scholar] [CrossRef]
- Rychert, J. Benefits and Limitations of MALDI-TOF Mass Spectrometry for the Identification of Microorganisms. J. Infect. 2019, 2, 1–5. [Google Scholar] [CrossRef]
- Banik, S.; Melanthota, S.K.; Arbaaz; Vaz, J.M.; Kadambalithaya, V.M.; Hussain, I.; Dutta, S.; Mazumder, N. Recent Trends in Smartphone-Based Detection for Biomedical Applications: A Review. Anal. Bioanal. Chem. 2021, 413, 2389–2406. [Google Scholar] [CrossRef]
- Kuhlmann, T.; Garaizar, P.; Reips, U.-D. Smartphone Sensor Accuracy Varies from Device to Device in Mobile Research: The Case of Spatial Orientation. Behav. Res. Methods 2021, 53, 22–33. [Google Scholar] [CrossRef]
- Kaisti, M. Detection Principles of Biological and Chemical FET Sensors. Biosens. Bioelectron. 2017, 98, 437–448. [Google Scholar] [CrossRef]
- Park, I.-S.; Kim, W.-Y.; Kim, N. Operational Characteristics of an Antibody-Immobilized QCM System Detecting Salmonella spp. Biosens. Bioelectron. 2000, 15, 167–172. [Google Scholar] [CrossRef]
- Yao, S.-Z.; Zhou, T.-A. Dependence of the Oscillation Frequency of a Piezoelectric Crystal on the Physical Parameters of Liquids. Anal. Chim. Acta 1988, 212, 61–72. [Google Scholar] [CrossRef]
- Li, Z.-Z.; Gong, F.-C.; Shen, G.-L.; Yu, R.-Q. Bacteria-Modified Amperometric Immunosensor for a Brucella melitensis Antibody Assay. Anal. Sci. 2002, 18, 625–630. [Google Scholar] [CrossRef] [PubMed] [Green Version]
- Kim, S.; Song, H.; Ahn, H.; Kim, T.; Jung, J.; Cho, S.K.; Shin, D.M.; Choi, J.R.; Hwang, Y.H.; Kim, K. A Review of Advanced Impedance Biosensors with Microfluidic Chips for Single-Cell Analysis. Biosensors 2021, 11, 412. [Google Scholar] [CrossRef]
- Angelopoulou, M.; Tzialla, K.; Voulgari, A.; Dikeoulia, M.; Raptis, I.; Kakabakos, S.E.; Petrou, P. Rapid Detection of Salmonella typhimurium in Drinking Water by a White Light Reflectance Spectroscopy Immunosensor. Sensors 2021, 21, 2683. [Google Scholar] [CrossRef] [PubMed]
- Hao, L.; Xue, L.; Huang, F.; Cai, G.; Qi, W.; Zhang, M.; Han, Q.; Wang, Z.; Lin, J. A Microfluidic Biosensor Based on Magnetic Nanoparticle Separation, Quantum Dots Labeling and MnO2 Nanoflower Amplification for Rapid and Sensitive Detection of Salmonella typhimurium. Micromachines 2020, 11, 281. [Google Scholar] [CrossRef] [Green Version]
- Liu, J.; Jasim, I.; Shen, Z.; Zhao, L.; Dweik, M.; Zhang, S.; Almasri, M. A Microfluidic Based Biosensor for Rapid Detection of Salmonella in Food Products. PLoS ONE 2019, 14, e0216873. [Google Scholar] [CrossRef] [PubMed] [Green Version]
- Cinti, S.; Volpe, G.; Piermarini, S.; Delibato, E.; Palleschi, G. Electrochemical Biosensors for Rapid Detection of Foodborne Salmonella: A Critical Overview. Sensors 2017, 17, 1910. [Google Scholar] [CrossRef] [PubMed]
- Paniel, N.; Noguer, T. Detection of Salmonella in Food Matrices, from Conventional Methods to Recent Aptamer-Sensing Technologies. Foods 2019, 8, 371. [Google Scholar] [CrossRef] [PubMed] [Green Version]
- Howe, E.; Harding, G. A Comparison of Protocols for the Optimisation of Detection of Bacteria Using a Surface Acoustic Wave (SAW) Biosensor. Biosens. Bioelectron. 2000, 15, 641–649. [Google Scholar] [CrossRef]
- Nakanishi, K.; Muguruma, H.; Karube, I. A Novel Method of Immobilizing Antibodies on a Quartz Crystal Microbalance Using Plasma-Polymerized Films for Immunosensors. Anal. Chem. 1996, 68, 1695–1700. [Google Scholar] [CrossRef]
- Uttenthaler, E.; Schräml, M.; Mandel, J.; Drost, S. Ultrasensitive Quartz Crystal Microbalance Sensors for Detection of M13-Phages in Liquids. Biosens. Bioelectron. 2001, 16, 735–743. [Google Scholar] [CrossRef]
- Lerner, M.B.; Goldsmith, B.R.; McMillon, R.; Dailey, J.; Pillai, S.; Singh, S.R.; Johnson, A.T.C. A Carbon Nanotube Immunosensor for Salmonella. AIP Adv. 2011, 1, 042127. [Google Scholar] [CrossRef] [Green Version]
- Wang, D.; Dou, W.; Chen, Y.; Zhao, G. Enzyme-Functionalized Electrochemical Immunosensor Based on Electrochemically Reduced Graphene Oxide and Polyvinyl Alcohol-Polydimethylsiloxane for the Detection of Salmonella pullorum & Salmonella gallinarum. RSC Adv. 2014, 4, 57733–57742. [Google Scholar] [CrossRef]
- Goh, J.B.; Tam, P.L.; Loo, R.W.; Cynthia Goh, M. A Quantitative Diffraction-Based Sandwich Immunoassay. Anal. Biochem. 2003, 313, 262–266. [Google Scholar] [CrossRef]
- Olsen, E.V.; Pathirana, S.T.; Samoylov, A.M.; Barbaree, J.M.; Chin, B.A.; Neely, W.C.; Vodyanoy, V. Specific and Selective Biosensor for Salmonella and Its Detection in the Environment. J. Microbiol. Methods 2003, 53, 273–285. [Google Scholar] [CrossRef]
- Libby, J.M.; Wada, H.G. Detection of Neisseria Meningitidis and Yersinia Pestis with a Novel Silicon-Based Sensor. J. Clin. Microbiol. 1989, 27, 1456–1459. [Google Scholar] [CrossRef] [PubMed] [Green Version]
- Chai, Y.; Li, S.; Horikawa, S.; Park, M.K.; Vodyanoy, V.; Chin, B.A. Rapid and Sensitive Detection of Salmonella typhimurium on Eggshells by Using Wireless Biosensors. J. Food Prot. 2012, 75, 631–636. [Google Scholar] [CrossRef]
- Yang, L.; Ruan, C.; Li, Y. Rapid detection of Salmonella typhimurium in food samples using a bienzyme electrochemical biosensor with flow injection. J. Rapid Methods Autom. Microbiol. 2001, 9, 229–240. [Google Scholar] [CrossRef]
- Melo, A.M.A.; Alexandre, D.L.; Furtado, R.F.; Borges, M.F.; Figueiredo, E.A.T.; Biswas, A.; Cheng, H.N.; Alves, C.R. Electrochemical Immunosensors for Salmonella Detection in Food. Appl. Microbiol. Biotechnol. 2016, 100, 5301–5312. [Google Scholar] [CrossRef]
- Capobianco, J.A.; Lee, J.; Armstrong, C.M.; Gehring, A.G. Rapid detection of Salmonella enterica serotype Typhimurium in large volume samples using porous electrodes in a flow-through, enzyme-amplified immunoelectrochemical sensor. Anal. Bioanal. Chem. 2019, 411, 5233–5242. [Google Scholar] [CrossRef] [Green Version]
- Wang, J.; Li, Y.; Chen, J.; Hua, D.; Deng, H.; Li, Y.; Liang, Z.; Huang, J. Rapid Detection of Food-Borne Salmonella Contamination Using IMBs-QPCR Method Based on PagC Gene. Braz. J. Microbiol. 2018, 49, 320–328. [Google Scholar] [CrossRef]
- Salam, F.; Tothill, I.E. Detection of Salmonella typhimurium Using an Electrochemical Immunosensor. Biosens. Bioelectron. 2009, 24, 2630–2636. [Google Scholar] [CrossRef] [PubMed]
- Yang, G.-J.; Huang, J.-L.; Meng, W.-J.; Shen, M.; Jiao, X.-A. A Reusable Capacitive Immunosensor for Detection of Salmonella Spp. Based on Grafted Ethylene Diamine and Self-Assembled Gold Nanoparticle Monolayers. Anal. Chim. Acta 2009, 647, 159–166. [Google Scholar] [CrossRef] [PubMed]
- Melo, A.M.A.; Furtado, R.F.; de Fatima Borges, M.; Biswas, A.; Cheng, H.N.; Alves, C.R. Performance of an Amperometric Immunosensor Assembled on Carboxymethylated Cashew Gum for Salmonella Detection. Microchem. J. 2021, 167, 106268. [Google Scholar] [CrossRef]
- Sannigrahi, S.; Arumugasamy, S.K.; Mathiyarasu, J.; Suthindhiran, K. Magnetosome-Anti-Salmonella Antibody Complex Based Biosensor for the Detection of Salmonella typhimurium. Mater. Sci. Eng. C Mater. Biol. Appl. 2020, 114, 111071. [Google Scholar] [CrossRef]
- Moutou, K.A.; Panagiotaki, P.; Mamuris, Z. Rapid Detection of Salmonella in Milk by Biofunctionalised Magnetic Nanoparticle Cluster Sensor Based on Nuclear Magnetic Resonance. Int. Dairy J. 2019, 91, 82–88. [Google Scholar]
- Fulgione, A.; Cimafonte, M.; Della Ventura, B.; Iannaccone, M.; Ambrosino, C.; Capuano, F.; Proroga, Y.T.R.; Velotta, R.; Capparelli, R. QCM-Based Immunosensor for Rapid Detection of Salmonella typhimurium in Food. Sci. Rep. 2018, 8, 16137. [Google Scholar] [CrossRef] [Green Version]
- Hou, Y.; Tang, W.; Qi, W.; Guo, X.; Lin, J. An Ultrasensitive Biosensor for Fast Detection of Salmonella Using 3D Magnetic Grid Separation and Urease Catalysis. Biosens. Bioelectron. 2020, 157, 112160. [Google Scholar] [CrossRef] [PubMed]
- Li, J.; Ma, B.; Fang, J.; Zhi, A.; Chen, E.; Xu, Y.; Yu, X.; Sun, C.; Zhang, M. Recombinase Polymerase Amplification (RPA) Combined with Lateral Flow Immunoassay for Rapid Detection of Salmonella in Food. Foods 2019, 9, 27. [Google Scholar] [CrossRef] [PubMed] [Green Version]
- Patrick, A.D.; Grimont, F.-X.W. Antigenic Formulae of the Salmonella Serovars; WHO Press—World Health Organization: Geneve, Switzerland, 2007. [Google Scholar]


 ), electrode with gelatin membrane (
  ), electrode with agarose membrane (
  ), electrode with collagen membrane (
  ) and electrode with a dialysis membrane electrode interface disc (
  ). All the membranes were coated with the binder silane, and immobilized with specific mouse anti-Salmonella monoclonal antibody (MCA) (1:1000 dilution) followed by specific cells Salmonella sp. 3000 cells (3 × 10⁵ cells/mL), and rabbit anti-mouse secondary antibody conjugated with HRP in 0.1 M PBS. Data represent mean ± sd (n = 5).
), electrode with gelatin membrane ( ), electrode with agarose membrane ( ), electrode with collagen membrane ( ) and electrode with a dialysis membrane electrode interface disc ( ). All the membranes were coated with the binder silane, and immobilized with specific mouse anti-Salmonella monoclonal antibody (MCA) (1:1000 dilution) followed by specific cells Salmonella sp. 3000 cells (3 × 10⁵ cells/mL), and rabbit anti-mouse secondary antibody conjugated with HRP in 0.1 M PBS. Data represent mean ± sd (n = 5).
). All the membranes were coated with the binder silane, and immobilized with specific mouse anti-Salmonella monoclonal antibody (MCA) (1:1000 dilution) followed by specific cells Salmonella sp. 3000 cells (3 × 10⁵ cells/mL), and rabbit anti-mouse secondary antibody conjugated with HRP in 0.1 M PBS. Data represent mean ± sd (n = 5).
), electrode with gelatin membrane ( ), electrode with agarose membrane ( ), electrode with collagen membrane ( ) and electrode with a dialysis membrane electrode interface disc ( ). All the membranes were coated with the binder silane, and immobilized with specific mouse anti-Salmonella monoclonal antibody (MCA) (1:1000 dilution) followed by specific cells Salmonella sp. 3000 cells (3 × 10⁵ cells/mL), and rabbit anti-mouse secondary antibody conjugated with HRP in 0.1 M PBS. Data represent mean ± sd (n = 5).
 ); specific mouse anti-Salmonella monoclonal antibody (MCA), 1:1000 dilution, immobilized on the electrode (
  ); the electrode with DM and MCA with 1% bovine serum albumin, BSA (
  ); electrode containing DM coated with buffer, MCA and BSA and layered with 3000 Salmonella cells (10 µL of 3 × 10⁵ cells/mL), MCA-S.Ag (
  ); the processed electrode further treated with mouse anti-Salmonella monoclonal antibody (1:1000 dilution), MCA-S.Ag-S.mAb (
  ); rabbit anti-mouse secondary antibody conjugated with HRP (MCA-S.Ag-S.mAb-HRP), layered on the mouse anti-Salmonella monoclonal antibody coated electrode (
  ); and finally, o-aminophenol substrate coated on the fabricated electrode, MCA-S.Ag-S.mAb-HRP-oAp, in 0.1 M PBS solution (
  ). The reactive substrate alone (o-AP in 0.1 M PBS solution) was tested for comparison (
  ). Data represent mean ± SD (n = 5).
); specific mouse anti-Salmonella monoclonal antibody (MCA), 1:1000 dilution, immobilized on the electrode ( ); the electrode with DM and MCA with 1% bovine serum albumin, BSA ( ); electrode containing DM coated with buffer, MCA and BSA and layered with 3000 Salmonella cells (10 µL of 3 × 10⁵ cells/mL), MCA-S.Ag ( ); the processed electrode further treated with mouse anti-Salmonella monoclonal antibody (1:1000 dilution), MCA-S.Ag-S.mAb ( ); rabbit anti-mouse secondary antibody conjugated with HRP (MCA-S.Ag-S.mAb-HRP), layered on the mouse anti-Salmonella monoclonal antibody coated electrode ( ); and finally, o-aminophenol substrate coated on the fabricated electrode, MCA-S.Ag-S.mAb-HRP-oAp, in 0.1 M PBS solution ( ). The reactive substrate alone (o-AP in 0.1 M PBS solution) was tested for comparison ( ). Data represent mean ± SD (n = 5).
). Data represent mean ± SD (n = 5).
); specific mouse anti-Salmonella monoclonal antibody (MCA), 1:1000 dilution, immobilized on the electrode ( ); the electrode with DM and MCA with 1% bovine serum albumin, BSA ( ); electrode containing DM coated with buffer, MCA and BSA and layered with 3000 Salmonella cells (10 µL of 3 × 10⁵ cells/mL), MCA-S.Ag ( ); the processed electrode further treated with mouse anti-Salmonella monoclonal antibody (1:1000 dilution), MCA-S.Ag-S.mAb ( ); rabbit anti-mouse secondary antibody conjugated with HRP (MCA-S.Ag-S.mAb-HRP), layered on the mouse anti-Salmonella monoclonal antibody coated electrode ( ); and finally, o-aminophenol substrate coated on the fabricated electrode, MCA-S.Ag-S.mAb-HRP-oAp, in 0.1 M PBS solution ( ). The reactive substrate alone (o-AP in 0.1 M PBS solution) was tested for comparison ( ). Data represent mean ± SD (n = 5).
 ), and with various dilutions of immobilized mouse anti-Salmonella monoclonal antibody (MCA) on the glassy carbon electrode viz. 1:30,000 (
  ), 1:40,000 (
  ), 1:50,000 (
  ), and 1:60,000 (
  ). In each case the electrode was prepared with a constant attached population of specific Salmonella cells (MCA–S.Ag 3 × 10⁵ cells/mL) and enzyme (HRP) substrate (o-amino phenol) complex in 0.1 M PBS pH 7.2. Data represent mean ± SD (n = 5).
), and with various dilutions of immobilized mouse anti-Salmonella monoclonal antibody (MCA) on the glassy carbon electrode viz. 1:30,000 ( ), 1:40,000 ( ), 1:50,000 ( ), and 1:60,000 ( ). In each case the electrode was prepared with a constant attached population of specific Salmonella cells (MCA–S.Ag 3 × 10⁵ cells/mL) and enzyme (HRP) substrate (o-amino phenol) complex in 0.1 M PBS pH 7.2. Data represent mean ± SD (n = 5).
). In each case the electrode was prepared with a constant attached population of specific Salmonella cells (MCA–S.Ag 3 × 10⁵ cells/mL) and enzyme (HRP) substrate (o-amino phenol) complex in 0.1 M PBS pH 7.2. Data represent mean ± SD (n = 5).
), and with various dilutions of immobilized mouse anti-Salmonella monoclonal antibody (MCA) on the glassy carbon electrode viz. 1:30,000 ( ), 1:40,000 ( ), 1:50,000 ( ), and 1:60,000 ( ). In each case the electrode was prepared with a constant attached population of specific Salmonella cells (MCA–S.Ag 3 × 10⁵ cells/mL) and enzyme (HRP) substrate (o-amino phenol) complex in 0.1 M PBS pH 7.2. Data represent mean ± SD (n = 5).
 ) and immobilized mouse anti-Salmonella monoclonal antibody (MCA) (1:30,000 dilution) with various concentrations of Salmonella cells [MCA-S.Ag 3 × 10³ cells/mL (
  ), 3 × 10⁴ cells/mL (
  ), 3 × 10⁵ cells/mL (
  ), 3 × 10⁶ cells/mL (
  ), and 3 × 10⁷ cells/mL (
  )] with MCA-S.Ag-S.mAb-HRP-O-Ap reaction in 0.1 M PBS solution. Data represent mean ± SD (n = 5).
) and immobilized mouse anti-Salmonella monoclonal antibody (MCA) (1:30,000 dilution) with various concentrations of Salmonella cells [MCA-S.Ag 3 × 10³ cells/mL ( ), 3 × 10⁴ cells/mL ( ), 3 × 10⁵ cells/mL ( ), 3 × 10⁶ cells/mL ( ), and 3 × 10⁷ cells/mL ( )] with MCA-S.Ag-S.mAb-HRP-O-Ap reaction in 0.1 M PBS solution. Data represent mean ± SD (n = 5).
)] with MCA-S.Ag-S.mAb-HRP-O-Ap reaction in 0.1 M PBS solution. Data represent mean ± SD (n = 5).
) and immobilized mouse anti-Salmonella monoclonal antibody (MCA) (1:30,000 dilution) with various concentrations of Salmonella cells [MCA-S.Ag 3 × 10³ cells/mL ( ), 3 × 10⁴ cells/mL ( ), 3 × 10⁵ cells/mL ( ), 3 × 10⁶ cells/mL ( ), and 3 × 10⁷ cells/mL ( )] with MCA-S.Ag-S.mAb-HRP-O-Ap reaction in 0.1 M PBS solution. Data represent mean ± SD (n = 5).
 ) and non-specific cells such as 30 cells of Vibrio sp. (3 × 10³ cells/mL,
  ), 30 cells of Pseudomonas sp. (3 × 10³ cells/mL,
  ) and 30 cells of Streptococcus sp. (3 × 10³ cells/mL,
  ) with enzyme and substrate complex. Data represent mean ± SD (n = 5).
) and non-specific cells such as 30 cells of Vibrio sp. (3 × 10³ cells/mL, ), 30 cells of Pseudomonas sp. (3 × 10³ cells/mL, ) and 30 cells of Streptococcus sp. (3 × 10³ cells/mL, ) with enzyme and substrate complex. Data represent mean ± SD (n = 5).
) with enzyme and substrate complex. Data represent mean ± SD (n = 5).
) and non-specific cells such as 30 cells of Vibrio sp. (3 × 10³ cells/mL, ), 30 cells of Pseudomonas sp. (3 × 10³ cells/mL, ) and 30 cells of Streptococcus sp. (3 × 10³ cells/mL, ) with enzyme and substrate complex. Data represent mean ± SD (n = 5).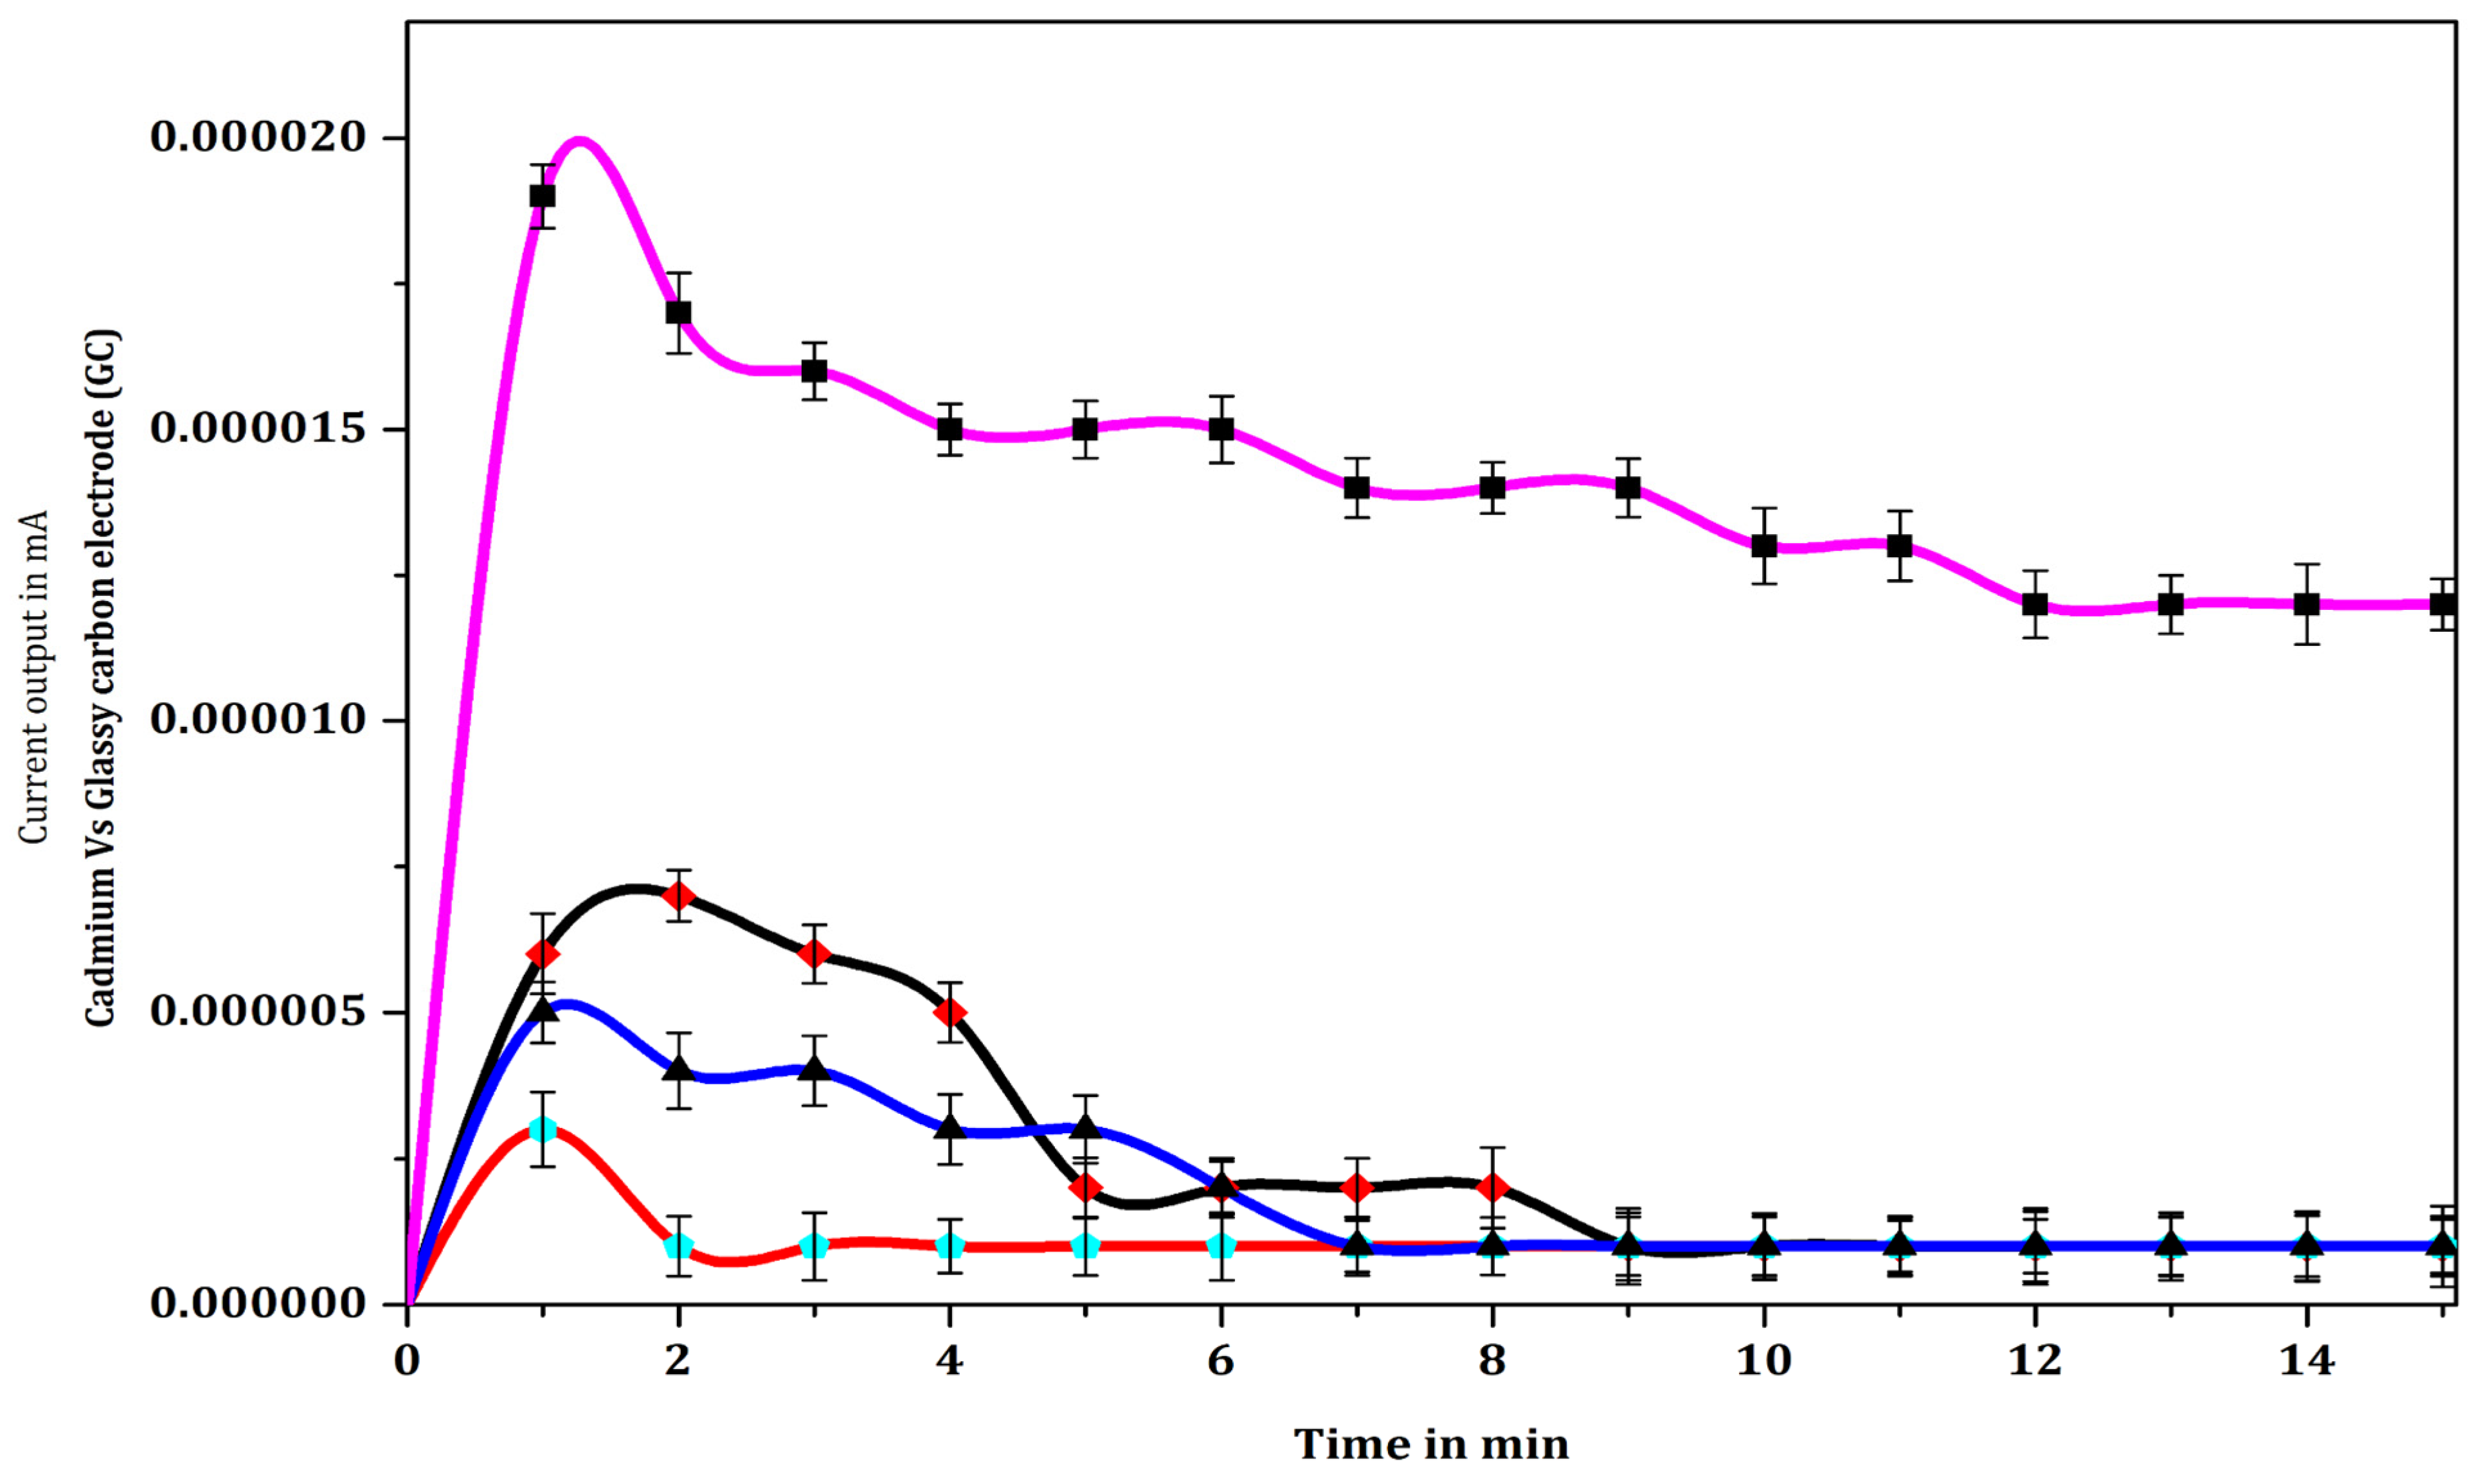

| Bare Electrode | Gelatin | Agarose | Collagen | Dialysis Membrane Electrode Interface Disc | |
|---|---|---|---|---|---|
| Bare Electrode | - | 0.81662 (0) | 0.99821 (0) | 0.01714 (1) | 0 (1) |
| Gelatin | 0.81662 (0) | - | 0.093573 (0) | 0.22572 (0) | 0 (1) |
| Agarose | 0.99821 (0) | 0.093573 (0) | - | 0.03897 (1) | 0 (1) |
| Collagen | 0.01714 (1) | 0.22572 (0) | 0.03897 (1) | - | 0 (1) |
| Dialysis membrane electrode interface disc | 0 (1) | 0 (1) | 0 (1) | 0 (1) | - |
| PBS | Mouse Anti-Salmonella Monoclonal Antibody | BSA | Salmonella Cells (3 × 10⁵ cells/mL)-Antigen | Mouse Anti-Salmonella Monoclonal Antibody | Rabbit Anti-Mouse Secondary Antibody | O-Aminophenol Substrate | Substrate Alone | |
|---|---|---|---|---|---|---|---|---|
| PBS | - | 0.07295 (0) | 0.98331 (0) | 0.1858 (0) | 0.70662 (0) | 0.99999 (0) | 0 (1) | 0.04545 (1) |
| Mouse Anti-Salmonella monoclonal antibody | 0.07295 (0) | - | 0.47224 (0) | 0.99993 (0) | 0.90661 (0) | 0.03544 (1) | 0 (1) | 0 (1) |
| BSA | 0.98331 (0) | 0.47224 (0) | - | 0.73392 (0) | 0.99529 (0) | 0.93439 (0) | 0 (1) | 0.00232 (1) |
| Salmonella cells (3 × 10⁵ cells/mL)-antigen | 0.1858 (0) | 0.99993 (0) | 0.73392 (0) | - | 0.98744 (0) | 0.1017 (0) | 0 (1) | 0 (1) |
| Mouse Anti-Salmonella monoclonal antibody | 0.70662 (0) | 0.90661 (0) | 0.99529 (0) | 0.98744 (0) | - | 0.53113 (0) | 0 (1) | 0 (1) |
| Rabbit Anti-mouse secondary | 0.99999 (0) | 0.03544 (1) | 0.93439 (0) | 0.1017 (0) | 0.53113 (0) | - | 0 (1) | 0.09124 (0) |
| O-aminophenol substrate | 0 (1) | 0 (1) | 0 (1) | 0 (1) | 0 (1) | 0 (1) | - | 0 (1) |
| Substrate Alone | 0.04545 (1) | 0 (1) | 0.00232 (1) | 0 (1) | 0 (1) | 0.09124 (0) | 0 (1) | - |
| PBS | MCA 1:30,000 | MCA 1:50,000 | MCA 1:60,000 | MCA 1:40,000 | |
|---|---|---|---|---|---|
| PBS | - | 0 (1) | 0 (1) | 0.02574 (0) | 0.02631 (0) |
| MCA 1:30,000 | 0 (1) | - | 0 (1) | 0 (1) | 0 (1) |
| MCA 1:50,000 | 0 (1) | 0 (1) | - | 0.01477 (1) | 0.01581 (1) |
| MCA 1:60,000 | 0.02574 (0) | 0 (1) | 0.01477 (1) | - | 1 (0) |
| MCA 1:40,000 | 0.02631 (0) | 0 (1) | 0.01581 (1) | 1 (0) | - |
| Salmonella Cells (3 × 10³ cells/mL) | Salmonella Cells (3 × 10⁴ cells/mL) | Salmonella Cells (3 × 10⁵ cells/mL) | Salmonella Cells (3 × 10⁶ cells/mL) | Salmonella Cells (3 × 10⁷ cells/mL) | PBS | |
|---|---|---|---|---|---|---|
| Salmonella cells (3 × 10³ cells/mL) | - | 0.35092 (0) | 0 (1) | 0.98036 (0) | 0 (1) | 0 (1) |
| Salmonella cells (3 × 10⁴ cells/mL) | 0.35092 (0) | - | 0 (1) | 0.08345 (1) | 0 (1) | 0 (1) |
| Salmonella cells (3 × 10⁵ cells/mL) | 0 (1) | 0 (1) | - | 0 (1) | 0 (1) | 0 (1) |
| Salmonella cells (3 × 10⁶ cells/mL) | 0.98036 (0) | 0.08345 (1) | 0 (1) | - | 0 (1) | 0 (1) |
| Salmonella cells (3 × 10⁷ cells/mL) | 0 (1) | 0 (1) | 0 (1) | 0 (1) | - | 0.99999 (0) |
| PBS | 0 (1) | 0 (1) | 0 (1) | 0 (1) | 0.99999 (0) | - |
| Non-Specific Vibrio sp. | Non-Specific Pseudomonas sp. | Non-Specific Streptococcus sp. | Specific Salmonella sp. | |
|---|---|---|---|---|
| Non-specific Vibrio sp. | - | 0.39087 (0) | 0.9147 (0) | 0 (1) |
| Non-specific Pseudomonas sp. | 0.39087 (0) | - | 0.78309 (0) | 0 (1) |
| Non-specific Streptococcus sp. | 0.9147 (0) | 0.78309 (0) | - | 0 (1) |
| Specific Salmonella sp. | 0 (1) | 0 (1) | 0 (1) | - |
Publisher’s Note: MDPI stays neutral with regard to jurisdictional claims in published maps and institutional affiliations. |
© 2022 by the authors. Licensee MDPI, Basel, Switzerland. This article is an open access article distributed under the terms and conditions of the Creative Commons Attribution (CC BY) license (https://creativecommons.org/licenses/by/4.0/).
Share and Cite
Ramasamy, P.; Dakshinamoorthy, G.; Jayashree, S.; Prabhu, D.; Rajamanikandan, S.; Velusamy, P.; Dayanithi, G.; Hanna, R.E.B. A Novel Prototype Biosensor Array Electrode System for Detecting the Bacterial Pathogen Salmonella typhimurium. Biosensors 2022, 12, 389. https://doi.org/10.3390/bios12060389
Ramasamy P, Dakshinamoorthy G, Jayashree S, Prabhu D, Rajamanikandan S, Velusamy P, Dayanithi G, Hanna REB. A Novel Prototype Biosensor Array Electrode System for Detecting the Bacterial Pathogen Salmonella typhimurium. Biosensors. 2022; 12(6):389. https://doi.org/10.3390/bios12060389
Chicago/Turabian StyleRamasamy, Palaniappan, Gajalakshmi Dakshinamoorthy, Shanmugam Jayashree, Dhamodharan Prabhu, Sundararaj Rajamanikandan, Palaniyandi Velusamy, Govindan Dayanithi, and Robert E. B. Hanna. 2022. "A Novel Prototype Biosensor Array Electrode System for Detecting the Bacterial Pathogen Salmonella typhimurium" Biosensors 12, no. 6: 389. https://doi.org/10.3390/bios12060389