A Bilayer SnO2/MoS2-Coated Evanescent Wave Fiber Optic Sensor for Acetone Detection—An Experimental Study

Abstract
:
1. Introduction
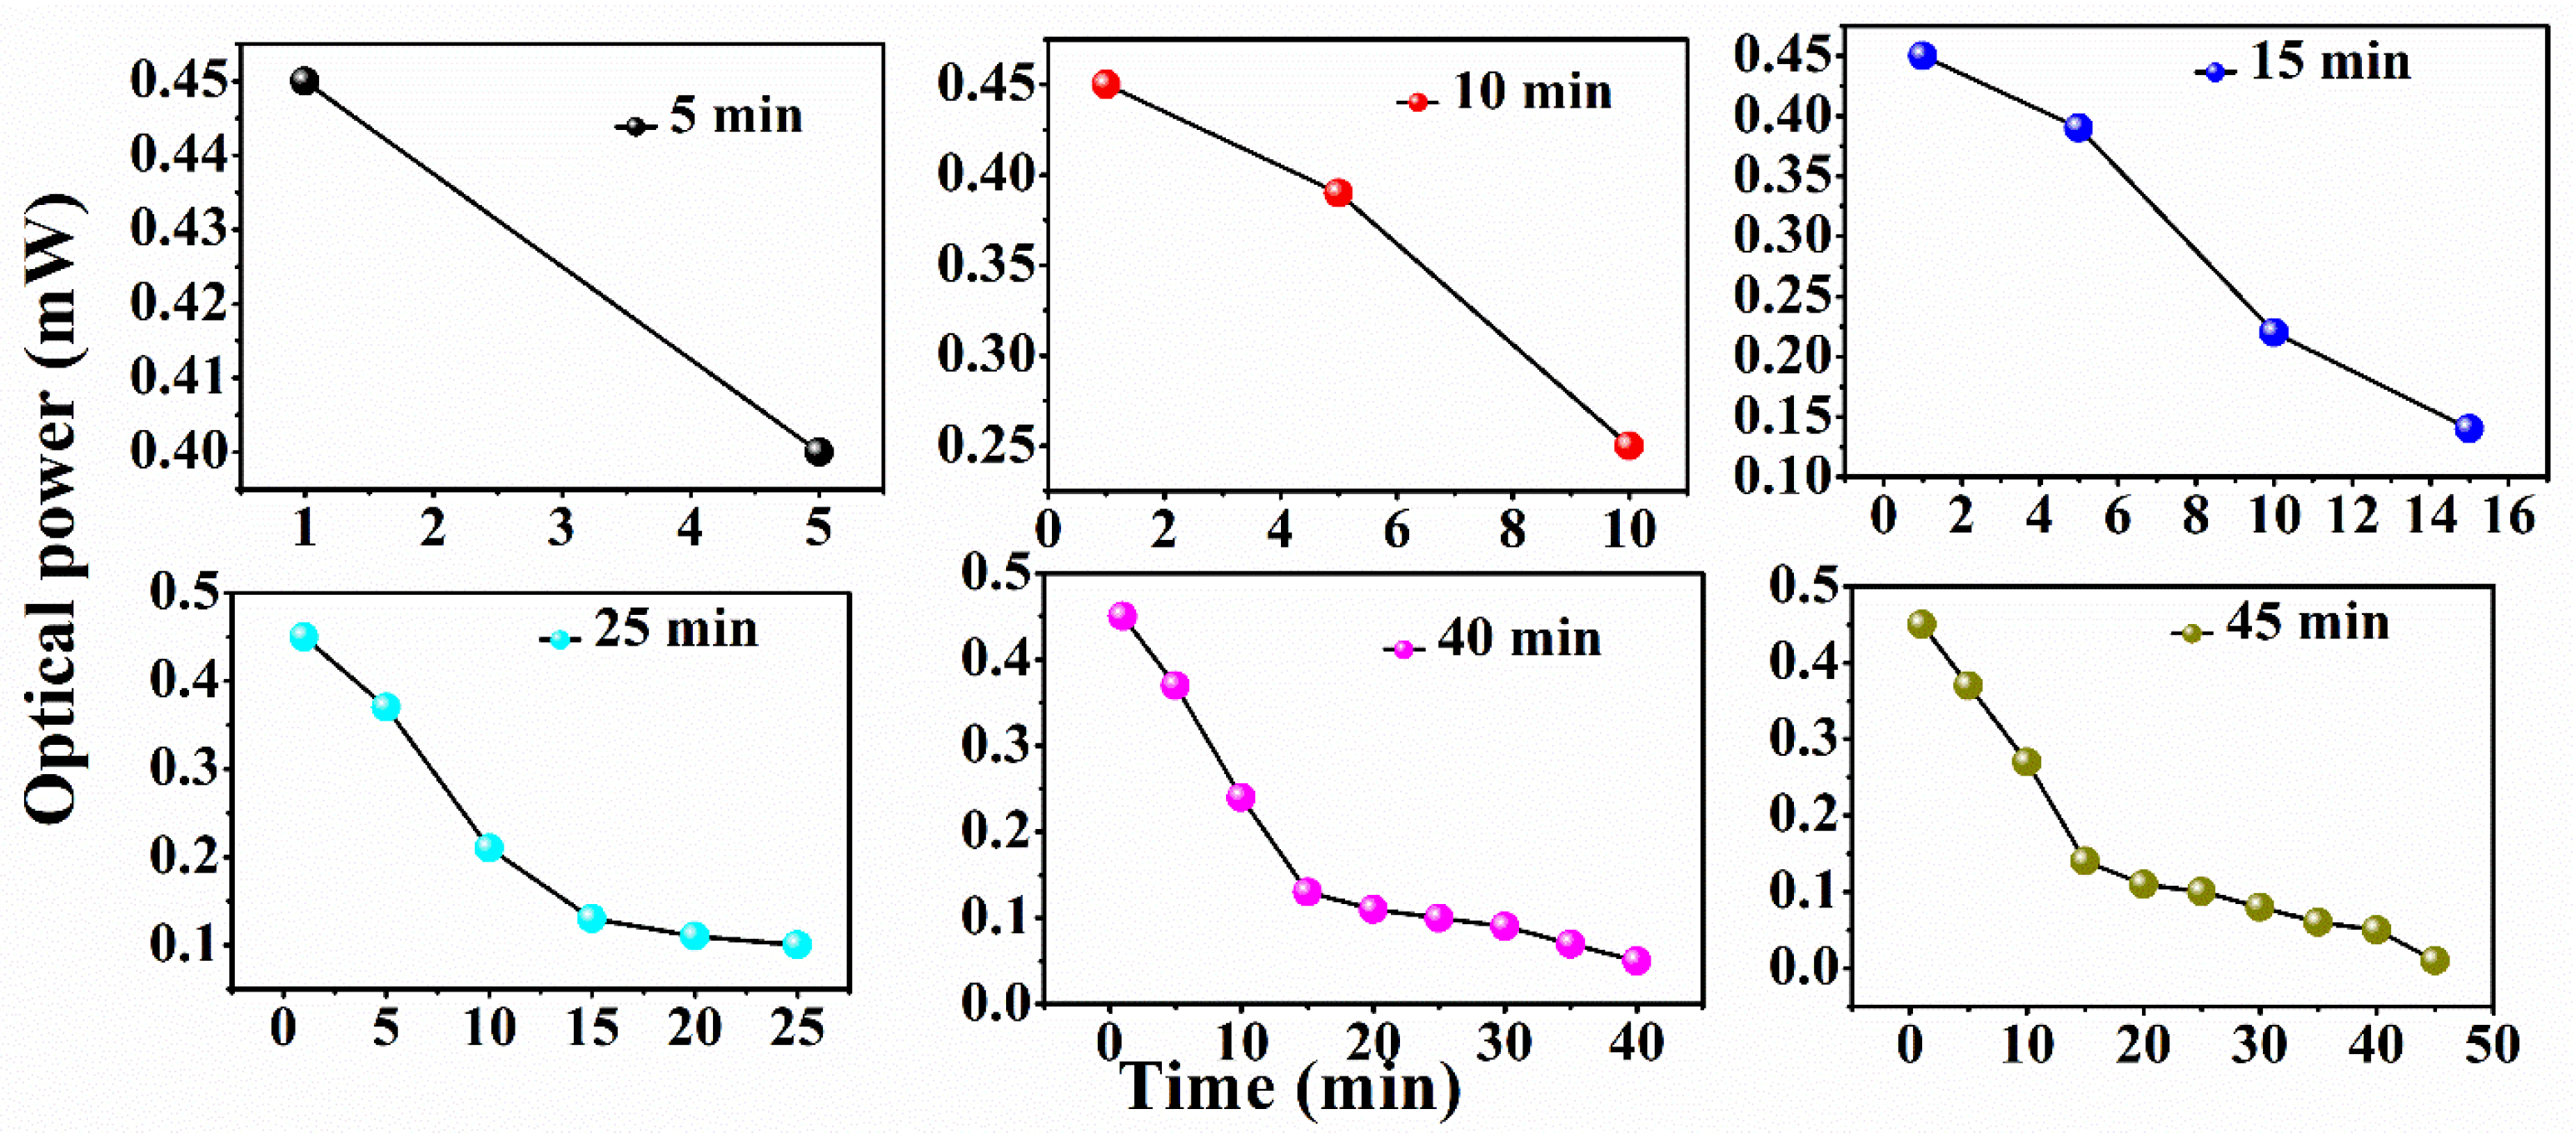
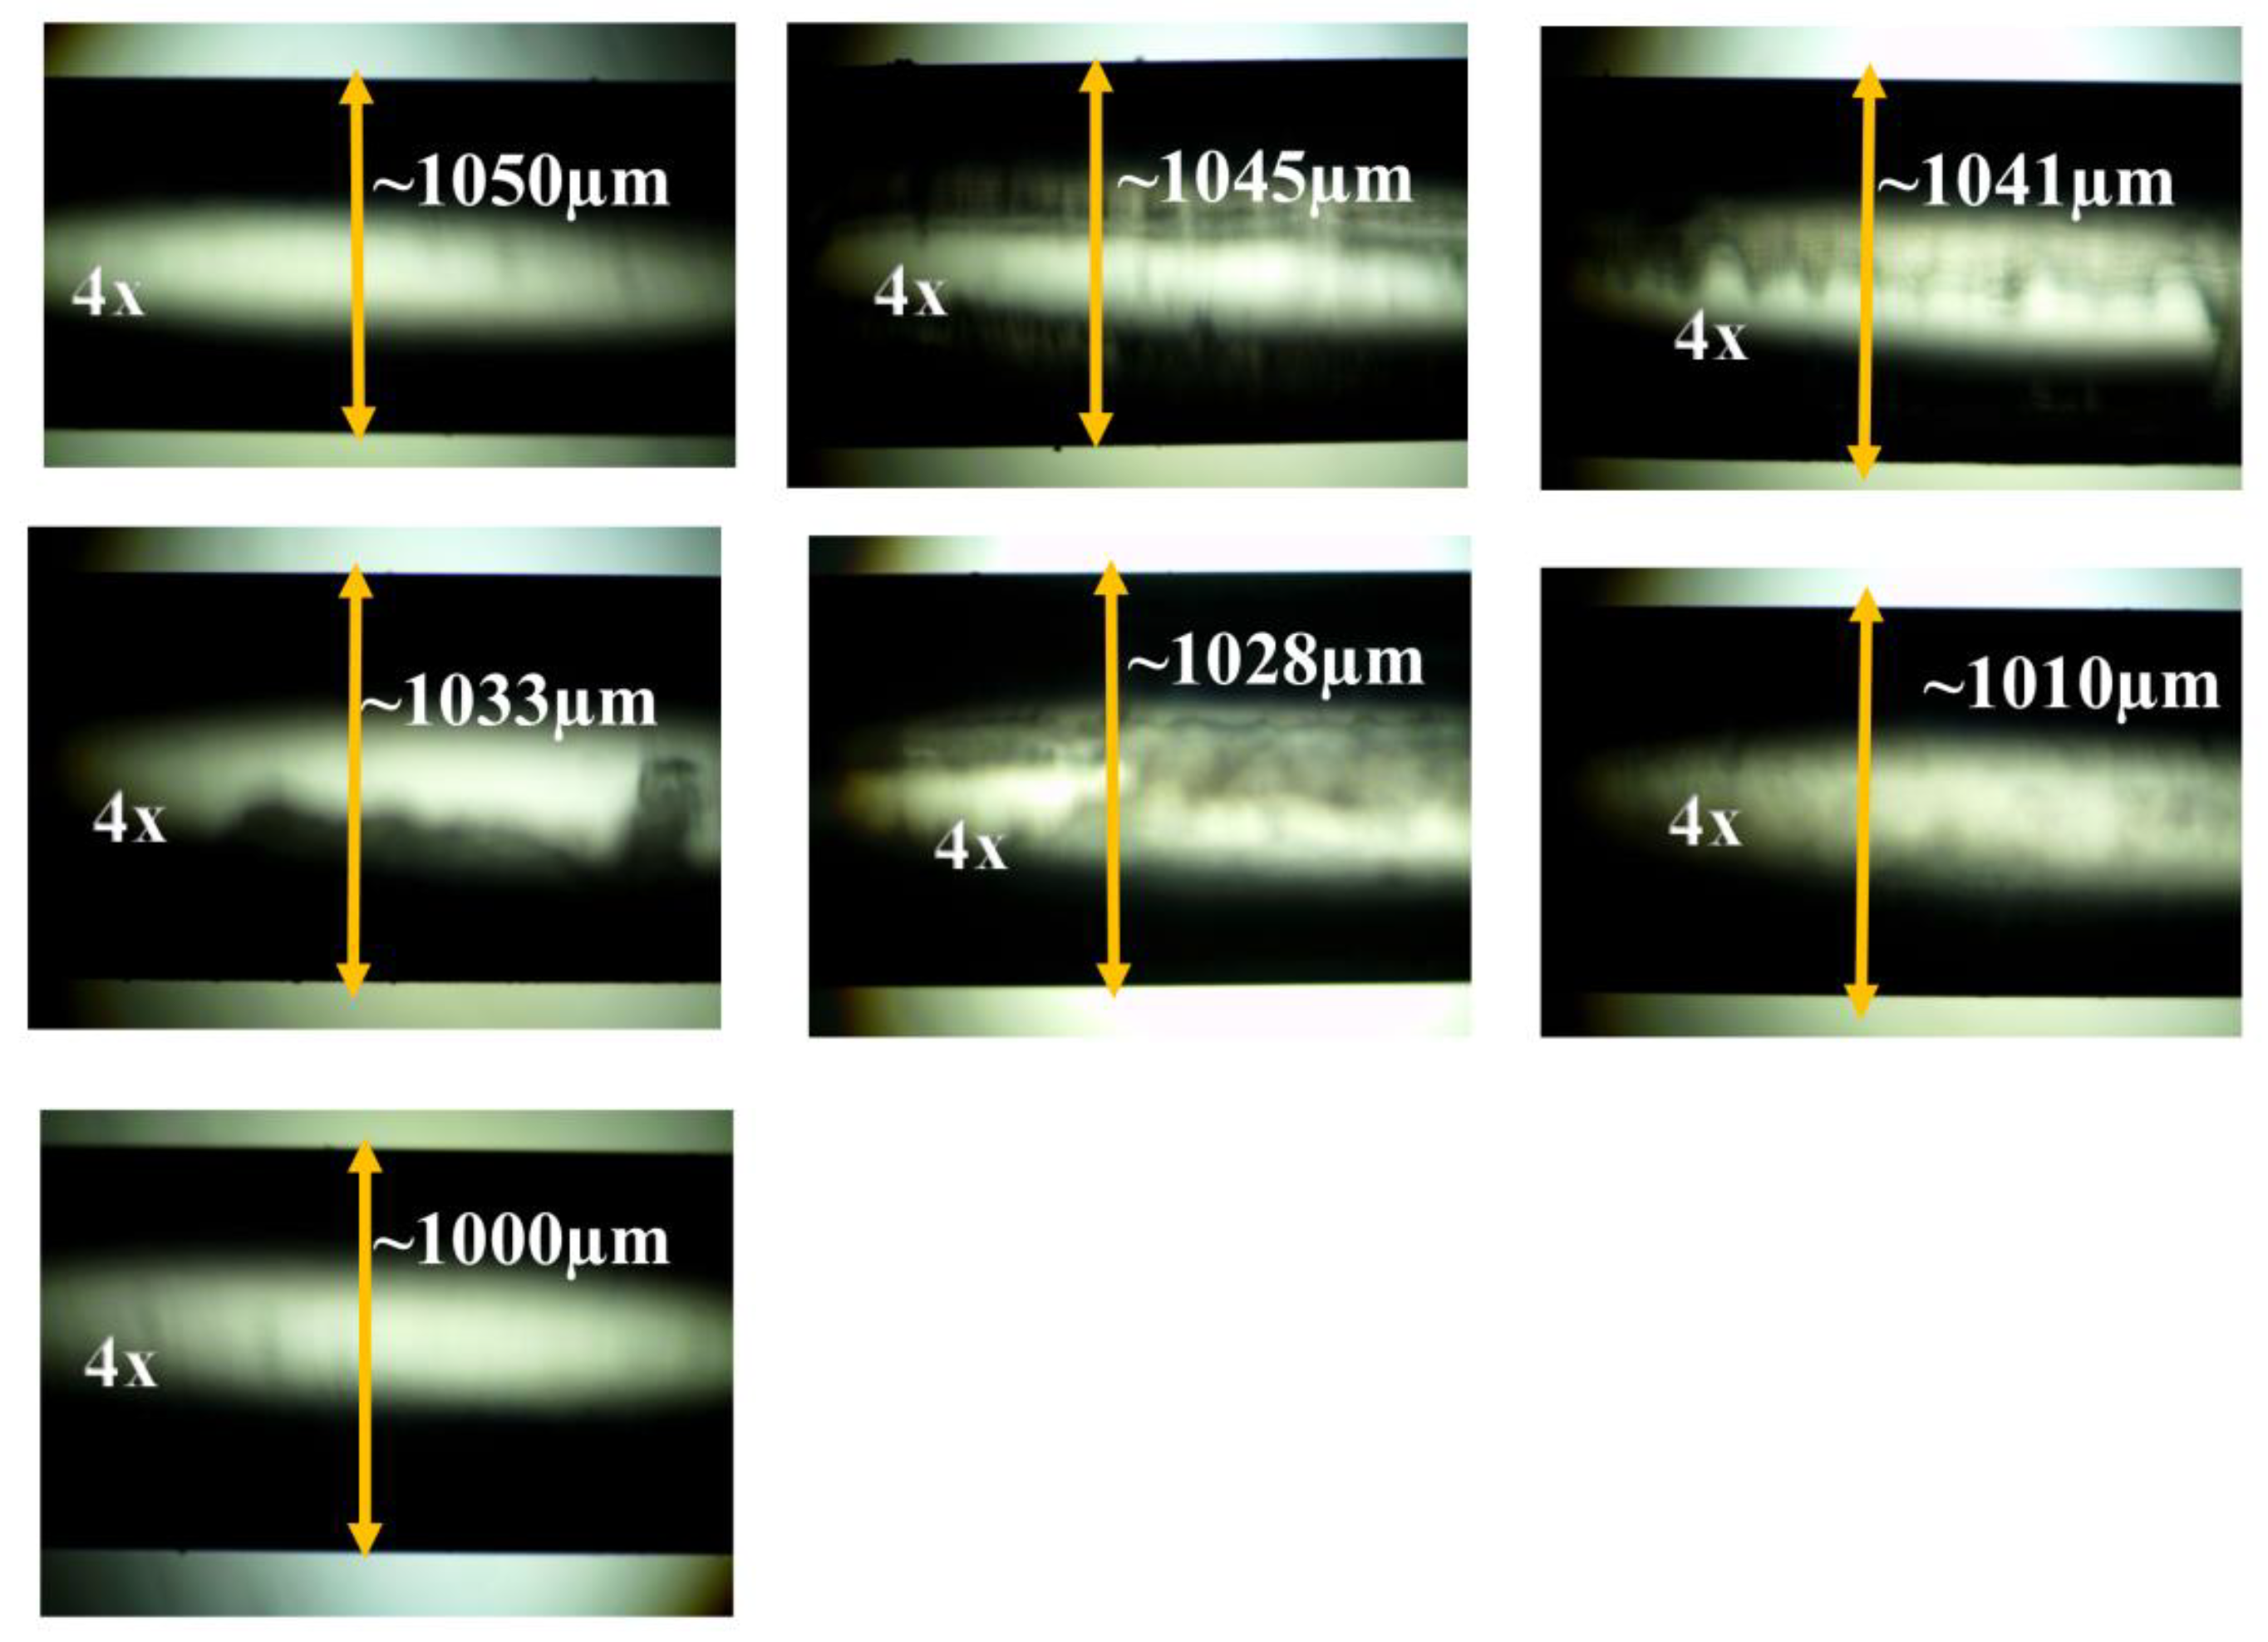
2. Preparation of Sensor Probes
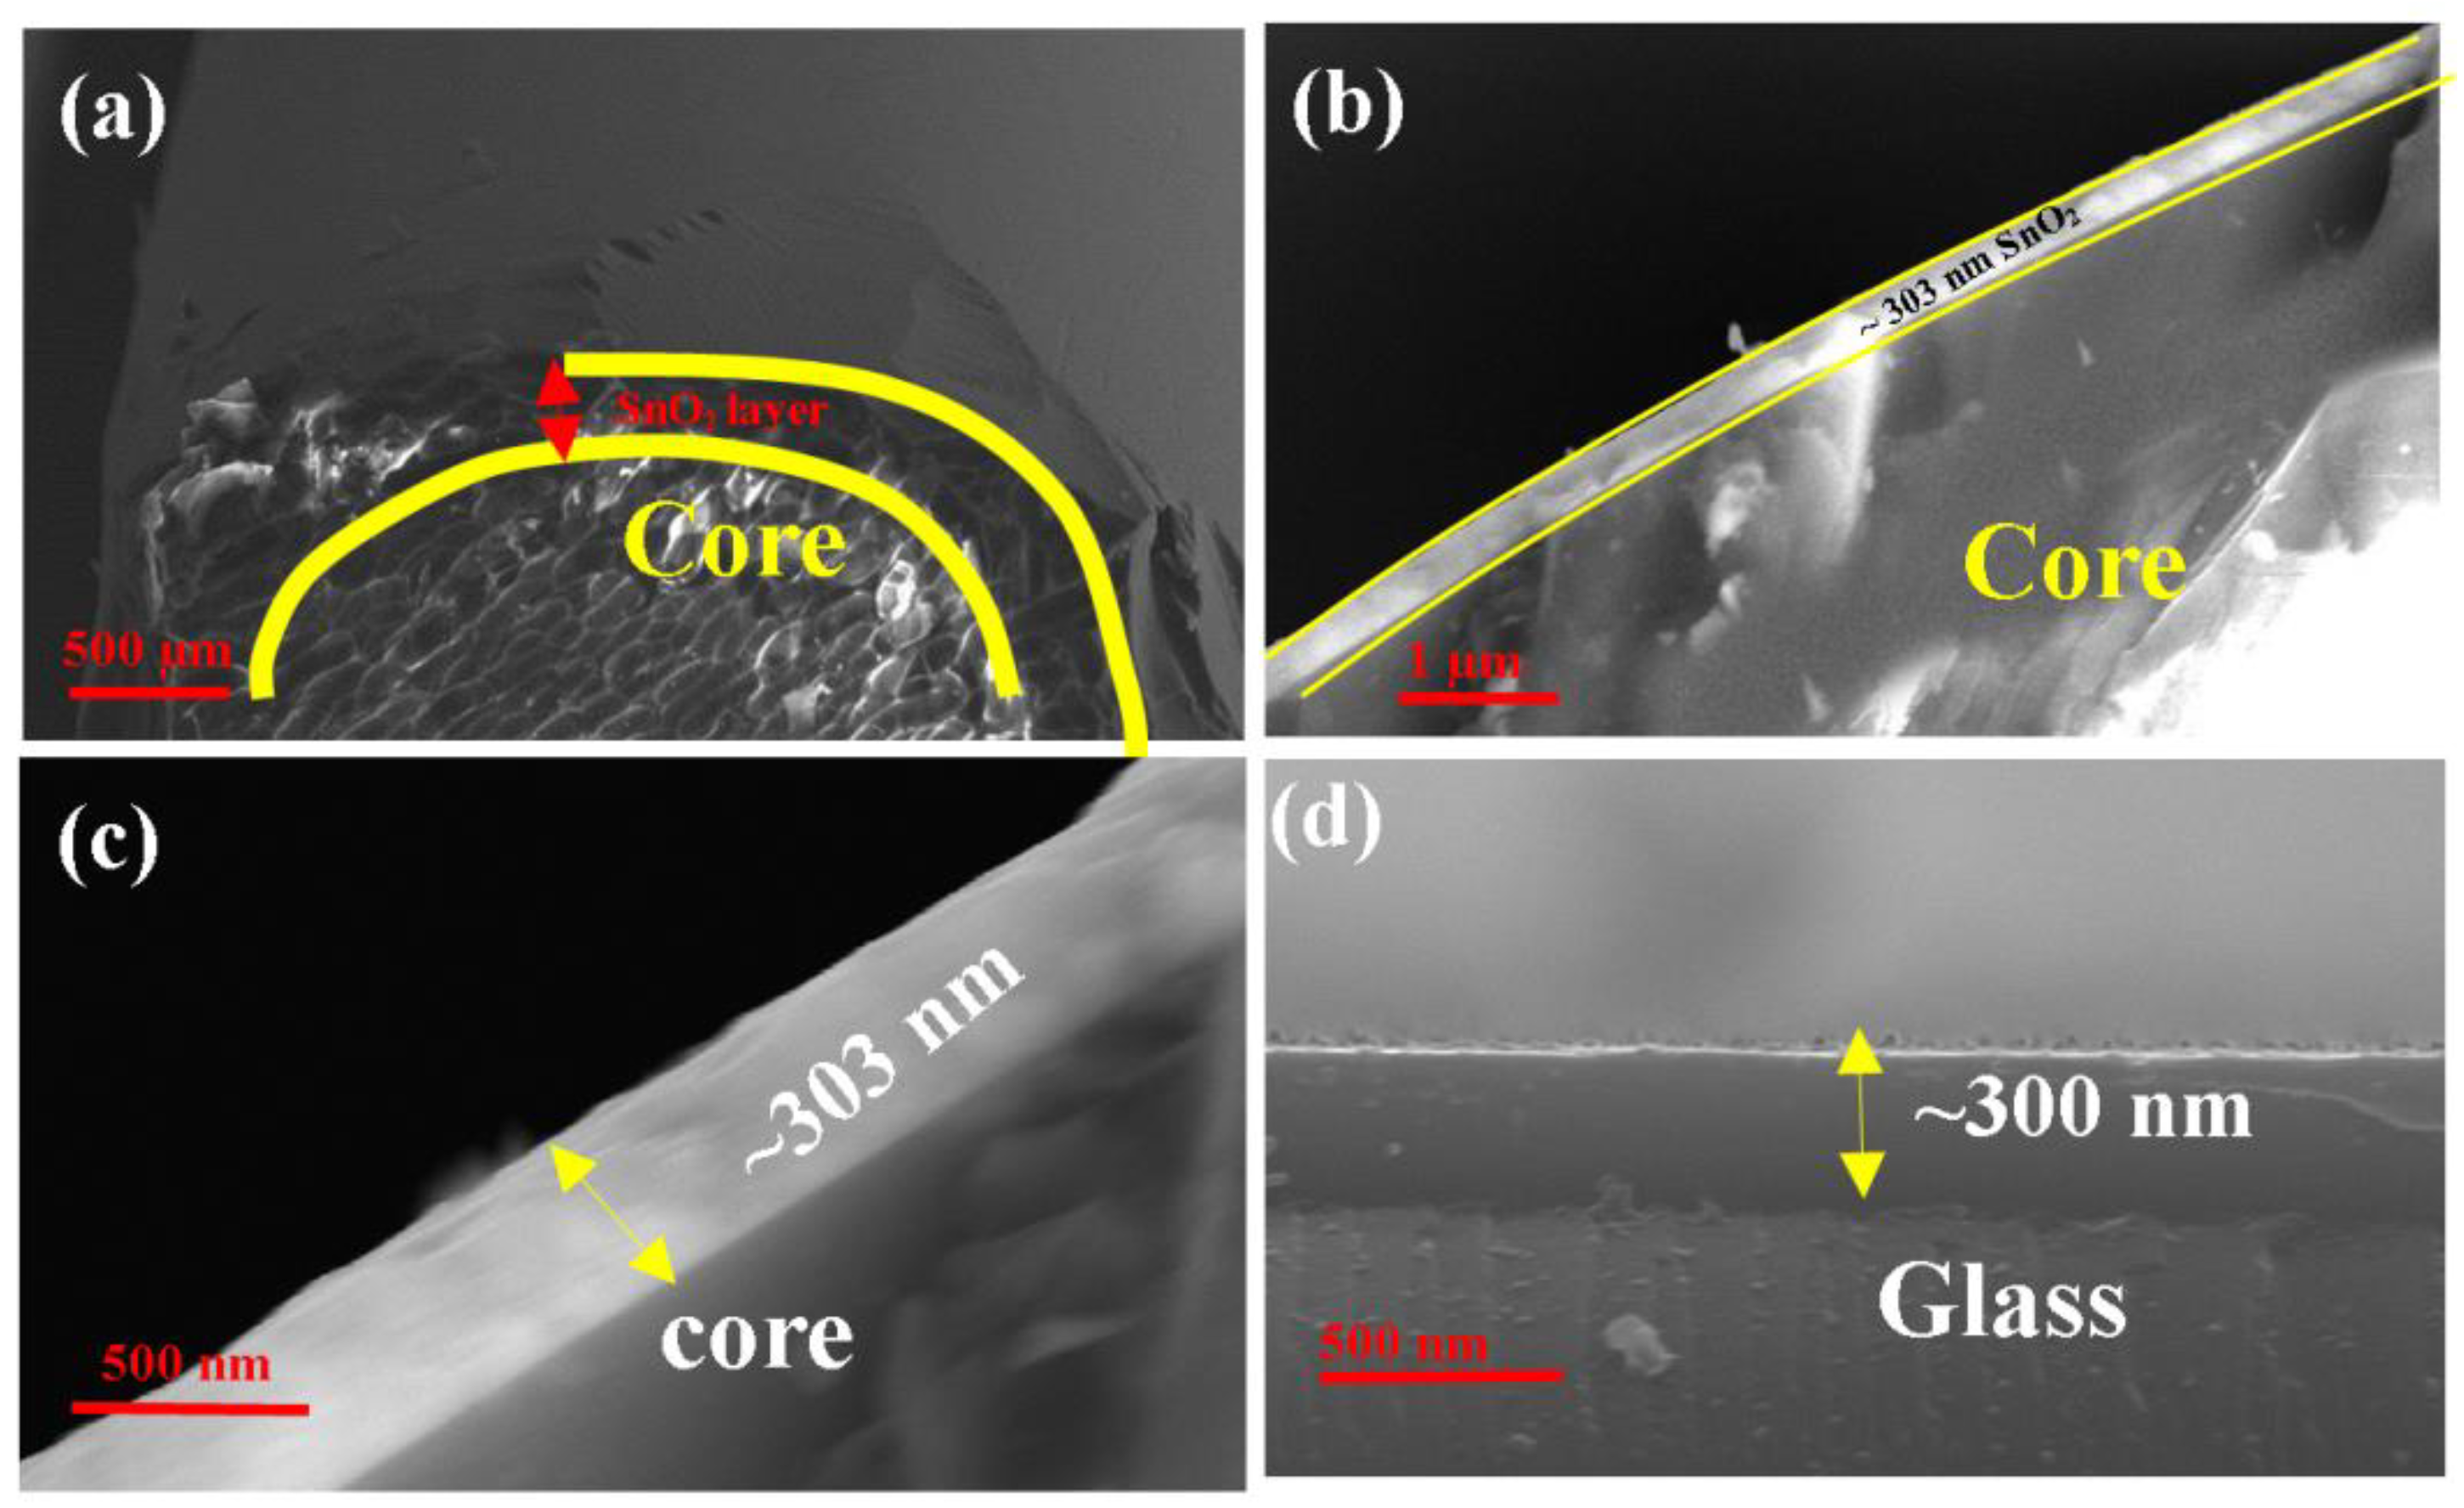
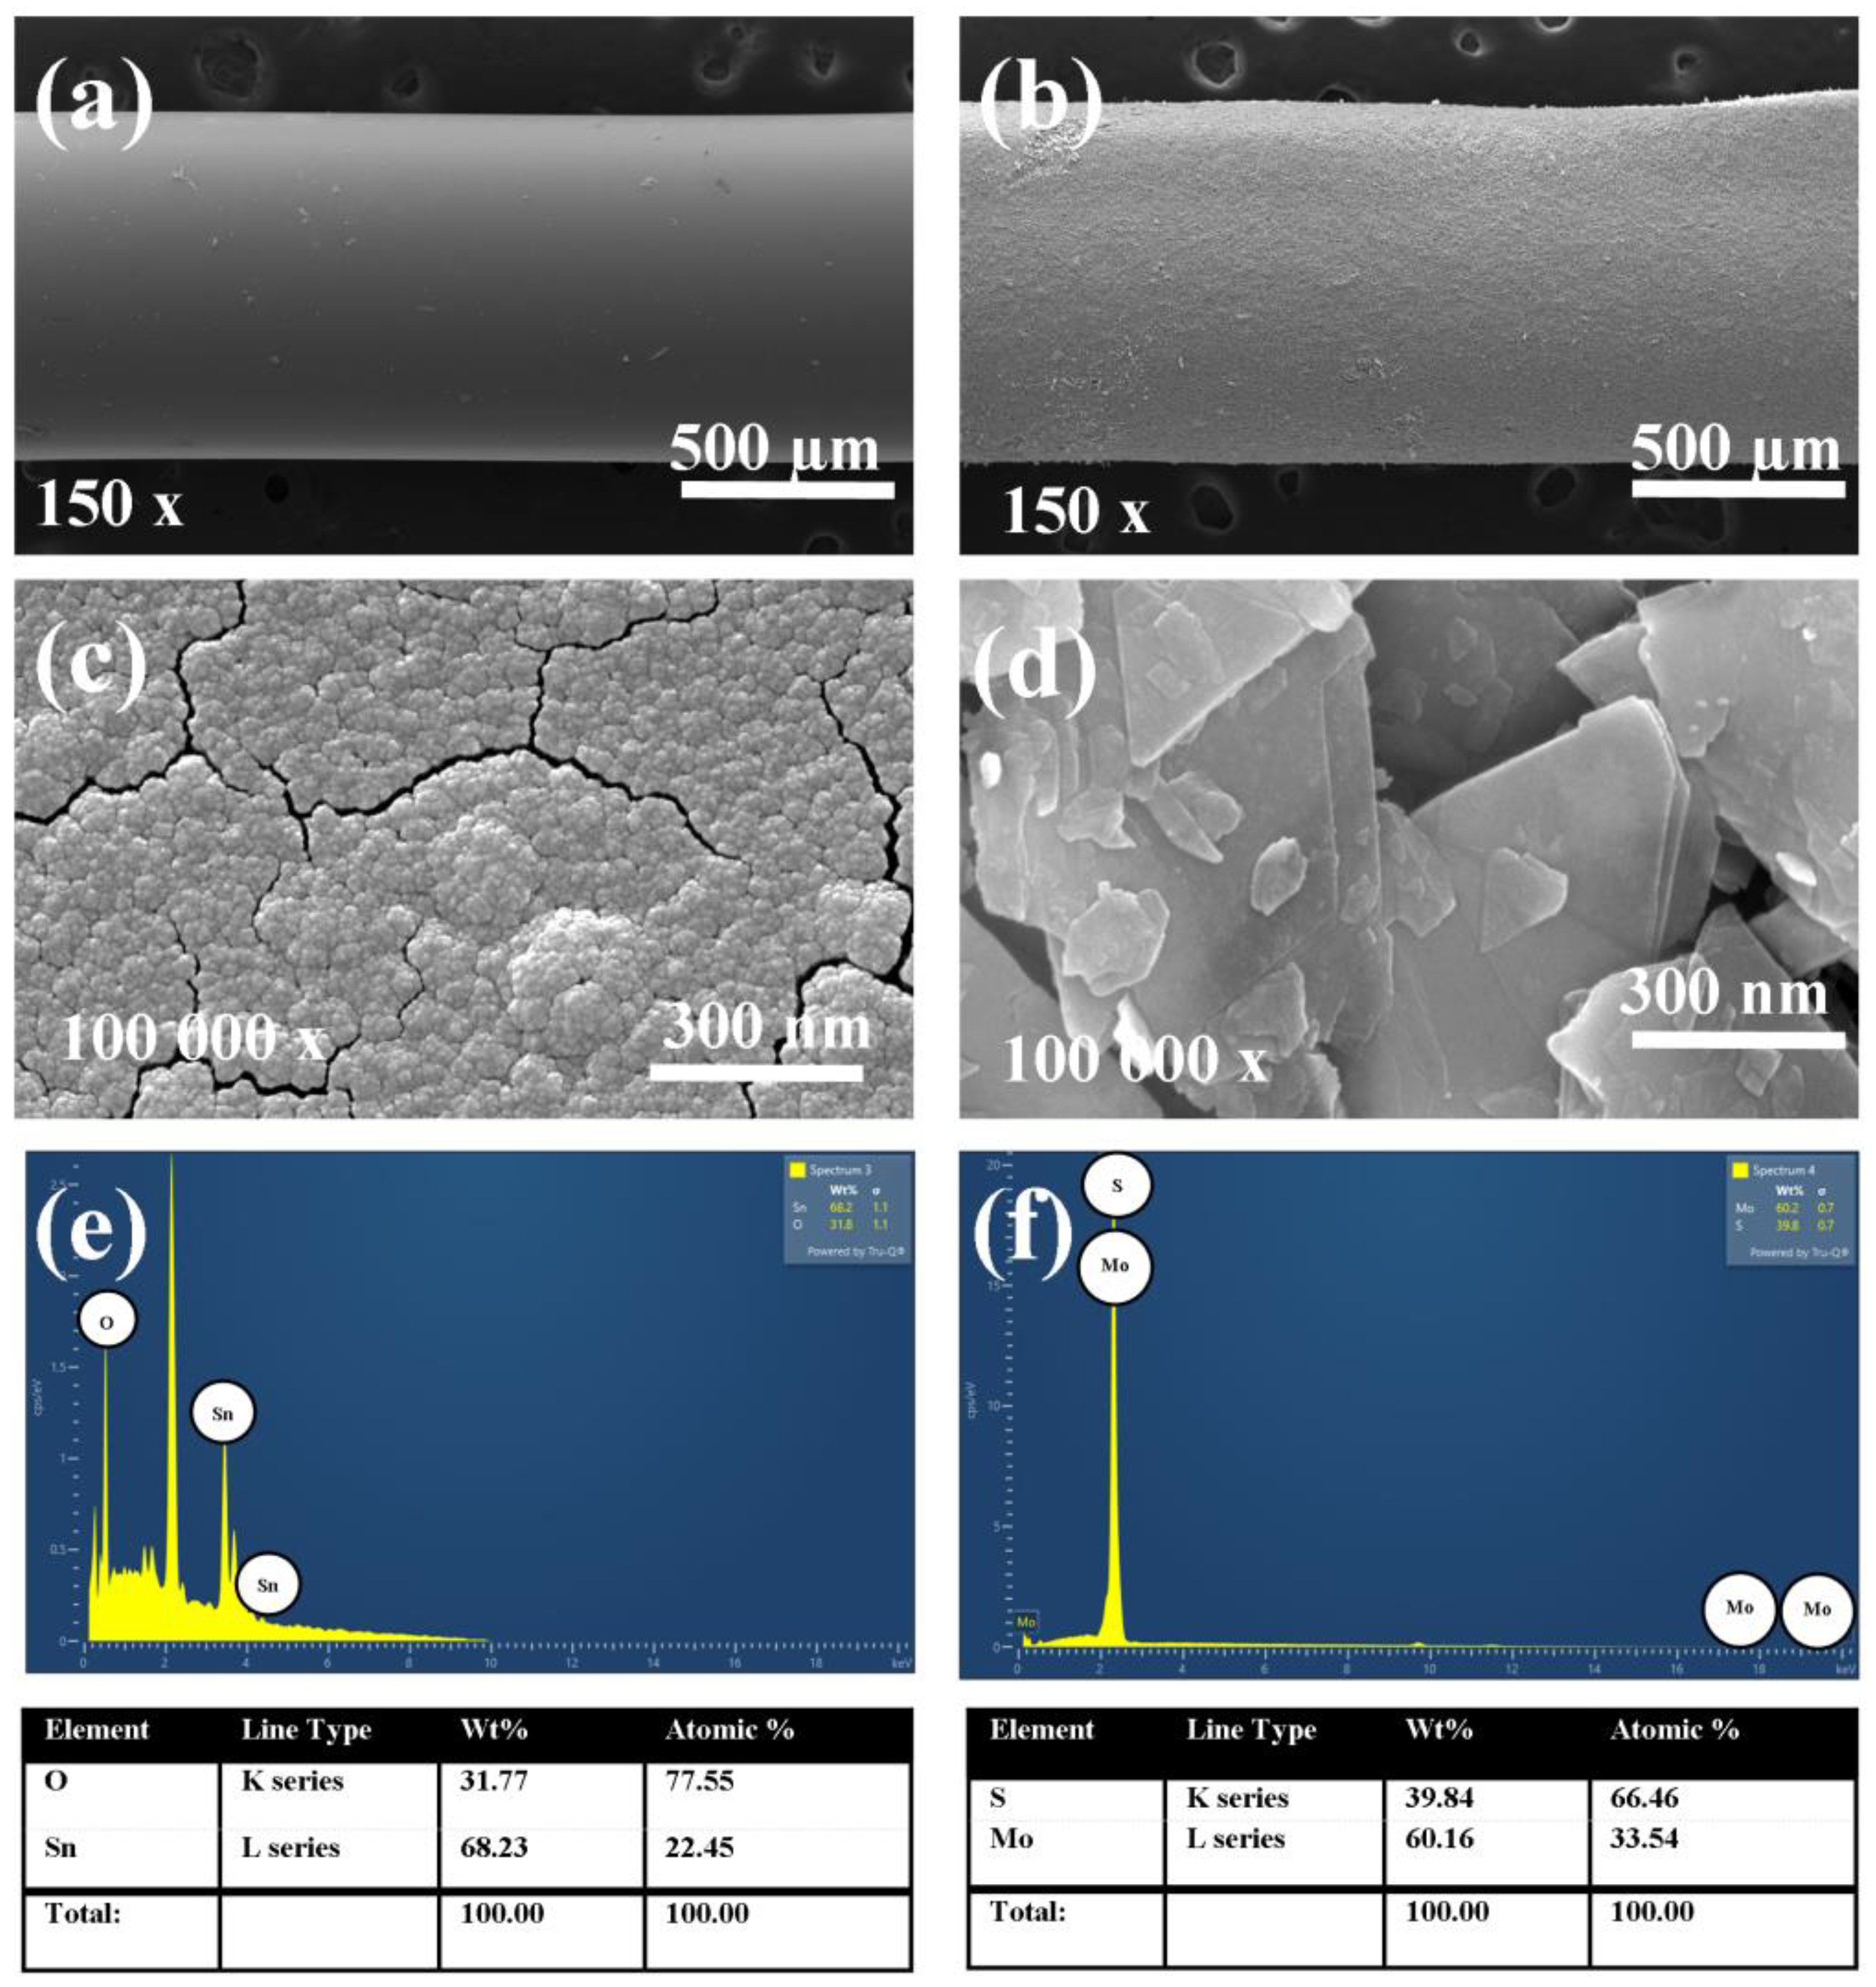
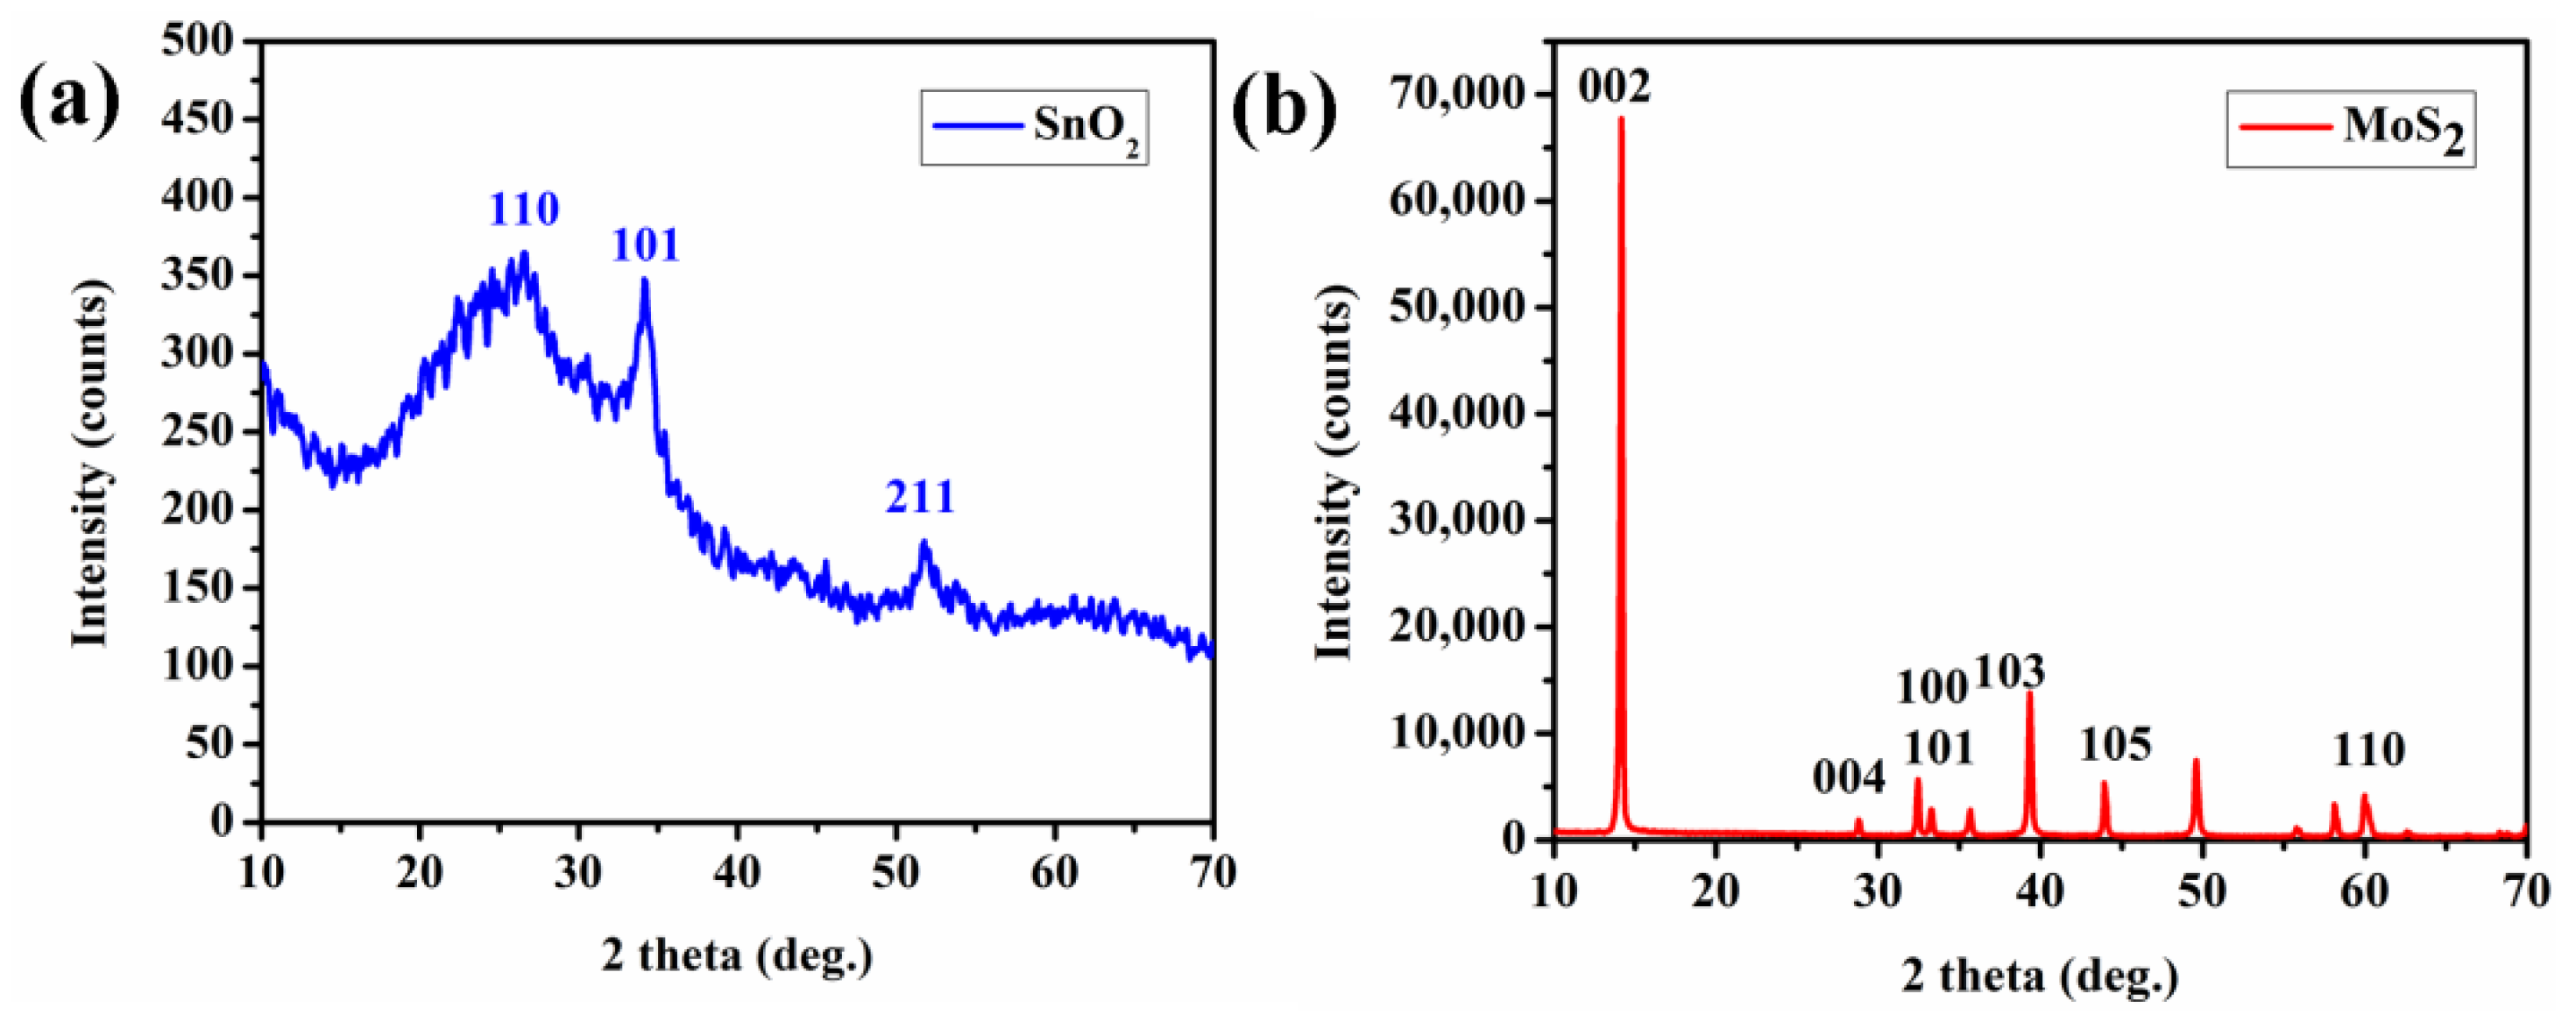
3. Structural Properties of SnO2 and MoS2Layer
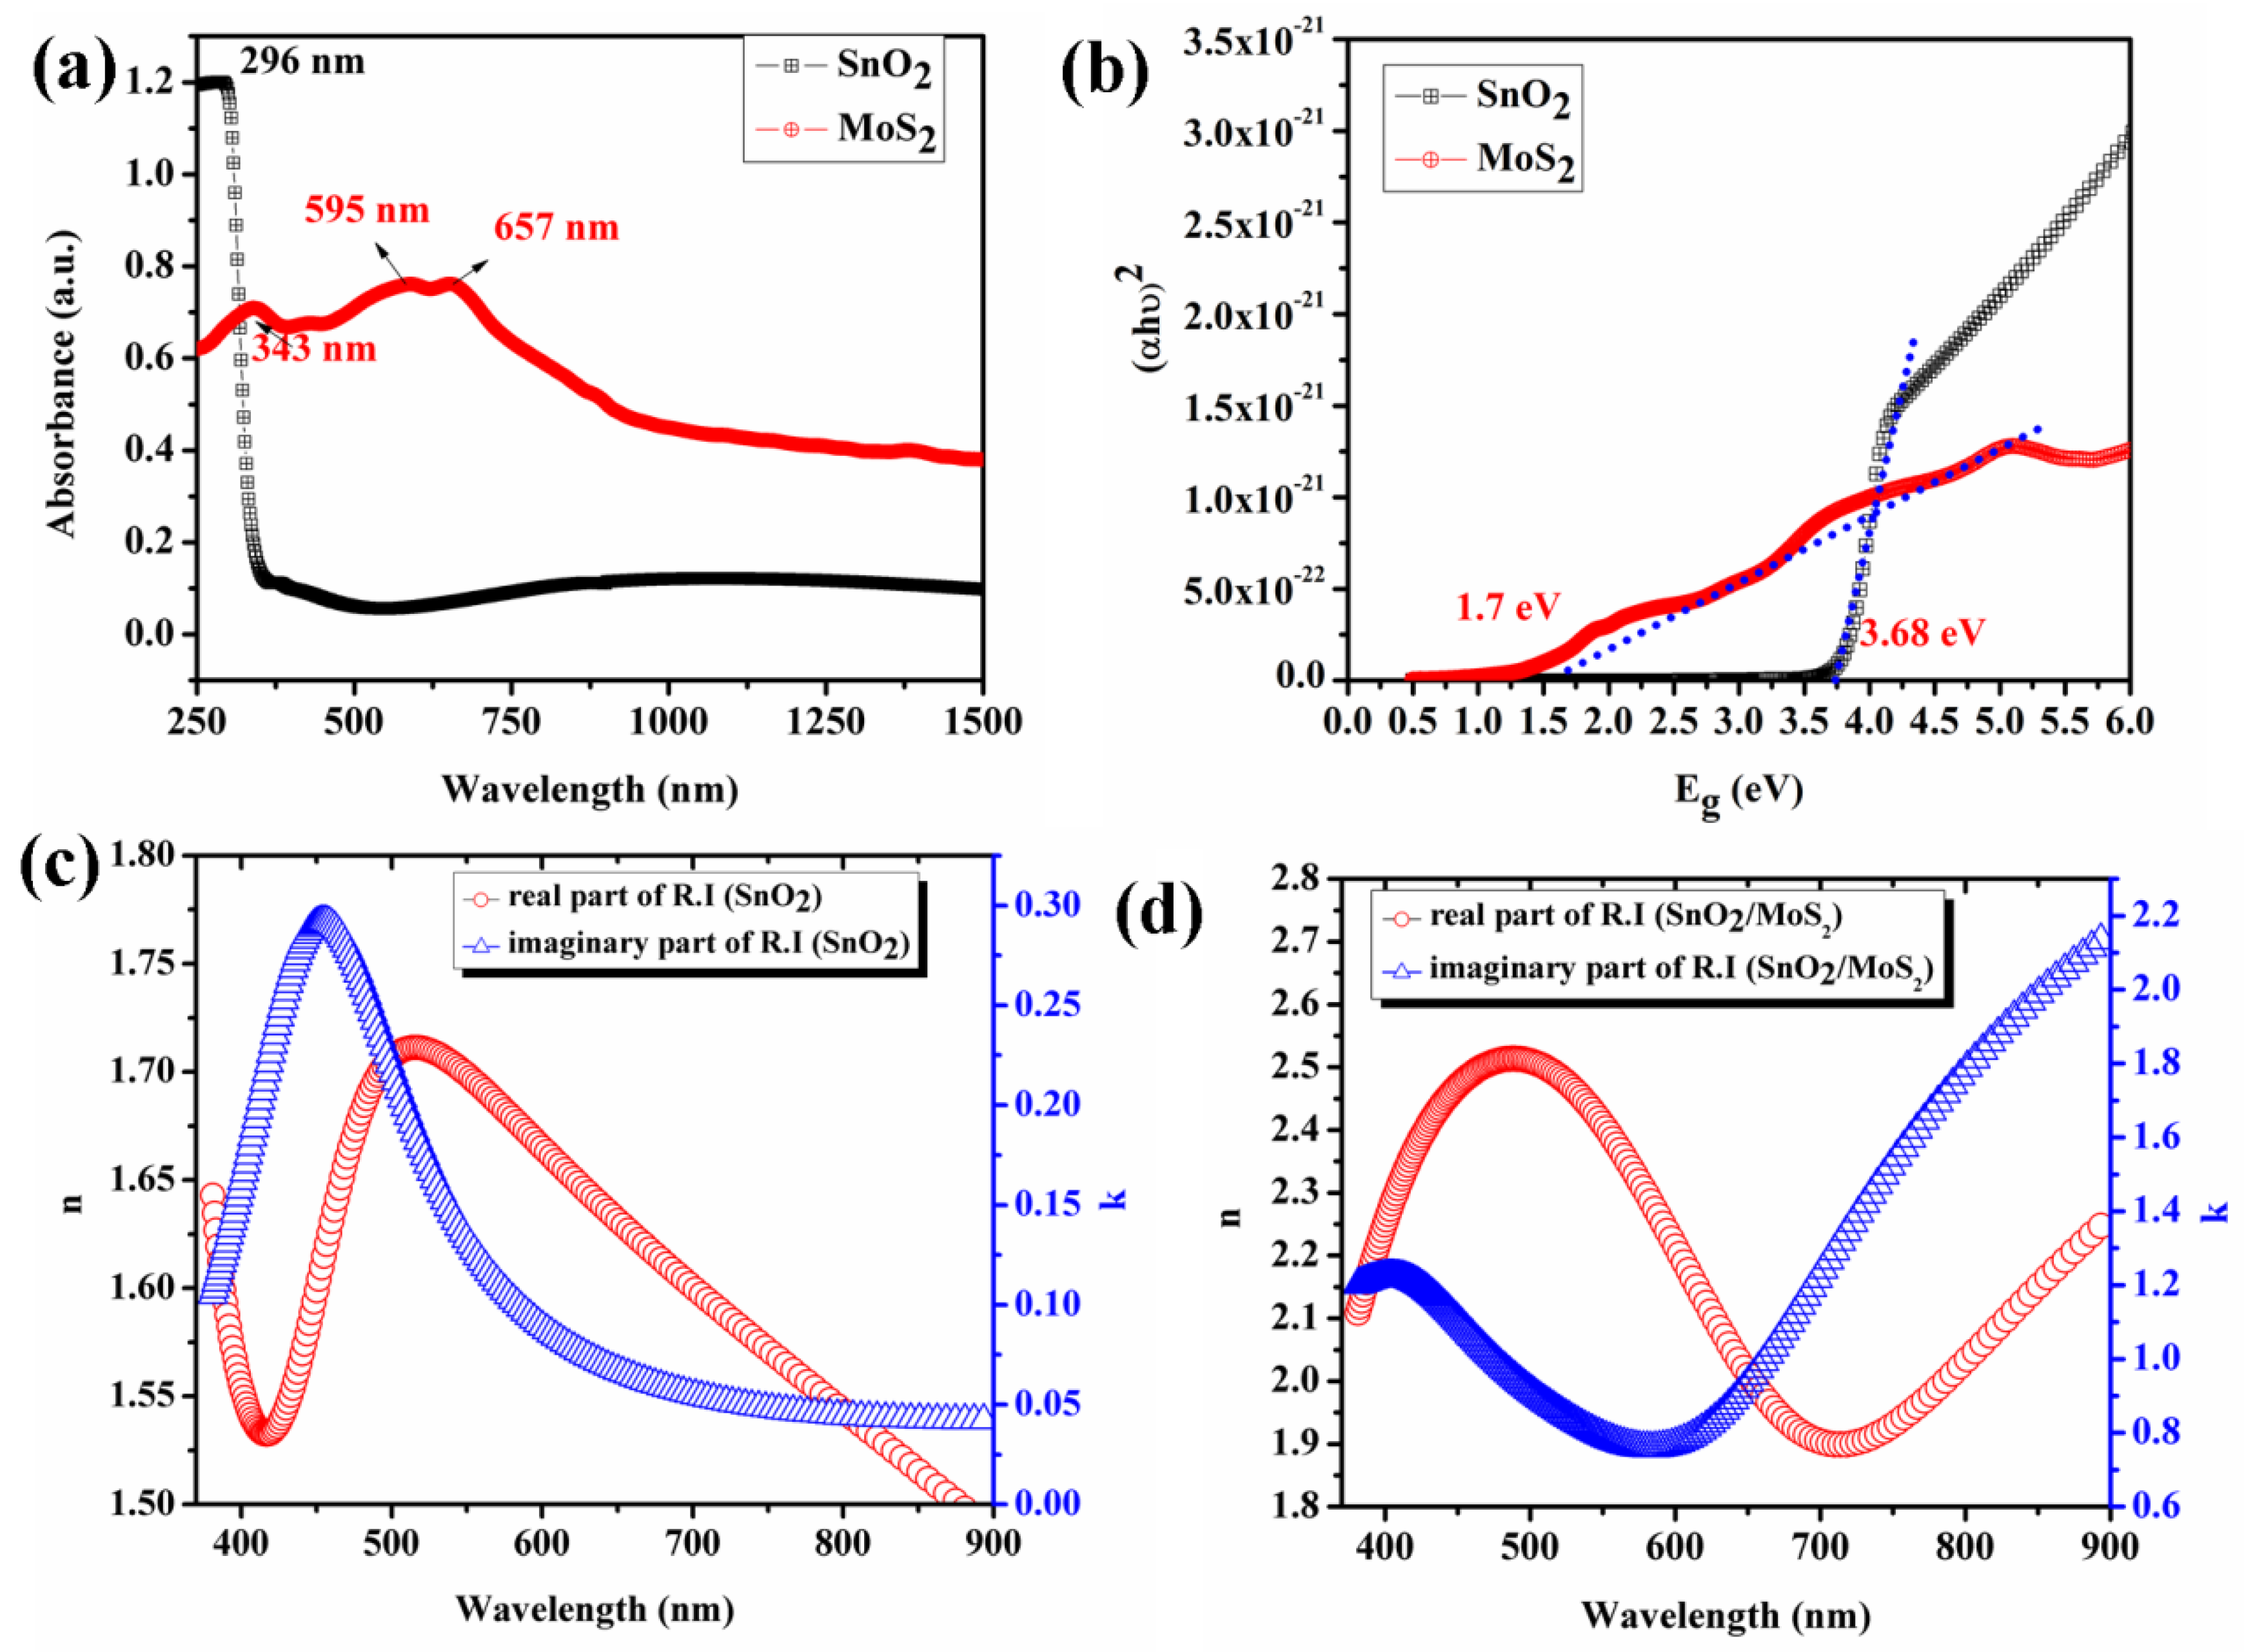
4. Optical Properties of SnO2 and MoS2Layer
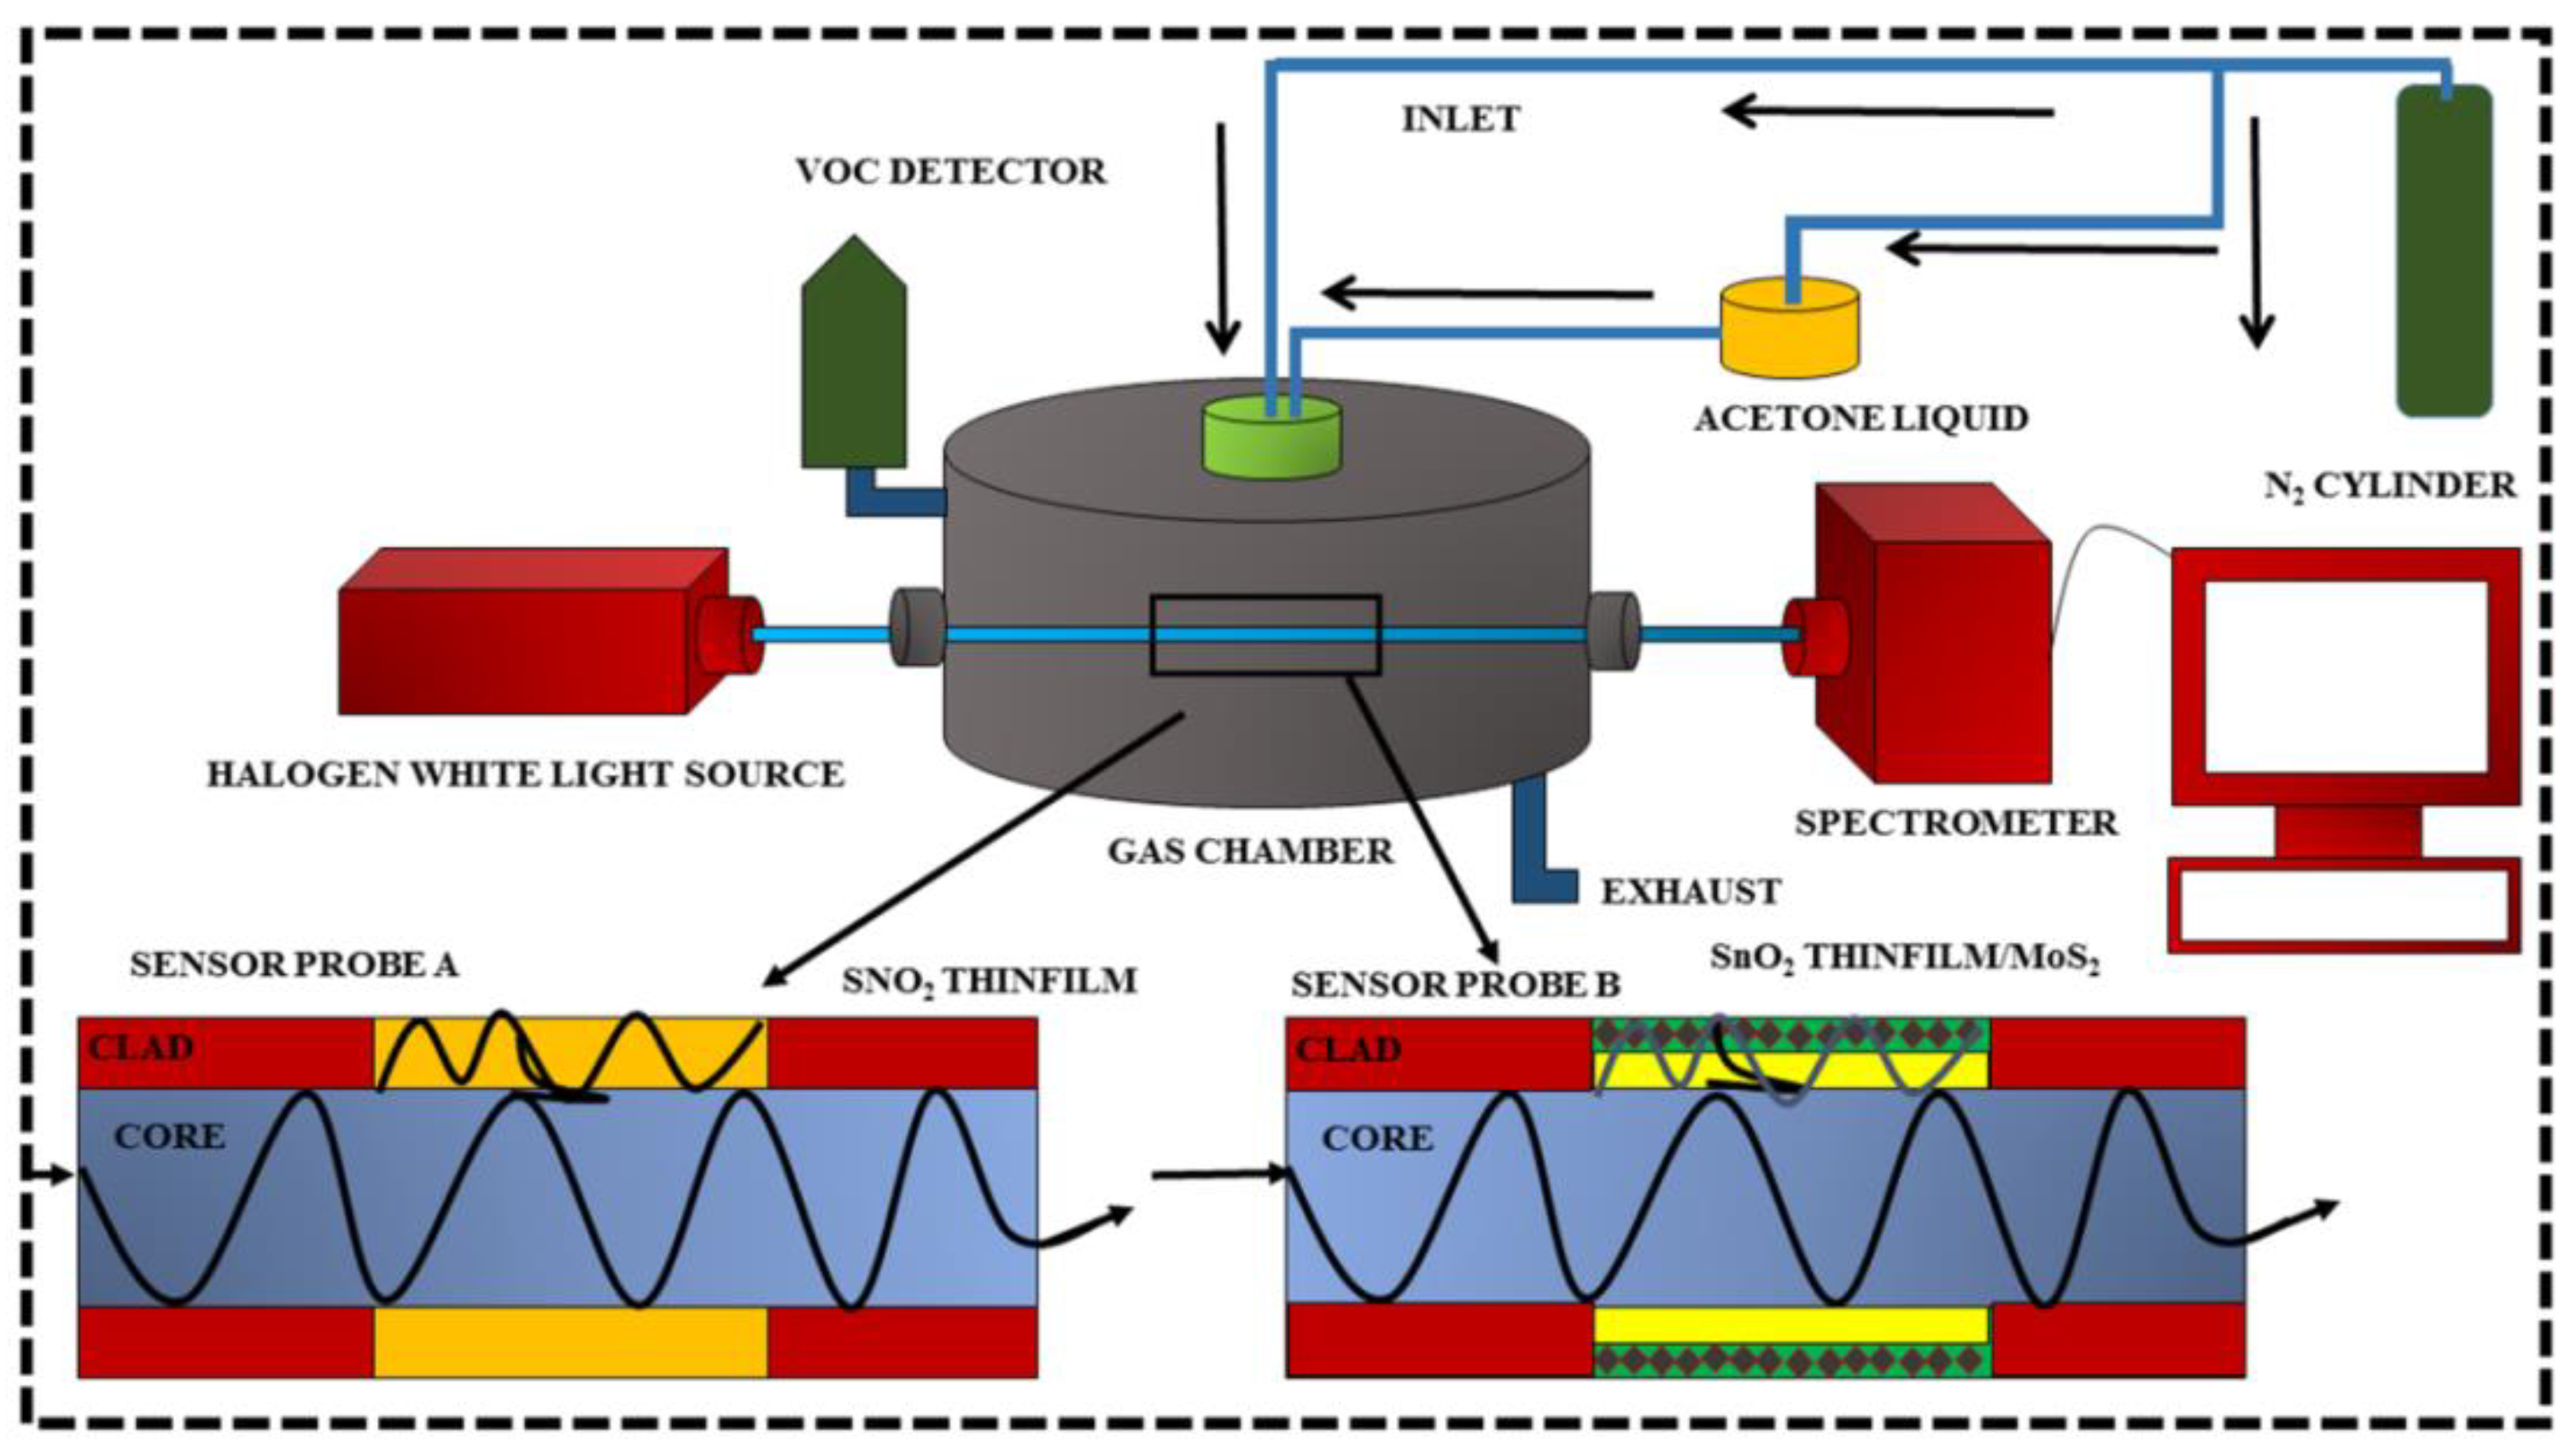
5. Experimental Setup
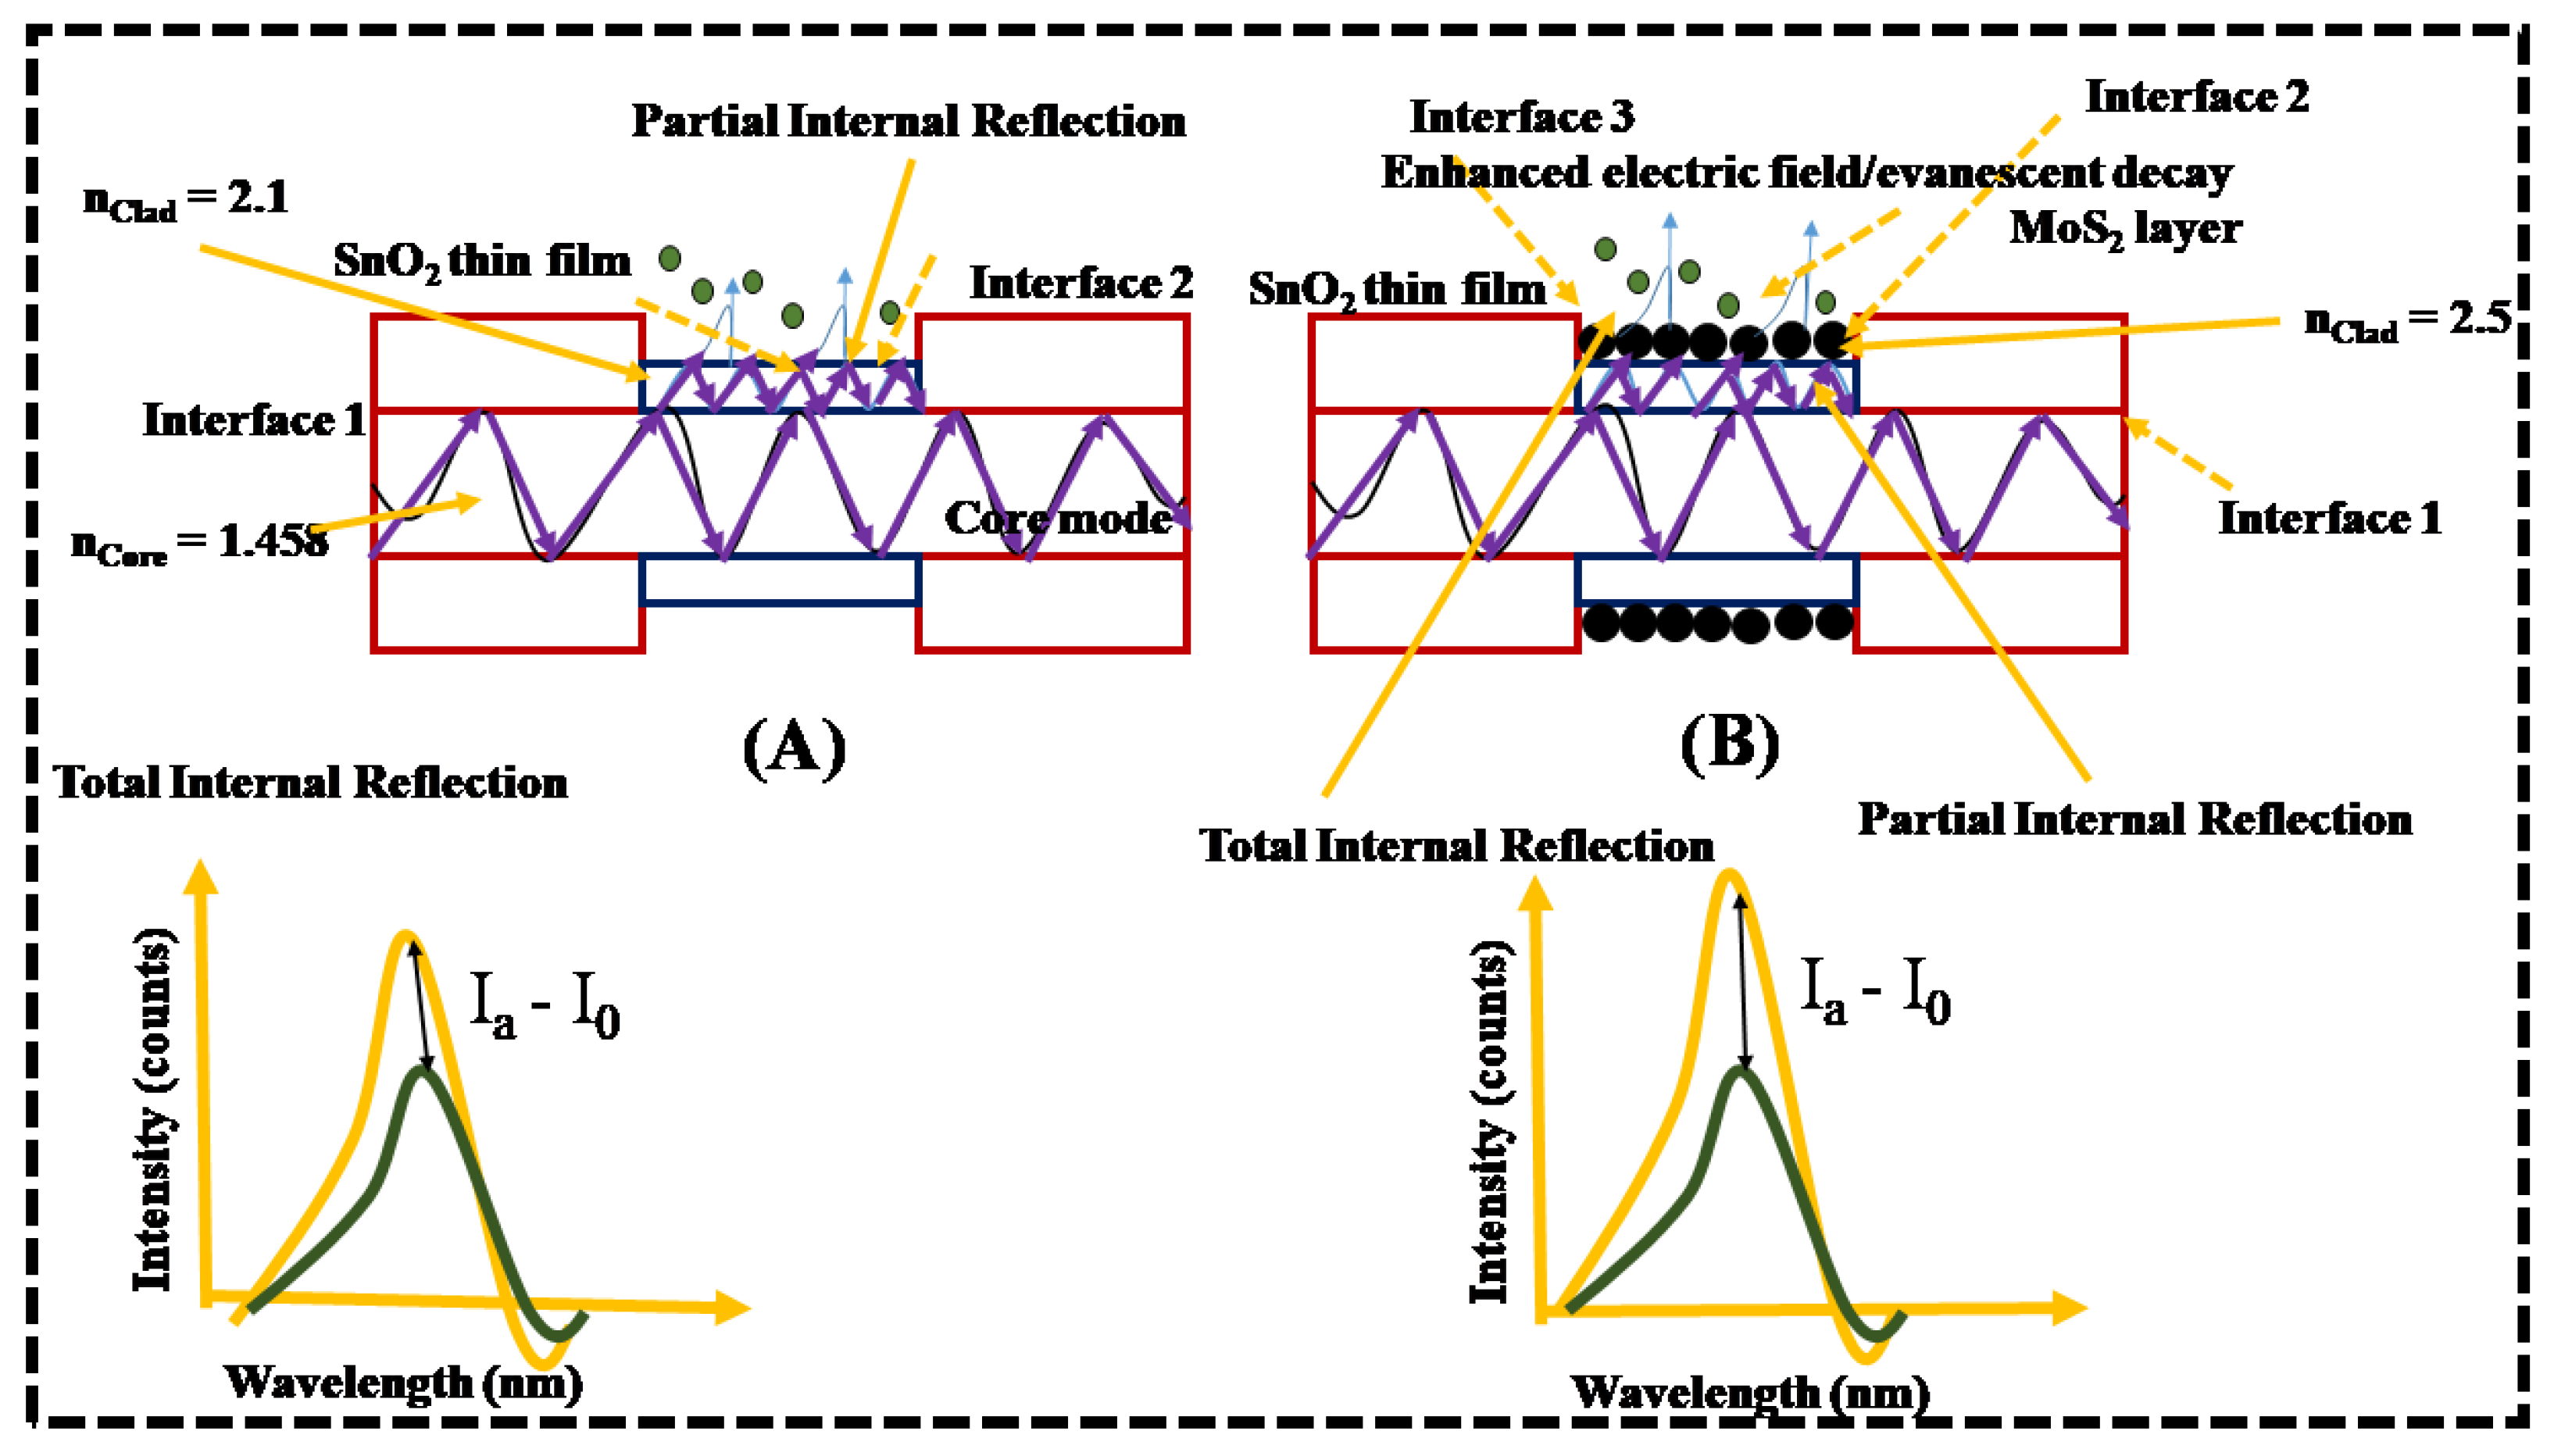
Acetone Sensing Mechanism
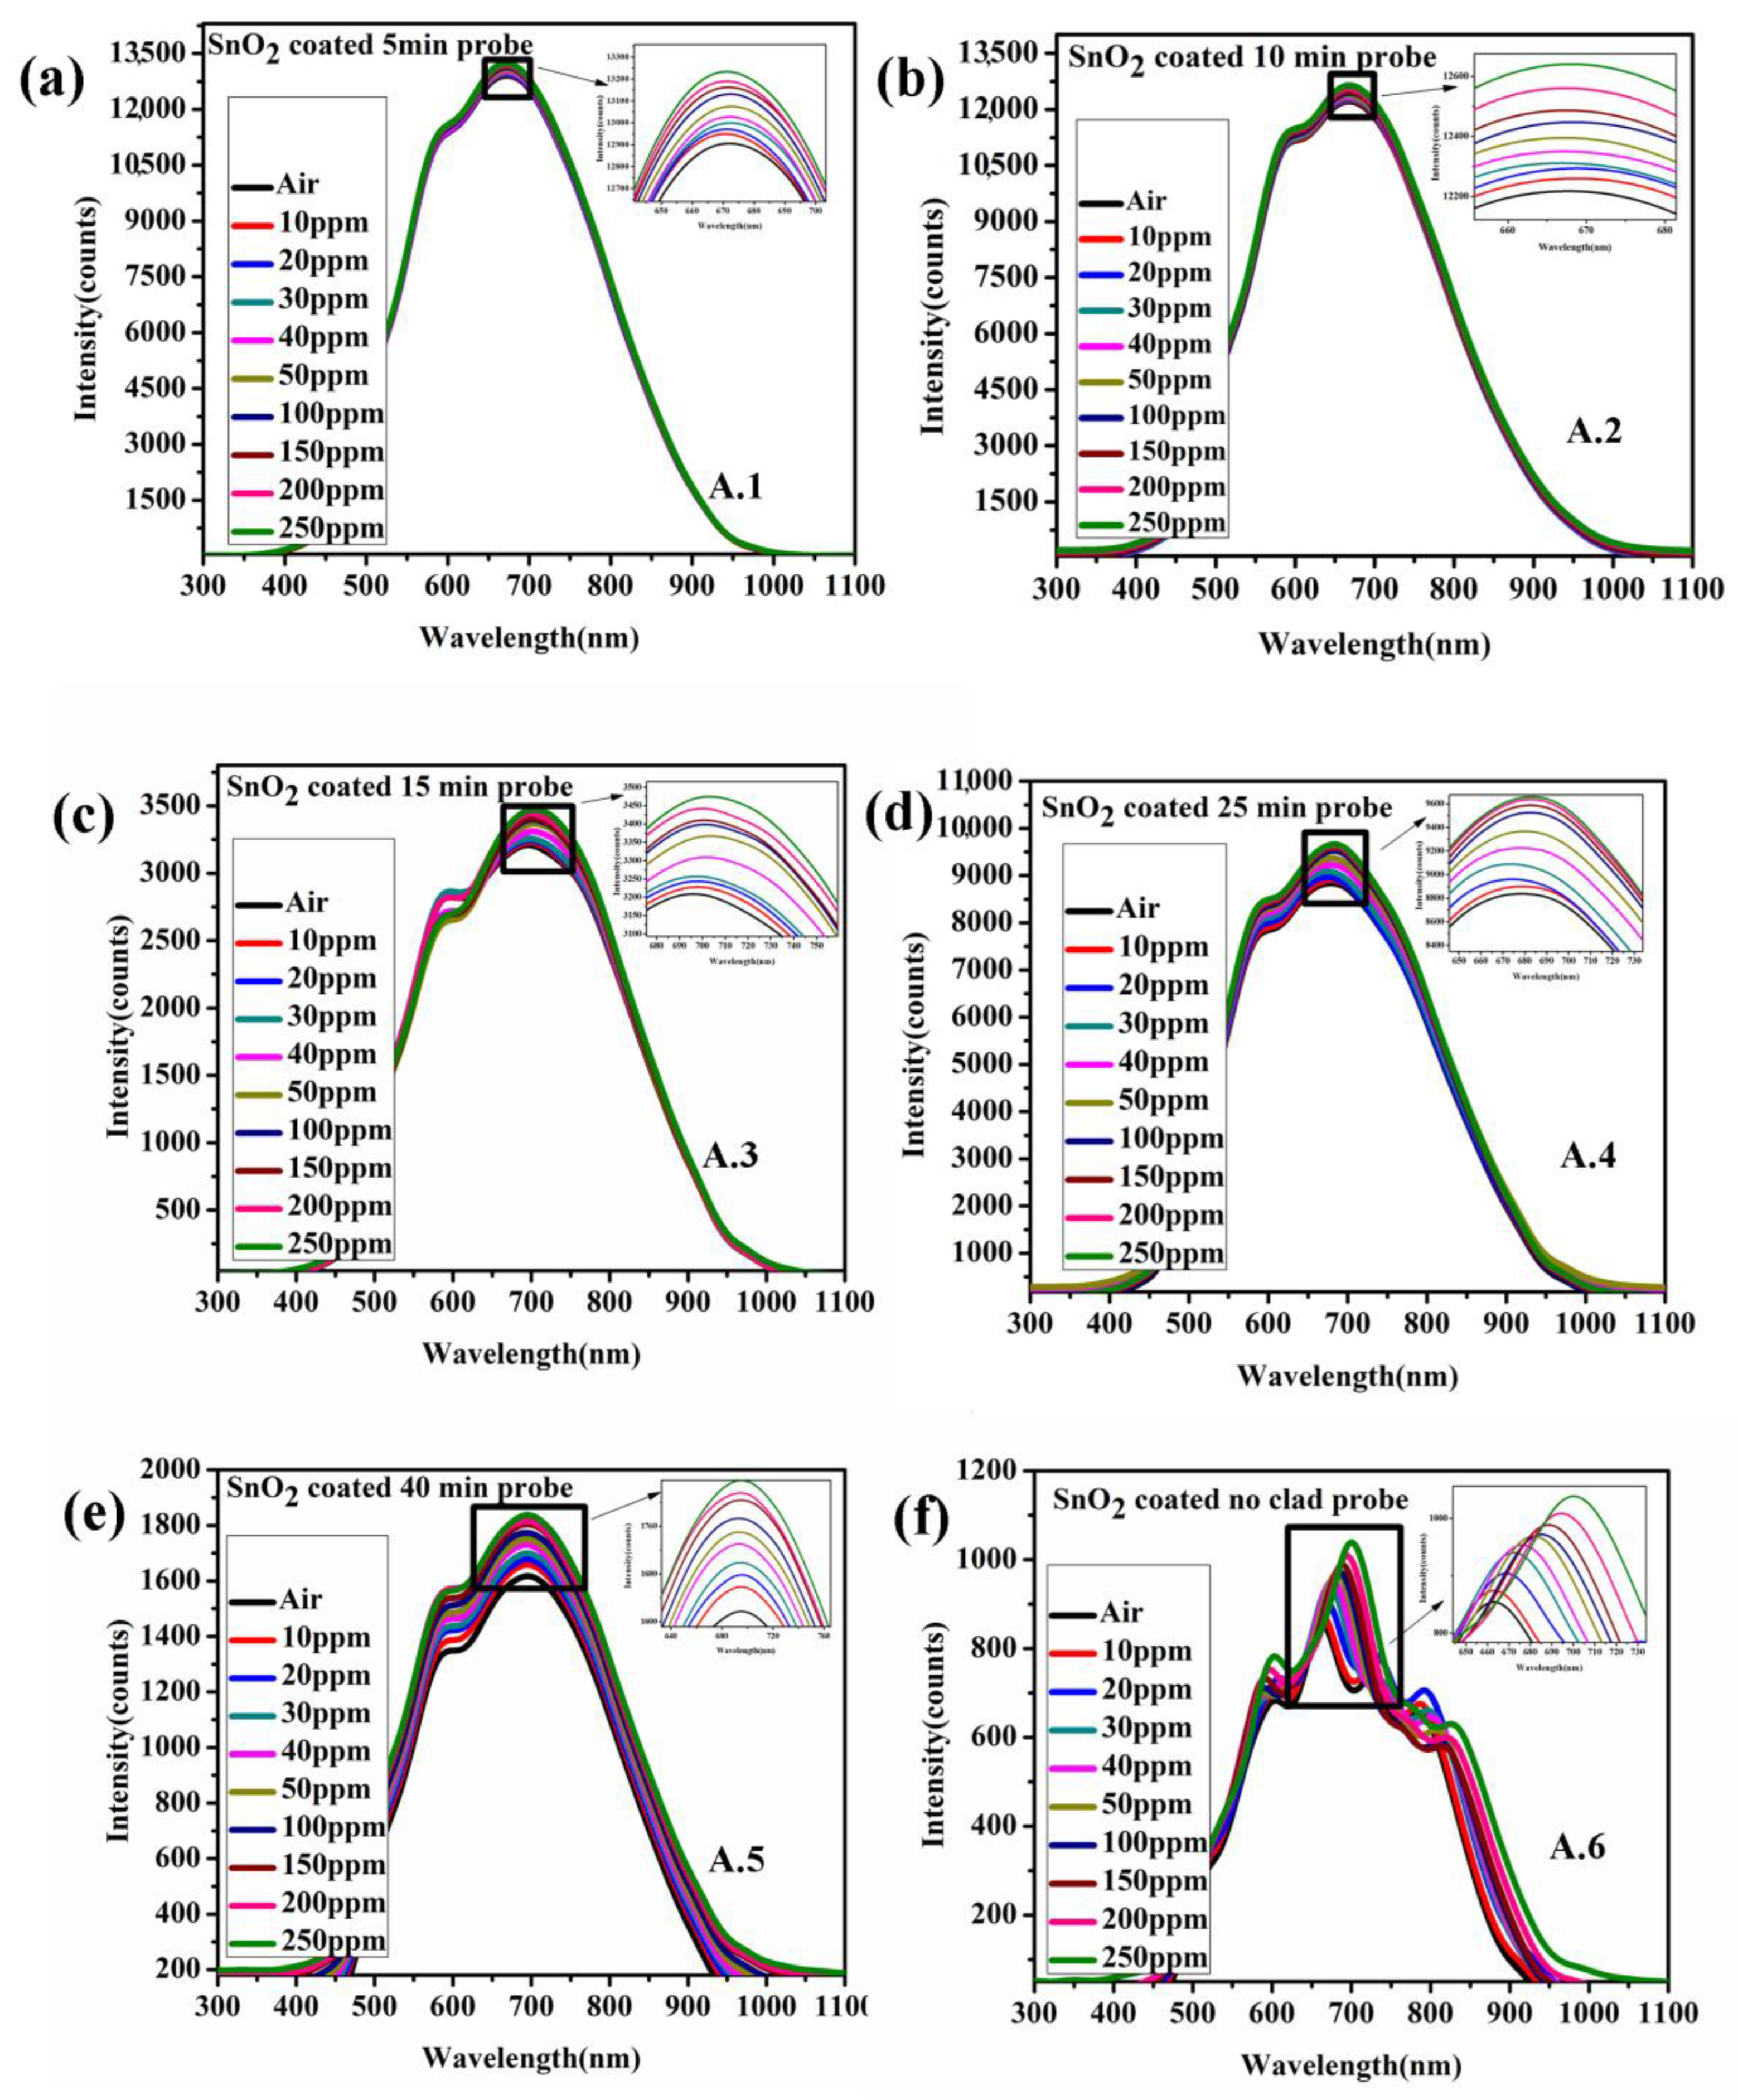
6. Sensor Response
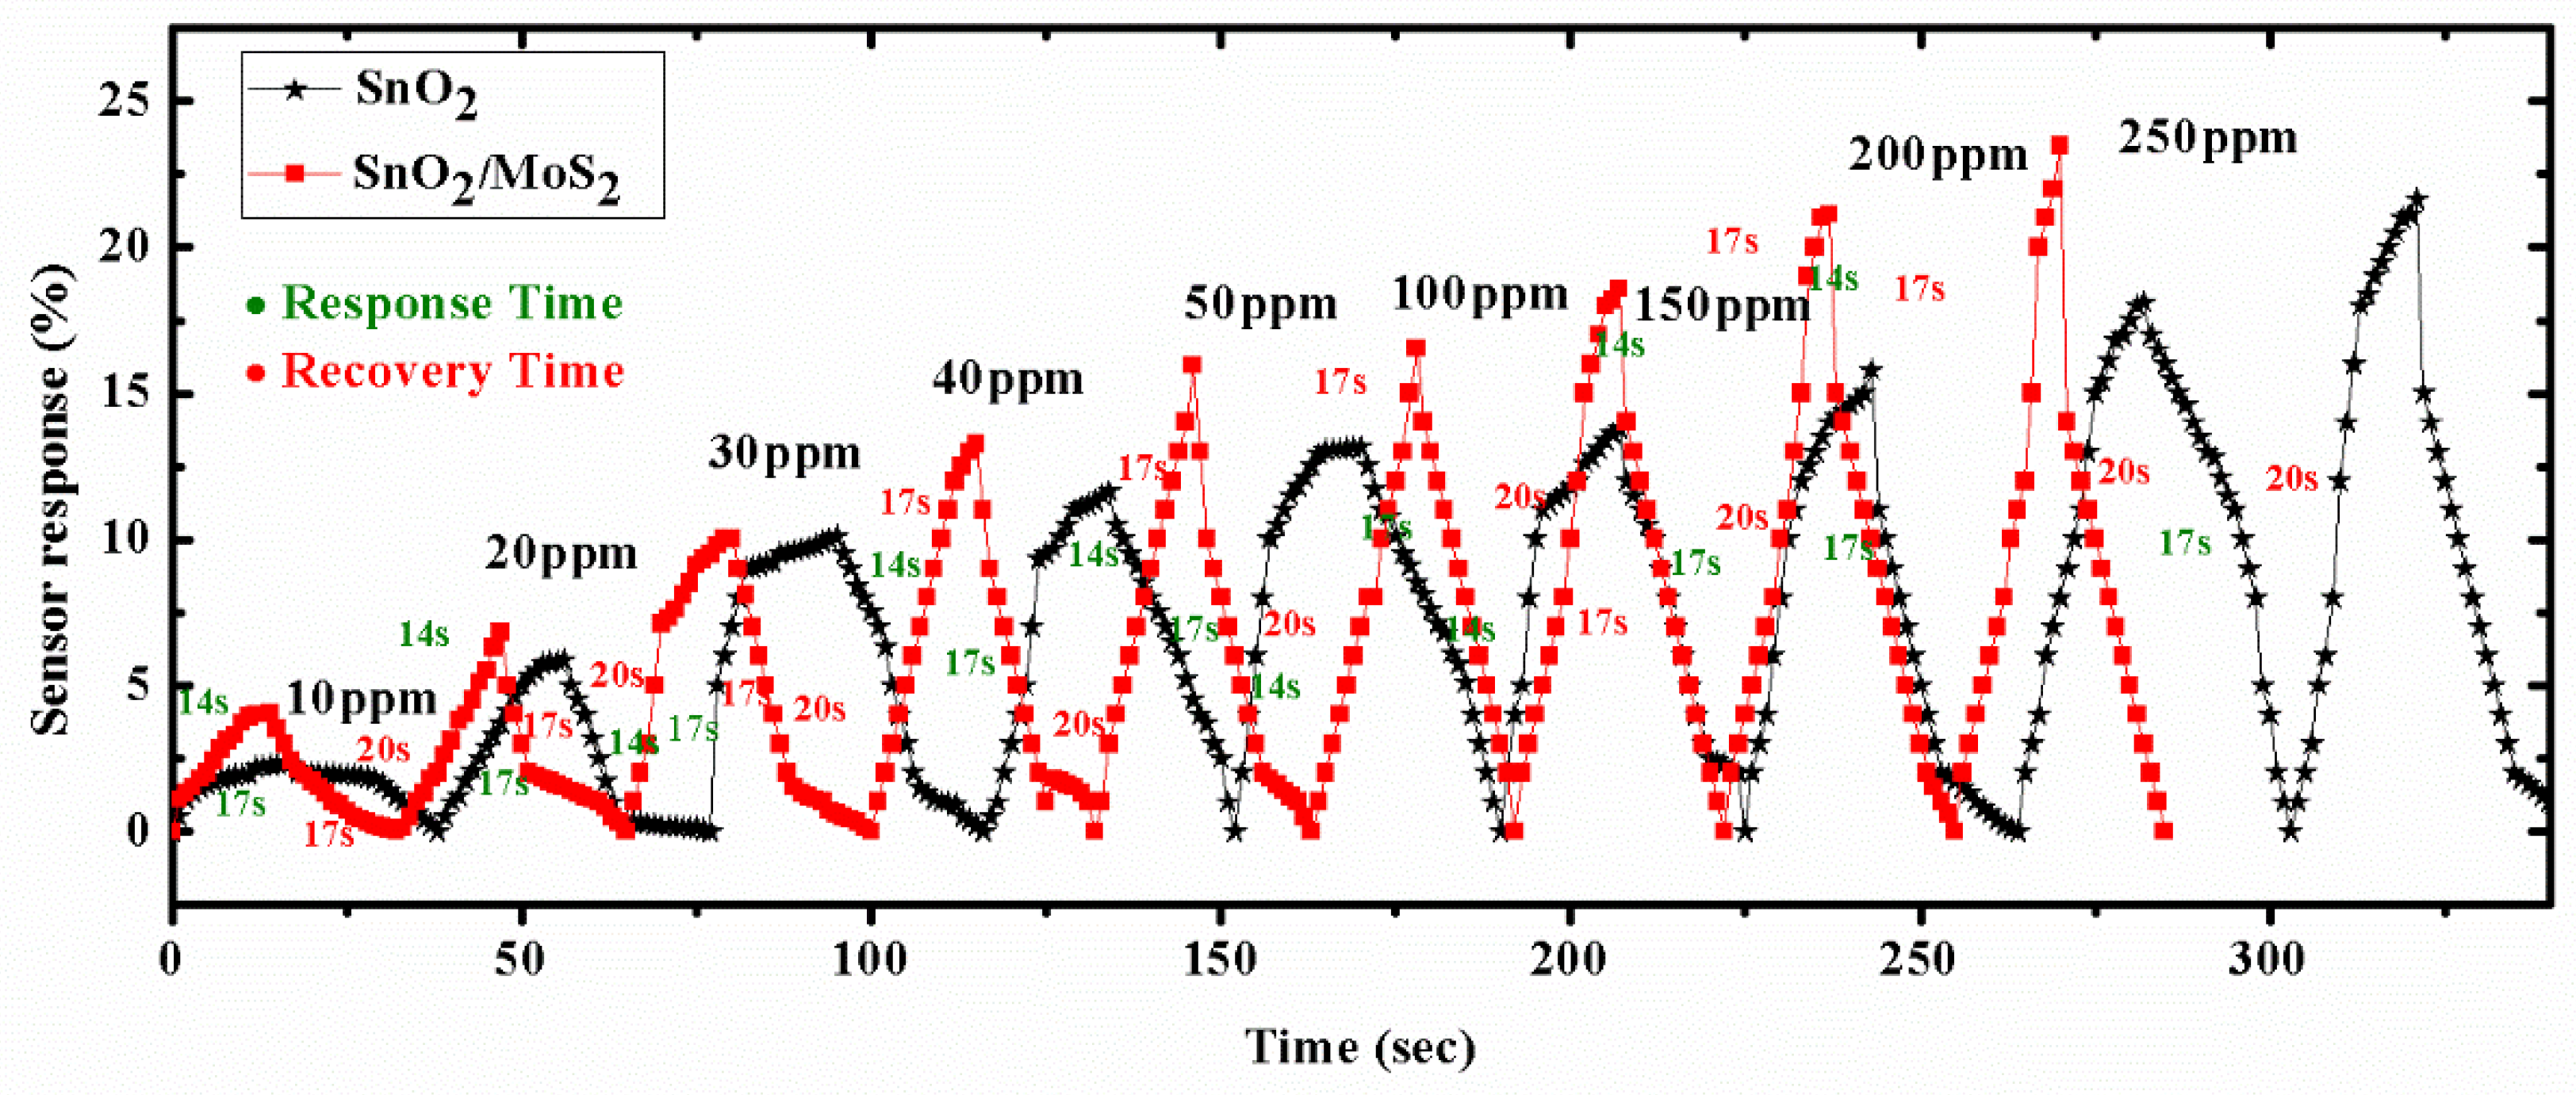
7. Response and Recovery
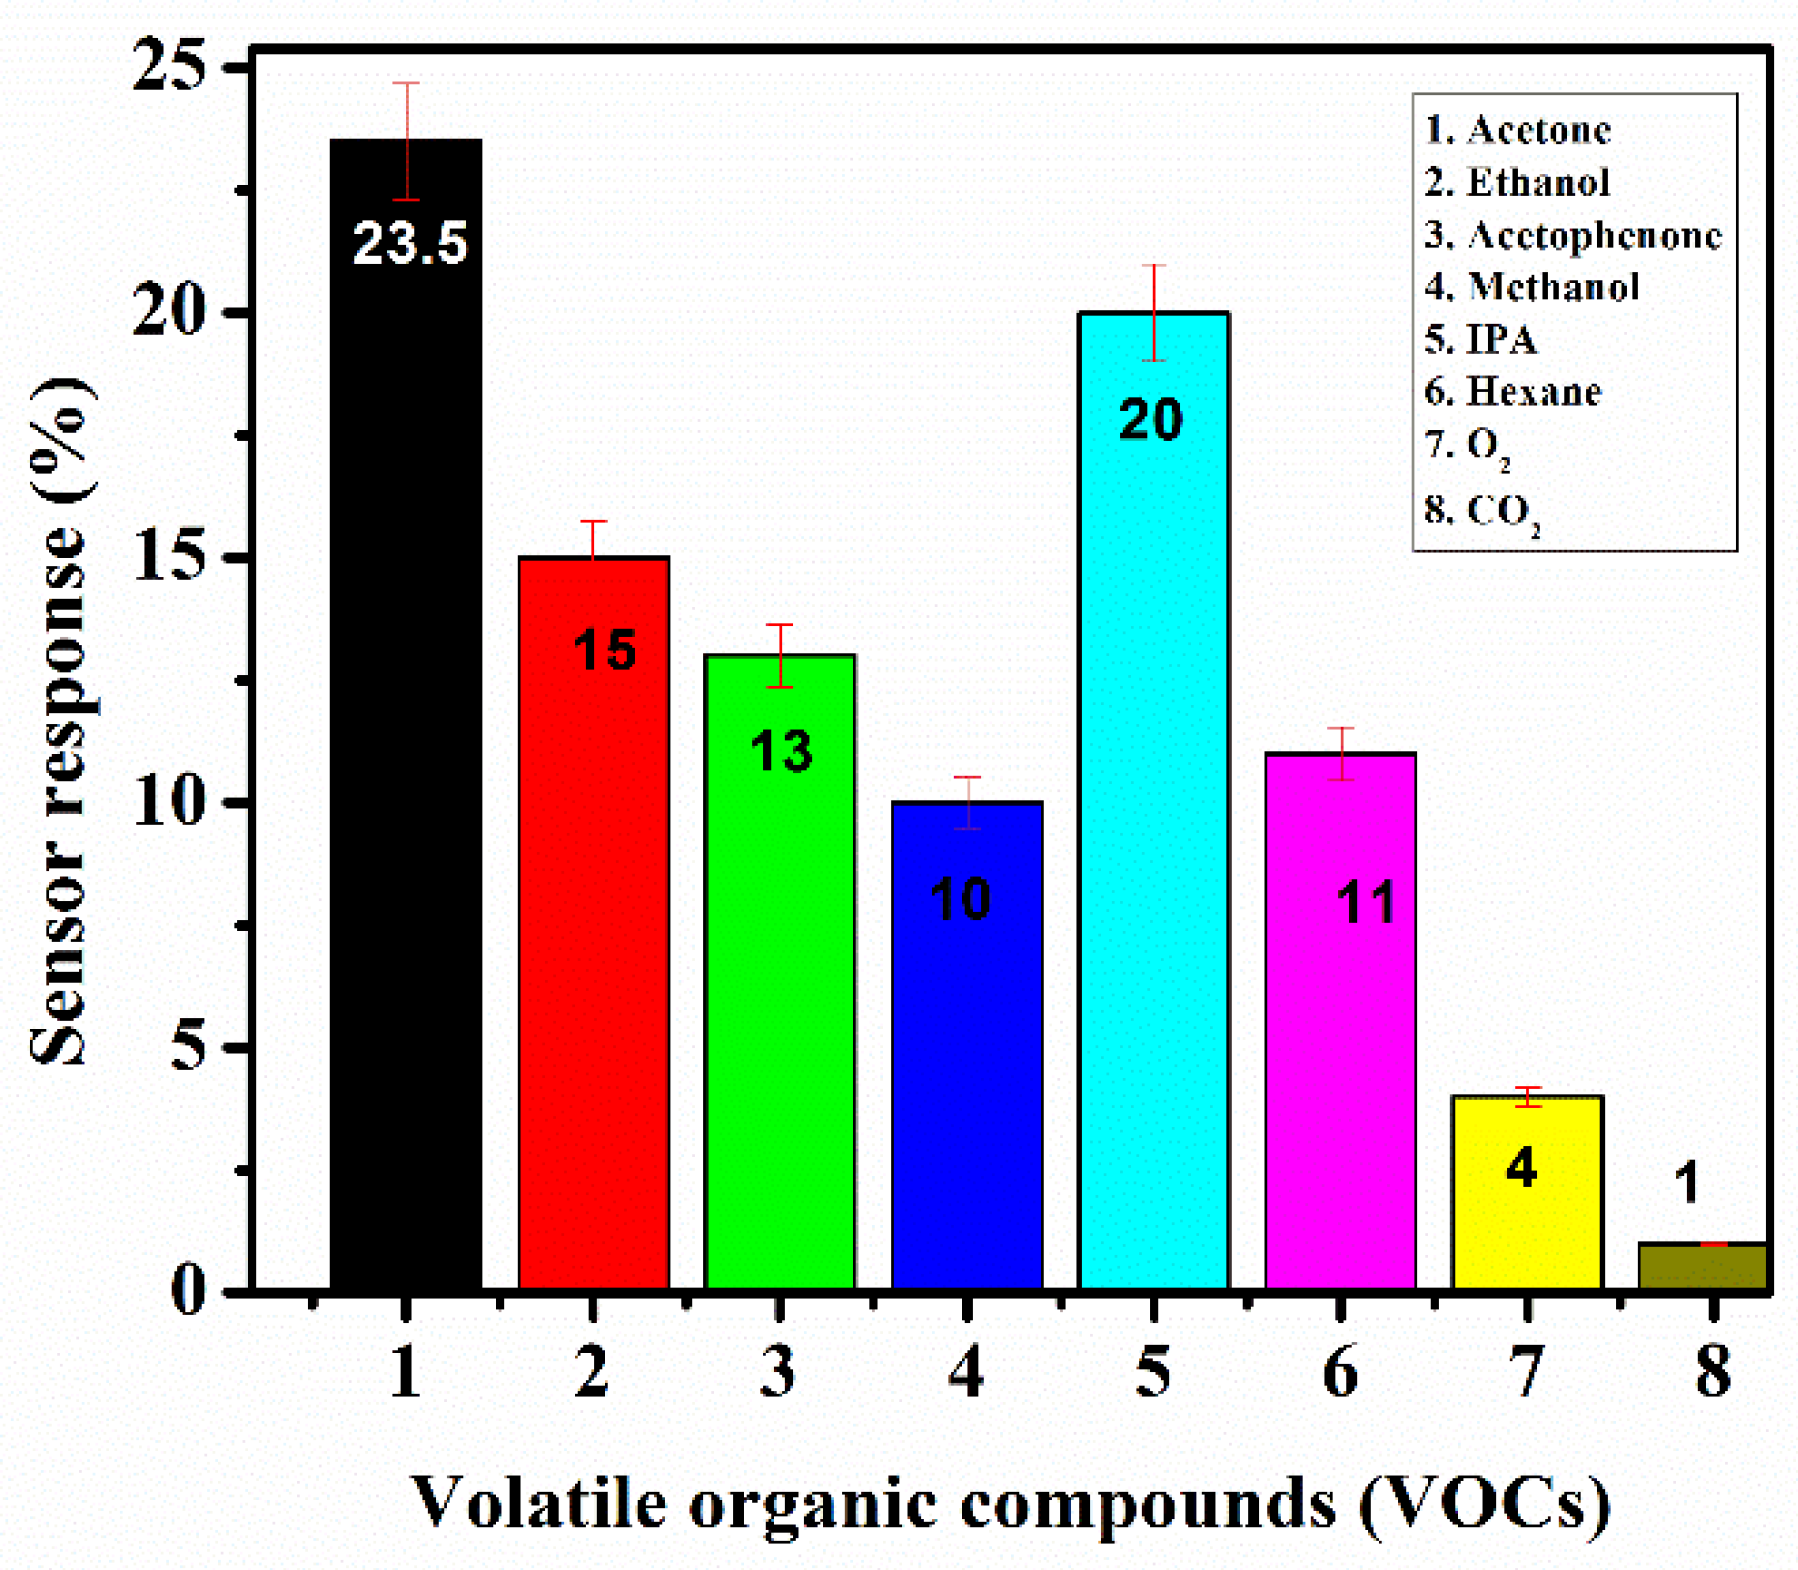
8. Selectivity
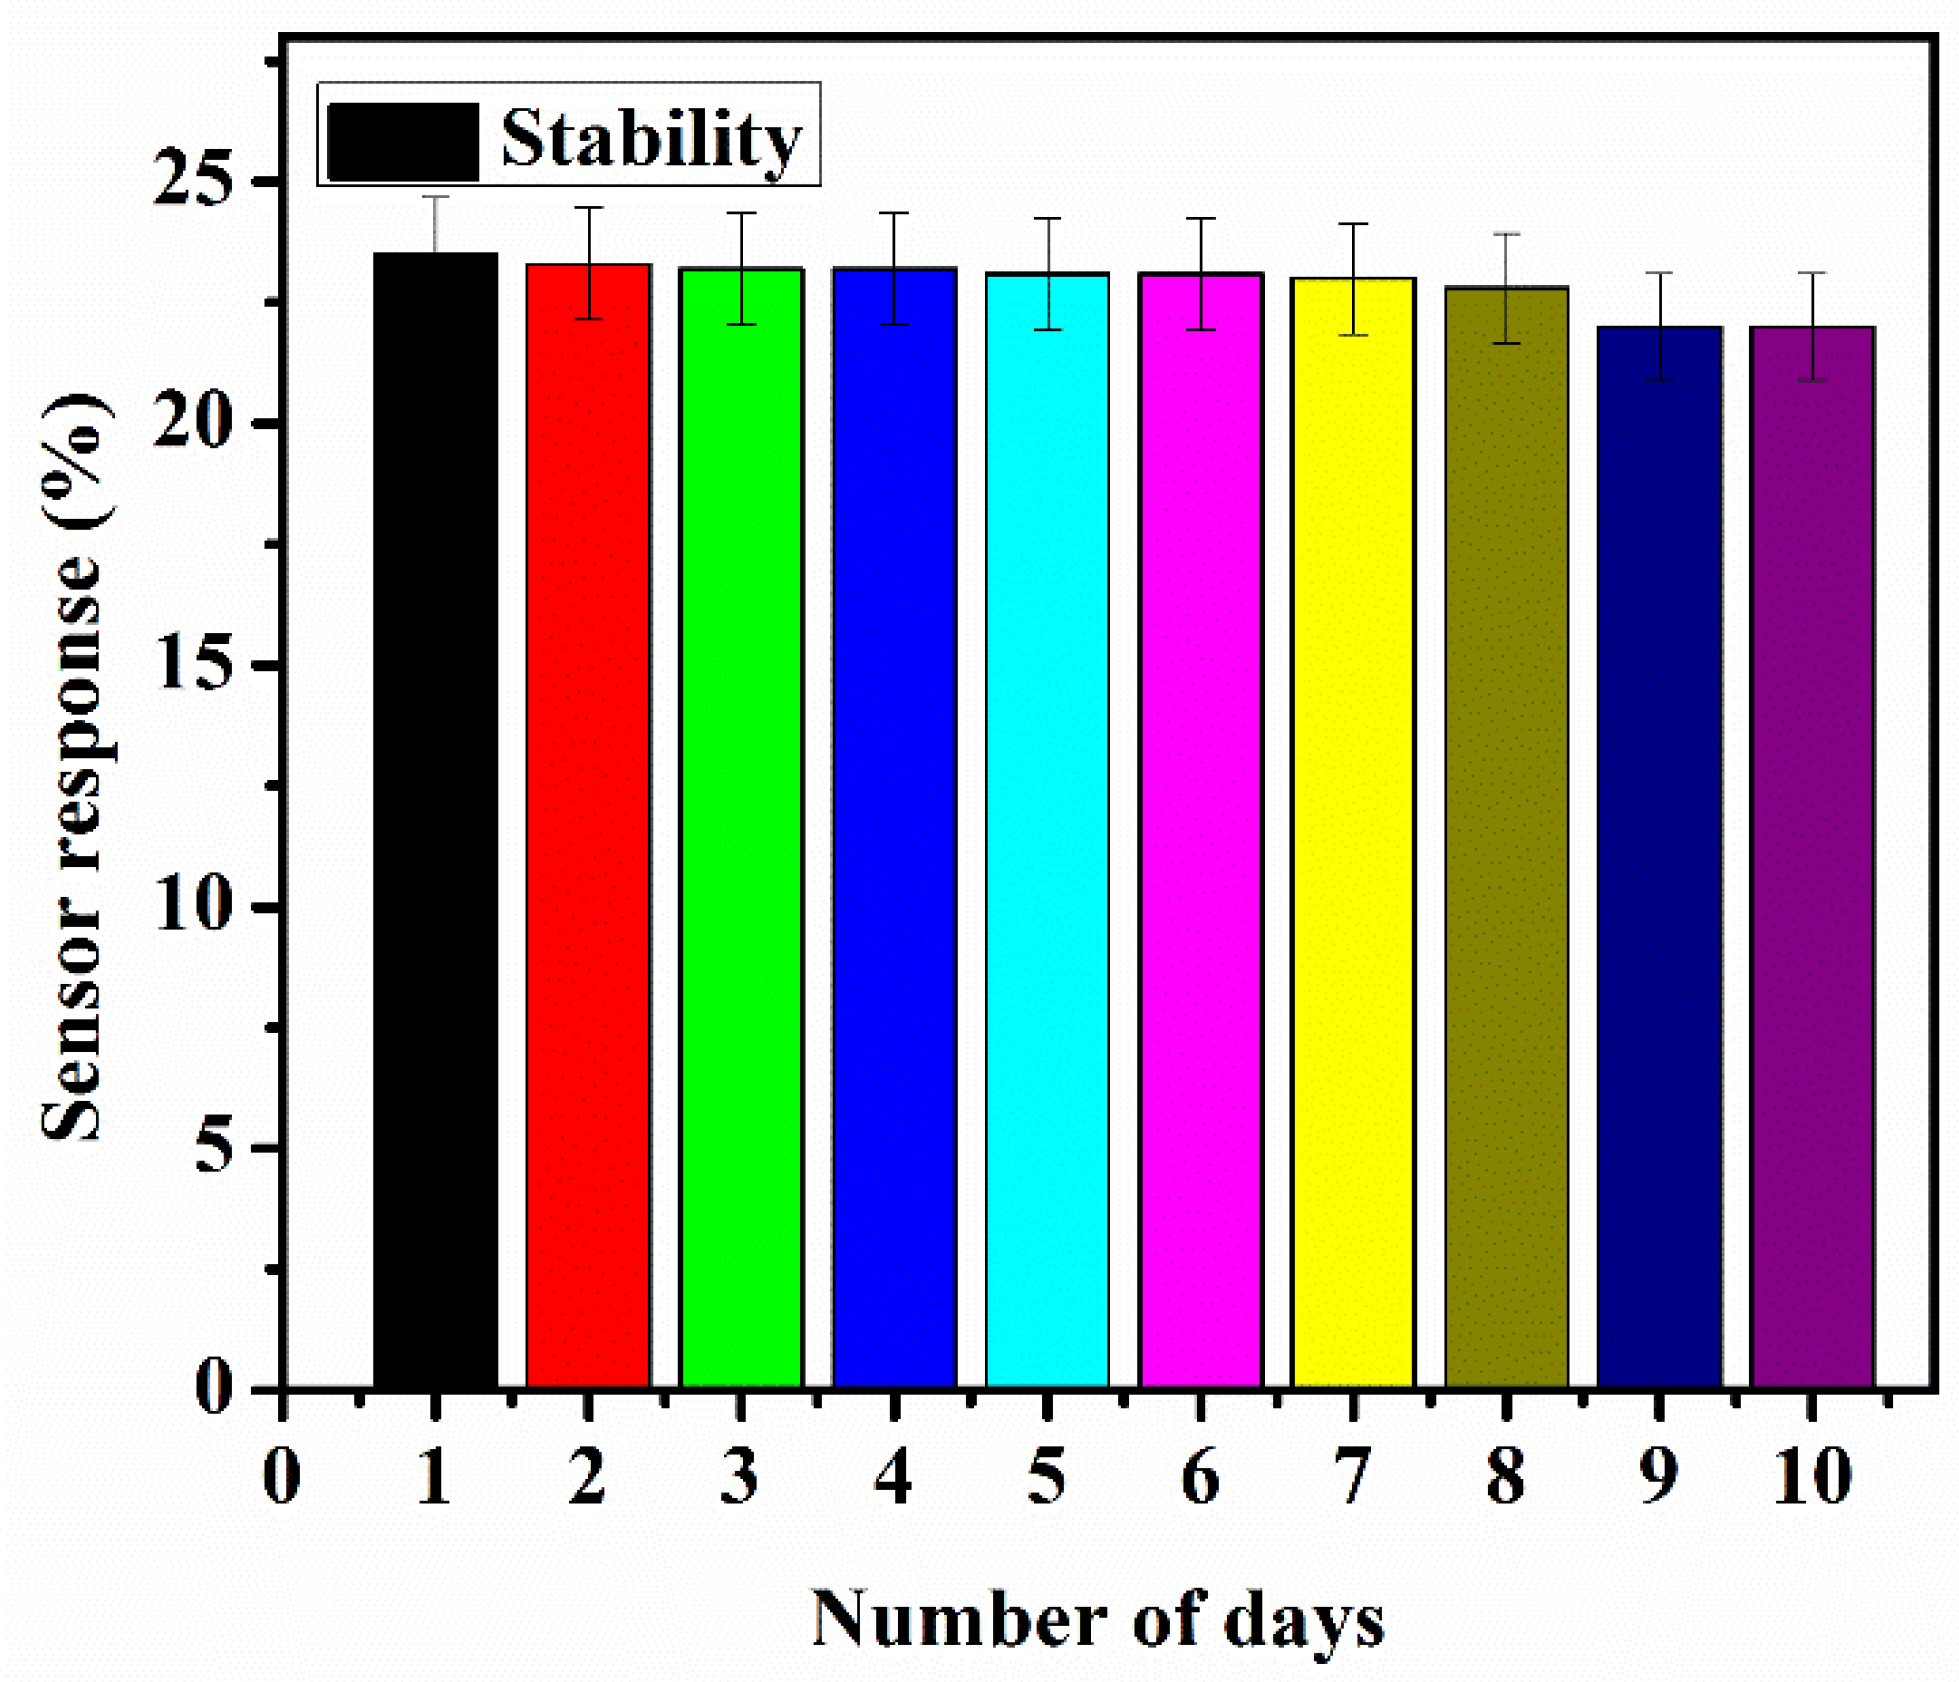
9. Stability
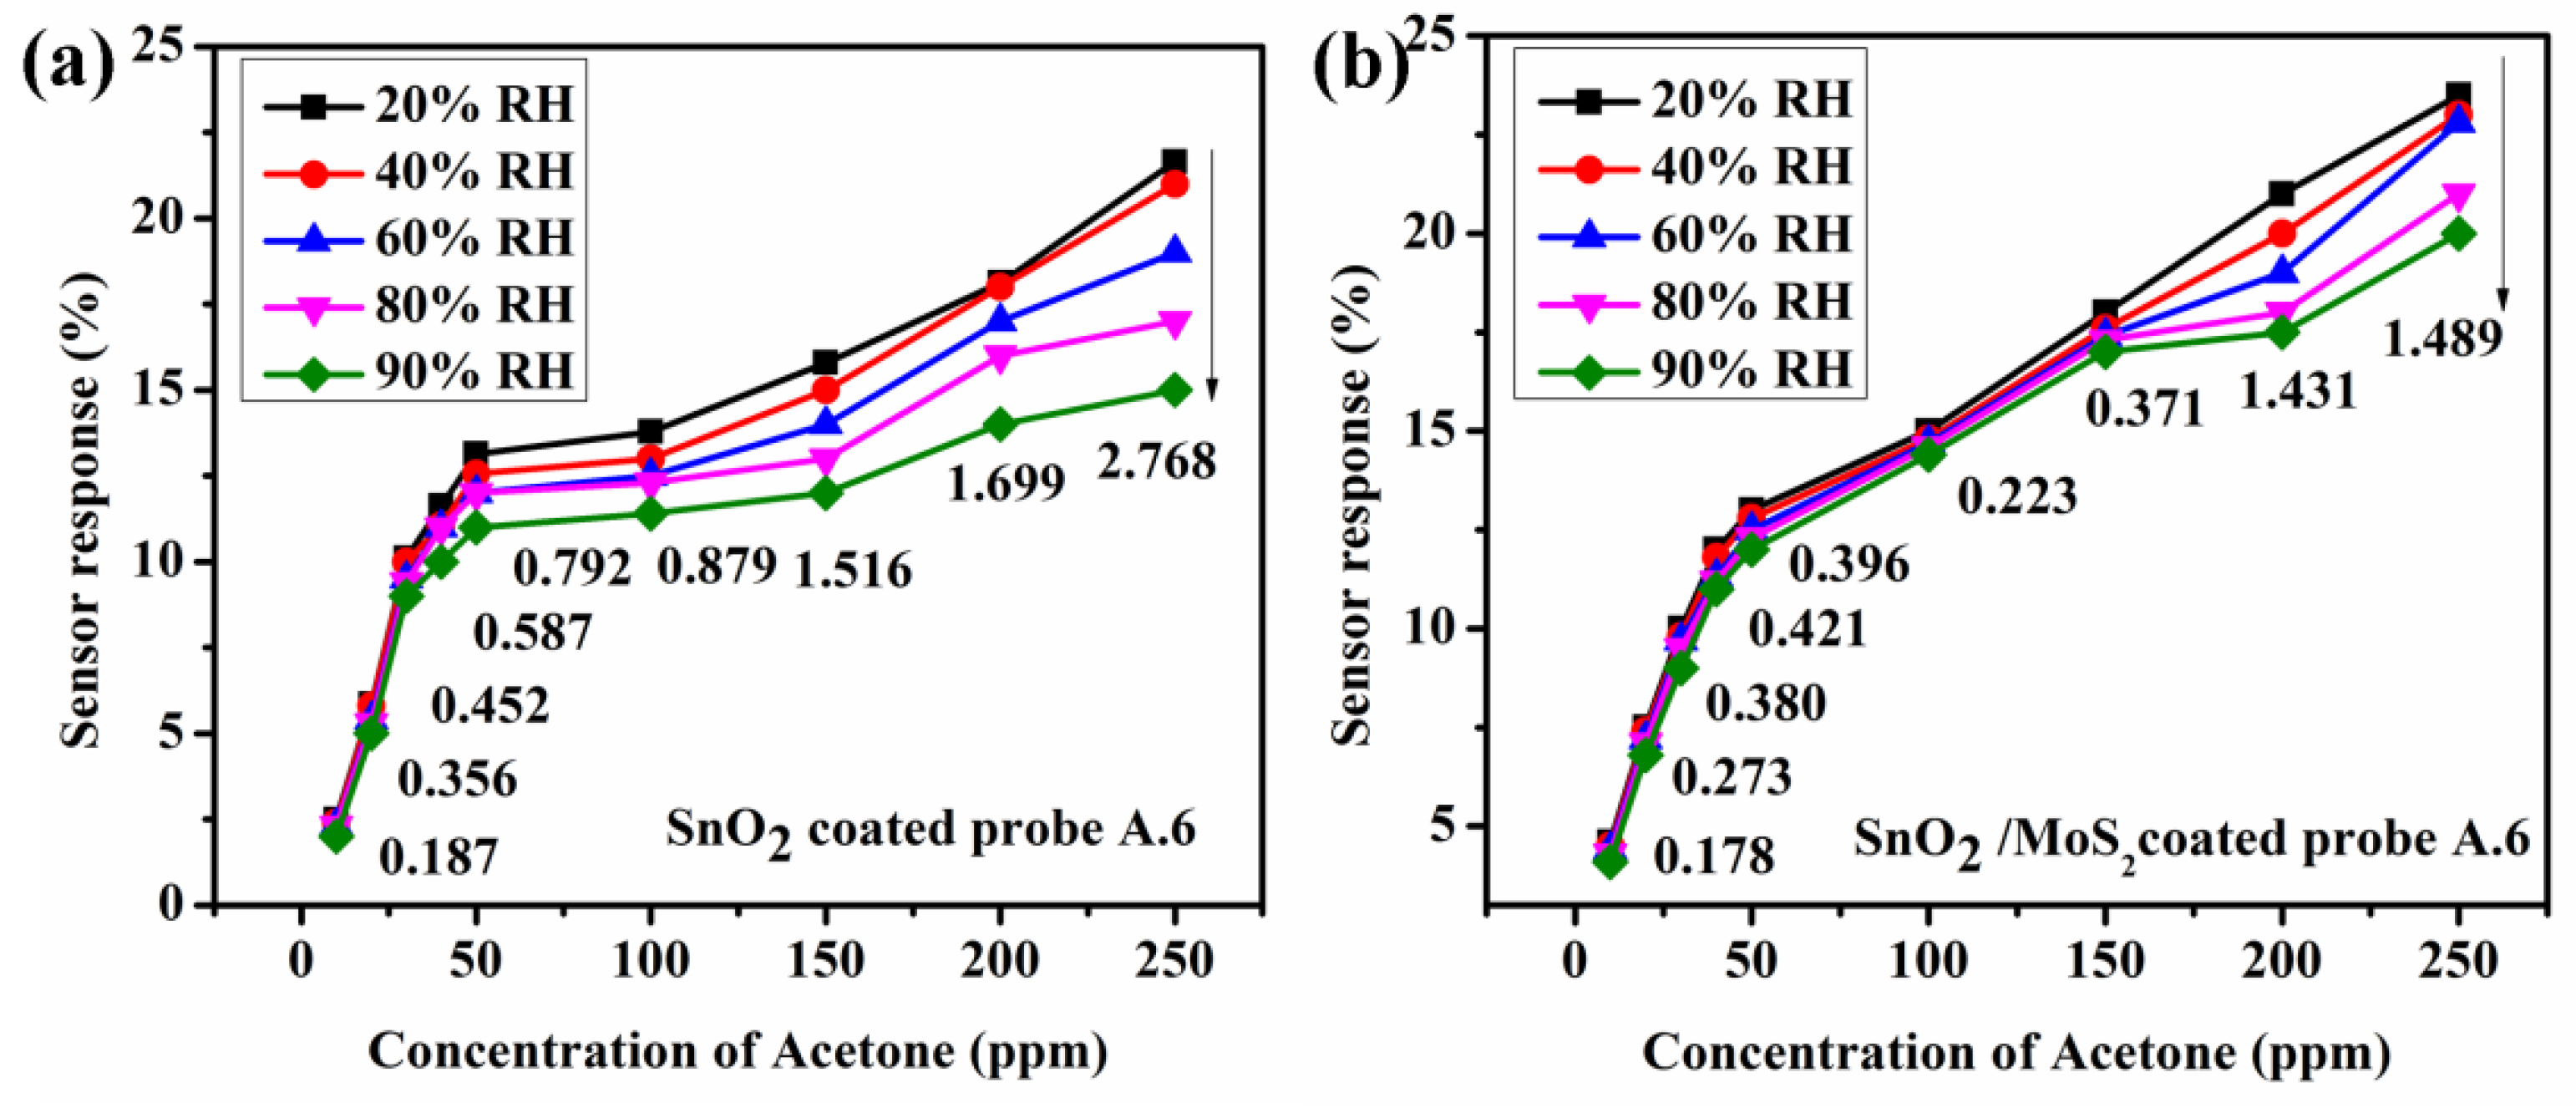
10. Humidity Analysis
11. Prototype
12. Conclusions
Supplementary Materials
Author Contributions
Funding
Institutional Review Board Statement
Informed Consent Statement
Data Availability Statement
Acknowledgments
Conflicts of Interest
References
- Dixit, K.; Fardindoost, S.; Ravishankar, A.; Tasnim, N.; Hoorfar, M. Exhaled Breath Analysis for diabetes Diagnosis and Monitoring: Relevance, Challenges and Possibilities. Biosensors 2021, 11, 476. [Google Scholar] [CrossRef] [PubMed]
- Musa-Veloso, K.; Likhodii, S.S.; Cunnane, S.C. Breath acetone is a reliable indicator of ketosis in adults consuming ketogenic meals. Am. J. Clin. Nutr. 2002, 76, 65–70. [Google Scholar] [CrossRef] [PubMed]
- Mochalski, P.; King, J.; Haas, M.; Unterkofler, K.; Amann, A.; Mayer, G. Blood and breath profiles of volatile organic compounds in patients with end-stage renal disease. BMC Nephrol. 2014, 15, 43. [Google Scholar] [CrossRef] [PubMed]
- Schnabel, R.; Fijten, R.; Smolinska, A.; Dallinga, J.; Boumans, M.L.; Stobberingh, E.; Boots, A.; Roekaerts, P.; Bergmans, D.; van Schooten, F.J. Analysis of volatile organic compounds in exhaled breath to diagnose ventilator-associated pneumonia. Sci. Rep. 2015, 5, 17179. [Google Scholar] [CrossRef]
- International Diabetes Federation. IDF Diabetes Atlas, 7th ed.; International Diabetes Federation: Brussels, Belgium, 2015. [Google Scholar]
- Dikshit, R.P.; Yeole, B.B.; Nagrani, R.; Dhillon, P.; Badwe, R.; Bray, F. Increase in breast cancer incidence among older women in Mumbai: 30-Year trends and predictions to 2025. Cancer Epidemiol. 2012, 36, e215–e220. [Google Scholar] [CrossRef]
- Prabhakaran, D.; Jeemon, P.; Sharma, M.; Roth, G.A.; Johnson, C.; Harikrishnan, S.; Gupta, R.; Pandian, J.D.; Naik, N.; Roy, A.; et al. The changing patterns of cardiovascular diseases and their risk factors in the states of India: The Global Burden of Disease Study 1990–2016. Lancet Glob. Health 2018, 6, e1339–e1351. [Google Scholar] [CrossRef]
- Monakhova, Y.B.; Pozharov, M.V.; Zakharova, T.V. Association/Hydrogen Bonding of Acetone in Polar and Non-polar Solvents: NMR and NIR Spectroscopic Investigations with Chemometrics. J. Solut. Chem. 2014, 43, 1963–1980. [Google Scholar] [CrossRef]
- Wang, C.; Scherrer, S.T.; Hossain, D. Measurements of Cavity Ring down Spectroscopy of Acetone in the Ultraviolet and Near-Infrared Spectral Regions: Potential for Development of a Breath Analyzer. Appl. Spectrosc. 2004, 58, 784–791. [Google Scholar] [CrossRef] [PubMed]
- Hancock, G.; Langley, C.E.; Peverall, R.; Ritchie, G.A.D.; Taylor, D. Laser-Based Method and Sample Handling Protocol for Measuring Breath Acetone. Anal. Chem. 2014, 86, 5838–5843. [Google Scholar] [CrossRef]
- Fan, H.; Zhang, L.; Gao, S.; Chen, L.; Bao, X. Ultrasound sensing based on an in-fiber dual-cavity Fabry–Perot interferometer. Opt. Lett. 2019, 44, 3606. [Google Scholar] [CrossRef]
- Renganathan, B.; Sastikumar, D.; Gobi, G.; Yogamalar, N.R.; Bose, A.C. Gas sensing properties of a clad modified fiber optic sensor with Ce, Li and Al doped nanocrystalline zinc oxides. Sens. Actuators B Chem. 2011, 156, 263–270. [Google Scholar] [CrossRef]
- Subramanian, M.; Dhayabaran, V.; Sastikumar, D.; Shanmugavadivel, M. Development of room temperature fiber optic gas sensor using clad modified Zn3 (VO4)2. J. Alloy. Compd. 2018, 750, 153–163. [Google Scholar] [CrossRef]
- Prasanth, A.; Meher, S.R.; Alex, Z.C. Metal oxide thin films coated evanescent wave based fiber optic VOC sensor. Sens. Actuators A. Phys. 2022, 338, 113459. [Google Scholar] [CrossRef]
- Bhardwaj, R.; Selamneni, V.; Thakur, U.; Sahatiya, P.; Hazra, A. Detection and discrimination of volatile organic compounds by noble metal nanoparticle functionalized MoS2 coated biodegradable paper sensors. New J. Chem. 2020, 44, 16613–16625. [Google Scholar] [CrossRef]
- Wei, W.; Nong, J.; Tang, L.; Wang, N.; Chuang, C.-J.; Huang, Y. Graphene-MoS2 hybrid structure enhanced fiber optic surface plasmon resonance sensor. Plasmonics 2017, 12, 1205–1212. [Google Scholar] [CrossRef]
- Yap, S.H.; Chan, K.K.; Yeh, C.-H.; Chien, Y.-H.; Yong, K.-T. Two-dimensional MoS2 nanosheet-functionalized optical microfiber for room-temperature volatile organic compound detection. ACS Appl. Nano Mater. 2021, 4, 13440–13449. [Google Scholar] [CrossRef]
- Chen, H.; Yang, X.; Feng, W. Cadmium-ion detection: A comparative study for a SnO2, MoS2, SnO2/MoS2, SnO2-MoS2 sensing membrane combination with a fiber-optic Mach–Zehnder interferometer. Appl. Opt. 2021, 60, 799. [Google Scholar] [CrossRef]
- Renganathan, B.; Ganesan, A.R. Fiber optic gas sensor with nanocrystalline ZnO. Opt. Fiber Technol. 2014, 20, 48–52. [Google Scholar] [CrossRef]
- Alves, H.P.; Barros, T.H.; Nascimento, D.L.; e Silva, M.S.P.; Nascimento, J.F.; Fontana, E.; Martins Filho, J.F. Influence of surface roughness on the sensitivity of a D-shaped optical fiber-based refractive index sensor. Sens. Actuators A. Phys. 2022, 344, 113702. [Google Scholar] [CrossRef]
- Samavati, Z.; Samavati, A.; Ismail, A.F.; Yahya, N.; Rahman, M.A.; Othman, M.H.D. Effect of acetone/methanol ratio as a hybrid solvent on fabrication of polymethylmethacrylate optical fiber sensor. Opt. Laser Technol. 2020, 123, 105896. [Google Scholar] [CrossRef]
- Hu, J.; Yang, J.; Wang, W.; Xue, Y.; Sun, Y.; Li, P.; Lian, K.; Zhang, W.; Chen, L.; Shi, J.; et al. Synthesis and gas sensing properties of NiO/SnO2 hierarchical structures toward ppb-level acetone detection. Mater. Res. Bull. 2018, 102, 294–303. [Google Scholar] [CrossRef]
- Thangaraj, S.; Paramasivan, C.; Balusamy, R.; Arumainathan, S.; Thanigainathan, P. Evanescent wave optical fibre ammonia sensor with methylamine hydroiodide. IET Optoelectron. 2020, 14, 292–295. [Google Scholar] [CrossRef]
- Mariammal, R.N.; Ramachandran, K.; Renganathan, B.; Sastikumar, D. On the enhancement of ethanol sensing by CuO modified SnO2 nanoparticles using fiber-optic sensor. Sens. ActuatorsB 2012, 169, 199–207. [Google Scholar] [CrossRef]
- Yuan, J.; El-Sherif, M.A. Fiber-optic chemical sensor using polyaniline as modified cladding material. IEEE Sens. J. 2003, 3, 5–12. [Google Scholar] [CrossRef]
- Sangeetha, M.; Madhan, D. Ultra sensitive molybdenum disulfide (MoS2)/graphene based hybrid sensor for the detection of NO2 and formaldehyde gases by fiber optic clad modified method. Opt. Laser Technol. 2020, 127, 106193. [Google Scholar] [CrossRef]
- Hervé, P.; Vandamme, L. General relation between refractive index and energy gap in semiconductors. Infrared Phys. Technol. 1994, 35, 609–615. [Google Scholar] [CrossRef]
- Navale, S.; Yang, Z.; Liu, C.; Cao, P.; Patil, V.; Ramgir, N.; Mane, R.; Stadler, F. Enhanced acetone sensing properties of titanium dioxide nanoparticles with a sub-ppm detection limit. Sens. Actuators B Chem. 2018, 255, 1701–1710. [Google Scholar] [CrossRef]
- Wang, S.; Cao, J.; Cui, W.; Li, X.; Li, D. Facile synthesis and high acetone gas sensing performances of popcorn-like In2O3 hierarchical nanostructures. Mater. Lett. 2017, 186, 256–258. [Google Scholar] [CrossRef]
- da Silva, L.; Catto, A.; Avansi, W.; Cavalcante, L.; Mastelaro, V.; Andrés, J.; Aguir, K.; Longo, E. Acetone gas sensor based on α-Ag2WO4 nanorods obtained via a microwave-assisted hydrothermal route. J. Alloy. Compd. 2016, 683, 186–190. [Google Scholar] [CrossRef]
- Cao, J.; Wang, S.; Zhang, H.; Zhang, T. Facile construction of Co3O4 porous microspheres with enhanced acetone gas sensing performances. Mater. Sci. Semicond. Processing 2019, 101, 10–15. [Google Scholar] [CrossRef]
- Bian, H.; Ma, S.; Sun, A.; Xu, X.; Yang, G.; Gao, J.; Zhang, Z.; Zhu, H. Characterization and acetone gas sensing properties of electrospun TiO2 nanorods. Superlattices Microstruct. 2015, 81, 107–113. [Google Scholar] [CrossRef]
- Mansour, E.; Vishinkin, R.; Rihet, S.; Saliba, W.; Fish, F.; Sarfati, P.; Haick, H. Measurement of temperature and relative humidity in exhaled breath. Sens. Actuators B Chem. 2020, 304, 127371. [Google Scholar] [CrossRef]
- Du, B.; Yang, D.; She, X.; Yuan, Y.; Mao, D.; Jiang, Y.; Lu, F. MoS2-based all-fiber humidity sensor for monitoring human breath with fast response and recovery. Sens. Actuators B Chem. 2017, 251, 180–184. [Google Scholar] [CrossRef]


| Conc./Time | 10 ppm | 20 ppm | 30 ppm | 40 ppm | 50 ppm | 100 ppm | 150 ppm | 200 ppm | 250 ppm |
|---|---|---|---|---|---|---|---|---|---|
| 5 min | 0.33% | 0.47% | 0.72% | 0.94% | 1.3% | 1.74% | 2.0% | 2.2% | 2.5% |
| 10 min | 0.36% | 0.63% | 0.77% | 1.09% | 1.46% | 1.89% | 2.21% | 2.81% | 3.47% |
| 15 min | 0.61% | 1.01% | 1.49% | 3.14% | 4.93% | 5.92% | 6.28% | 7.28% | 8.3% |
| 25 min | 0.71% | 1.39% | 2.44% | 3.98% | 5.59% | 7.79% | 8.48% | 9.06% | 9.31% |
| 40 min | 2.52% | 3.79% | 5.06% | 6.98% | 8.21% | 9.65% | 11.55% | 12.3% | 13.58% |
| Complete clad removal | 2.5% | 5.85% | 10.1% | 11.63% | 13.14% | 13.78% | 15.79% | 18.12% | 21.65% |
| Conc./Time | 10 ppm | 20 ppm | 30 ppm | 40 ppm | 50 ppm | 100 ppm | 150 ppm | 200 ppm | 250 ppm |
|---|---|---|---|---|---|---|---|---|---|
| 5 min | 0.41% | 0.75% | 1.2% | 1.57% | 1.82% | 2.26% | 2.56% | 2.7% | 3.34% |
| 10 min | 0.63% | 1.29% | 1.66% | 2.0% | 2.61% | 3.55% | 4.12% | 4.4% | 4.67% |
| 15 min | 2.52% | 4.41% | 5.44% | 5.95% | 6.73% | 7.33% | 8.8% | 12.43% | 14.66% |
| 25 min | 1.82% | 2.73% | 4.68% | 6.15% | 7.1% | 8.07% | 9.28% | 11.53% | 17.04% |
| 40 min | 1.67% | 3.57% | 4.63% | 5.15% | 7.91% | 9.75% | 13.52% | 17.27% | 22.14% |
| Complete clad removal | 4.6% | 7.5% | 10% | 12% | 13% | 15% | 18% | 21% | 23.5% |
| Sl.No | Sensing Principle | Sensing Layer | Sensor Response (%) | Limit of Detection | Concentration | Res./Rec. | Operating Temperature | Reference |
|---|---|---|---|---|---|---|---|---|
| 1 | Chemiresistive | TiO2 | 15.24 | 0.5 ppm | 1000 ppm | 10 s/9 s | 270 °C | [28] |
| 2 | Chemiresistive | In2O3 | 8 | 1 ppm | 50 ppm | 32 s/38 s | 260 °C | [29] |
| 3 | Chemiresistive | α-Ag2WO4 Nanorods | 2.77 | 0.5 ppm | 10 ppm | 32 s/130 s | 350 °C | [30] |
| 4 | Chemiresistive | Co3O4 | 7.6 | 10 ppm | 100 ppm | 25 s/5 s | 180 °C | [31] |
| 5 | Evanescent Wave | SnO2 | 13.9 | 0.8 ppm | 250 ppm | 17 s/21 s | RT | [14] |
| 6 | Chemiresistive | Electrospun TiO2 nanorods | ~21 | 1 ppm | 500 ppm | 14 s/8 s | RT | [32] |
| 7 | Evanescent Wave | SnO2/MoS2 | 23.5 | 0.5 ppm | 250 ppm | 14 s/17 s | RT | Present work |
Publisher’s Note: MDPI stays neutral with regard to jurisdictional claims in published maps and institutional affiliations. |
© 2022 by the authors. Licensee MDPI, Basel, Switzerland. This article is an open access article distributed under the terms and conditions of the Creative Commons Attribution (CC BY) license (https://creativecommons.org/licenses/by/4.0/).
Share and Cite
Prasanth, A.; Getachew, S.; Shewa, T.; Velumani, M.; Meher, S.R.; Alex, Z.C. A Bilayer SnO2/MoS2-Coated Evanescent Wave Fiber Optic Sensor for Acetone Detection—An Experimental Study. Biosensors 2022, 12, 734. https://doi.org/10.3390/bios12090734
Prasanth A, Getachew S, Shewa T, Velumani M, Meher SR, Alex ZC. A Bilayer SnO2/MoS2-Coated Evanescent Wave Fiber Optic Sensor for Acetone Detection—An Experimental Study. Biosensors. 2022; 12(9):734. https://doi.org/10.3390/bios12090734
Chicago/Turabian StylePrasanth, A., Selamawit Getachew, Tseganesh Shewa, M. Velumani, S. R. Meher, and Z. C. Alex. 2022. "A Bilayer SnO2/MoS2-Coated Evanescent Wave Fiber Optic Sensor for Acetone Detection—An Experimental Study" Biosensors 12, no. 9: 734. https://doi.org/10.3390/bios12090734