Production of a Monoclonal Antibody for the Detection of Forchlorfenuron: Application in an Indirect Enzyme-Linked Immunosorbent Assay and Immunochromatographic Strip

 , , and
Abstract
:1. Introduction
2. Materials and Methods
2.1. Materials and Reagents
2.2. Development of a Monoclonal Antibody against CPPU
2.2.1. Preparation of Immunogen and Coating Antigen of CPPU
2.2.2. Production of Anti-CPPU mAb
2.2.3. Evaluation of Antibody Performance
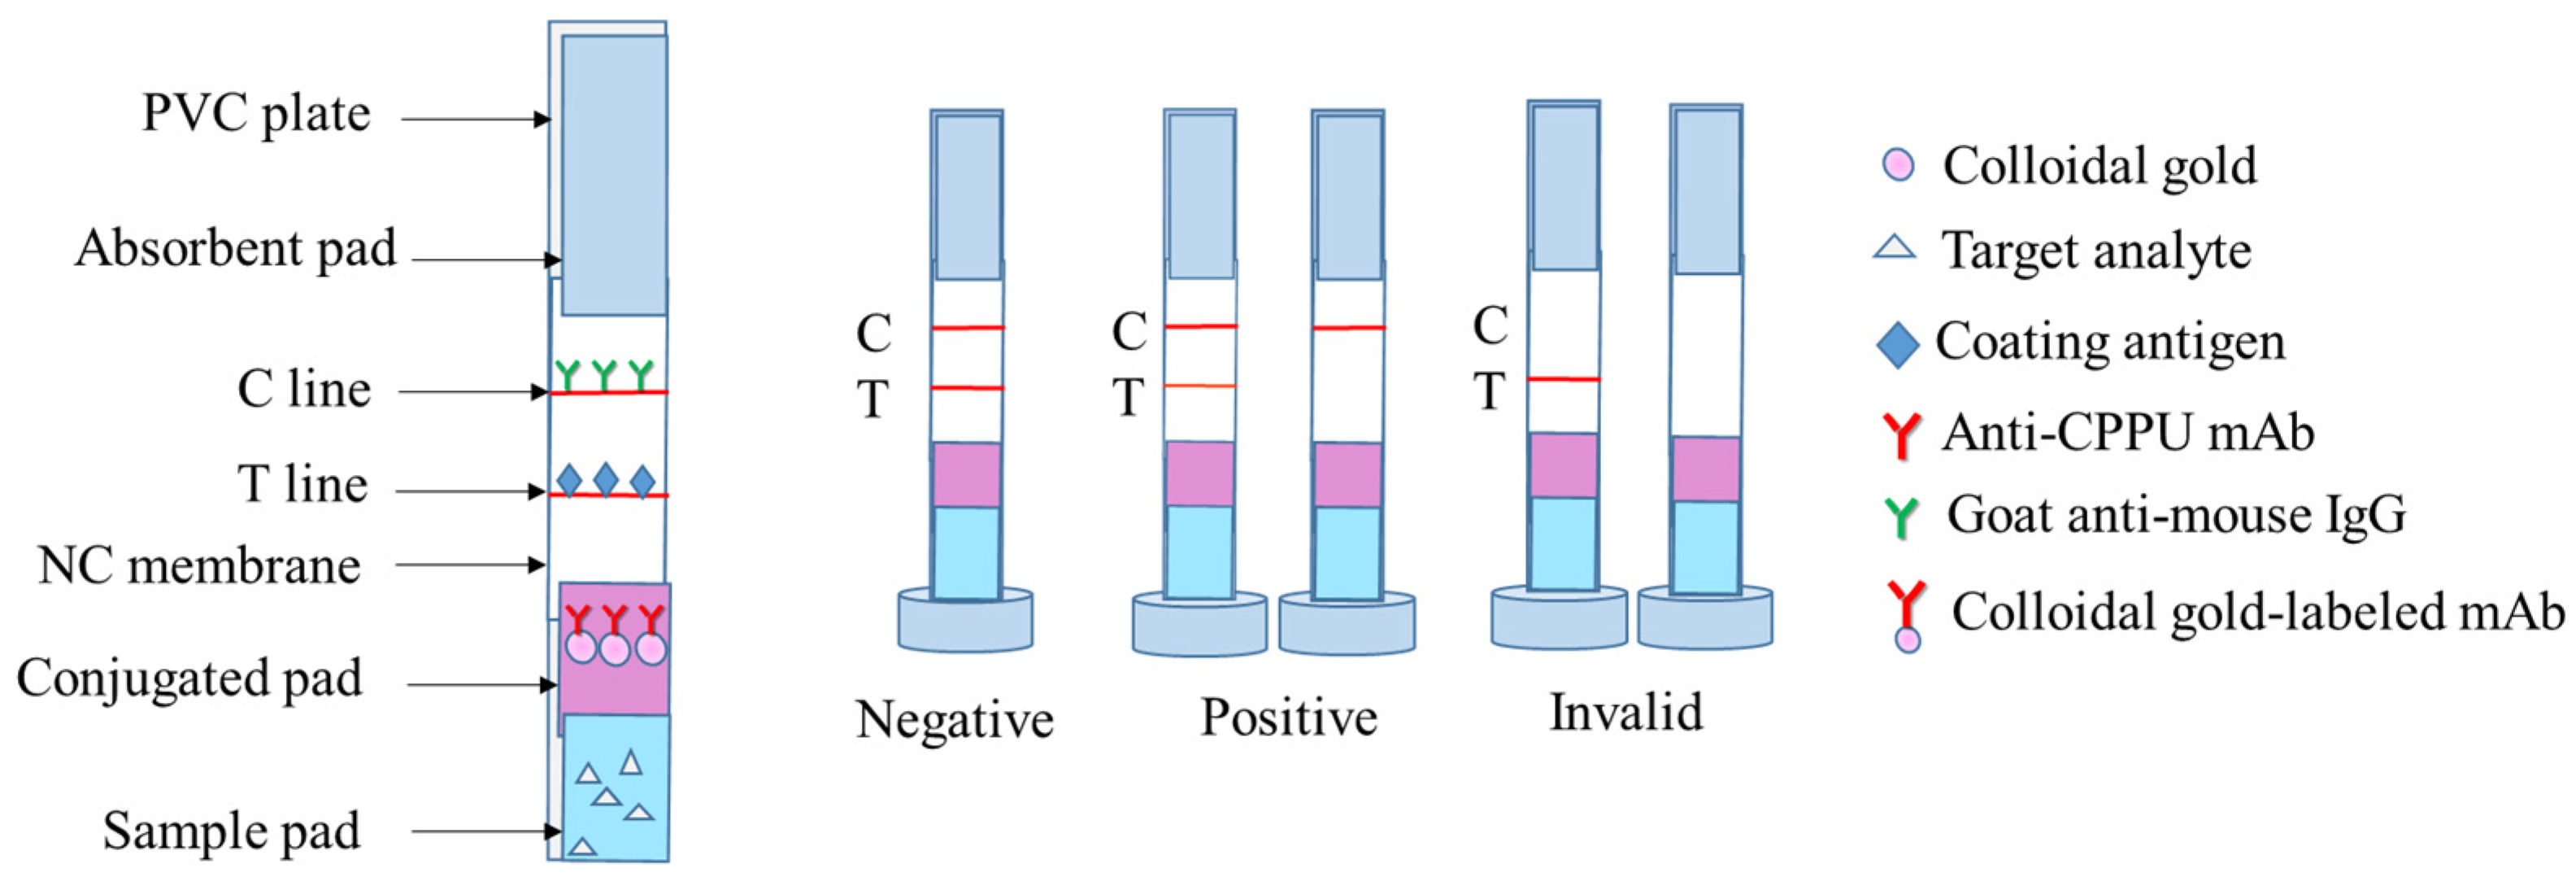
2.3. Establishment of Colloidal Gold Immunoassay
2.3.1. Preparation of Antibody Probes
2.3.2. Preparation of Test Strips
2.3.3. Strip Performance
2.4. Detection of CPPU in Cucumber
2.4.1. CGN-ICTS
2.4.2. ic-ELISA
2.4.3. LC-MS/MS
3. Results
3.1. Development of a Monoclonal Antibody against CPPU
3.1.1. Characterization of Immunogen and Coating Antigen of CPPU
3.1.2. Production and Selection of Anti-CPPU mAb
3.1.3. Characterization of Anti-CPPU mAb
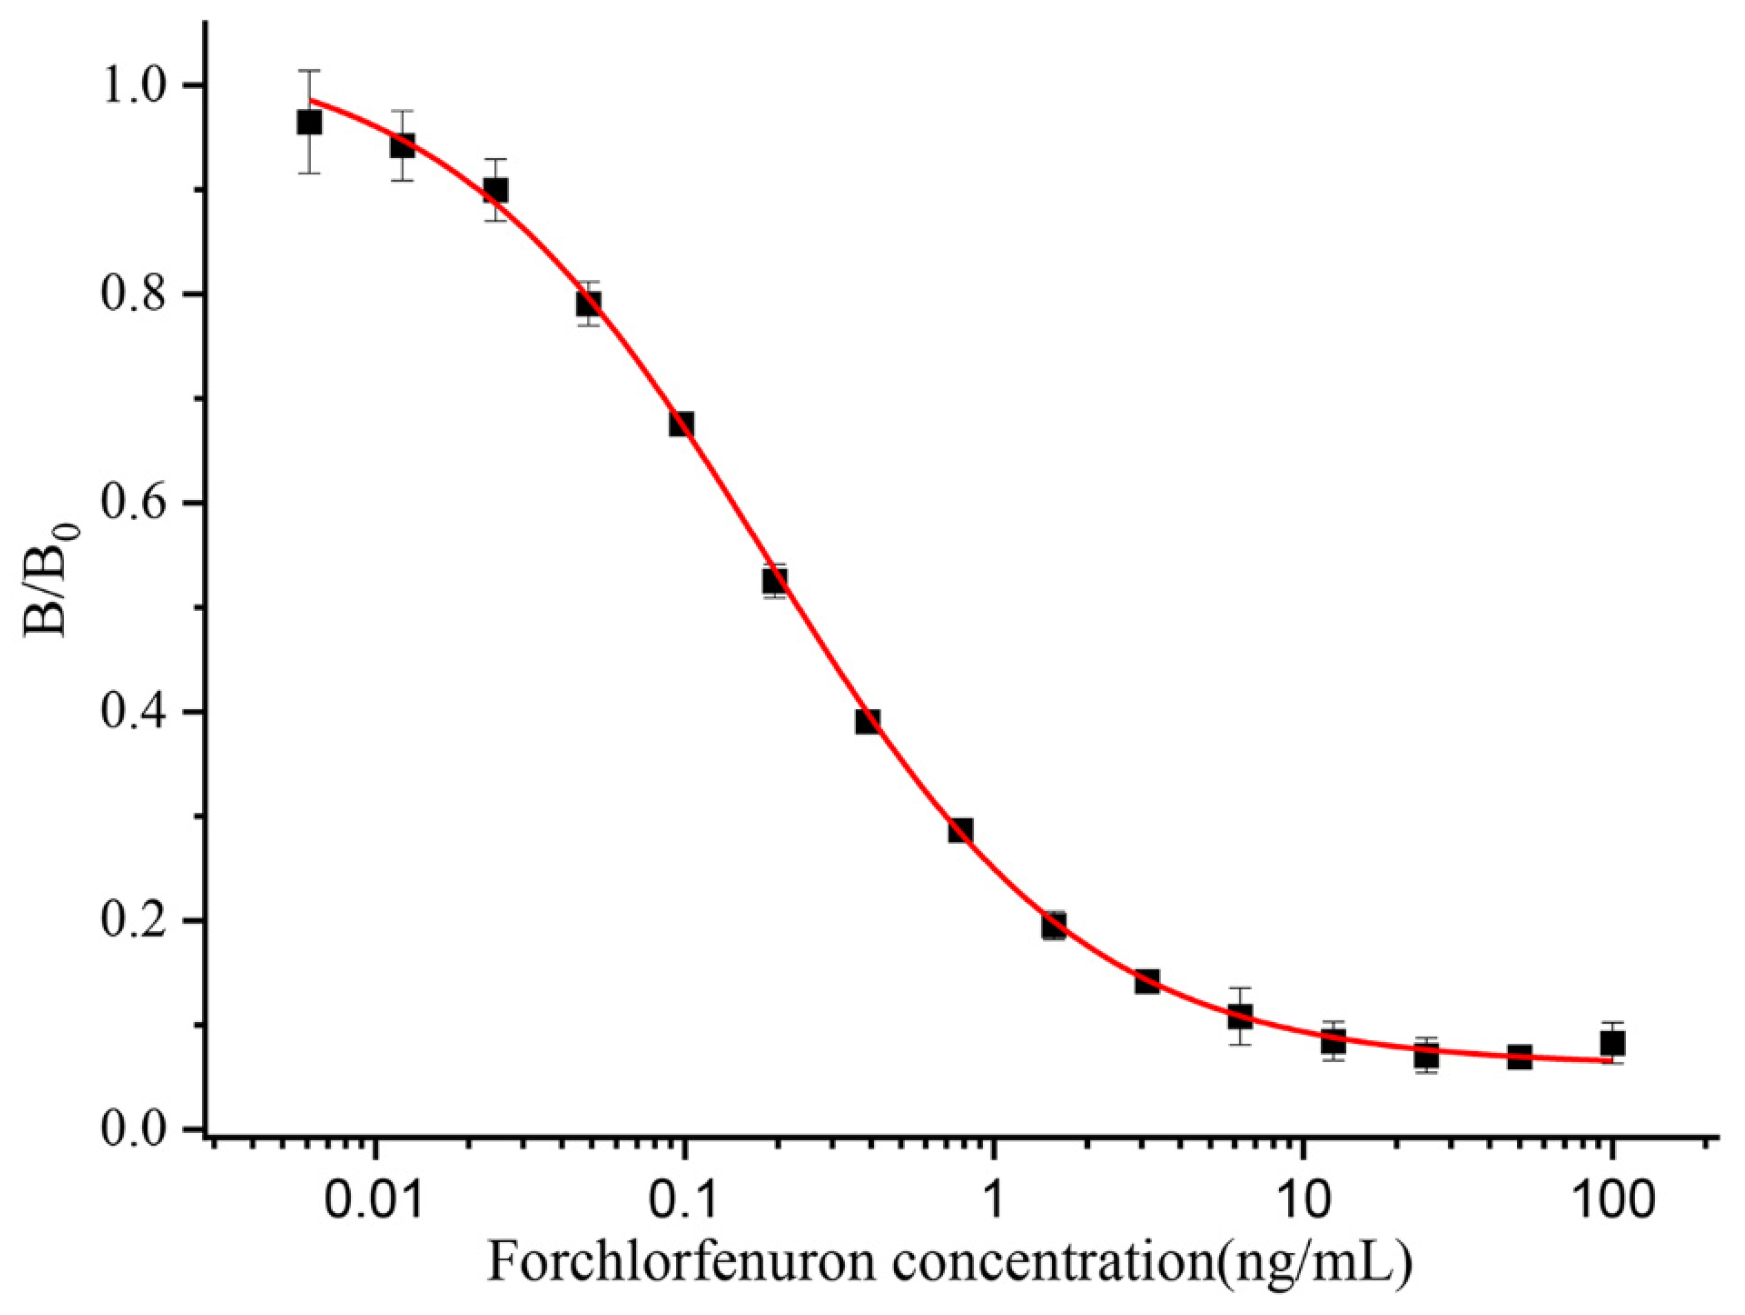
3.2. Establishment of a Colloidal Gold Immunoassay Method
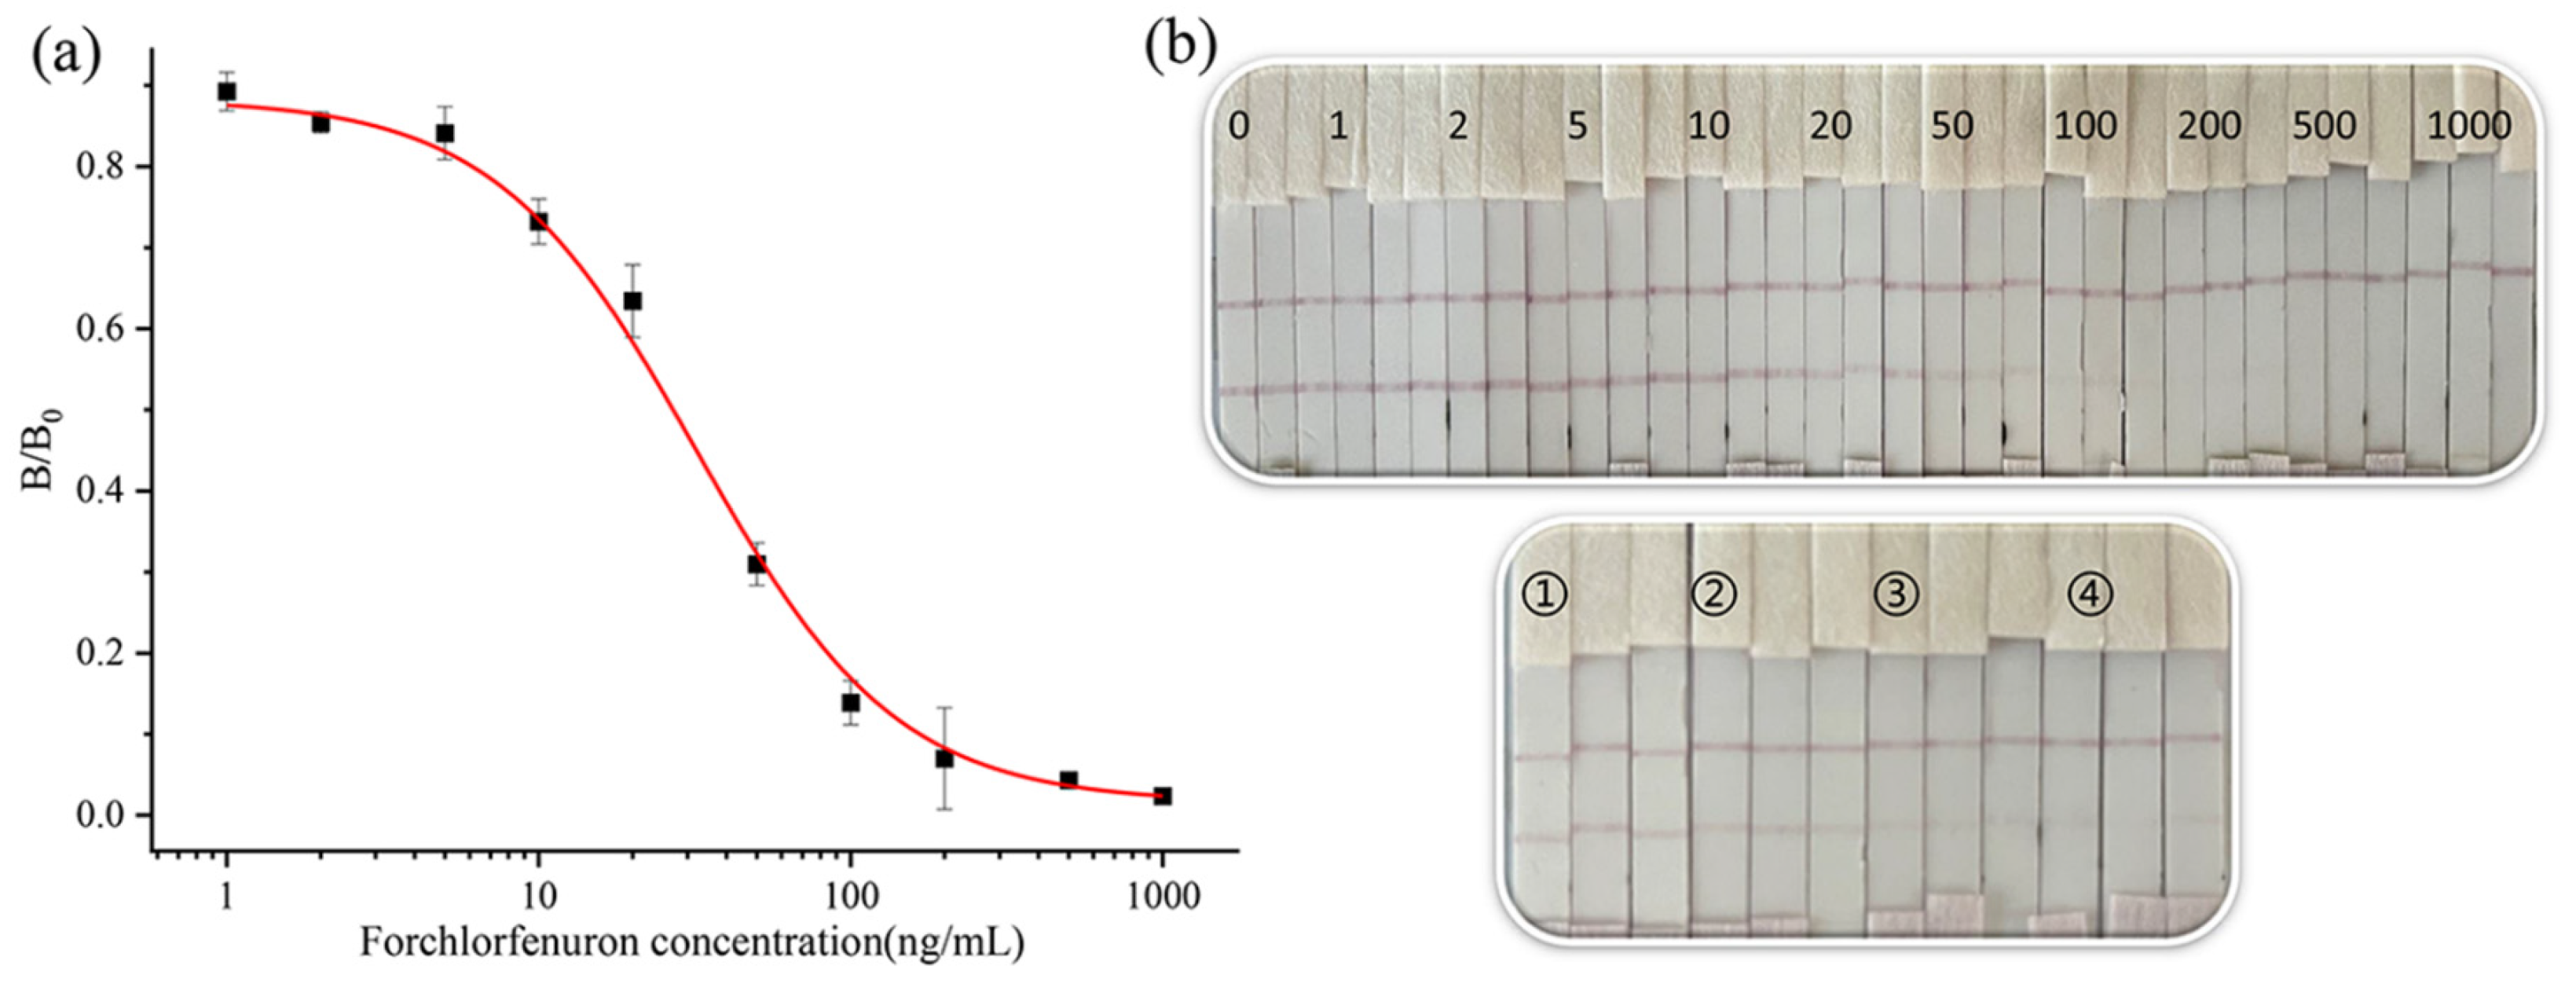
3.2.1. Optimization of the Strip Test
3.2.2. Strip Performance
3.3. Recovery
4. Conclusions
Supplementary Materials
Author Contributions
Funding
Institutional Review Board Statement
Informed Consent Statement
Data Availability Statement
Conflicts of Interest
References
- Arena; Auteri, D.; Barmaz, S.; Bellisai, G.; Brancato, A.; Brocca, D.; Byers, L.B.H.; Chiusolo, A.; Marques, D.C.; Crivellente, F.; et al. Peer Review of the Pesticide Risk Assessment of the Active Substance Forchlorfenuron. EFSA J. 2017, 15, 4874. [Google Scholar]
- Bi, Y.; Qiao, C.; Han, L.; Xie, H.; Xu, Y.; Wu, D.; Zhuang, M.; Lv, X.; Cao, M. Key metabolites and mechanistic insights in forchlorfenuron controlling kiwifruit development. Food Res. Int. 2023, 164, 112412. [Google Scholar] [CrossRef] [PubMed]
- Zhu, D.; Ping, L.; Shen, X.; Hong, Y.; Weng, Q.; He, Q.; Wang, J.; Wang, J. Effects of prepubertal exposure to forchlorfenuron through prenatal and postnatal gavage administration in developing Sprague-Dawley rats. Reprod. Toxicol. 2020, 98, 157–164. [Google Scholar] [CrossRef]
- Gong, G.; Kam, H.; Tse, Y.; Lee, S.M. Cardiotoxicity of forchlorfenuron (CPPU) in zebrafish (Danio rerio) and H9c2 cardiomyocytes. Chemosphere 2019, 235, 153–162. [Google Scholar] [CrossRef] [PubMed]
- Zhang, Z.; Guo, K.; Bai, Y.; Dong, J.; Gao, Z.; Yuan, Y.; Wang, Y.; Liu, L.; Yue, T. Identification, Synthesis, and Safety Assessment of Forchlorfenuron (1-(2-Chloro-4-pyridyl)-3-phenylurea) and Its Metabolites in Kiwifruits. J. Agric. Food Chem. 2015, 63, 3059–3066. [Google Scholar] [CrossRef]
- Bu, Q.; Wang, X.; Xie, H.; Zhong, K.; Wu, Y.; Zhang, J.; Wang, Z.; Gao, H.; Huang, Y. 180 Day Repeated-Dose Toxicity Study on Forchlorfenuron in Sprague–Dawley Rats and Its Effects on the Production of Steroid Hormones. J. Agric. Food Chem. 2019, 67, 10207–10213. [Google Scholar] [CrossRef] [PubMed]
- Ping, L.; Xu, B.; Zhou, Q.; Hong, Y.; Sun, Q.; Wang, J.; Zhu, D. Comparative Pharmacokinetic Study of Forchlorfenuron in Adult and Juvenile Rats. Molecules 2021, 26, 4276. [Google Scholar] [CrossRef]
- Li, P.; Lu, Y.; Cao, J.; Li, M.; Yang, C.; Yan, H. Imidazolium ionic-liquid-modified phenolic resin for solid-phase extraction of thidiazuron and forchlorfenuron from cucumbers. J. Chromatogr. A 2020, 1623, 461192. [Google Scholar] [CrossRef]
- Tran, K.; Eide, D.; Nickols, S.M.; Cromer, M.R.; Sabaa-Srur, A.; Smith, R.E. Finding of Pesticides in Fashionable Fruit Juices by Lc-Ms/Ms and Gc-Ms/Ms. Food Chem. 2012, 134, 2398–2405. [Google Scholar] [CrossRef]
- Ren, Y.; Xiang, P.; Xie, Q.; Yang, H.; Liu, S. Rapid analysis of forchlorfenuron in fruits using molecular complex-based dispersive liquid–liquid microextraction. Food Addit. Contam. Part A 2021, 38, 637–645. [Google Scholar] [CrossRef]
- Sack, C.; Smoker, M.; Chamkasem, N.; Thompson, R.; Satterfield, G.; Masse, C.; Mercer, G.; Neuhaus, B.; Cassias, I.; Chang, E.; et al. Collaborative Validation of the QuEChERS Procedure for the Determination of Pesticides in Food by LC–MS/MS. J. Agric. Food Chem. 2011, 59, 6383–6411. [Google Scholar] [CrossRef] [PubMed]
- Sharma, N.; Sharma, S.; Mandal, K. Validation of simple and efficient analytical methodology for estimation of forchlorfenuron residues. Environ. Monit. Assess. 2022, 195, 68. [Google Scholar] [CrossRef] [PubMed]
- Xu, X.; Hou, X.; Han, M.; Qiu, S.; Li, Y. Simultaneous determination of multiclass plant growth regulators in fruits using the quick, easy, cheap, effective, rugged, and safe method and ultra-high performance liquid chromatography-tandem mass spectrometry. J. Sep. Sci. 2019, 43, 788–798. [Google Scholar] [CrossRef] [PubMed]
- Chen, X.; Yan, K.; Xiao, X.; Li, G. Analysis of Forchlorfenuron and Thidiazuron in Fruits and Vegetables by Surface-Enhanced Raman Spectroscopy after Selective Solid-Phase Extraction with Modified Beta-Cyclodextrin. J. Sep. Sci. 2016, 39, 2340–2346. [Google Scholar] [CrossRef] [PubMed]
- Orellana-Silla, A.; Armenta, S.; de la Guardia, M.; Mercader, J.V.; Esteve-Turrillas, F.A. Development of immunosorbents for the analysis of forchlorfenuron in fruit juices by ion mobility spectrometry. Anal. Bioanal. Chem. 2018, 410, 5961–5967. [Google Scholar] [CrossRef]
- Liu, X.; Xie, B.; Cheng, Y.; Luo, L.; Liang, Y.; Xiao, Z. A Sensitive Monoclonal-Antibody-Based ELISA for Forchlorfenuron Residue Analysis in Food Samples. Biosensors 2022, 12, 78. [Google Scholar] [CrossRef] [PubMed]
- Suárez-Pantaleón, C.; Esteve-Turrillas, F.; Mercader, J.V.; Agulló, C.; Somovilla, A.A.; Abad-Fuentes, A. Development and validation of a direct competitive monoclonal antibody-based immunoassay for the sensitive and selective analysis of the phytoregulator forchlorfenuron. Anal. Bioanal. Chem. 2012, 403, 2019–2026. [Google Scholar] [CrossRef]
- Suárez-Pantaleón, C.; Mercader, J.V.; Agulló, C.; Abad-Somovilla, A.; Abad-Fuentes, A. Hapten Synthesis and Polyclonal Antibody-Based Immunoassay Development for the Analysis of Forchlorfenuron in Kiwifruit. J. Agric. Food Chem. 2010, 58, 8502–8511. [Google Scholar] [CrossRef] [PubMed]
- Suárez-Pantaleón, C.; Wichers, J.; Somovilla, A.A.; van Amerongen, A.; Abad-Fuentes, A. Development of an immunochromatographic assay based on carbon nanoparticles for the determination of the phytoregulator forchlorfenuron. Biosens. Bioelectron. 2013, 42, 170–176. [Google Scholar] [CrossRef]
- Xiao, S.M. The Establishment of Gold Nanoparticles-Colorimetric and Immunoassay Analysis Method on Detection of Pesticide Residues in Environment and Food. Master’s Thesis, Nanchang University, Nanchang, China, 2017. [Google Scholar]
- Lu, J.-k.; Ai, M.-y.; Li, S.-g. Preparation of Anti-CPPU Monoclonal Antibody and Development of an Indirect Competitive ELISA Method. Hubei Agric. Sci. 2016, 55, 5584–5587. [Google Scholar]
- Lin, L.; Wu, X.; Cui, G.; Song, S.; Kuang, H.; Xu, C. Colloidal Gold Immunochromatographic Strip Assay for the Detection of Azaperone in Pork and Pork Liver. ACS Omega 2020, 5, 1346–1351. [Google Scholar] [CrossRef] [PubMed]
- Yu, J.; Lin, Y.; Cao, Y.; Li, X.; Liao, D.; Ye, Y.; Pan, M.; Ye, J.; Wei, Y.; Xiao, L.; et al. Development and application of a colloidal gold test strip for the rapid detection of the infectious laryngotracheitis virus. Poult. Sci. 2020, 99, 2407–2415. [Google Scholar] [CrossRef] [PubMed]
- Lan, J.; Sun, W.; Chen, L.; Zhou, H.; Fan, Y.; Diao, X.; Wang, B.; Zhao, H. Simultaneous and rapid detection of carbofuran and 3-hydroxy-carbofuran in water samples and pesticide preparations using lateral-flow immunochromatographic assay. Food Agric. Immunol. 2020, 31, 165–175. [Google Scholar] [CrossRef]
- Xie, Y.; Kou, Q.; Sun, Q.; Wang, Y.; Cao, Y.; Le, T. Development and validation of an immunochromatography test strip for rapid detection of pyrimethanil residues. Food Agric. Immunol. 2020, 31, 393–405. [Google Scholar] [CrossRef]
- Liu, J.; Xu, X.; Wu, A.; Wang, Z.; Song, S.; Kuang, H.; Liu, L.; Xu, C. Preparing monoclonal antibodies and developing immunochromatographic assay strips for the determination of propamocarb levels. Food Chem. 2022, 370, 131284. [Google Scholar] [CrossRef]
- Yang, X.; Zhang, G.; Wang, F.; Wang, Y.; Hu, X.; Li, Q.; Jia, G.; Liu, Z.; Wang, Y.; Deng, R.; et al. Development of a colloidal gold-based strip test for the detection of chlorothalonil residues in cucumber. Food Agric. Immunol. 2015, 26, 729–737. [Google Scholar] [CrossRef]
- Zaroff, S.; Tan, G. Hybridoma technology: The preferred method for monoclonal antibody generation for in vivo applications. Biotechniques 2019, 67, 90–92. [Google Scholar] [CrossRef] [PubMed]
- Holzlohner, P.; Hanack, K. Generation of Murine Monoclonal Antibodies by Hybridoma Technology. J. Vis. Exp. 2017, 119, 54832. [Google Scholar]
- Xu, L.; El-Aty, A.A.; Shim, J.-H.; Eun, J.-B.; Lei, X.; Zhao, J.; Zhang, X.; Cui, X.; She, Y.; Jin, F.; et al. Design and Characterization of a Novel Hapten and Preparation of Monoclonal Antibody for Detecting Atrazine. Foods 2022, 11, 1726. [Google Scholar] [CrossRef]
- Browne, S.M.; Al-Rubeai, M. Selection methods for high-producing mammalian cell lines. Trends Biotechnol. 2007, 25, 425–432. [Google Scholar] [CrossRef]
- Tan, G.; Zhao, Y.; Wang, M.; Chen, X.; Wang, B.; Li, Q.X. Ultrasensitive quantitation of imidacloprid in vegetables by colloidal gold and time-resolved fluorescent nanobead traced lateral flow immunoassays. Food Chem. 2019, 311, 126055. [Google Scholar] [CrossRef] [PubMed]
- Yao, J.; Wang, Z.; Guo, L.; Xu, X.; Liu, L.; Kuang, H.; Xu, C. Lateral flow immunoassay for the simultaneous detection of fipronil and its metabolites in food samples. Food Chem. 2021, 356, 129710. [Google Scholar] [CrossRef] [PubMed]
- Yang, X.; Yang, J.; Wang, Y.; Li, L.; Sun, Z.; Yue, Z.; Tian, F.; He, L.; Hu, X. A Lateral Flow Immunochromato-graphic Strip Test for Rapid Detection of Oseltamivir Phosphate in Egg and Chicken Meat. Sci. Rep. 2018, 8, 16680. [Google Scholar] [CrossRef] [Green Version]
- Zeng, L.; Wu, X.; Liu, L.; Xu, L.; Kuang, H.; Xu, C. Production of a monoclonal antibody for the detection of vitamin B1 and its use in an indirect enzyme-linked immunosorbent assay and immunochromatographic strip. J. Mater. Chem. B 2020, 8, 1935–1943. [Google Scholar] [CrossRef] [PubMed]
- Lima, L.M.; Barreiro, E.J. Bioisosterism: A Useful Strategy for Molecular Modification and Drug Design. Curr. Med. Chem. 2005, 12, 23–49. [Google Scholar] [CrossRef]
- Suárez-Pantaleón, C.; Mercader, J.V.; Agulló, C.; Abad-Somovilla, A.; Abad-Fuentes, A. Forchlorfenuron-mimicking haptens: From immunogen design to antibody characterization by hierarchical clustering analysis. Org. Biomol. Chem. 2011, 9, 4863–4872. [Google Scholar] [CrossRef] [Green Version]


| (A) Characterization Results of the CPPU Immunogen. | |||
| Feeding Ratio of Hapten to a Carrier Protein | Molecular Weight of Hapten-BSA (Da) | Mass Change ∆m (Da) | Actual Coupling Ratio of Hapten-BSA |
| 40:1 | 73,072.926 | 5855.61 | 16.84 |
| 50:1 | 74,068.026 | 6850.71 | 19.70 |
| 60:1 | 74,064.552 | 6847.24 | 19.69 |
| (B) Characterization Results of the CPPU Coating Antigen | |||
| Feeding Ratio of Hapten to a Carrier Protein | Molecular Weight of Hapten-OVA (Da) | Mass Change ∆m (Da) | Actual Coupling Ratio of Hapten-OVA |
| 40:1 | 45,551.489 | 921.21 | 2.65 |
| 50:1 | 45,780.576 | 1150.30 | 3.31 |
| 60:1 | 45,829.570 | 1199.29 | 3.45 |
| IC50 (ng/mL) | Reference |
|---|---|
| 0.19 | In this work |
| 1.04 | [16] |
| 48 | [20] |
| Analytes | Chemical Structure | IC50 (ng/mL) | Cross-Reactivity (%) |
|---|---|---|---|
| Forchlorfenuron | 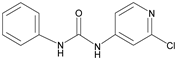 | 0.19 | 100 |
| Thidiazuron | 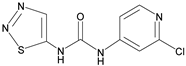 | 0.94 | 20.2 |
| Diuron | 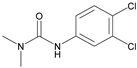 | 25,500 | <0.01 |
| Linuron | 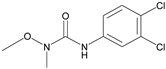 | - | <0.01 |
| Clopyralid |  | - | <0.01 |
| Clofentezine | 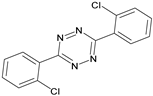 | - | <0.01 |
| Gibberellic acid | 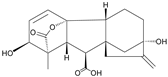 | - | <0.01 |
| Sample | Fortified (ng/g) | ic-ELISA | CGN-ICTS | LC-MS/MS | ||||||
|---|---|---|---|---|---|---|---|---|---|---|
| Detected (ng/g) | Recovery (%) | RSD (%) | Detected (ng/g) | Recovery (%) | RSD (%) | Detected (ng/g) | Recovery (%) | RSD (%) | ||
| cucumber | 0 | ND | - | - | Negative | - | - | ND | - | - |
| 100 | 72 | 72 | 5.7 | 68 | 68 | 7.1 | 85 | 85 | 1.7 | |
| 200 | 140 | 70 | 1.7 | 165 | 82 | 3.7 | 184 | 92 | 0.4 | |
| 500 | 426 | 85 | 2.4 | 387 | 77 | 7.9 | 418 | 84 | 0.5 | |
| 1000 | 1035 | 104 | 5.2 | 712 | 71 | 7.6 | 852 | 85 | 1.1 | |
Disclaimer/Publisher’s Note: The statements, opinions and data contained in all publications are solely those of the individual author(s) and contributor(s) and not of MDPI and/or the editor(s). MDPI and/or the editor(s) disclaim responsibility for any injury to people or property resulting from any ideas, methods, instructions or products referred to in the content. |
© 2023 by the authors. Licensee MDPI, Basel, Switzerland. This article is an open access article distributed under the terms and conditions of the Creative Commons Attribution (CC BY) license (https://creativecommons.org/licenses/by/4.0/).
Share and Cite
Lei, X.; Abd El-Aty, A.M.; Xu, L.; Zhao, J.; Li, J.; Gao, S.; Zhao, Y.; She, Y.; Jin, F.; Wang, J.; et al. Production of a Monoclonal Antibody for the Detection of Forchlorfenuron: Application in an Indirect Enzyme-Linked Immunosorbent Assay and Immunochromatographic Strip. Biosensors 2023, 13, 239. https://doi.org/10.3390/bios13020239
Lei X, Abd El-Aty AM, Xu L, Zhao J, Li J, Gao S, Zhao Y, She Y, Jin F, Wang J, et al. Production of a Monoclonal Antibody for the Detection of Forchlorfenuron: Application in an Indirect Enzyme-Linked Immunosorbent Assay and Immunochromatographic Strip. Biosensors. 2023; 13(2):239. https://doi.org/10.3390/bios13020239
Chicago/Turabian StyleLei, Xingmei, A. M. Abd El-Aty, Lingyuan Xu, Jing Zhao, Jia Li, Song Gao, Yun Zhao, Yongxin She, Fen Jin, Jing Wang, and et al. 2023. "Production of a Monoclonal Antibody for the Detection of Forchlorfenuron: Application in an Indirect Enzyme-Linked Immunosorbent Assay and Immunochromatographic Strip" Biosensors 13, no. 2: 239. https://doi.org/10.3390/bios13020239