Low-Cost Arduino Reverse Transcriptase Loop-Mediated Isothermal Amplification (RT-LAMP) for Sensitive Nucleic Acid Detection

 , , , , , ,
Abstract
:1. Introduction
2. Materials and Methods
2.1. Samples and Ethical Statement
2.2. RT-LAMP Block Device
2.3. Hardware
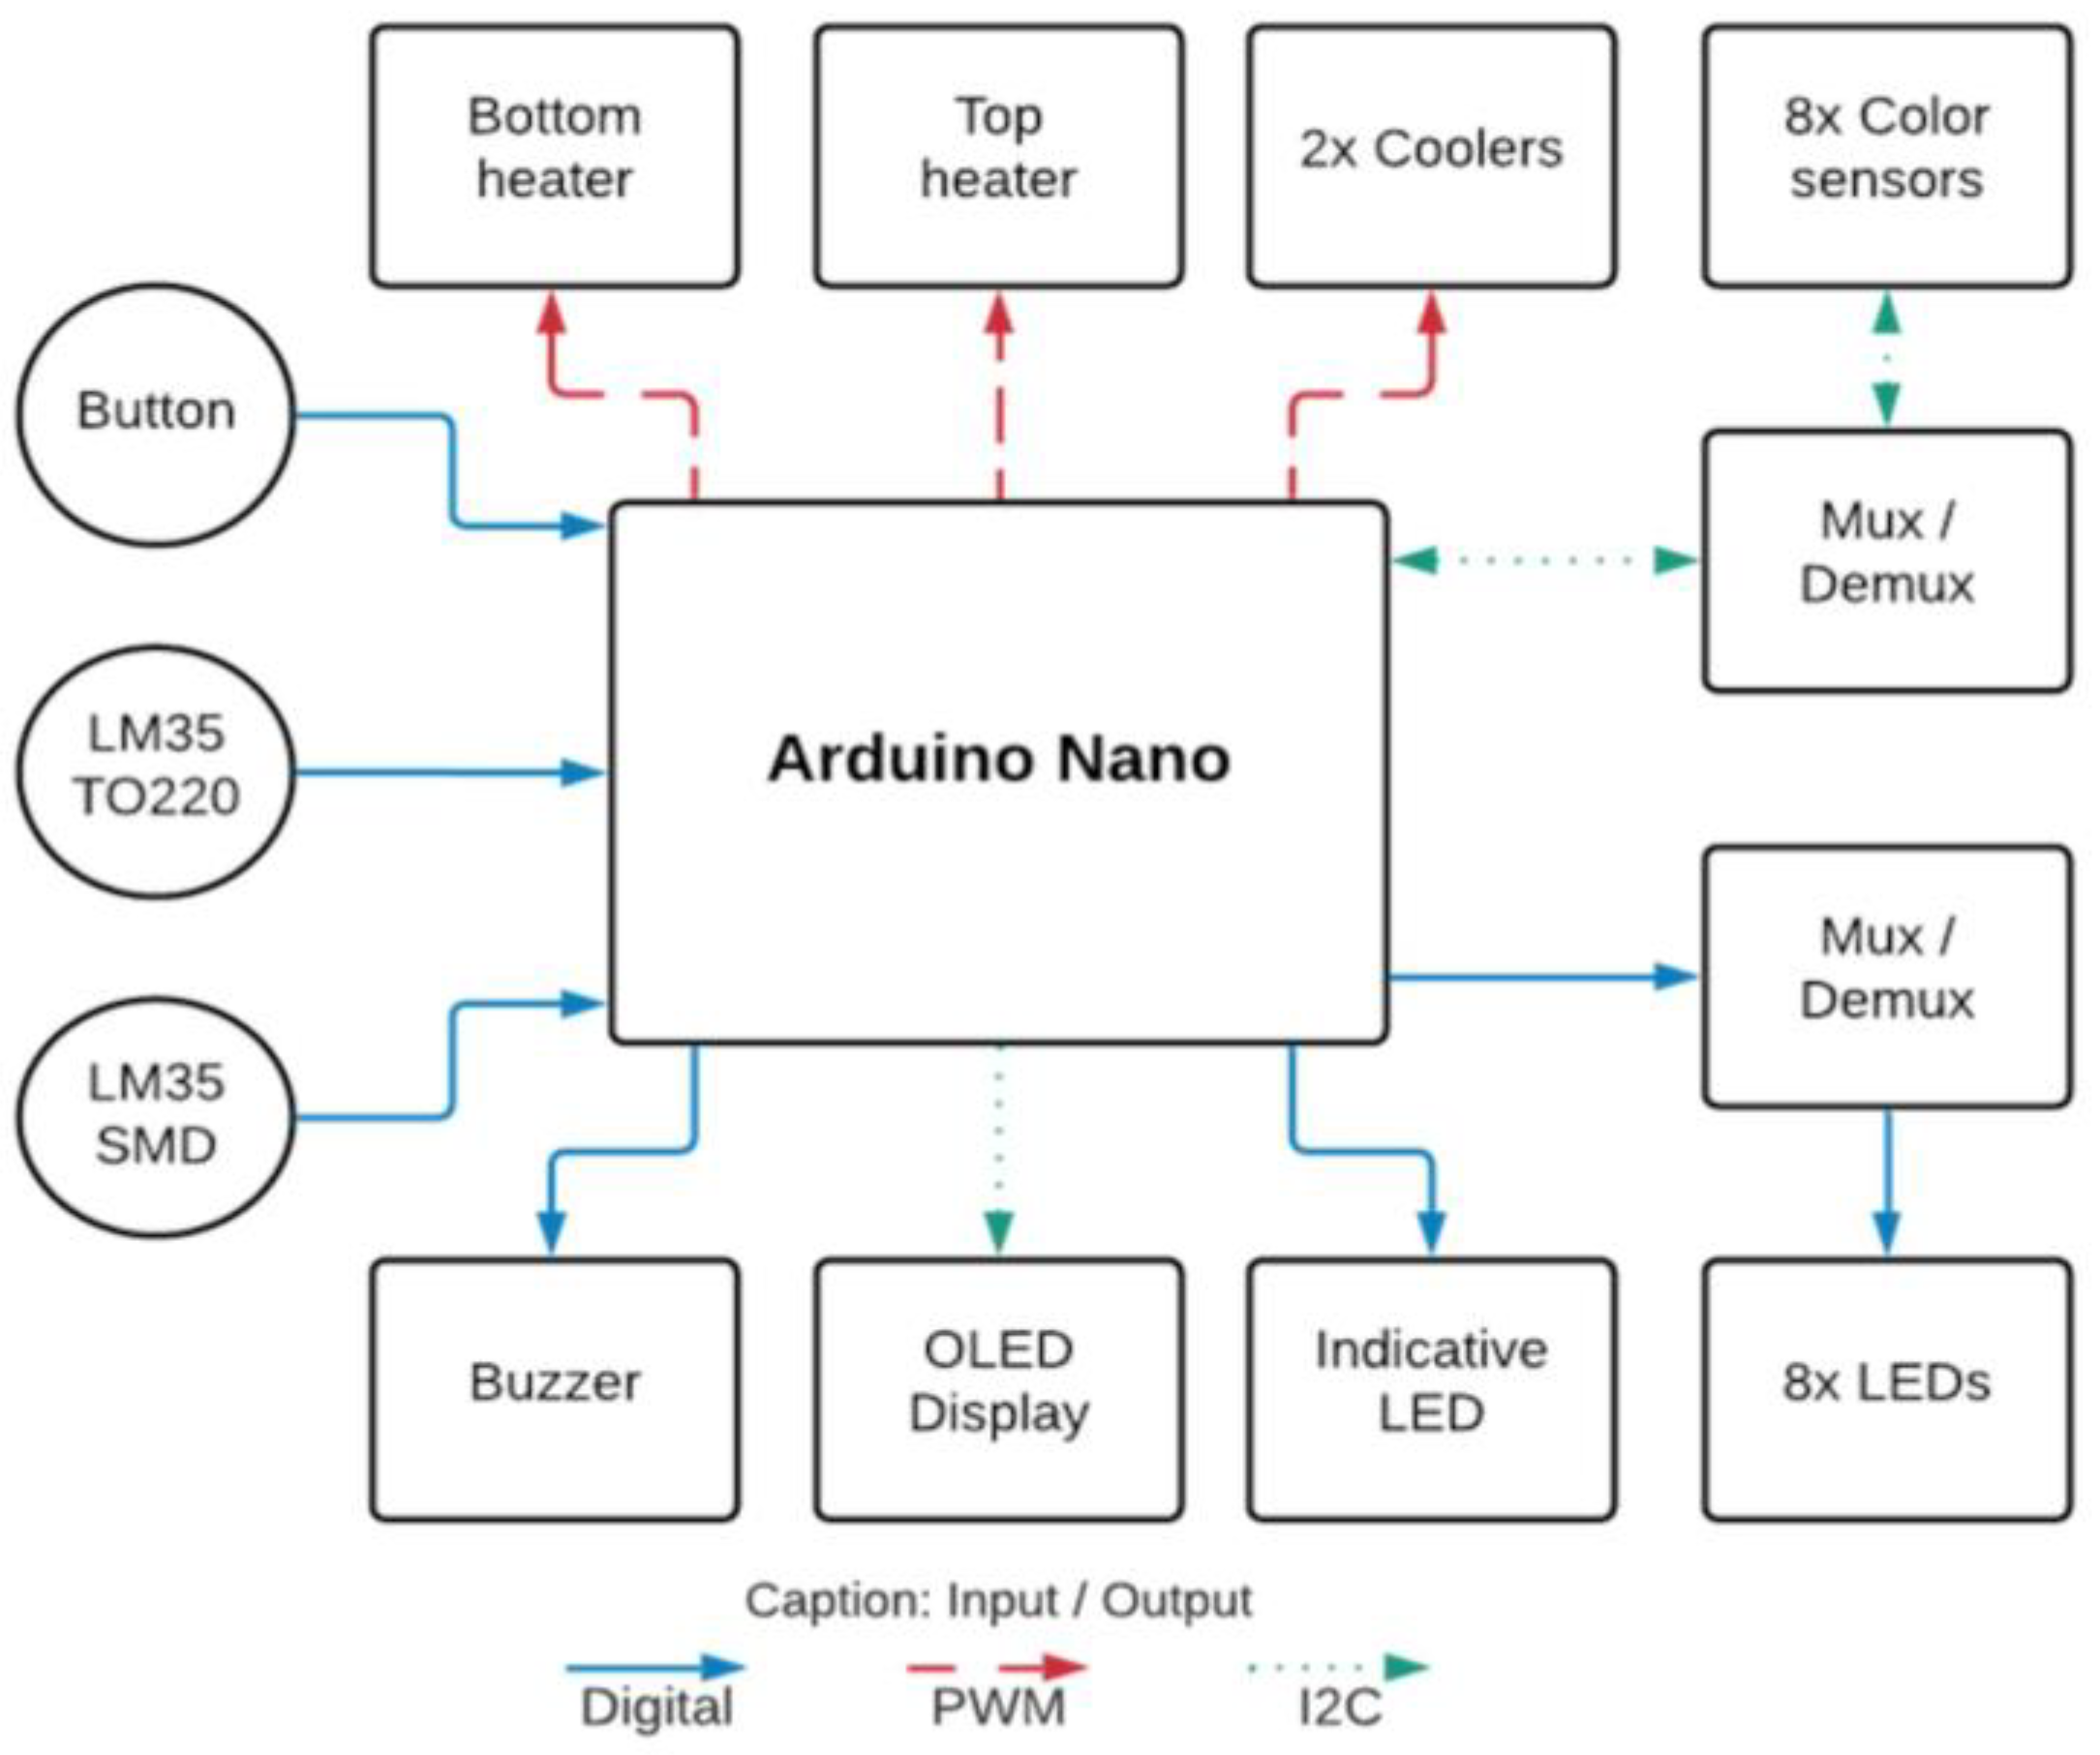
2.4. Electronics
2.5. Software and Data Processing
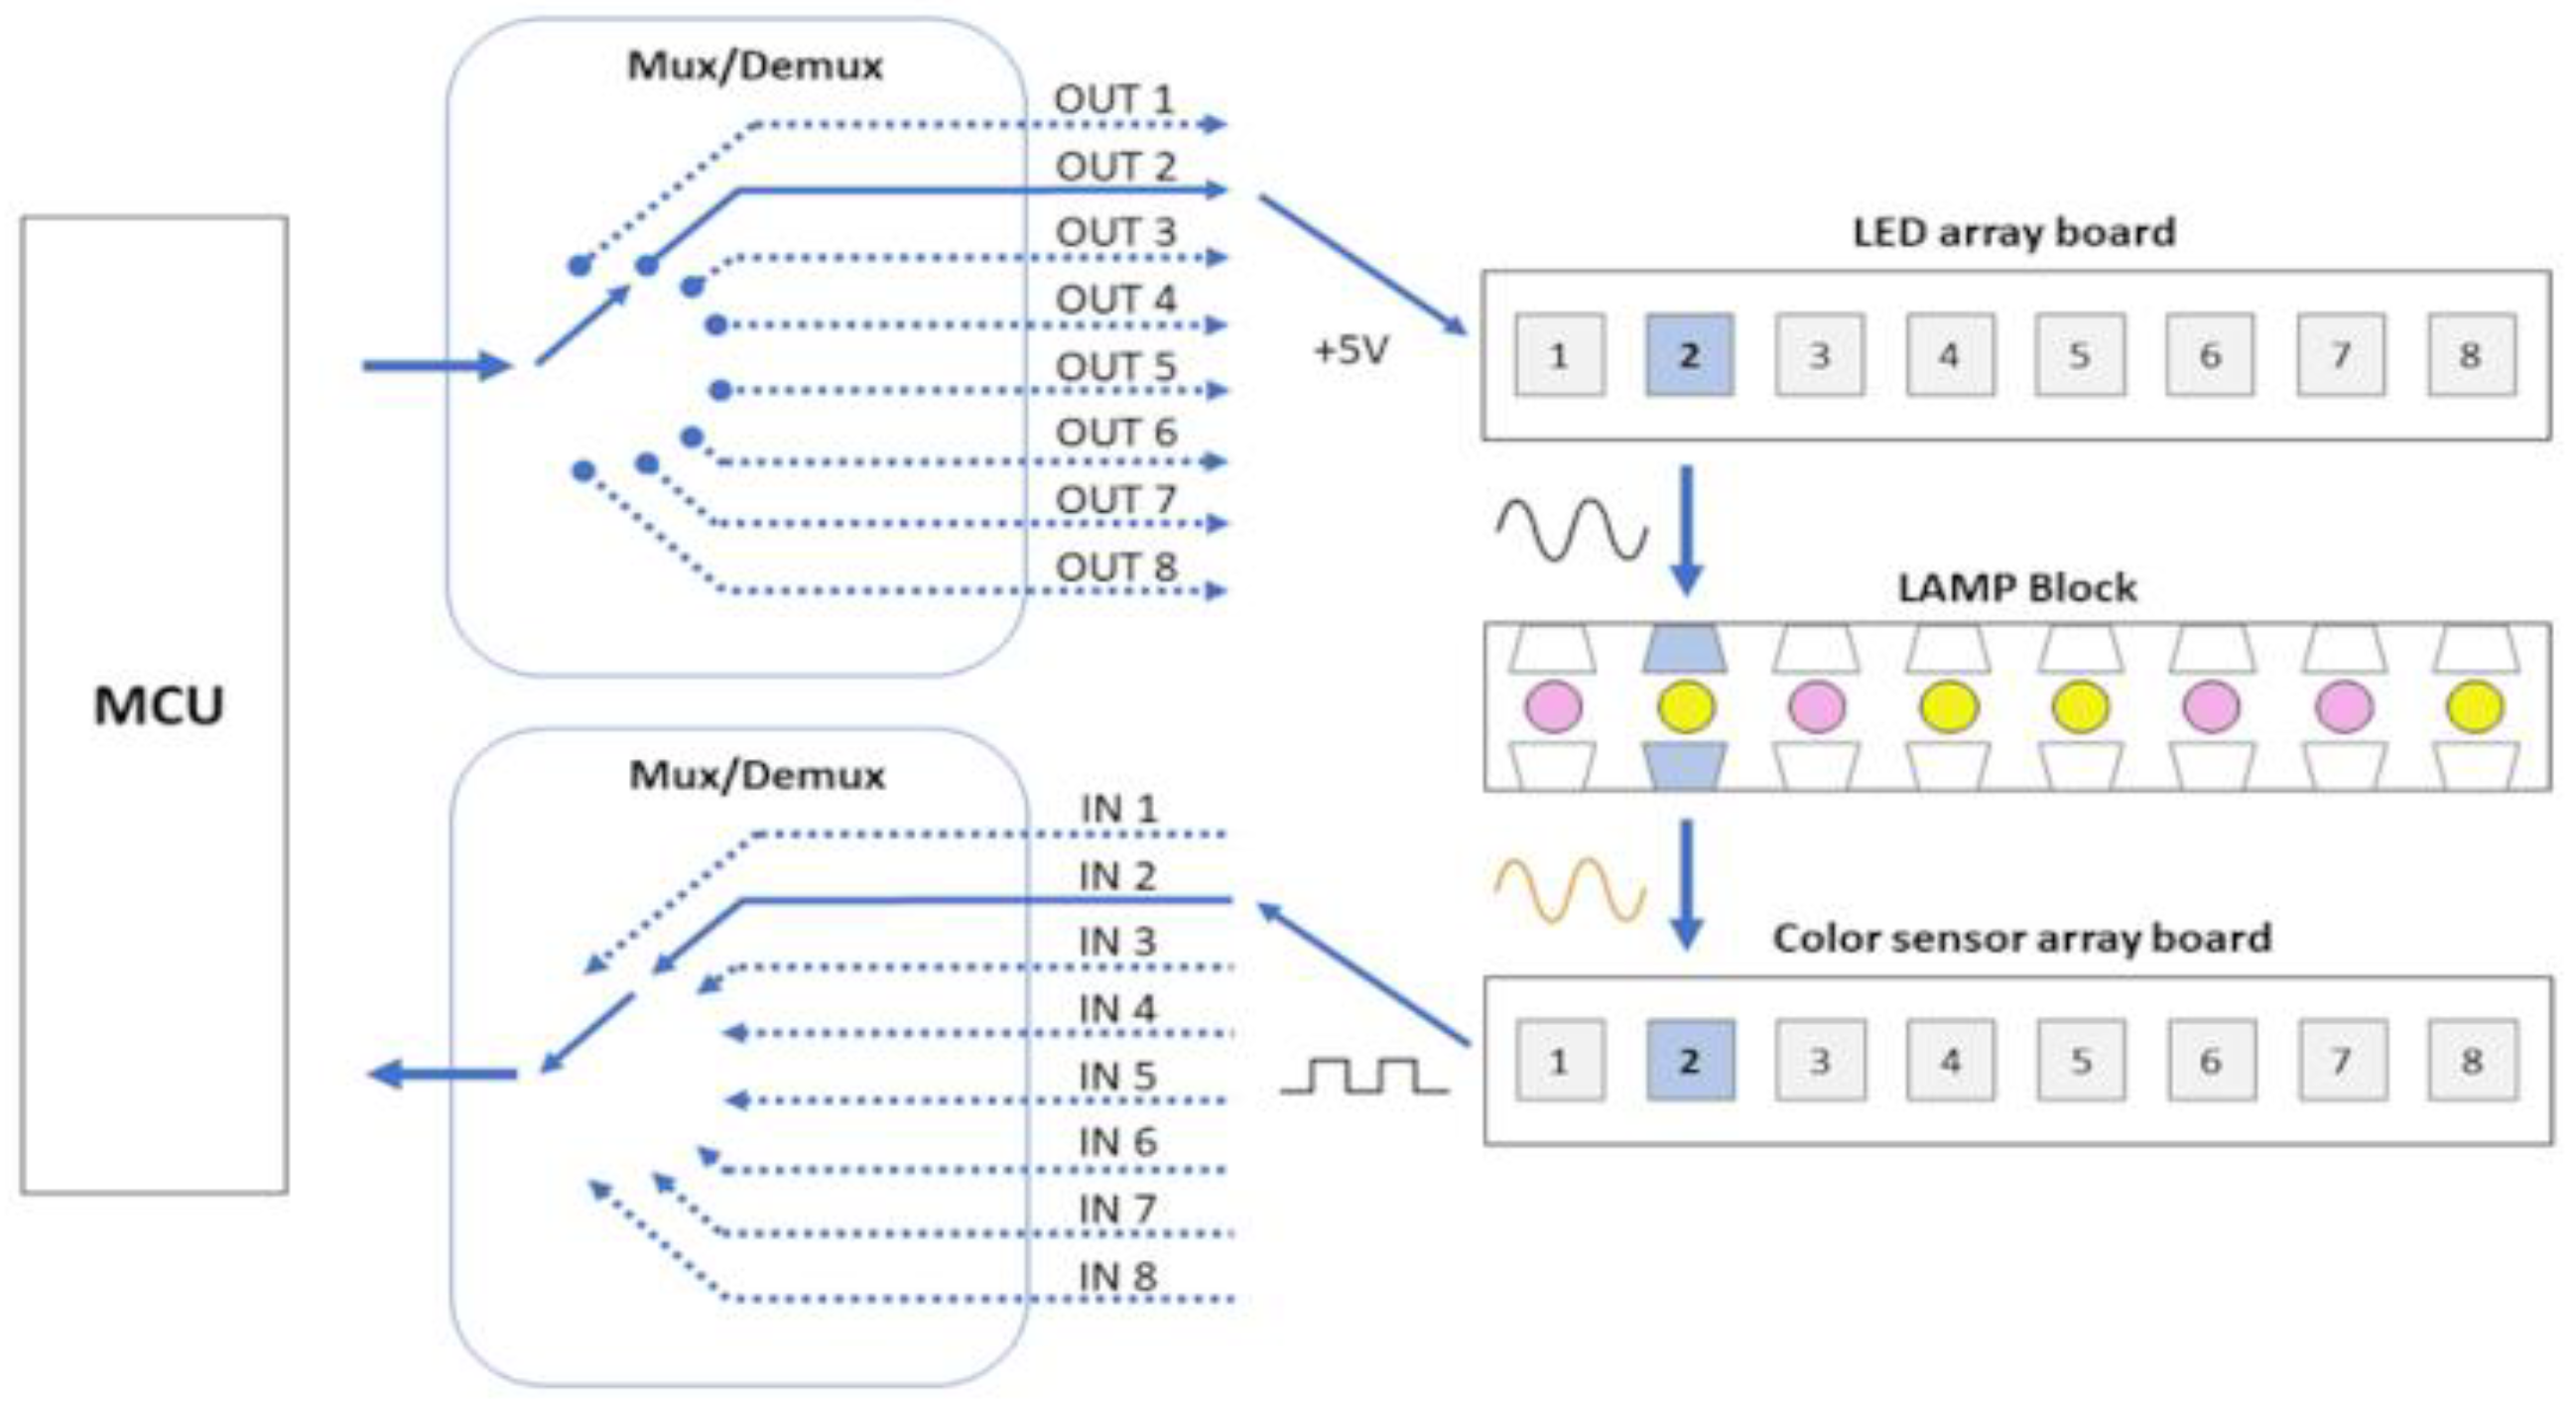
2.6. Colour Detection
2.7. RT-LAMP Reaction
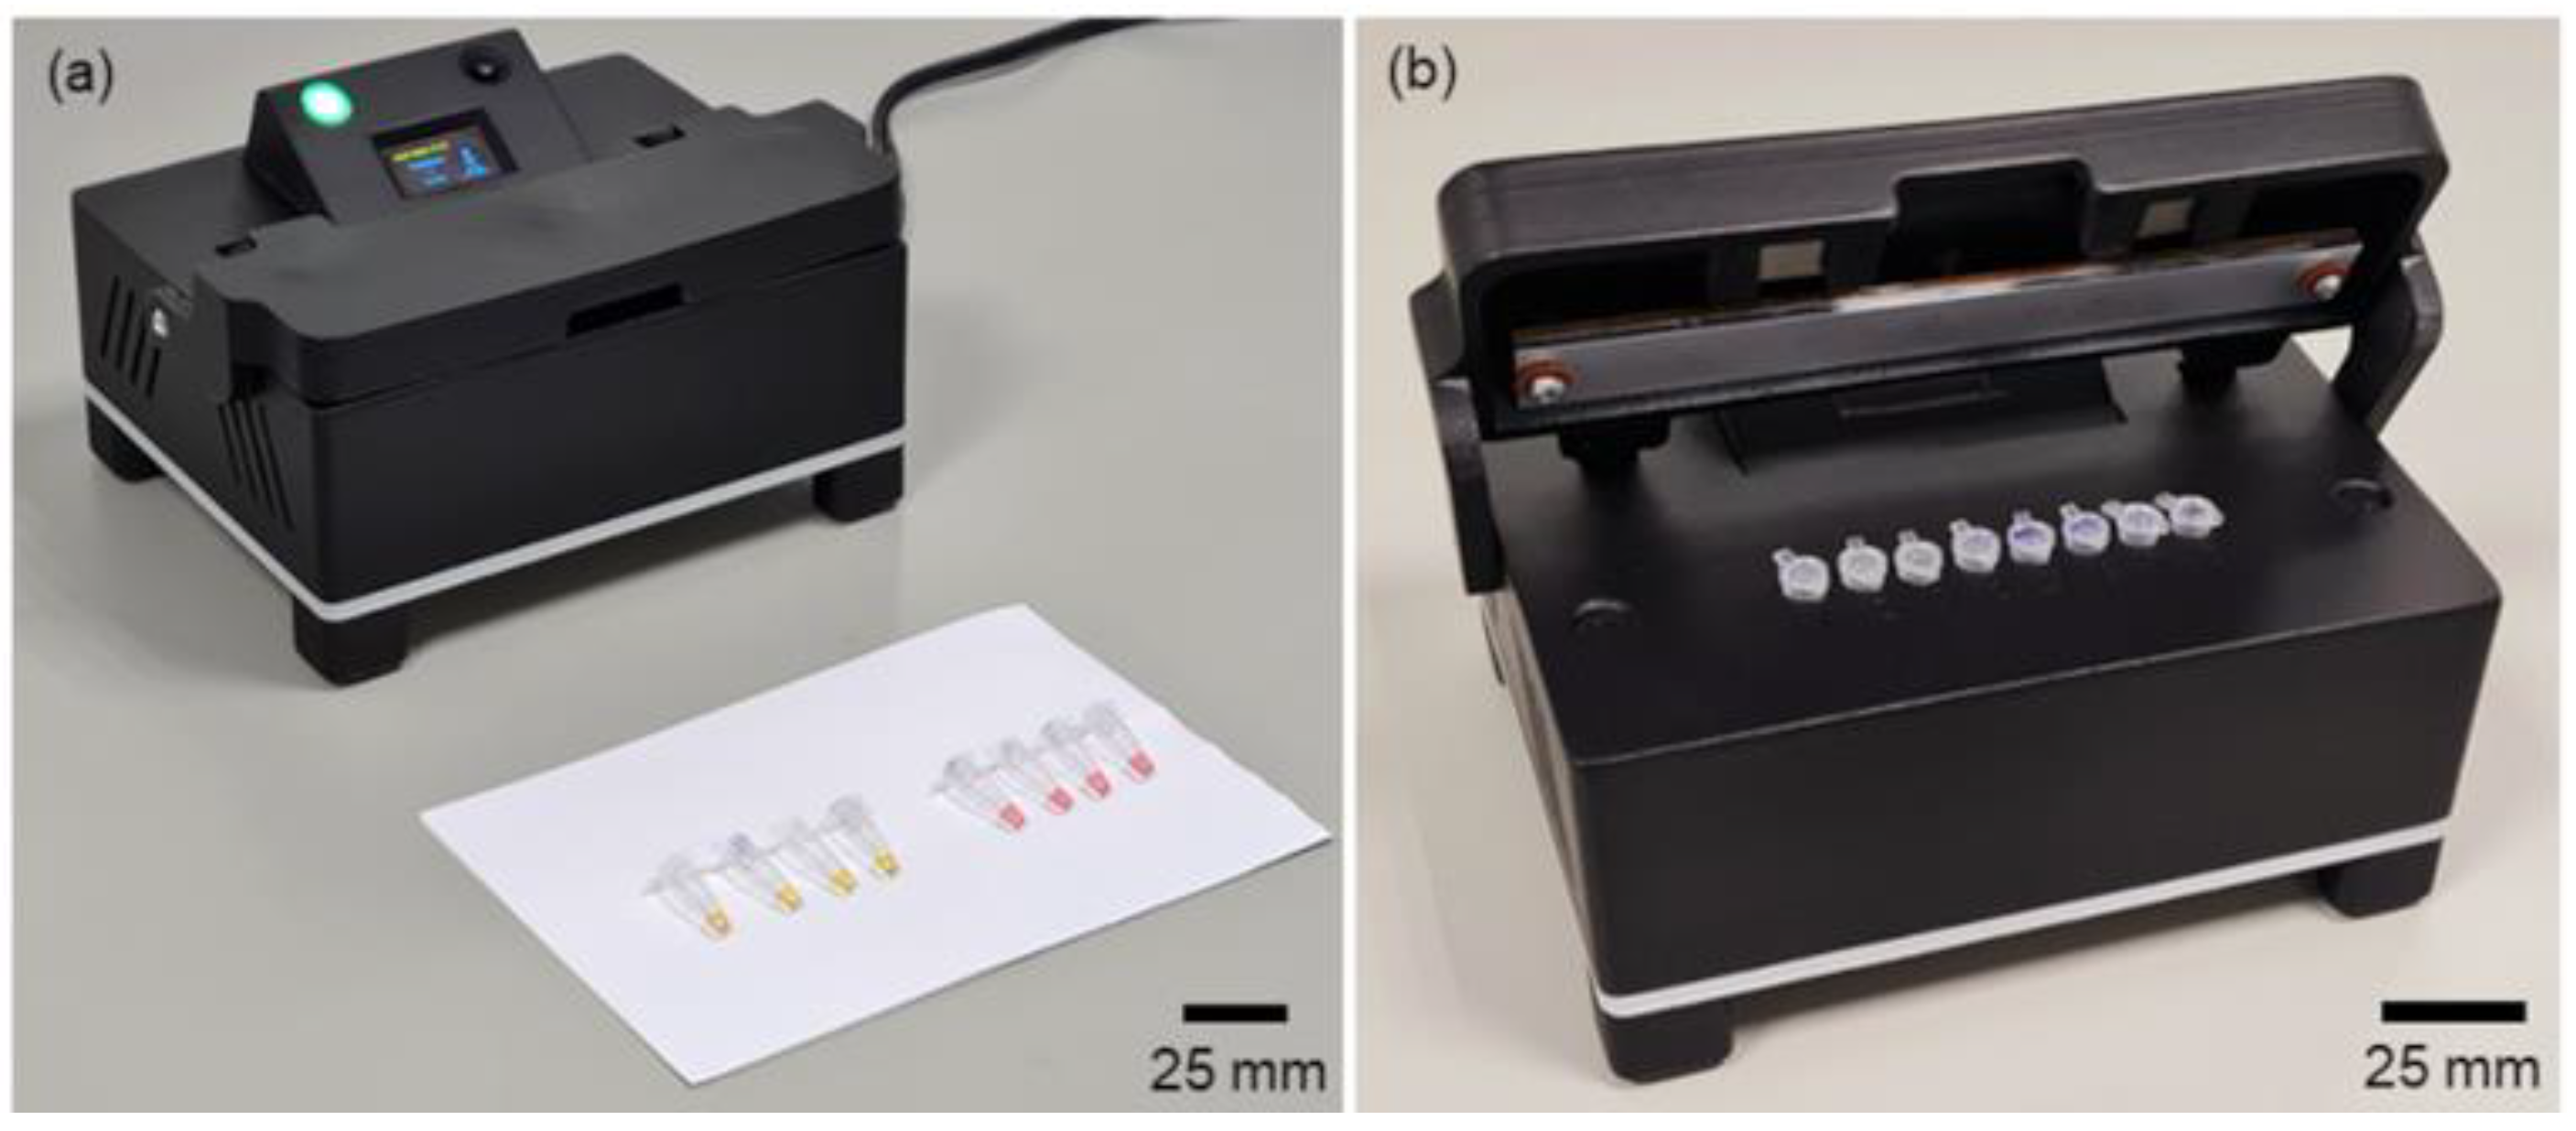
2.8. Housing
3. Results and Discussion
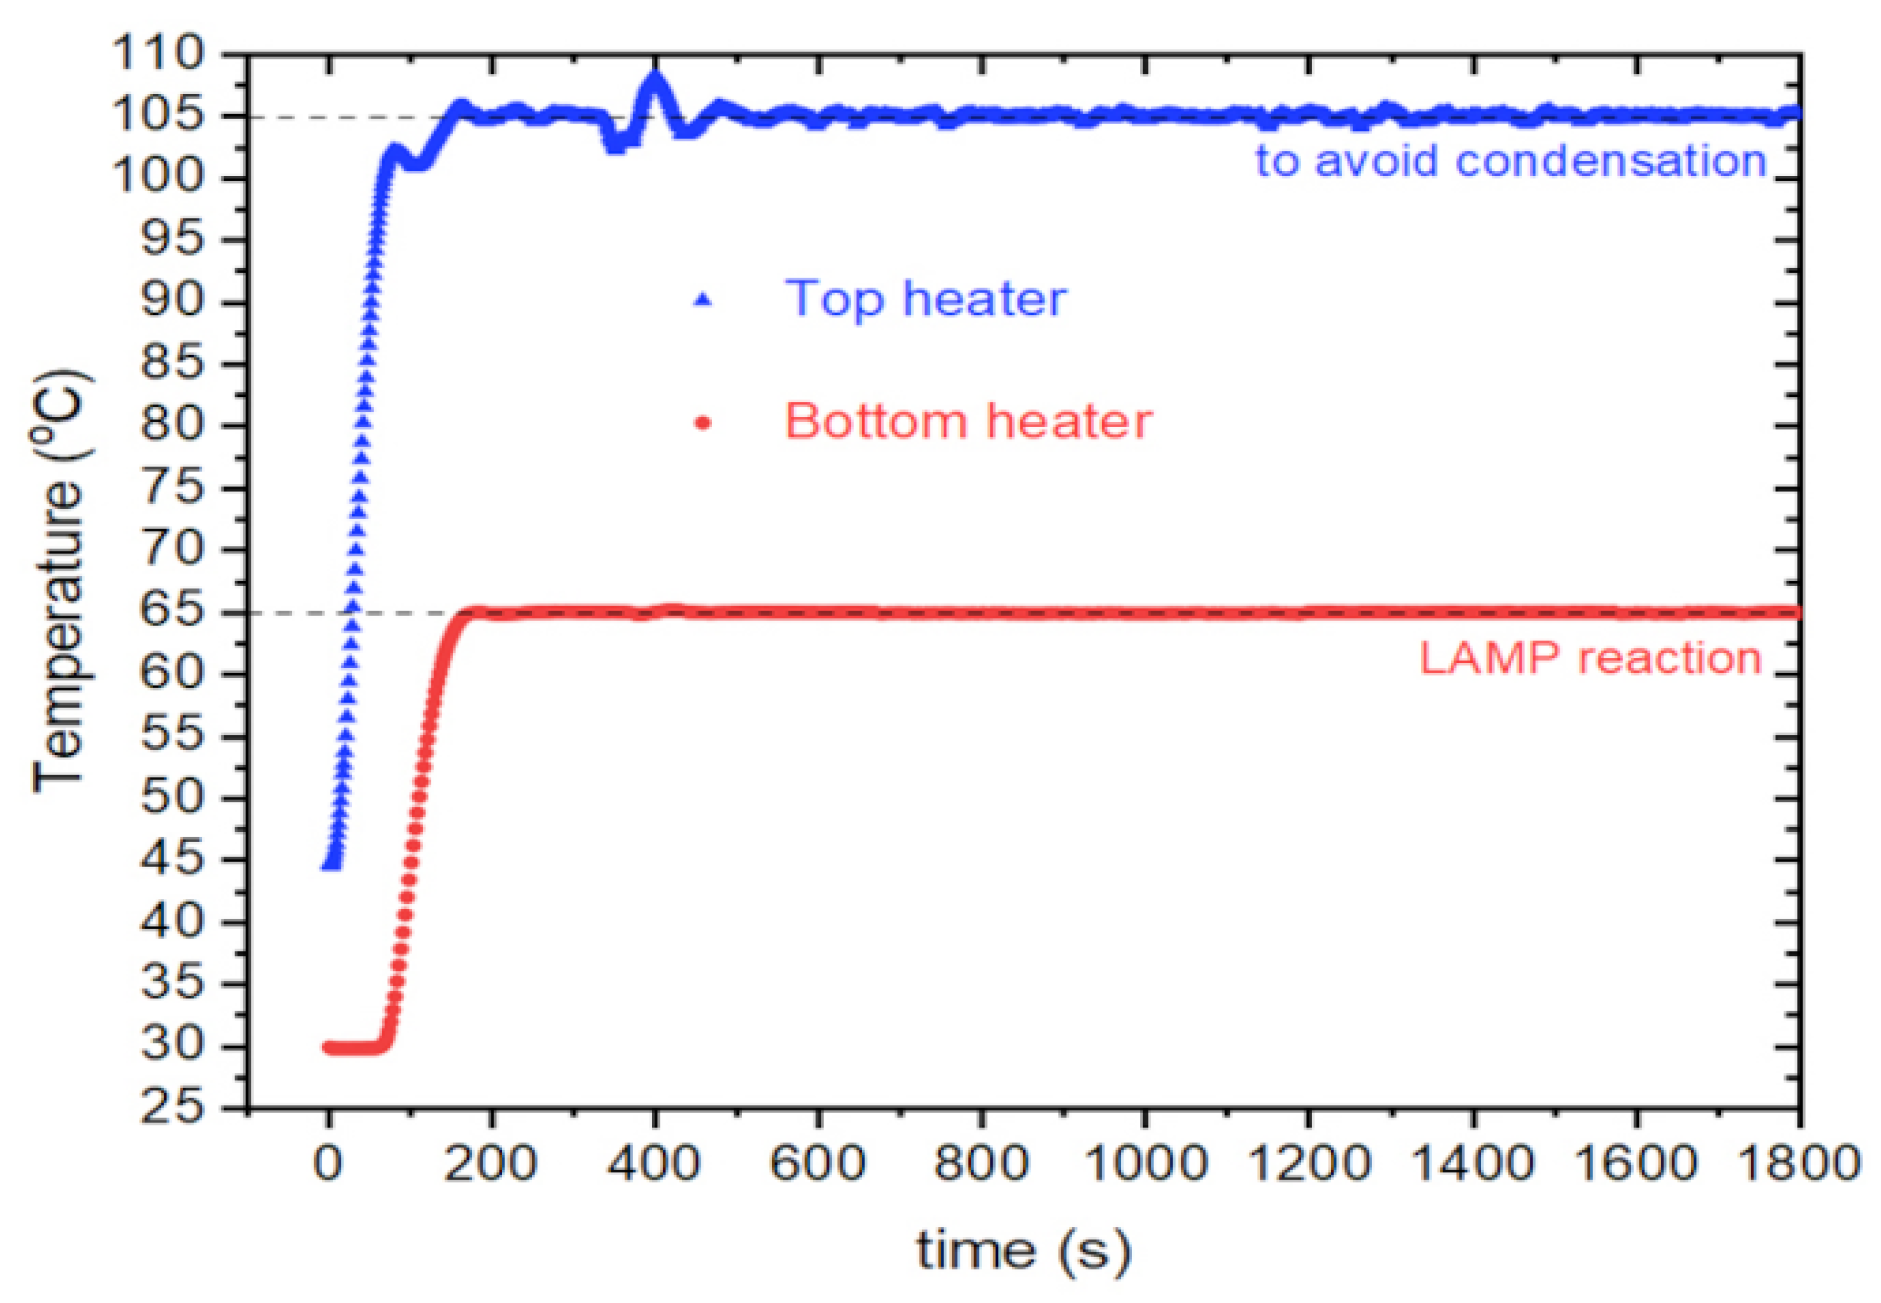
3.1. Temperature Control
3.2. Colorimetric Detection and Sample Analysis
4. Conclusions
Supplementary Materials
Author Contributions
Funding
Institutional Review Board Statement
Informed Consent Statement
Data Availability Statement
Acknowledgments
Conflicts of Interest
References
- Oliveira, B.B.; Veigas, B.; Baptista, P.V. Isothermal Amplification of Nucleic Acids: The Race for the Next “Gold Standard”. Front. Sens. 2021, 2, 752600. Available online: https://www.frontiersin.org/articles/10.3389/fsens.2021.752600 (accessed on 20 March 2023). [CrossRef]
- You, M.; Li, Z.; Feng, S.; Gao, B.; Yao, C.; Hu, J.; Xu, F. Ultrafast Photonic PCR Based on Photothermal Nanomaterials. Trends Biotechnol. 2020, 38, 637–649. [Google Scholar] [CrossRef] [PubMed]
- Afzal, A. Molecular diagnostic technologies for COVID-19: Limitations and challenges. J. Adv. Res. 2020, 26, 149–159. [Google Scholar] [CrossRef]
- Manmana, Y.; Kubo, T.; Otsuka, K. Recent developments of point-of-care (POC) testing platform for biomolecules. TrAC Trends Anal. Chem. 2021, 135, 116160. [Google Scholar] [CrossRef]
- Kang, T.; Lu, J.; Yu, T.; Long, Y.; Liu, G. Advances in nucleic acid amplification techniques (NAATs): COVID-19 point-of-care diagnostics as an example. Biosens. Bioelectron. 2022, 206, 114109. [Google Scholar] [CrossRef]
- Chaouch, M. Loop-mediated isothermal amplification (LAMP): An effective molecular point-of-care technique for the rapid diagnosis of coronavirus SARS-CoV-2. Rev. Med. Virol. 2021, 31, e2215. [Google Scholar] [CrossRef] [PubMed]
- Njiru, Z.K.; Mikosza, A.S.J.; Armstrong, T.; Enyaru, J.C.; Ndung’u, J.M.; Thompson, A.R.C. Loop-Mediated Isothermal Amplification (LAMP) Method for Rapid Detection of Trypanosoma brucei rhodesiense. PLoS Neglected Trop. Dis. 2008, 2, e147. [Google Scholar] [CrossRef]
- Thi, V.L.; Herbst, K.; Boerner, K.; Meurer, M.; Kremer, L.P.; Kirrmaier, D.; Freistaedter, A.; Papagiannidis, D.; Galmozzi, C.; Klein, S.; et al. Screening for SARS-CoV-2 infections with colorimetric RT-LAMP and LAMP sequencing. Medrxiv 2020, 12, 556. [Google Scholar] [CrossRef]
- Thi, V.L.; Herbst, K.; Boerner, K.; Meurer, M.; Kremer, L.P.; Kirrmaier, D.; Freistaedter, A.; Papagiannidis, D.; Galmozzi, C.; Stanifer, M.L.; et al. A colorimetric RT-LAMP assay and LAMP-sequencing for detecting SARS-CoV-2 RNA in clinical samples. Sci Transl Med. 2020, 12, eabc7075. [Google Scholar]
- Wan, L.; Gao, J.; Chen, T.; Dong, C.; Li, H.; Wen, Y.Z.; Lun, Z.R.; Jia, Y.; Mak, P.I.; Martins, R.P. LampPort: A handheld digital microfluidic device for loop-mediated isothermal amplification (LAMP). Biomed. Microdevices 2019, 21, 9. [Google Scholar] [CrossRef]
- Nguyen, T.; Vinayaka, A.C.; Huynh, V.N.; Linh, Q.T.; Andreasen, S.Z.; Golabi, M.; Bang, D.D.; Møller, J.K.; Wolff, A. PATHPOD—A loop-mediated isothermal amplification (LAMP)-based point-of-care system for rapid clinical detection of SARS-CoV-2 in hospitals in Denmark. Sens. Actuators B Chem. 2023, 392, 134085. [Google Scholar] [CrossRef]
- Kaur, A.; Ruhela, A.; Sharma, P.; Khariwal, H.; Seth, S.; Kumar, A.; Kapil, A.; Elangovan, R.; Kalyanasundaram, D. Simultaneous and high sensitive detection of Salmonella typhi and Salmonella paratyphi a in human clinical blood samples using an affordable and portable device. Biomed. Microdevices 2019, 21, 1–2. [Google Scholar] [CrossRef]
- Singh, H.; Singh, G.; Mahajan, D.K.; Kaur, N.; Singh, N. A low-cost device for rapid ‘color to concentration quantification of cyanide in real samples using paper-based sensing chip. Sens. Actuators B Chem. 2020, 322, 128622. [Google Scholar] [CrossRef]
- Ragul, S.A.; Sreeram, R.; Pandiyan, P.; Saravanan, S. Non-invasive method of diagnosing health parameters using urinalysis. In Proceedings of the 2020 6th International Conference on Advanced Computing and Communication Systems (ICACCS), Coimbatore, India, 6–7 March 2020; pp. 867–871. [Google Scholar]
- Uddin, S.M.; Ibrahim, F.; Sayad, A.A.; Thiha, A.; Pei, K.X.; Mohktar, M.S.; Hashim, U.; Cho, J.; Thong, K.L. A portable automatic endpoint detection system for amplicons of loop mediated isothermal amplification on microfluidic compact disk platform. Sensors 2015, 15, 5376–5389. [Google Scholar] [CrossRef]
- Borse, V.; Patil, A.S.; Srivastava, R. Development and testing of portable fluorescence reader (PorFloR™). In Proceedings of the 2017 9th international conference on communication systems and networks (COMSNETS), Bengaluru, India, 4–8 January 2017; pp. 498–501. [Google Scholar]
- Miralles, V.; Huerre, A.; Malloggi, F.; Jullien, M.C. A Review of Heating and Temperature Control in Microfluidic Systems: Techniques and Applications. Diagnostics 2013, 3, 33–67. [Google Scholar] [CrossRef] [PubMed]
- Kushwah, M.; Patra, A. PID controller tuning using Ziegler-Nichols method for speed control of DC motor. Int. J. Sci. Eng. Technol. Res. 2014, 3, 2924–2929. [Google Scholar]
- Dinca, M.P.; Gheorghe, M.; Galvin, P. Design of a PID controller for a PCR micro reactor. IEEE Trans. Educ. 2008, 52, 116–125. [Google Scholar] [CrossRef]
- Pogfai, T.; Wong-ek, K.; Mongpraneet, S.; Wisitsoraat, A.; Tuantranont, A. Low cost and portable PCR thermoelectric cycle. Int. J. Appl. 2008, 1, 41–45. [Google Scholar]
- de Oliveira, V.K.; Camargo, B.D.; Alexandrino, F.; Morello, L.G.; Marchini, F.K.; Aoki, M.N.; Blanes, L. A low-cost PCR instrument for molecular disease diagnostics based on customised printed circuit board heaters. Biomed. Microdevices 2021, 23, 1–8. [Google Scholar] [CrossRef] [PubMed]
- Johnson, M.A.; Moradi, M.H. PID Control: New Identification and Design Methods-[Book Review]. IEEE Control Syst. Mag. 2006, 26, 95–97. [Google Scholar]
- Banzi, M.; Shiloh, M. Getting Started with Arduino: The Open Source Electronics Prototyping Platform; Maker Media. Inc.: Sebastopol, CA, USA, 2014; Volume 131. [Google Scholar]
- D’Ausilio, A. Arduino: A low-cost multipurpose lab equipment. Behav. Res. Methods 2012, 44, 305–313. [Google Scholar] [CrossRef] [PubMed]
- Asraf, H.M.; Dalila, K.N.; Hakim, A.M.; Hon, R.M. Development of experimental simulator via Arduino-based PID temperature control system using LabVIEW. J. Telecommun. Electron. Comput. Eng. (JTEC) 2017, 9, 53–57. [Google Scholar]
- Mathew, H.B.; Gupta, A. Controlling of temperature and humidity for an infant incubator using microcontroller. Int. J. Adv. Res. Electr. Electron. Instrum. Eng. 2015, 4, 4975–4982. [Google Scholar]
- Wang, Y.; Chi, Z. System of wireless temperature and humidity monitoring based on Arduino Uno platform. In Proceedings of the 2016 Sixth International Conference on Instrumentation & Measurement, Computer, Communication and Control (IMCCC), Harbin, China, 21–23 July 2016; pp. 770–773. [Google Scholar]
- Scott, A.T.; Layne, T.R.; O’Connell, K.C.; Tanner, N.A.; Landers, J.P. Comparative Evaluation and Quantitative Analysis of Loop-Mediated Isothermal Amplification Indicators. Anal Chem. 2020, 92, 13343–13353. [Google Scholar] [CrossRef] [PubMed]
- Diaz, L.M.; Johnson, B.E.; Jenkins, D.M. Real-time optical analysis of a colorimetric LAMP assay for SARS-CoV-2 in saliva with a handheld instrument improves accuracy compared with endpoint assessment. J. Biomol. Tech. 2021, 32, 158–171. [Google Scholar] [CrossRef] [PubMed]
- Aoki, M.N.; de Oliveira Coelho, B.; Góes, L.G.; Minoprio, P.; Durigon, E.L.; Morello, L.G.; Marchini, F.K.; Riediger, I.N.; do Carmo Debur, M.; Nakaya, H.I.; et al. Colorimetric RT-LAMP SARS-CoV-2 diagnostic sensitivity relies on color interpretation and viral load. Sci. Rep. 2021, 11, 9026. [Google Scholar] [CrossRef]
- Rabe, B.A.; Cepko, C. SARS-CoV-2 detection using isothermal amplification and a rapid, inexpensive protocol for sample inactivation and purification. Proc. Natl. Acad. Sci. 2020, 117, 24450–24458. [Google Scholar] [CrossRef]
- Span, M.; Verblakt, M.; Hendrikx, T. Comparison of temperature dynamics of various thermal cycler calibration methods. In Proceedings of the 19th International Congress of Metrology (CIM2019), Paris, France, 24–26 September 2019; p. 19003. [Google Scholar]
- Rodriguez-Manzano, J.; Malpartida-Cardenas, K.; Moser, N.; Pennisi, I.; Cavuto, M.; Miglietta, L.; Moniri, A.; Penn, R.; Satta, G.; Randell, P.; et al. Handheld point-of-care system for rapid detection of SARS-CoV-2 extracted RNA in under 20 min. ACS Cent. Sci. 2021, 7, 307–317. [Google Scholar] [CrossRef]
- Ganguli, A.; Mostafa, A.; Berger, J.; Aydin, M.Y.; Sun, F.; Ramirez, S.A.; Valera, E.; Cunningham, B.T.; King, W.P.; Bashir, R. Rapid isothermal amplification and portable detection system for SARS-CoV-2. Proc. Natl. Acad. Sci. USA 2020, 117, 22727–22735. [Google Scholar] [CrossRef]


| Biosystems ProFlex | RT-LAMP Arduino Instrument | |
|---|---|---|
| Positive | 43.9% (n = 29) | 45.5% (n = 30) (1 false positive) |
| Negative | 56.1% (n = 37) | 83.8% (n = 31) |
| Indeterminate | - | 9.1% (n = 5) |
| Total | n = 66 | n = 66 |
| Result | (Gf-Bf) |
|---|---|
| Positive | −20 |
| Negative | 25 |
| Indeterminate | −20 < (Gf - Bf) < 25 |
Disclaimer/Publisher’s Note: The statements, opinions and data contained in all publications are solely those of the individual author(s) and contributor(s) and not of MDPI and/or the editor(s). MDPI and/or the editor(s) disclaim responsibility for any injury to people or property resulting from any ideas, methods, instructions or products referred to in the content. |
© 2024 by the authors. Licensee MDPI, Basel, Switzerland. This article is an open access article distributed under the terms and conditions of the Creative Commons Attribution (CC BY) license (https://creativecommons.org/licenses/by/4.0/).
Share and Cite
Camargo, B.D.; Cassaboni Stracke, M.; Soligo Sanchuki, H.B.; de Oliveira, V.K.; Ancelmo, H.C.; Mozaner Bordin, D.; Klerynton Marchini, F.; Ribeiro Viana, E.; Blanes, L. Low-Cost Arduino Reverse Transcriptase Loop-Mediated Isothermal Amplification (RT-LAMP) for Sensitive Nucleic Acid Detection. Biosensors 2024, 14, 128. https://doi.org/10.3390/bios14030128
Camargo BD, Cassaboni Stracke M, Soligo Sanchuki HB, de Oliveira VK, Ancelmo HC, Mozaner Bordin D, Klerynton Marchini F, Ribeiro Viana E, Blanes L. Low-Cost Arduino Reverse Transcriptase Loop-Mediated Isothermal Amplification (RT-LAMP) for Sensitive Nucleic Acid Detection. Biosensors. 2024; 14(3):128. https://doi.org/10.3390/bios14030128
Chicago/Turabian StyleCamargo, Bruno Dias, Mateus Cassaboni Stracke, Heloisa Bruna Soligo Sanchuki, Viviane Klassen de Oliveira, Hellen Cristina Ancelmo, Dayanne Mozaner Bordin, Fabricio Klerynton Marchini, Emilson Ribeiro Viana, and Lucas Blanes. 2024. "Low-Cost Arduino Reverse Transcriptase Loop-Mediated Isothermal Amplification (RT-LAMP) for Sensitive Nucleic Acid Detection" Biosensors 14, no. 3: 128. https://doi.org/10.3390/bios14030128