Laser Scribed Graphene Biosensor for Detection of Biogenic Amines in Food Samples Using Locally Sourced Materials


 and
and 
Abstract
:1. Introduction
2. Materials and Methods
2.1. Materials and Reagents
2.2. Electrode Fabrication
2.3. Copper Electrodeposition
2.4. Material Characterization
2.5. Sensor Biofunctionalization
2.6. Electrochemical Characterization
2.7. Analysis of Fermented Fish
2.8. Statistical Analysis
3. Results and Discussion
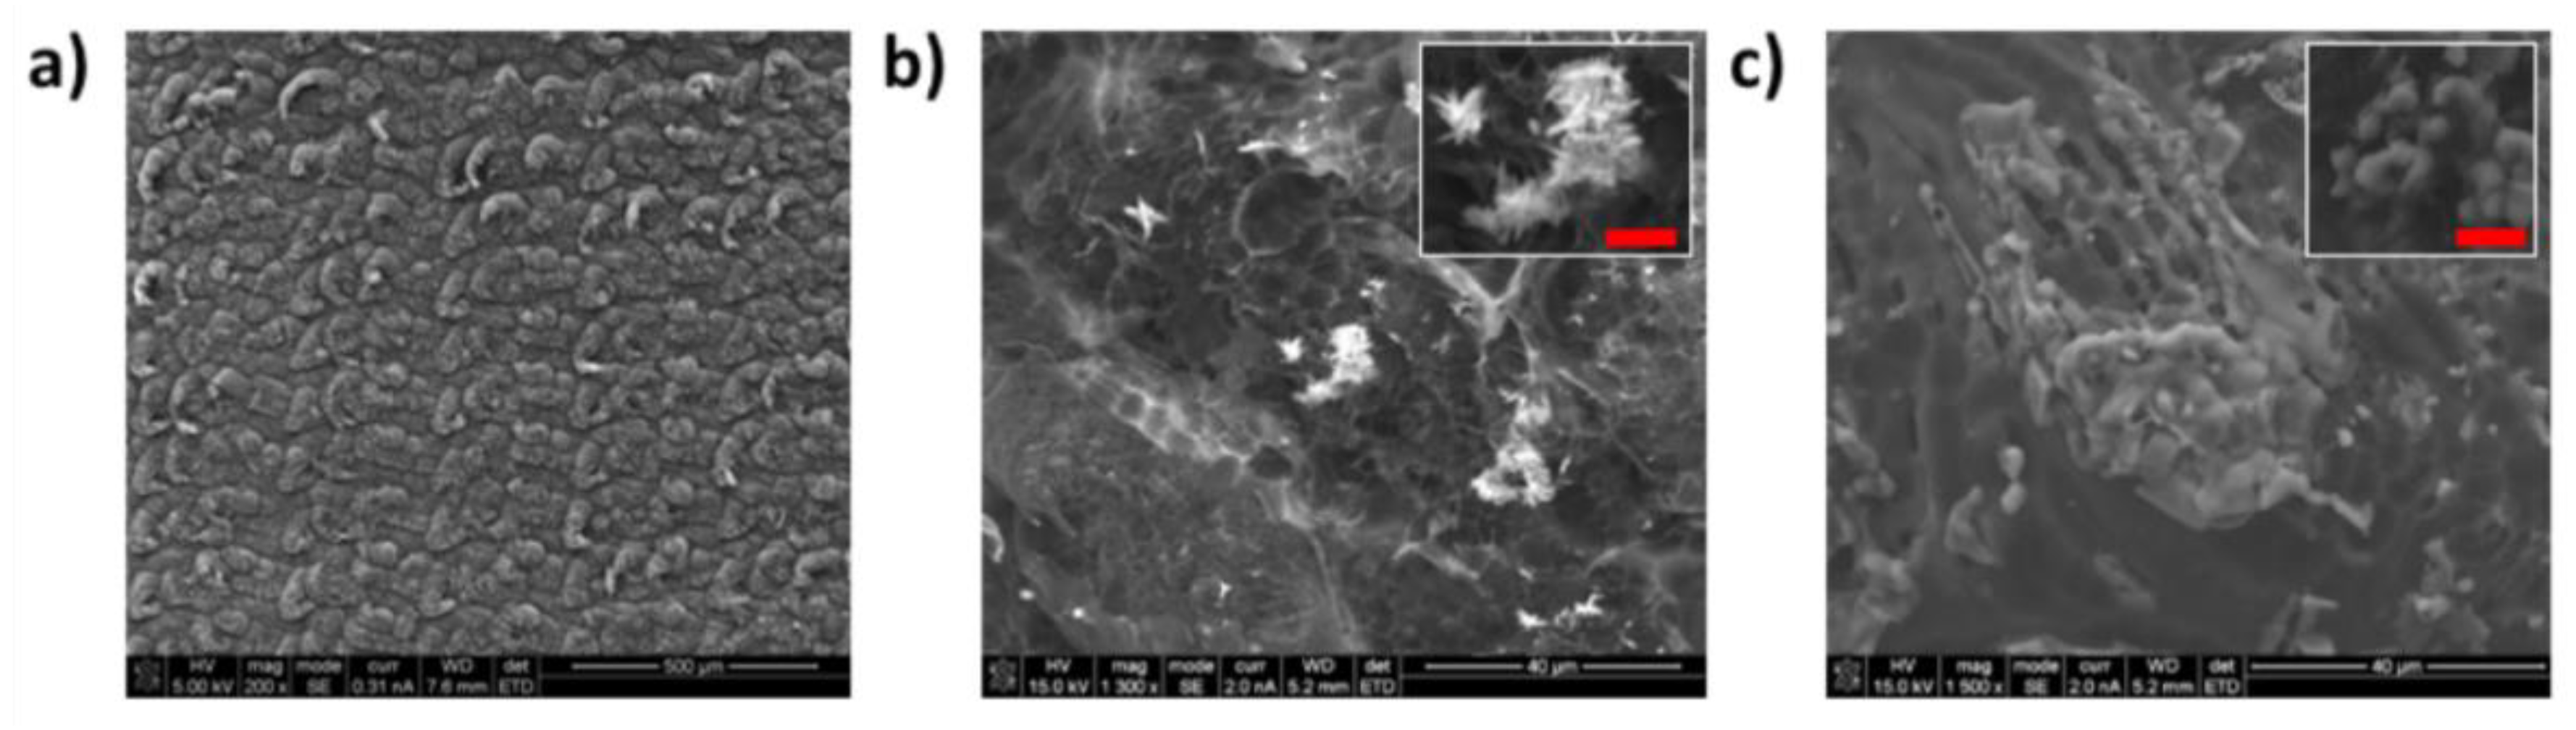
3.1. LSG Morphology
3.2. Material Analysis
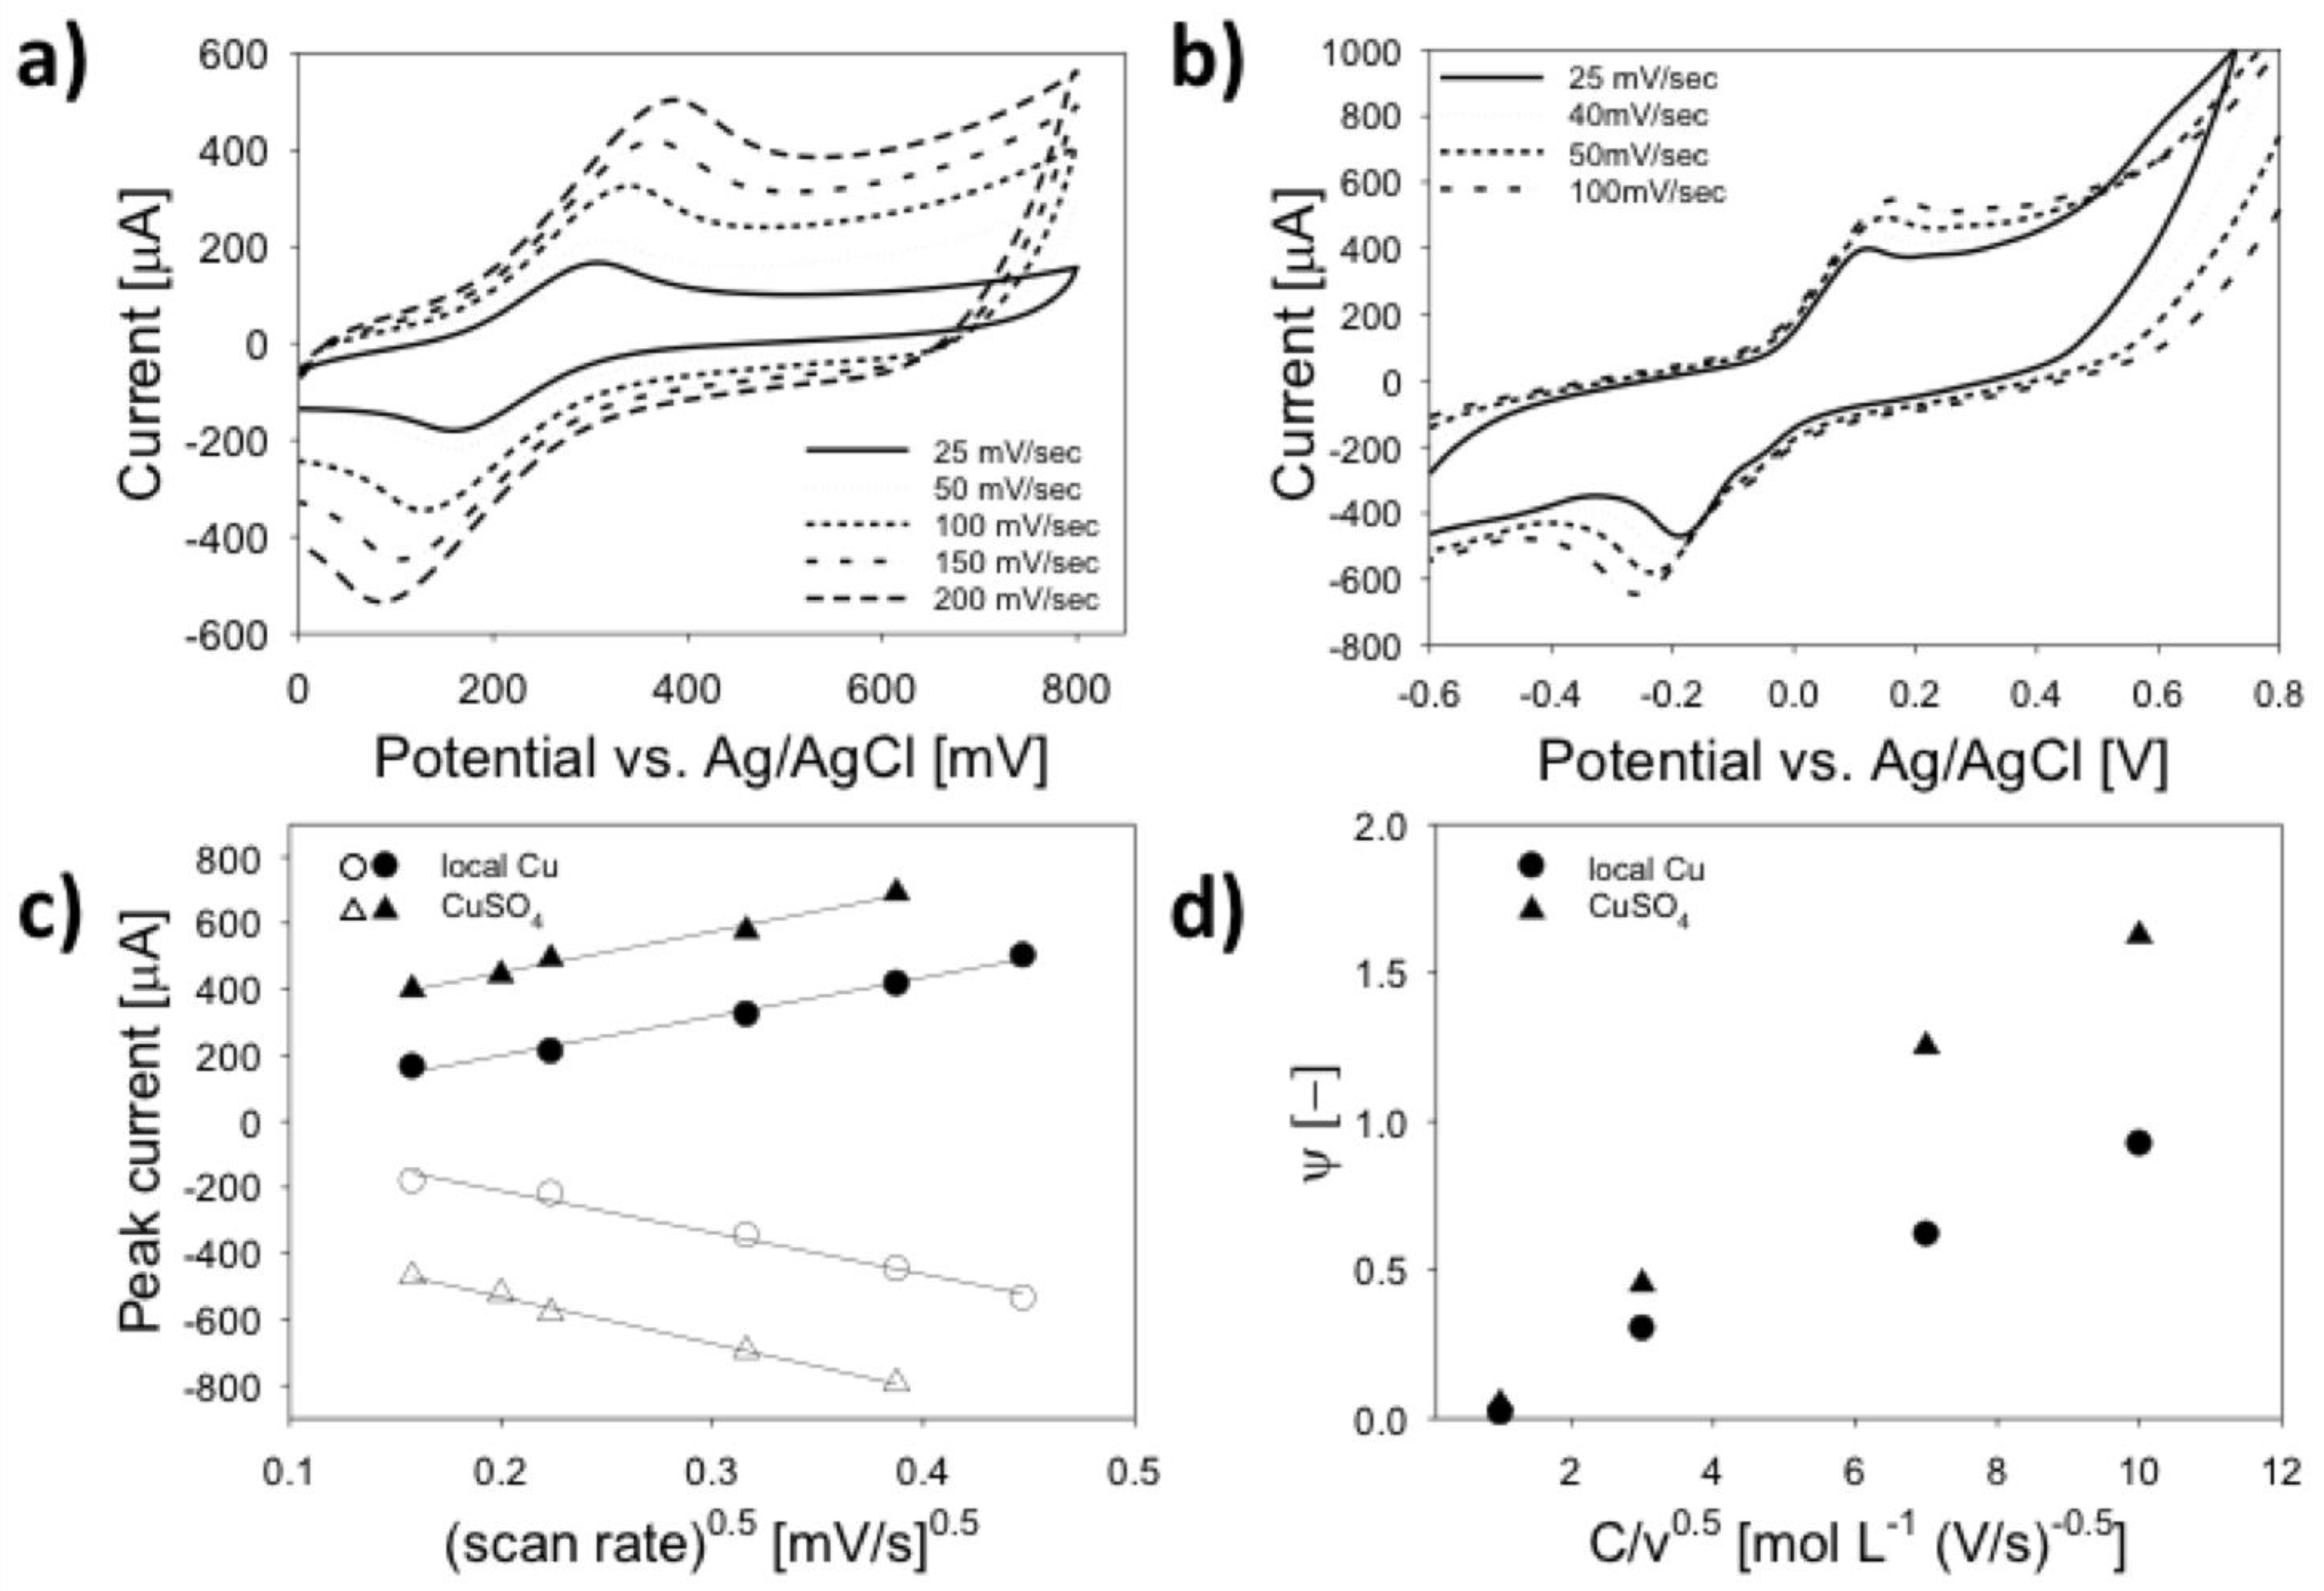
3.3. Electrochemical Characterization
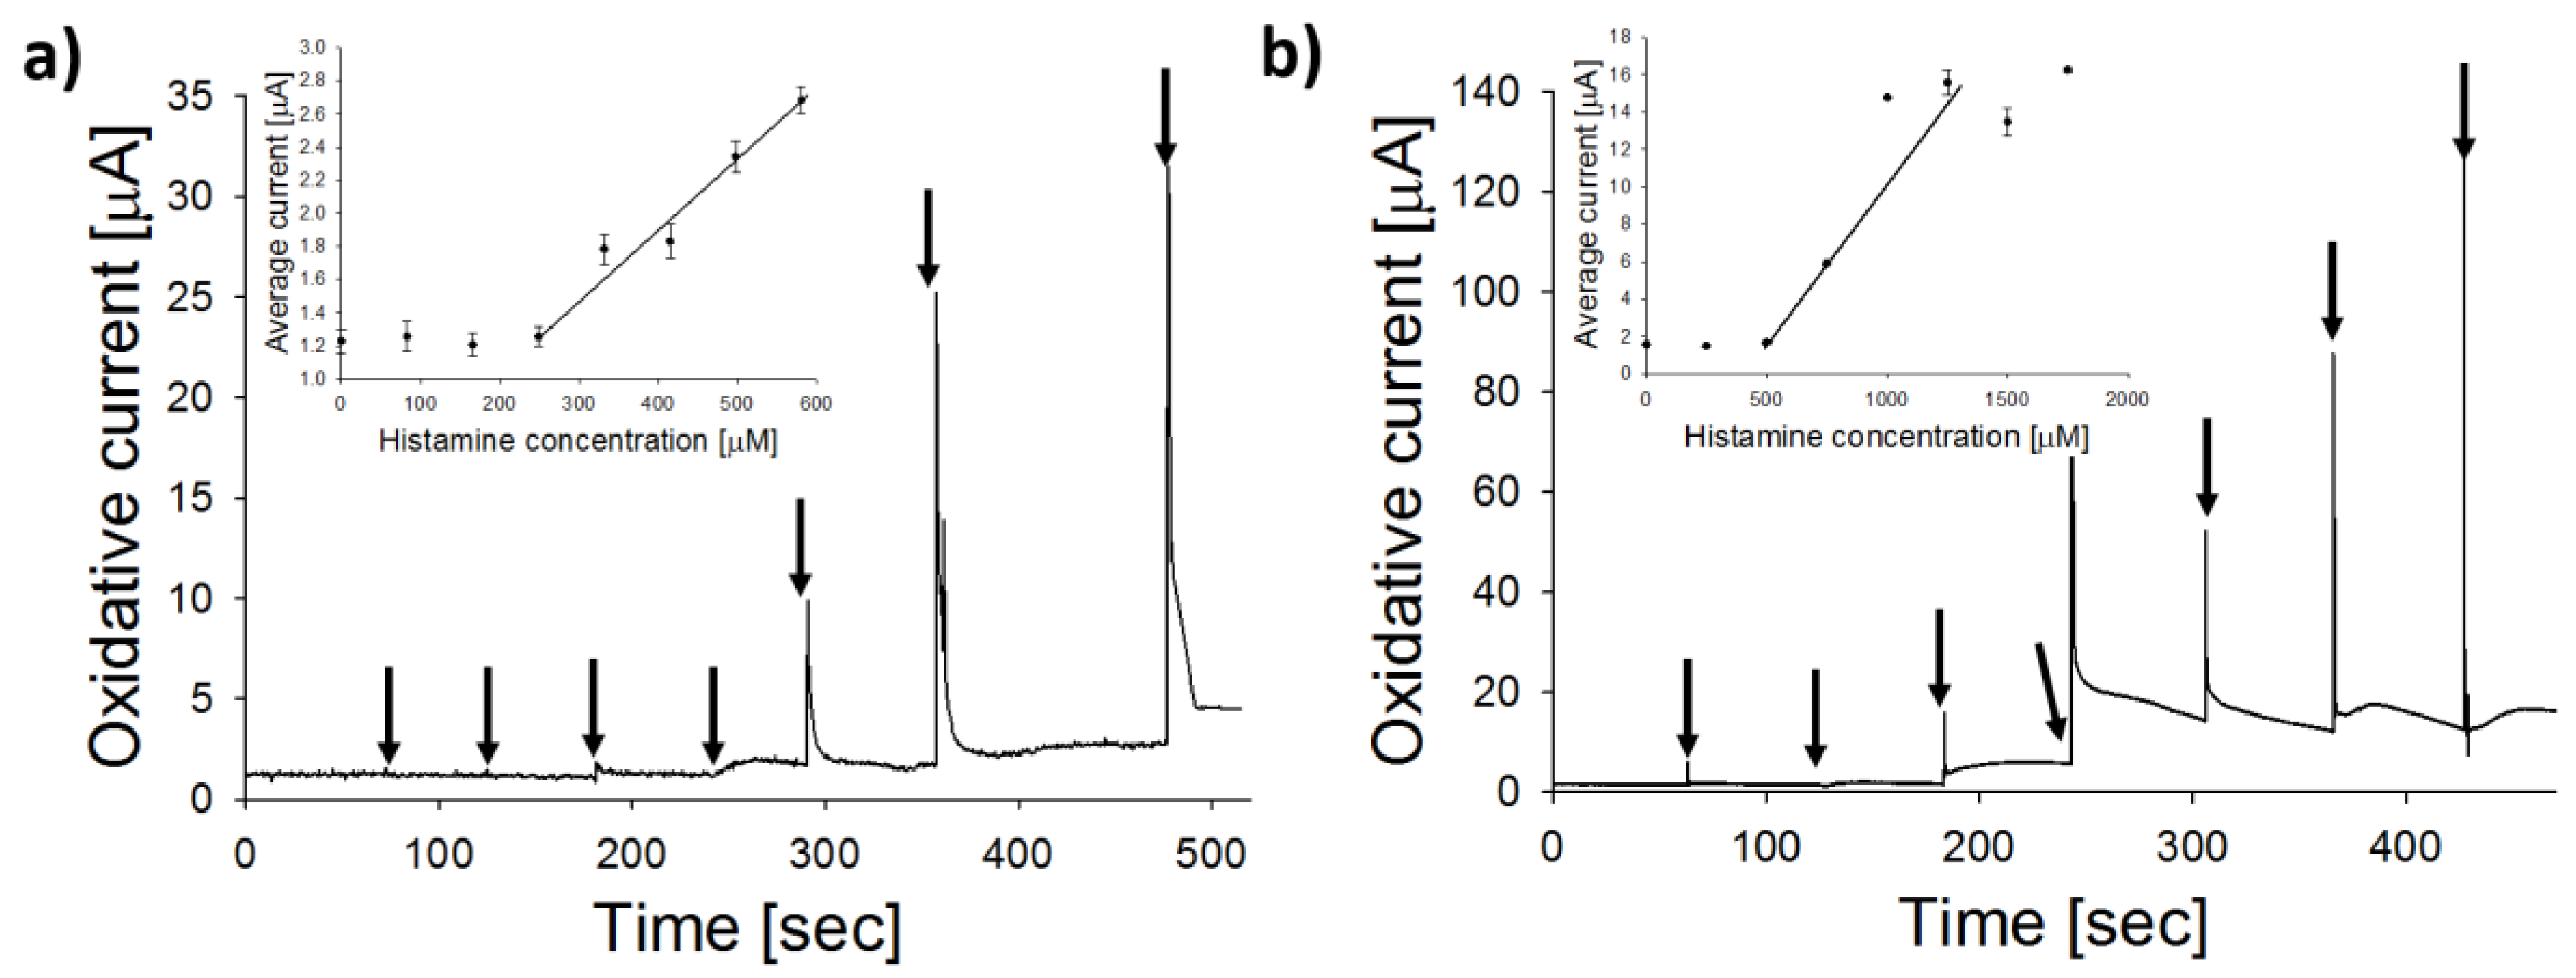
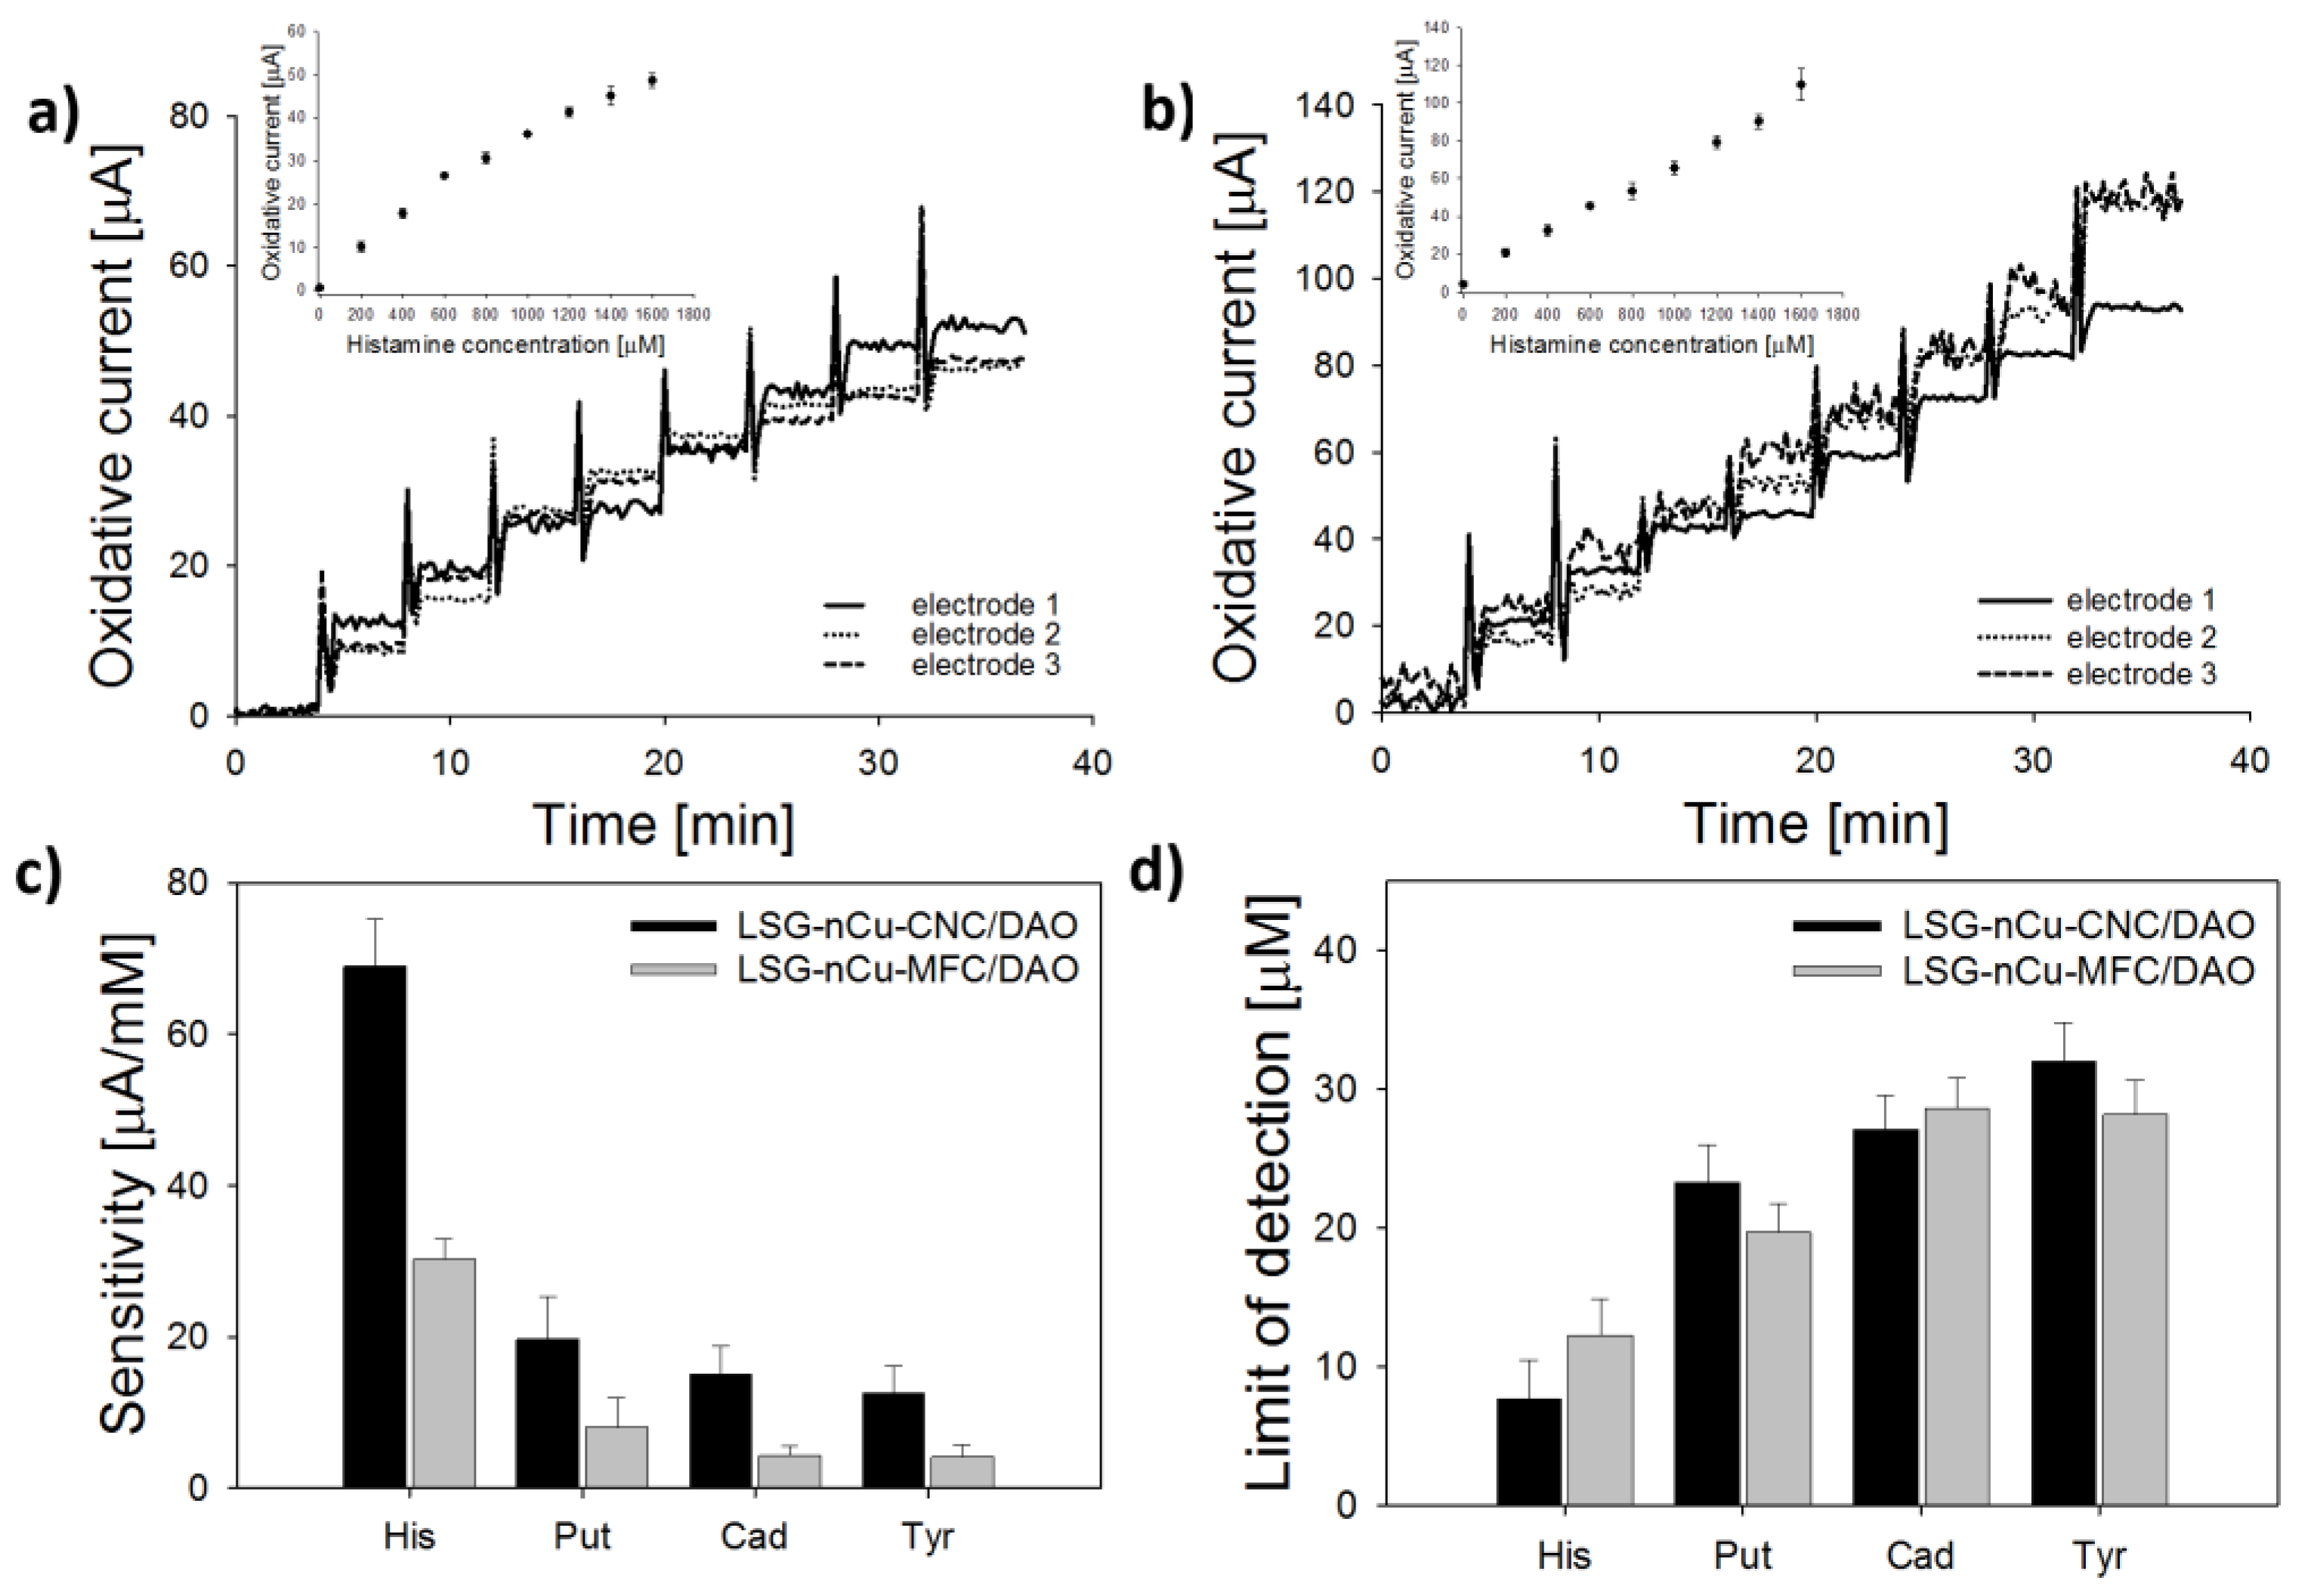
3.4. Sensor Biofunctionalization and Calibration
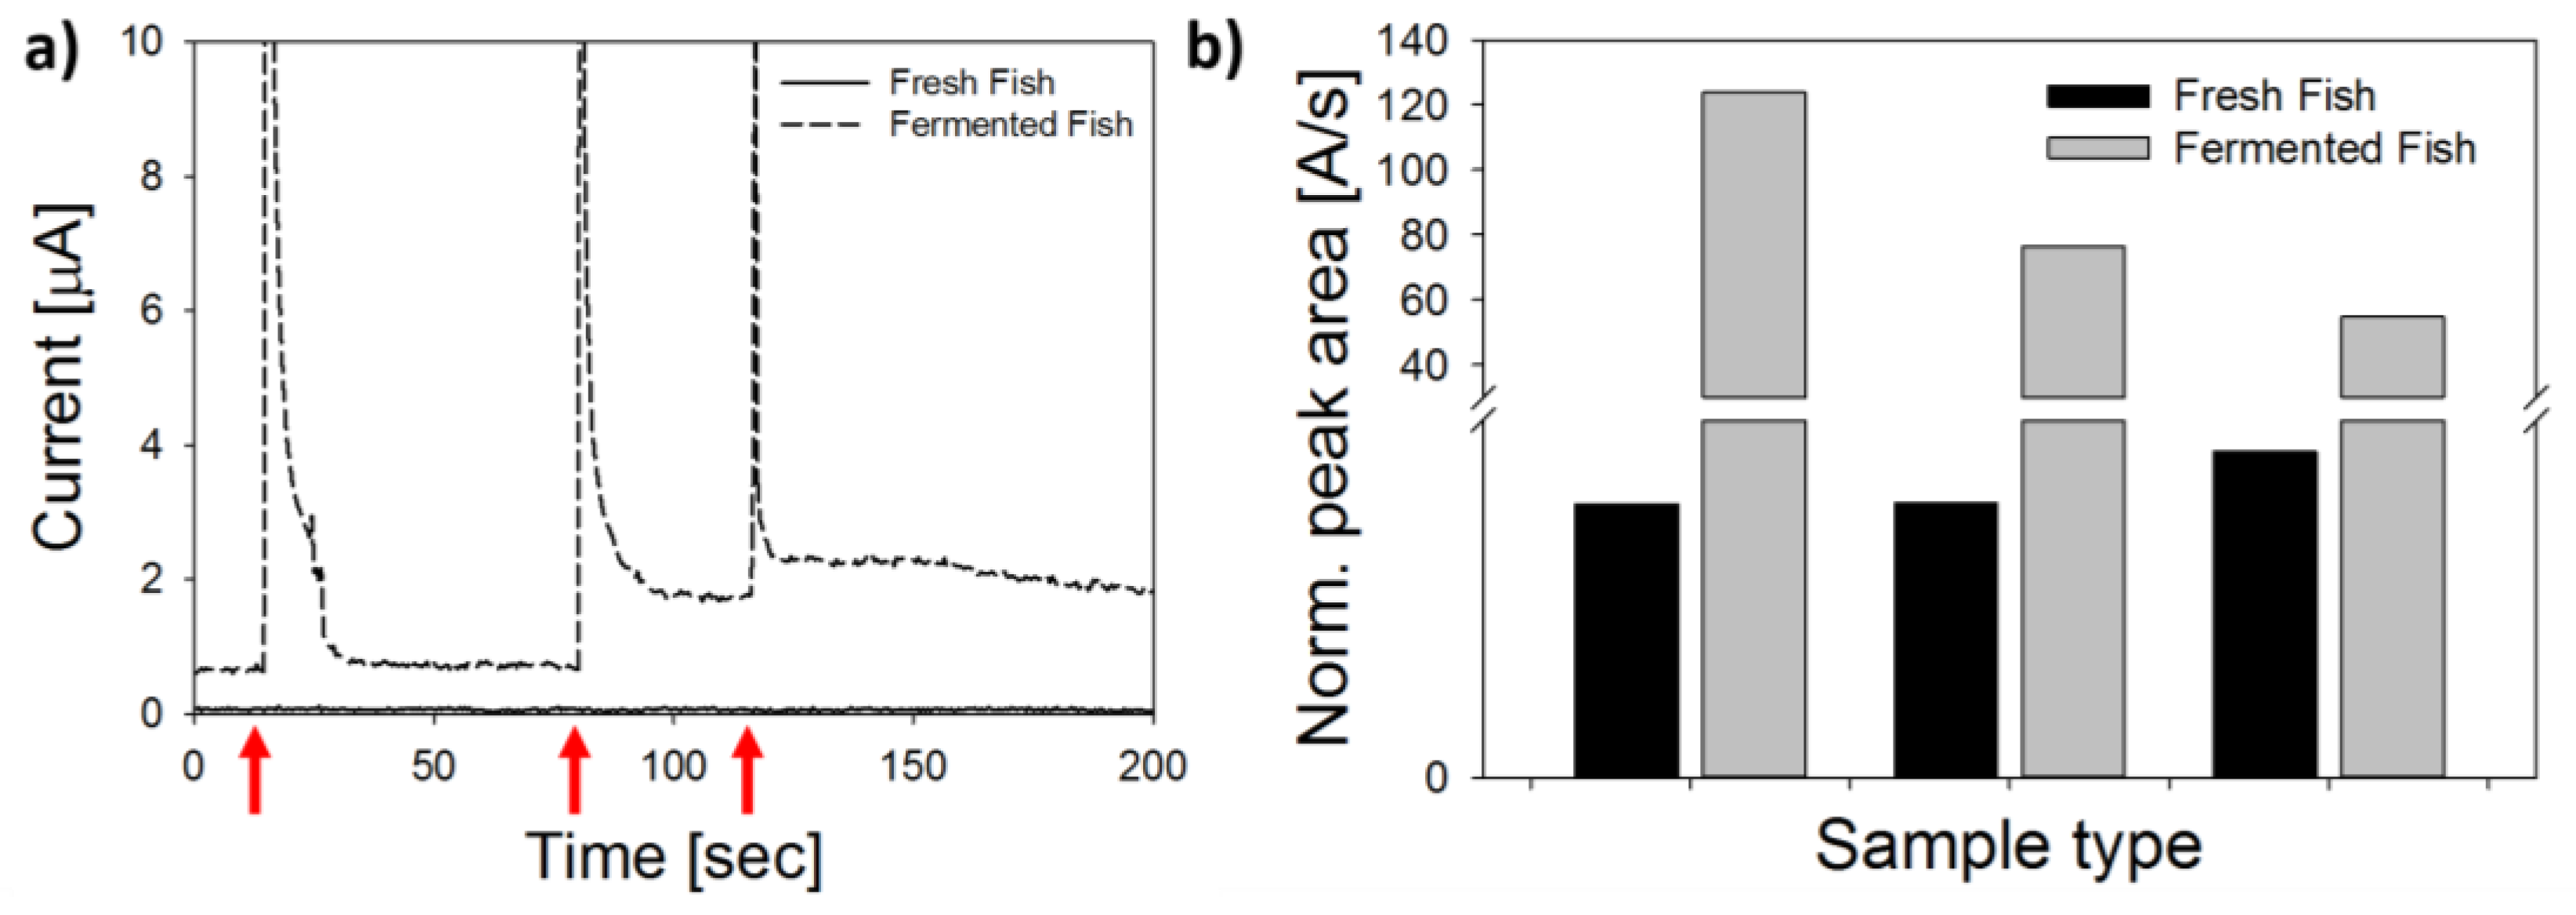
3.5. Analysis of Fish Samples
4. Discussion
5. Conclusions
Supplementary Materials
Author Contributions
Funding
Acknowledgments
Conflicts of Interest
References
- Castell-Perez, E.; Gomes, C.; Tahtouh, J.; Moreira, R.; McLamore, E.S.; Knowles, H.S. Food processing and waste within the nexus framework. Curr. Sustain. Energy Rep. 2017, 4, 99–108. [Google Scholar] [CrossRef]
- Miyagishima, K.; Moy, G.; Miyagawa, S.; Motarjemi, Y.; Käferstein, F.K. Food safety and public health. Food Control 1995, 6, 253–259. [Google Scholar] [CrossRef]
- Röhr, A.; Lüddecke, K.; Drusch, S.; Müller, M.J.; Alvensleben, R.V. Food quality and safety—Consumer perception and public health concern. Food Control 2005, 16, 649–655. [Google Scholar] [CrossRef]
- World Health Organization (WHO). WHO Estimates of the Global Burden of Foodborne Diseases: Foodborne Diseases Burden Epidemiology Reference Group 2007–2015; WHO Report; WHO: Geneva, Switzerland, 2015; p. 255. [Google Scholar]
- World Health Organization (WHO). Global Health Estimates 2015: Disease Burden by Cause, Age, Sex, by Country and by Region, 2000–2015; WHO: Geneva, Switzerland, 2016. [Google Scholar]
- Bülbül, G.; Hayat, A.; Andreescu, S. Portable nanoparticle-based sensors for food safety assessment. Sensors 2015, 15, 30736–30758. [Google Scholar] [CrossRef] [PubMed]
- Hanak, E.; Boutrif, E.; Fabre, P.; Pineiro, M. Food Safety Management in Developing Countries. In Proceedings of the International Workshop, CIRAD-FAO, Montpellier, France, 11–13 December 2000. [Google Scholar]
- Unnevehr, L. Food safety in developing countries: Moving beyond exports. Glob. Food Secur. 2015, 4, 24–29. [Google Scholar] [CrossRef]
- Taylor, S.L.; Eitenmiller, R.R. Histamine food poisoning: Toxicology and clinical aspects. Crit. Rev. Toxicol 1986, 17, 91–128. [Google Scholar] [CrossRef] [PubMed]
- Doeun, D.; Davaatseren, M.; Chung, M.S. Biogenic amines in foods. Food Sci. Biotechnol. 2017, 26, 1463–1474. [Google Scholar] [CrossRef]
- Silla-Santos, M.H. Biogenic amines: Their importance in foods. Int. J. Food Microbiol. 1996, 29, 213–231. [Google Scholar] [CrossRef]
- Spano, G.; Russo, P.; Lonvaud-Funel, A.; Lucas, P.; Alexandre, H.; Grandvalet, C.; Coton, E.; Coton, M.; Barnavon, L.; Bach, B.; et al. Biogenic amines in fermented foods. Eur. J. Clin. Nutr. 2010, 64, S95–S100. [Google Scholar] [CrossRef] [PubMed]
- Prester, L. Biogenic amines in fish, fish products and shellfish: A review. Food Addit. Contam. 2011, 28, 1547–1560. [Google Scholar] [CrossRef] [PubMed]
- Visciano, P.; Schirone, M.; Tofalo, R.; Suzzi, G. Histamine poisoning and control measures in fish and fishery products. Front. Microbiol. 2014, 5, 500. [Google Scholar] [CrossRef] [PubMed]
- U.S. Food and Drug Administration (USFDA). Fish and Fishery Products Hazards and Controls Guidance, 4th ed.; Center for Food Safety and Applied Nutrition: College Park, MD, USA, 2011. [Google Scholar]
- Biji, K.B.; Ravishankar, C.N.; Venkateswarlu, R.; Mohan, C.O.; Gopal, T.S. Biogenic amines in seafood: A review. J. Food Sci. Technol. 2016, 53, 2210–2218. [Google Scholar] [CrossRef] [PubMed]
- Ministerio de la Protección Social, República de Colombia. Resolución No. 776: Por la Cual se Establece el Reglamento Técnico Sobre Los Requisitos Fisicoquímicos y Microbiológicos Que Deben Cumplir Los Productos de la Pesca, en Particular Pescados, Moluscos y Crustáceos Para Consumo Humano; Instituto Nacional de Vigilancia de Medicamentos (INVIMA): Bogotá, Colombia, 2008. [Google Scholar]
- Önal, A. A review: Current analytical methods for the determination of biogenic amines in foods. Food Chem. 2007, 103, 1475–1486. [Google Scholar] [CrossRef]
- GBD 2015 Mortality and Causes of Death Collaborators. Global, regional, and national life expectancy, all-cause mortality, and cause-specific mortality for 249 causes of death, 1980–2015: A systematic analysis for the Global Burden of Disease Study 2015. Lancet 2016, 388, 1459–1544. [Google Scholar]
- World Health Organization (WHO). The Global Burden of Disease: 2004 Update; World Health Organization Press: Geneva, Switzerland, 2008. [Google Scholar]
- De Noordhout, C.M.; Devleesschauwer, B.; Angulo, F.J.; Verbeke, G.; Haagsma, J.; Kirk, M.; Havelaar, A.; Speybroeck, N. The global burden of listeriosis: A systematic review and meta-analysis. Lancet Infect. Dis. 2014, 14, 1073–1082. [Google Scholar] [CrossRef]
- Vanegas, D.C.; Gomes, C.L.; Cavallaro, N.D.; Giraldo-Escobar, D.; McLamore, E.S. Emerging Biorecognition and Transduction Schemes for Rapid Detection of Pathogenic Bacteria in Food. Compr. Rev. Food Sci. Food Saf. 2017, 16, 1188–1205. [Google Scholar] [CrossRef]
- Burrs, S.L.; Bhargava, M.; Sidhu, R.; Kiernan-Lewis, J.; Gomes, C.; Claussen, J.C.; McLamore, E.S. A Paper Based Graphene-Nanocauliflower Hybrid Composite for Point of Care Biosensing. Biosens. Bioelectron. 2016, 15, 479–487. [Google Scholar] [CrossRef] [PubMed]
- Zhang, Y.; Guo, L.; Wei, S.; He, Y.; Xia, H.; Chen, Q.; Sun, H.B.; Xiao, F.S. Direct imprinting of microcircuits on graphene oxides film by femtosecond laser reduction. Nano Today 2010, 5, 15–20. [Google Scholar] [CrossRef]
- Lin, J.; Peng, Z.; Liu, Y.; Ruiz-Zepeda, F.; Ye, R.; Samuel, E.L.; Yacaman, M.J.; Yakobson, B.I.; Tour, J.M. Laser-induced porous graphene films from commercial polymers. Nat. Commun. 2014, 5, 5714. [Google Scholar] [CrossRef] [PubMed]
- Duy, L.X.; Peng, Z.; Li, Y.; Zhang, J.; Ji, Y.; Tour, J.M. Laser-Induced Graphene Fibers. Carbon 2018, 126, 472–479. [Google Scholar] [CrossRef]
- Li, Y.; Luong, D.X.; Zhang, J.; Tarkunde, Y.R.; Kittrell, C.; Sargunaraj, F.; Ji, Y.; Arnusch, C.J.; Tour, J.M. Laser-Induced Graphene in Controlled Atmospheres: From Superhydrophilic to Superhydrophobic Surfaces. Adv. Mater. 2017, 29, 1700496. [Google Scholar] [CrossRef] [PubMed]
- Singh, S.P.; Li, Y.; Be’er, A.; Oren, Y.; Tour, J.M.; Arnusch, C.J. Laser-Induced Graphene Layers and Electrodes Prevents Microbial Fouling and Exerts Antimicrobial Action. ACS Appl. Mater. Interfaces 2017, 9, 18238–18247. [Google Scholar] [CrossRef] [PubMed]
- Wu, D.; Deng, L.; Mei, X.; Teh, K.S.; Cai, W.; Tan, Q.; Zhao, Y.; Wang, L.; Zhao, L.; Luo, G.; et al. Direct-write graphene resistors on aromatic polyimide for transparent heating glass. Sens. Actuators A Phys. 2017, 267, 327–333. [Google Scholar] [CrossRef]
- Tehrani, F.; Bavarian, B. Facile and scalable disposable sensor based on laser engraved graphene for electrochemical detection of glucose. Sci. Rep. 2016, 6, 27975. [Google Scholar] [CrossRef] [PubMed]
- Nayak, P.; Kurra, N.; Xia, C.; Alshareef, H.N. Highly Efficient Laser Scribed Graphene Electrodes for On-Chip Electrochemical Sensing Applications. Adv. Electron. Mater. 2016, 2, 1600185. [Google Scholar] [CrossRef]
- Fenzl, C.; Nayak, P.; Hirsch, T.; Wolfbeis, O.S.; Alshareef, H.N.; Baeumner, A.J. Laser-Scribed Graphene Electrodes for Aptamer-Based Biosensing. ACS Sens. 2017, 2, 616–620. [Google Scholar] [CrossRef] [PubMed]
- Burrs, S.L.; Vanegas, D.C.; Bhargava, M.; Mechulan, N.; Hendershot, P.; Yamaguchi, H.; Gomes, C.; Mclamore, E.S. A comparative study of graphene–hydrogel hybrid bionanocomposites for biosensing. Analyst 2015, 140, 466–476. [Google Scholar] [CrossRef] [PubMed]
- Bóka, B.; Adányi, N.; Virág, D.; Sebela, M.; Kiss, A. Spoilage Detection with Biogenic Amine Biosensors, Comparison of Different Enzyme Electrodes. Electroanalysis 2012, 24, 181–186. [Google Scholar] [CrossRef]
- Vanegas, D.C.; Taguchi, M.; Chaturvedi, P.; Burrs, S.; Tan, M.; Yamaguchi, H.; McLamore, E.S. A Comparative Study of Carbon–Platinum Hybrid Nanostructure Architecture for Amperometric Biosensing. Analyst 2014, 139, 660–667. [Google Scholar] [CrossRef] [PubMed]
- Nicholson, R.S. Theory and Application of Cyclic Voltammetry for Measurement of Electrode Reaction Kinetics. Anal. Chem. 1965, 37, 1351–1355. [Google Scholar] [CrossRef]
- Siraj, N.; Grampp, G.; Landgraf, S.; Punyain, K. Cyclic Voltammetric Study of Heterogeneous Electron Transfer Rate Constants of Various Organic Compounds in Ionic Liquids: Measurements at Room Temperature. Z. Phys. Chem. 2013, 227, 105–120. [Google Scholar] [CrossRef]
- Taguchi, M.; Schwalb, N.; Rong, Y.; Vanegas, D.C.; Garland, N.; Tan, M.; Yamaguchi, H.; Claussen, J.C.; McLamore, E.S. pulSED: Pulsed Sonoelectrodeposition of Fractal Nanoplatinum for Enhancing Amperometric Biosensor Performance. Analyst 2016, 141, 3367–3378. [Google Scholar] [CrossRef] [PubMed]
- Bellunato, A.; Arjmandi Tash, H.; Cesa, Y.; Schneider, G.F. Chemistry at the Edge of Graphene. ChemPhyschem 2016, 17, 785–801. [Google Scholar] [CrossRef] [PubMed]
- Yuan, W.; Zhou, Y.; Li, Y.; Li, C.; Peng, H.; Zhang, J.; Liu, Z.; Dai, L.; Shi, G. The edge- and basal-plane-specific electrochemistry of a single-layer graphene sheet. Sci. Rep. 2013, 3, 2248. [Google Scholar] [CrossRef] [PubMed]
- Prucek, R.; Kvítek, L.; Panáček, A.; Vančurová, L.; Soukupová, J.; Jančík, D.; Zbořil, R. Polyacrylate-assisted synthesis of stable copper nanoparticles and copper (I) oxide nanocubes with high catalytic efficiency. J. Mater. Chem. 2009, 19, 8463. [Google Scholar] [CrossRef]
- Liao, L.; Peng, H.; Liu, Z. Chemistry Makes Graphene beyond Graphene. J. Am. Chem. Soc. 2014, 136, 12194–12200. [Google Scholar] [CrossRef] [PubMed]
- Mkhoyan, K.A.; Contryman, A.W.; Silcox, J.; Stewart, D.A.; Eda, G.; Mattevi, C.; Miller, S.; Chhowalla, M. Atomic and electronic structure of graphene-oxide. Nano Lett. 2009, 9, 1058–1063. [Google Scholar] [CrossRef] [PubMed]
- Das, A.; Chakraborty, B.; Sood, A.K. Raman spectroscopy of graphene on different substrates and influence of defects. Bull. Mater. Sci. 2008, 31, 579–584. [Google Scholar] [CrossRef]
- DuPont. Kapton Polyimide Film. 2018. Available online: http://www.dupont.com/products-and-services/membranes-films/polyimide-films/brands/kapton-polyimide-film.html/ (accessed on 15 April 2018).
- Lavagnini, I.; Antiochia, R.; Magno, F. An Extended Method for the Practical Evaluation of the Standard Rate Constant from Cyclic Voltammetric Data. Electroanalysis 2004, 16, 505–506. [Google Scholar] [CrossRef]
- Naila, A.; Flint, S.; Fletcher, G.; Bremer, P.; Meerdink, G. Control of biogenic amines in food—Existing and emerging approaches. J. Food Sci. 2010, 75, R139–R150. [Google Scholar] [CrossRef] [PubMed]
- Apetrei, M.I.; Apetrei, C. Amperometric Biosensor Based on Diamine Oxidase/Platinum Nanoparticles/Graphene/Chitosan Modified Screen-Printed Carbon Electrode for Histamine Detection. Sensors 2016, 16, 422. [Google Scholar] [CrossRef] [PubMed]
- Chaturvedi, P.; Vanegas, D.C.; Hauser, B.A.; Foster, J.S.; Sepúlveda, M.S.; McLamore, E.S. Microprofiling real time nitric oxide flux for field studies using a stratified nanohybrid carbon–metal electrode. Anal. Methods 2017, 9, 6061–6072. [Google Scholar] [CrossRef]
- Gumpu, M.B.; Nesakumar, N.; Sethuraman, S.; Krishnan, U.M.; Rayappan, J.B. Development of electrochemical biosensor with ceria–PANI core–shell nano-interface for the detection of histamine. Sens. Actuators B Chem. 2014, 199, 330–338. [Google Scholar] [CrossRef]
- Pérez, S.; Bartrolí, J.; Fàbregas, E. Amperometric biosensor for the determination of histamine in fish samples. Food Chem. 2013, 141, 4066–4072. [Google Scholar] [CrossRef] [PubMed]
- Keow, C.M.; Bakar, F.A.; Salleh, A.B.; Heng, L.Y.; Wagiran, R.; Bean, L.S. An amperometric biosensor for the rapid assessment of histamine level in tiger prawn (Penaeus monodon) spoilage. Food Chem. 2007, 105, 1636–1641. [Google Scholar] [CrossRef]
- Telsnig, D.; Kalcher, K.; Leitner, A.; Ortner, A. Design of an Amperometric Biosensor for the Determination of Biogenic Amines Using Screen Printed Carbon Working Electrodes. Electroanalysis 2013, 25, 47–50. [Google Scholar] [CrossRef]
- Alonso-Lomillo, M.A.; Domínguez-Renedo, O.; Matos, P.; Arcos-Martínez, M.J. Disposable biosensors for determination of biogenic amines. Anal. Chim. Acta 2010, 665, 26–31. [Google Scholar] [CrossRef] [PubMed]
- Henao-Escobar, W.; Del Torno-de Roman, L.; Domínguez-Renedo, O.; Alonso-Lomillo, M.A.; Arcos-Martínez, M.J. Dual enzymatic biosensor for simultaneous amperometric determination of histamine and putrescine. Food Chem. 2016, 190, 818–823. [Google Scholar] [CrossRef] [PubMed]
- Pearce, J.M. The case for open source appropriate technology. Environ. Dev. Sustain. 2012, 14, 425–431. [Google Scholar] [CrossRef]
- Whitmee, S.; Haines, A.; Beyrer, C.; Boltz, F.; Capon, A.G.; de Souza Dias, B.F.; Ezeh, A.; Frumkin, H.; Gong, P.; Head, P.; et al. Safeguarding human health in the Anthropocene epoch: Report of The Rockefeller Foundation-Lancet Commission on planetary health. Lancet 2015, 386, 1973–2028. [Google Scholar] [CrossRef]
- Kagan, C.R. At the Nexus of Food Security and Safety: Opportunities for Nanoscience and Nanotechnology. ACS Nano 2016, 10, 2985–2986. [Google Scholar] [CrossRef] [PubMed]
- Roco, M.C.; Bainbridge, W.S.; Tonn, B.; Whitesides, G. Convergence of Knowledge, Technology and Society: Beyond Convergence of Nano-Bio-Info-Cognitive Technologies; Part of the Science Policy Reports Book Series; Springer: Berlin/Heidelberg, Germany, 2013. [Google Scholar]
- Bales, E.; Nikzad, N.; Quick, N.; Ziftci, C.; Patrick, K.; Griswold, W. Citisense: Mobile air quality sensing for individuals and communities. Design and deployment of the Citisense mobile air-quality system. In Proceedings of the 6th International Conference on Pervasive Computing Technologies for Healthcare (PervasiveHealth) and Workshops, San Diego, CA, USA, 21–24 May 2012. [Google Scholar]
- Jiang, J.; Wang, X.; Chao, R.; Ren, Y.; Hu, C.; Xu, Z.; Liu, G.L. Smartphone based portable bacteria pre-concentrating microfluidic sensor and impedance sensing system. Sens. Actuators B Chem. 2014, 193, 653–659. [Google Scholar] [CrossRef]
- Perelman, B.L.; Ostfeld, A. Operation of remote mobile sensors for security of drinking water distribution systems. Water Res. 2013, 47, 4217–7226. [Google Scholar] [CrossRef] [PubMed]
- Rong, Y.; Padron, A.; Hagerty, K.; Nelson, N.; Chi, S.; Keyhani, N.O.; Katz, J.; Datta, S.P.; Gomes, C.L.; McLamore, E.S. Post hoc support vector machine learning for impedimetric biosensors based on weak protein-ligand interactions. Analyst 2018. [Google Scholar] [CrossRef] [PubMed]


| Material | Feature Size (Morphology) | Material Identified in Features (keV) | 1 Peak Redox Current (µA) | 2 ESA (cm2) | 3 HET Constant (-) |
|---|---|---|---|---|---|
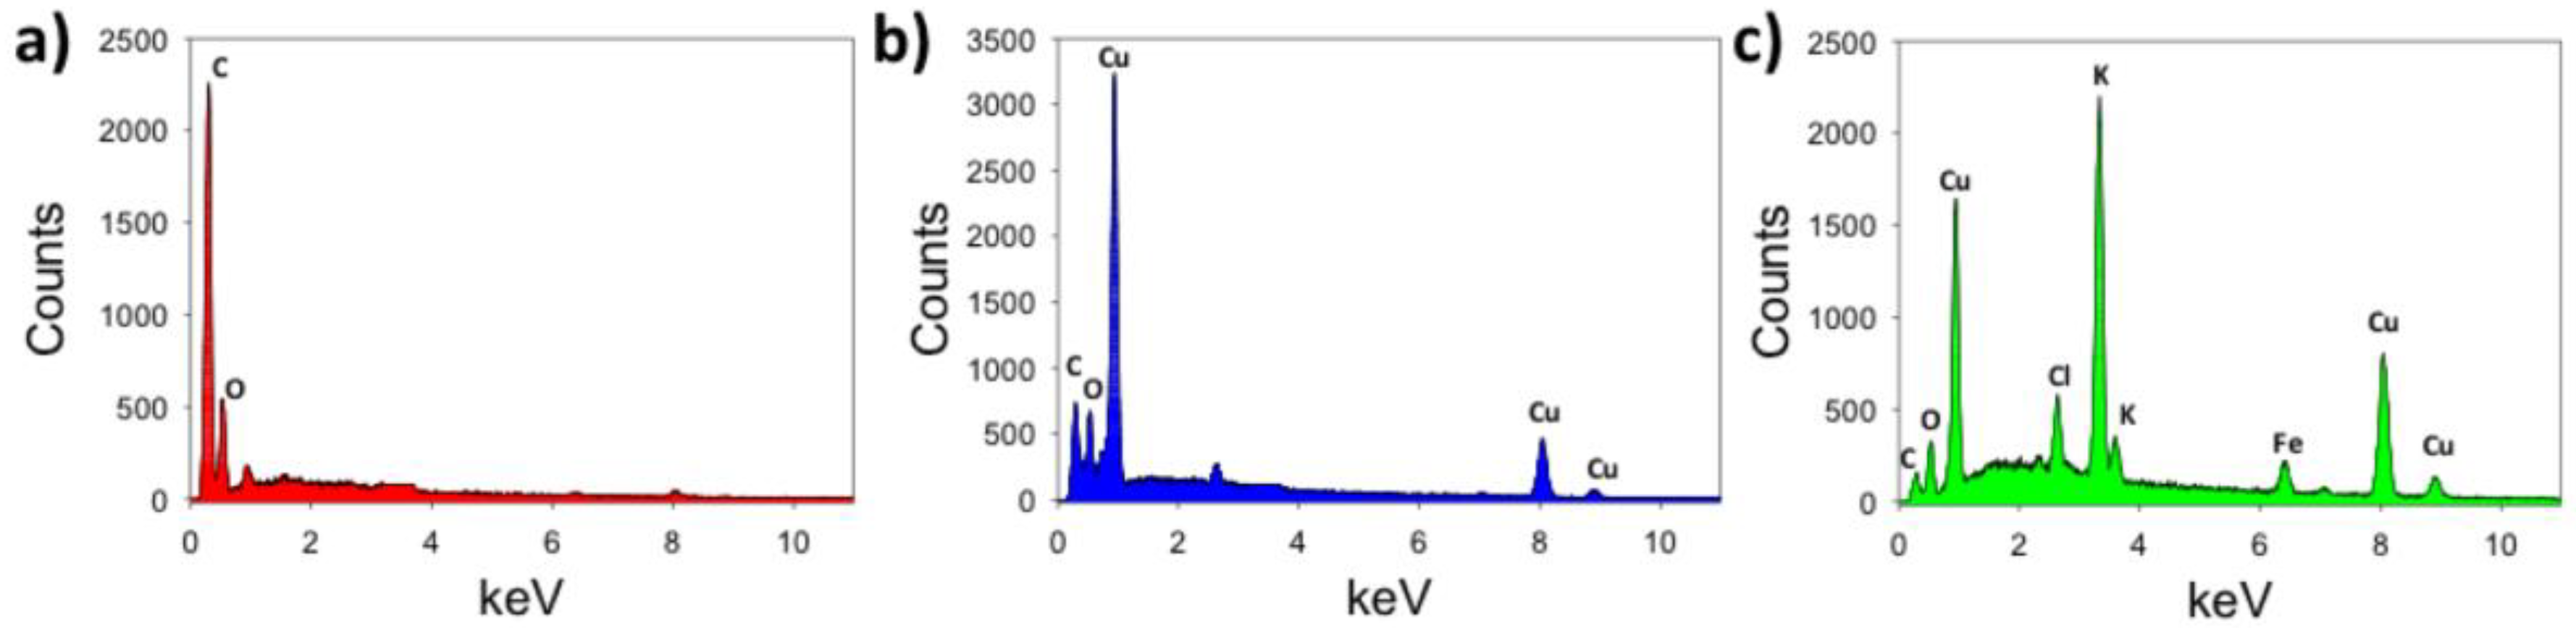
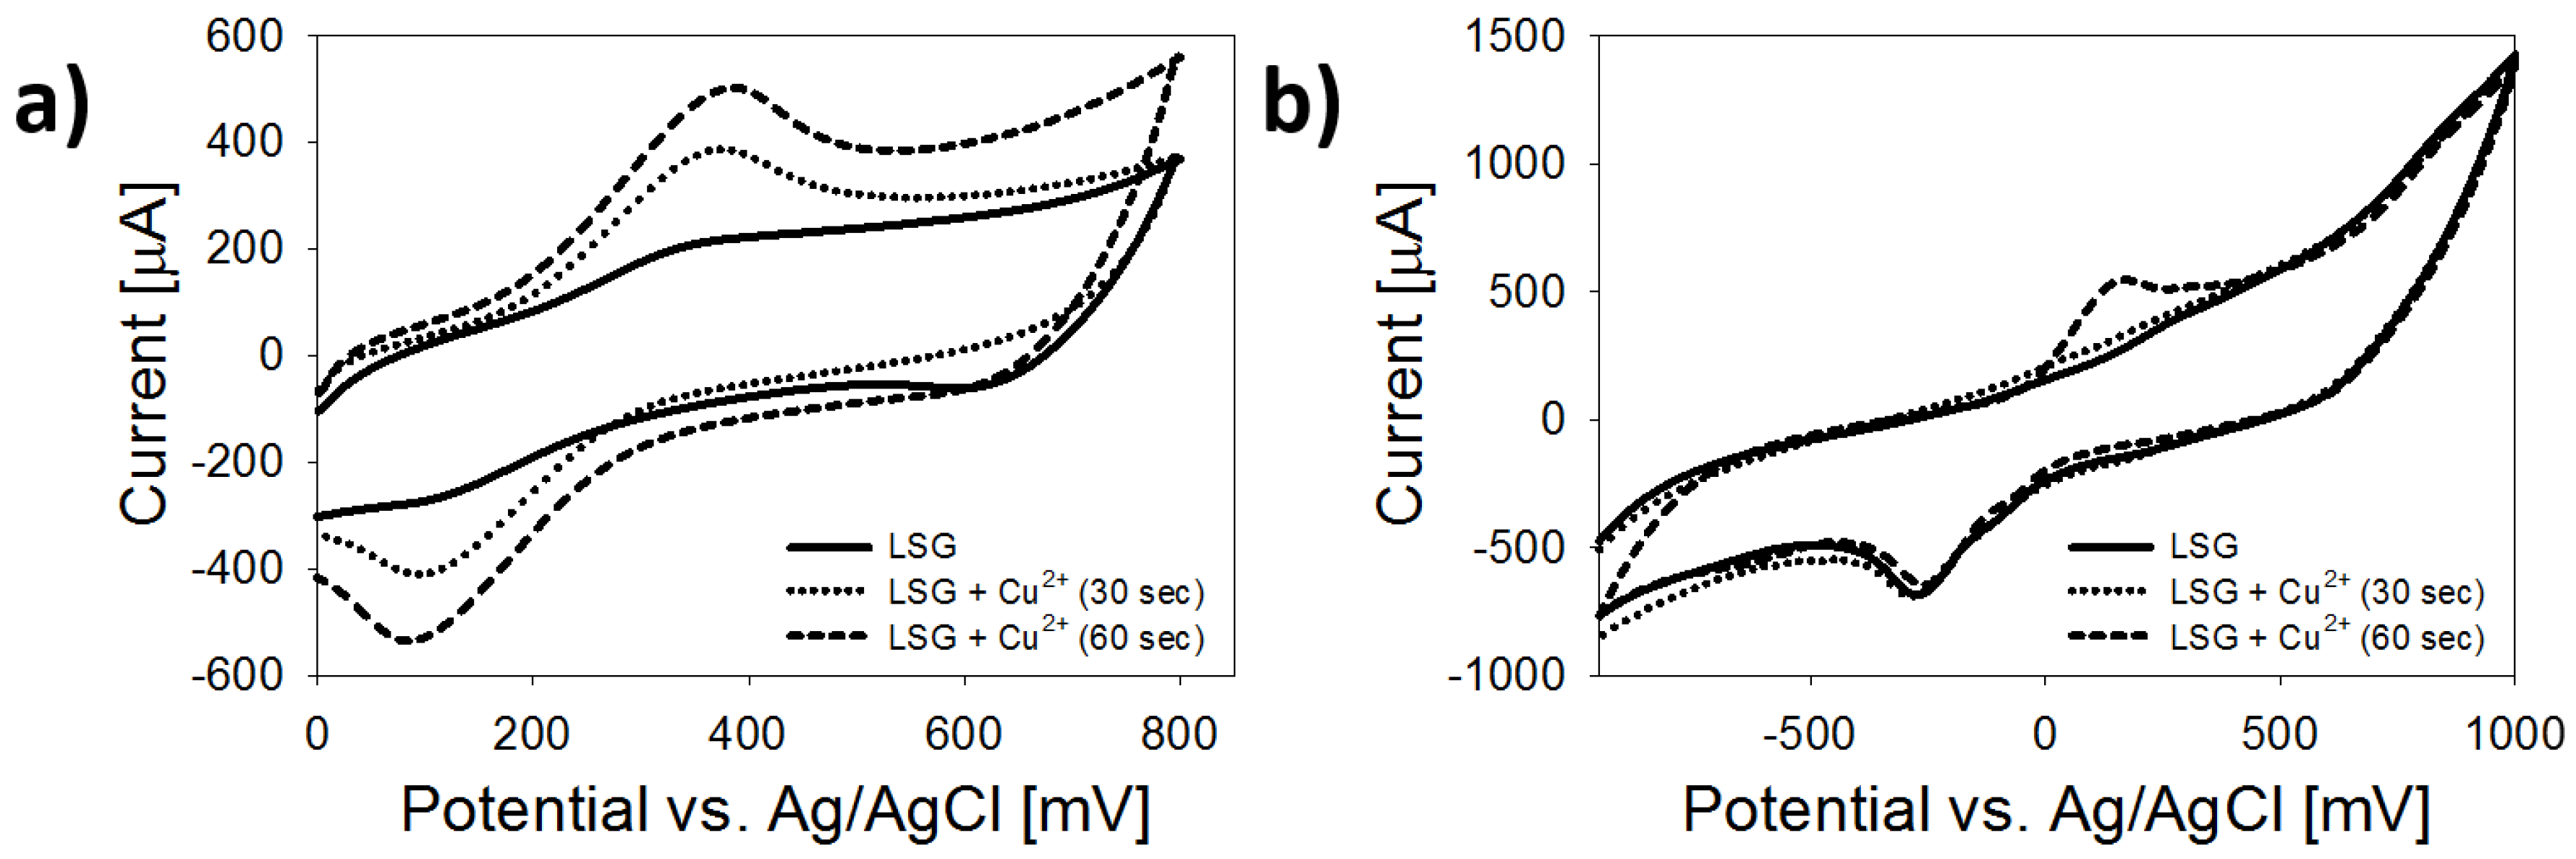
| LSG | NA | C (0.28 keV) O (0.54 keV) | ≈100 | 0.34 ± 0.05 | 0.0030 ± 0.0011 |
| 4 LSG + nCU (CuSo4 source) | 25 to 300 nm (urchin, crystallite) | Cu (0.92 keV) Cu (8.1 keV) | ≈500 | 0.46 ± 0.06 | 0.0038 ± 0.0017 |
| 4 LSG + nCU (local source) | 500 to 1000 nm (rod, mesotube) | Cu (0.92 keV) Cu (8.1 keV) K (3.3 keV) Cl (2.6 keV) Fe (6.97 keV) | ≈280 | 0.50 ± 0.21 | 0.0033 ± 0.0020 |
| Sensor Conformation | Food Sample (BA) | Sensitivity (µA/mM) | LOD (µM) | t95 (s) | Reference |
|---|---|---|---|---|---|
| DAO/Pt-NP/Graphene/Chi/SPE | fish (His) | 63.1 | 0.02 | NR | Apetrei [48] |
| DAO-HRP/polysulfone/CNT/ ferrocene/SPE | fish (His) | 19 | 0.17 | 20 | Pérez [51] |
| DAO/photoHEMA/SPE | prawn (His) | 0.62 | 5.8 | 50 | Keow [52] |
| DAO/CeO2-PANI/GCE | prawn (His) | 51.47 | 48.7 | 1 | Gumpu [50] |
| DAO/Nafion/MnO2/SPE | chicken (His/Tyr) | 5.95 | 3.0 | NR | Telsnig [53] |
| DAO-HRP/SPE | fish (His) | 17.66 | 0.18 | NR | Alonso-Lomillo [54] |
| HMD/TTF/SPCE | octopus (His/Put) | 10.2 | 8.1 | NR | Henao-Escobar [55] |
| LSG-nCu-CNC/DAO (analytical grade materials) | fish (His) | 58.7 ± 5.9 | 7.7 ± 2.8 | 4.1 ± 1.7 | This work |
| LSG-Cu-MFC/DAO (locally sourced materials) | fish (His) | 23.3 ± 1.9 | 11.6 ± 2.6 | 7.3 ± 2.5 | This work |
© 2018 by the authors. Licensee MDPI, Basel, Switzerland. This article is an open access article distributed under the terms and conditions of the Creative Commons Attribution (CC BY) license (http://creativecommons.org/licenses/by/4.0/).
Share and Cite
Vanegas, D.C.; Patiño, L.; Mendez, C.; Oliveira, D.A.d.; Torres, A.M.; Gomes, C.L.; McLamore, E.S. Laser Scribed Graphene Biosensor for Detection of Biogenic Amines in Food Samples Using Locally Sourced Materials. Biosensors 2018, 8, 42. https://doi.org/10.3390/bios8020042
Vanegas DC, Patiño L, Mendez C, Oliveira DAd, Torres AM, Gomes CL, McLamore ES. Laser Scribed Graphene Biosensor for Detection of Biogenic Amines in Food Samples Using Locally Sourced Materials. Biosensors. 2018; 8(2):42. https://doi.org/10.3390/bios8020042
Chicago/Turabian StyleVanegas, Diana C., Laksmi Patiño, Connie Mendez, Daniela Alves de Oliveira, Alba M. Torres, Carmen L. Gomes, and Eric S. McLamore. 2018. "Laser Scribed Graphene Biosensor for Detection of Biogenic Amines in Food Samples Using Locally Sourced Materials" Biosensors 8, no. 2: 42. https://doi.org/10.3390/bios8020042
APA StyleVanegas, D. C., Patiño, L., Mendez, C., Oliveira, D. A. d., Torres, A. M., Gomes, C. L., & McLamore, E. S. (2018). Laser Scribed Graphene Biosensor for Detection of Biogenic Amines in Food Samples Using Locally Sourced Materials. Biosensors, 8(2), 42. https://doi.org/10.3390/bios8020042