FRET Microscopy in Yeast


1
Department of Systems and Synthetic Microbiology, Max Planck Institute for Terrestrial Microbiology, 35043 Marburg, Germany
2
LOEWE Center for Synthetic Microbiology (SYNMIKRO), 35043 Marburg, Germany
*
Author to whom correspondence should be addressed.
Biosensors 2019, 9(4), 122; https://doi.org/10.3390/bios9040122
Submission received: 30 June 2019
/
Revised: 19 September 2019
/
Accepted: 30 September 2019
/
Published: 11 October 2019
(This article belongs to the Special Issue FRET-Based Biosensors)
Abstract
:Förster resonance energy transfer (FRET) microscopy is a powerful fluorescence microscopy method to study the nanoscale organization of multiprotein assemblies in vivo. Moreover, many biochemical and biophysical processes can be followed by employing sophisticated FRET biosensors directly in living cells. Here, we summarize existing FRET experiments and biosensors applied in yeasts Saccharomyces cerevisiae and Schizosaccharomyces pombe, two important models of fundamental biomedical research and efficient platforms for analyses of bioactive molecules. We aim to provide a practical guide on suitable FRET techniques, fluorescent proteins, and experimental setups available for successful FRET experiments in yeasts.
1. Introduction
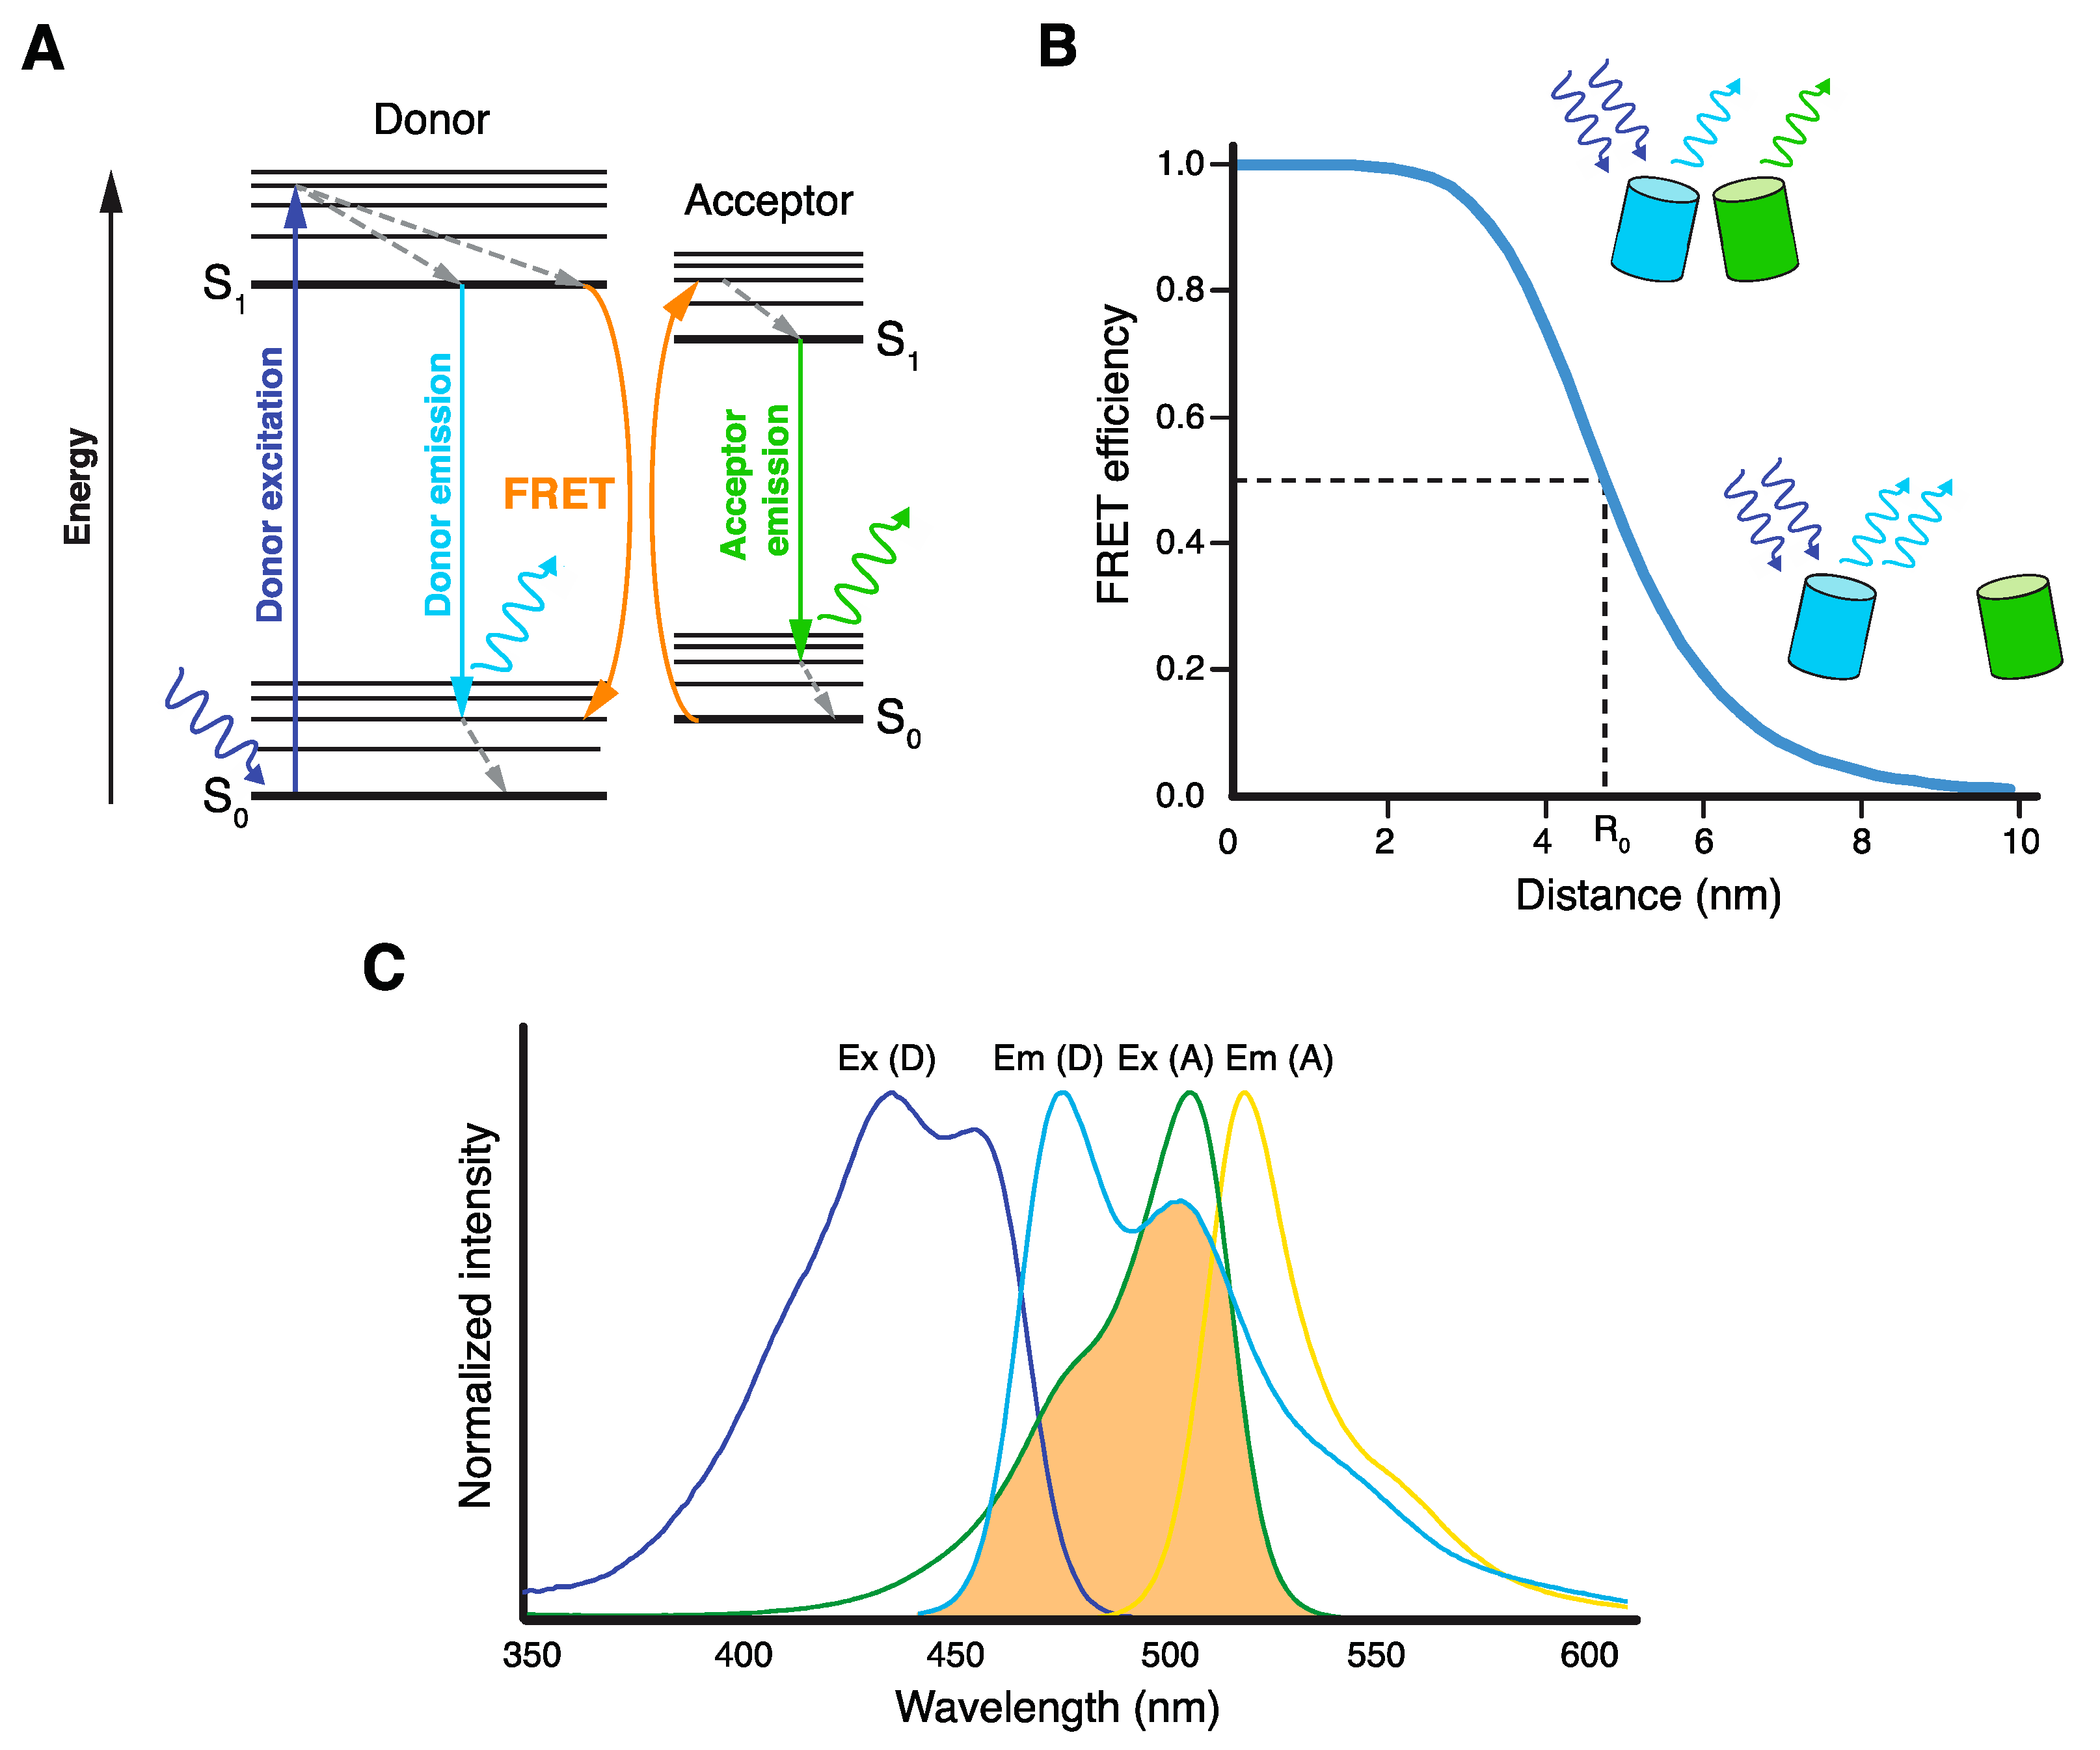
Förster resonance energy transfer (FRET) is an electromagnetic phenomenon, by which the energy of a light-excited fluorophore molecule (FRET donor) is transferred in a non-radiative way (by dipole–dipole coupling) to another molecule (FRET acceptor) located in very close proximity [1,2,3]. FRET leads to decreased fluorescence emission of the FRET donor, manifested either by its lower intensity or shorter lifetime. When the FRET acceptor is also a fluorophore, FRET leads to its excitation and subsequent fluorescence emission (Figure 1A). In addition, FRET changes the polarization of the fluorescence emitted by both donor and acceptor.
As described in the following three fundamental equations, FRET efficiency (EFRET) depends on the orientation of donor and acceptor dipole moments (κ2), the quantum yield of the donor (Φ0), the extinction coefficient of the acceptor (εA), the overlap integral between the normalized donor emission and acceptor excitation spectra (J), and, very importantly, the sixth root of the distance between donor and acceptor molecules (R) [1,2,3,4]:
with being the normalized donor emission intensity, n the refractive index of the medium, and λ the wavelength. R0 is the Förster radius (in nm), a distance specific to every donor–acceptor pair, at which an excited donor releases half of its energy by FRET (EFRET = 0.5).
Because of its strict distance dependency, FRET usually occurs only between molecules separated by less than 10 nm (Figure 1B). This endows FRET with a unique nanometer sensitivity, which is very advantageous for its application to study proximities and interactions of various biomacromolecules, either in vivo or in vitro [4,5,6]. Especially in living cells, several FRET microscopy techniques were implemented to study (supra)molecular structures, events, and reactions with unprecedented spatial resolution, and with only minimal interference with the studied system [7,8]. The prerequisite for in vivo FRET experiments is tagging the molecules of interest with suitable FRET donor and acceptor, either chemically or genetically [9,10]. One of the most common techniques is the attachment of FRET-proficient fluorescent proteins (FPs) to proteins of interest via the co-expression of their coding sequences in cells. With the constant improvement of suitable FPs, tagging, illumination, and detection techniques, FRET microscopy has become increasingly popular among researchers studying various aspects of life at the molecular level.
Though there are many biological questions that can be powerfully approached by FRET microscopy in vivo, for simplicity we split here these efforts into two broad areas: (i) studies on spatiotemporal organization of cellular multiprotein assemblies using FRET as a molecular ruler, and (ii) analyses of biochemical and biophysical reactions in cells using FRET biosensors. We will also narrow our focus to FRET studies performed with two important unicellular model organisms: budding yeast Saccharomyces cerevisiae and fission yeast Schizosaccharomyces pombe. Both yeasts have continuously served as “living test tubes” for studies of fundamental cellular processes, and as “screening platforms” for analysis of various bioactive compounds. Their pivotal role in current biomedical research is justified by many molecular processes conserved between them and humans, their straightforward cultivation and genetic manipulation, and their exceptionally well-characterized molecular biology and biochemistry. As summarized below, FRET microscopy has been a very beneficial method leading to many important discoveries made with yeasts.
To strengthen the application of FRET microscopy in yeast, we first provide an overview of FRET experiments performed to map yeast multiprotein assemblies in vivo. Second, we list FRET biosensors applied to study biochemical or biophysical events in yeast. Third, we describe suitable FRET techniques and fluorescent proteins for FRET microscopy in yeast, discussing their advantages and potential shortcomings. Finally, we provide several practical tips for successful FRET imaging of yeasts cells. We assume that also readers not directly working with yeast will find this review helpful, as many topics covered (choice of suitable FRET technique, fluorophores, etc.) are broadly applicable to FRET experiments with other uni- and multicellular organisms.
2. Mapping the Organization of Yeast Protein Complexes by FRET
The characterization of the nanoscale architecture of cellular supramolecular assemblies is critical for the understanding of their function and mechanism of action. Because of its unique spatial sensitivity, FRET has been repeatedly used to elucidate the organization of many crucial multiprotein complexes in yeast. In a general scheme of these experiments (Figure 2A), yeast strains containing pairs of complex subunits tagged with donor and acceptor FPs are first constructed and tested for functionality. Cells are then analyzed for the presence of FRET between the protein fusions, which indicates their molecular proximity. Further views of a complex arrangement or its potential regulation can be then acquired by using truncated or mutated proteins, or by working with cells deleted of potential cofactors, bridging proteins, modifying enzymes, etc.
The molecular architecture of several large multiprotein assemblies, which consist of dozens of subunits (usually presented in multiple copies), has been systematically analyzed by FRET in yeast: the organization of the nuclear pore complex and its associated transport factors [11,12], kinetochore [13,14,15], spindle pole body (microtubule organizing center in yeast) [16,17,18,19,20], cell division contractile ring [21] (Figure 2B), and endocytic coat [22,23] (Figure 2C). Also, interactions of several smaller complexes of DNA/chromatin regulatory proteins were determined by FRET: the architecture of yeast cohesin [24], interaction between Gal4 transcription factor and SAGA complex [25], crosstalk between PCNA protein Pol30 and SAS-I complex [26], or binding of ATR kinase complex Dcp2-Mec1 with PP4 phosphatase Psy2-Php3 [27]. The assembly of membrane-associated complexes, including the oligomerization of protein Ste2 [28,29,30], iron permease Fet3-Ftr1 [31], copper transporter Ctr1 [32], and Ato1-Ato2 proteins [33]; Tom70 fragment [34]; and vacuolar V-ATPase [35], was followed by FRET on the yeast plasma, mitochondrial, and vacuolar membranes, respectively. Importantly, several complexes of principal signaling pathways were assessed by FRET microscopy in yeast: interaction of cyclin-dependent kinase inhibitor Sic1 with various cyclins [36] or binding of Ste5 scaffold with Fus3 MAPK kinase during activation of the yeast mating pathway [37]. Finally, FRET has also been used to map interactions of heterologous proteins expressed in yeast. Very interesting examples of this approach are studies on disease-related aggregation of Prp prion alone or with amyloid β peptide [38,39], hungtingtin protein [40], or yeast protein Toh1 with yeast prions Rnq1 and Sup35 [41]. The protein complexes mapped by FRET in yeast are summarized in Table 1, also highlighting the used FRET fluorophores and applied techniques. Several of these studies resulted in a specific FRET protocol for a given complex or compartment (see Table 1).
These successful efforts illustrate the power of FRET-based mapping of protein assemblies in yeast. The main advantage is the simplicity by which yeast strains expressing FP-tagged pairs of complex subunits can be generated. The protein fusions can be made either N- or C-terminally, and very importantly, are usually expressed from endogenous loci, assuring near-native protein levels. Though this could be eventually reached in other cell types too (e.g., by CRISPR-Cas9 DNA editing techniques), the following tests for functionality of constructed protein fusions are very straightforward in yeast haploid cells.
FRET-based protein proximity mapping in yeast can also encounter some difficulties. Aside from constraints not directly related to FRET (e.g., the given protein complex is evolutionarily too dissimilar to be studied in yeast), the densely packed yeast cytoplasm and highly mobile intracellular membrane compartments could be disadvantageous for FRET mapping of certain protein complexes. Fluorescently tagged subunits of low abundance, or inversely, highly ubiquitous protein complexes, might give an insufficient signal-to-noise ratio of fluorescence signal, making their FRET analyses difficult. In addition, protein complexes of mobile membrane organelles might be too dynamic for reliable FRET measurements. Nevertheless, further developments of fluorescent microscopy tools might soon provide better spatiotemporal resolution for FRET analyses of these low-abundant or dynamic yeast protein complexes.
3. Analyzing Biochemistry and Biophysics of Yeast by FRET Biosensors
Genetically-encoded FRET biosensors became popular tools for monitoring various molecular events in vivo soon after the first application of fluorescent proteins [45]. Though diverse in their molecular design, the unifying theme of FRET biosensors is the presence of a FRET donor and acceptor pair reporting about a specific molecular event by changes in their proximity or orientation, hence in FRET. These changes can be invoked by several means: by sensor cleavage, by conformational change of the sensor after ligand/cofactor binding, by chemical modification, by physical stretching of the sensor, etc. [46,47] (Figure 3). The donor and acceptor parts of a FRET biosensor can be either attached to two separate molecules or be part of a single macromolecule. The later setup is advantageous as it greatly simplifies the FRET readout because of the equimolar concentration and identical spatial behavior of the donor and acceptor.
Though development of FRET biosensors is often a complex endeavor [48], they offer many advantages in comparison to other biochemical and biophysical analytical tools. Foremost, they can be used in living cells with only minimal perturbations of the studied system [49]. Next, because of their fluorescence readout, they provide high sensitivity to analyze a given reaction, either at the population, single cell, or even subcellular level. Finally, as FRET signal of a sensor can usually be followed over time, various modulations of the studied reaction can be directly performed and analyzed in vivo (e.g., changing the concentration of reactants, temperature, activity of involved enzymes).
Table 2 summarizes FRET biosensors applied in yeast so far. Many sensors have been used to follow metabolites and ions fluxes in yeast. The design, calibration, and application of this type of FRET sensors have already been carefully discussed [49], so we provide here an update of more recently implemented sensors (see Table 2). These sensors not only assess metabolite/ion concentrations in yeast, but also help to delineate functions and regulatory networks of involved enzymes (e.g., in respective mutant strains) [50,51,52]. Remarkably, some metabolite/ion FRET biosensors were directly developed from specific yeast proteins or systematically optimized in yeast. To the first group belong zinc ion, copper ion, and redox FRET biosensors based on parts of transcription factors Zap1, Ace1 (or Candida albicans homolog Amt1), and Yap1, respectively [53,54,55]. The second group is represented by FRET biosensors for nitrate and oligopeptide transport in plants, and for the plant hormone abscisic acid [56,57].
As mentioned in the previous section, FRET can be efficiently used to study medically related prion aggregation in yeast. In a pilot study, an elegant FRET biosensor (AmFRET) was designed to analyze nucleation kinetics of several yeast prion-like proteins [58]. It consists of a single photoconvertible FP, mEos3.1, fused to the studied protein. When mEos3.1 was partially photoconverted from its green to red form by blue light, the two mEos3.1 forms became the FRET donor and acceptor, showing FRET during protein aggregation. In addition, yeast was also used as a screening platform for the evolution of proteases specifically targeting amyloid β peptide, here fused to CyPet-YPet FPs for FRET readout of its cleavage [59] (see scheme in Figure 3A).
Aside from tracing individual molecules, FRET biosensors can also monitor crucial cellular processes. Transcriptional activity of different RNA polymerase II promoters was followed by the expression of RNA aptamers (IMAGEtags), which mediate FRET of its specific Cy3/5-labeled ligands [60]. Activities of principal signaling pathways, mating MAPK kinase and starvation cAMP/PKA pathways, were analyzed by FRET sensors for MAPK activity (yEKAREV) [61], cAMP presence (Epac2-camps), and PKA activity (AKAR3) [62]. The kinase activity sensors contain a kinase-specific phosphorylation site connected by a flexible linker to a particular phosphopeptide-binding domain. The intramolecular binding of these two moieties is monitored by FRET changes between FPs also carried by the sensor (see scheme in Figure 3B).
Finally, the biophysics of several cellular processes has been studied by sophisticated FRET-based tension/force biosensors in yeast (see scheme in Figure 3C). Force applied on the kinetochores during chromosome segregation was recently analyzed by a FRET tension sensor incorporated into the kinetochore protein Ndc80 [63]. Experiments are also ongoing to analyze forces required for plasma membrane invagination during endocytosis. Here, calibrated FRET-based tension sensors (originally developed for mechanotransduction studies of focal adhesions [64]) were introduced into force-transmitting protein Sla2 to monitor forces generated by the actin cytoskeleton during endocytic vesicle formation in yeast [65,66].
The advantages and shortcomings of FRET biosensors in yeast are similar to pros and cons of FRET-based protein–protein mapping. Several expression systems can be applied to regulate the expression of genetically-encoded FRET sensors in yeast. Attention should again be paid to control for the specificity of the FRET signal, especially in the case of very low or high expression of sensors. However, when monitoring of FRET biosensors is established, the ease of genetic and experimental manipulations of yeast opens many possibilities for a potential interference and subsequent analysis of studied events, either in single cells or cell population.
4. FRET Microscopy Techniques for Yeast Models
The principles of FRET allow its measurement by several different microscopy or spectroscopy techniques [3,4,8,77,78,79,80,81,82,83,84]. They can be divided into methods following changes in donor or acceptor fluorescence intensity, donor or acceptor fluorescence polarization/anisotropy, and the lifetime of the donor fluorescence (Figure 4).
The presence of FRET lessens the fluorescence emitted by excited donor molecules. This can be observed either as quenching of donor fluorescence in the presence of an acceptor, or its dequenching in the acceptor’s absence. The later phenomenon can be easily achieved without actual removal of the acceptor by its specific photoinactivation with a laser, giving the method its name: donor dequenching after acceptor photobleaching, or more simply, acceptor photobleaching (Figure 4A). Acceptor photobleaching represents a simple and reliable FRET technique that can be easily performed with any fluorescence microscope equipped with a laser suitable to photobleach the chosen acceptor FP. The experimental setup and analysis are straightforward: Several acceptor and donor acquisitions are taken before and after acceptor photobleaching. The completeness of acceptor photobleaching is controlled and donor fluorescence is corrected for structural photobleaching occurring during the acquisition. The FRET efficiency is then calculated as percentage increase of donor fluorescence after acceptor photobleaching in comparison to its prebleach value. Because of the size of yeast cells, several cells can usually be efficiently photobleached in a short time without any phototoxic effects. A critical drawback of this method is its endpoint character caused by irreversible photodestruction of the acceptor fluorophore. Nevertheless, FRET changes in time (e.g., expected change of protein complex composition or conformation) can be followed indirectly, for example by using another protein as a “time stamp” of the process (see [19,22] for examples). To capture transient molecular proximities, cells can first be fixed with formaldehyde, which was recently shown to preserve temporal protein complexes, as well as FRET between FPs [22,85].
By means of FRET, acceptor molecules can be excited, releasing the acquired energy as fluorescence (Figure 4B). This is called donor-sensitized acceptor emission (or simply sensitized emission), which can be observed by many standard wide-field and confocal microscopes equipped with filter sets for chosen fluorophores. Sensitized emission can be registered in setups dubbed “three-cube FRET” and “spectral FRET”. For the common “three-cube FRET” technique, three different acquisitions of the sample are taken using filters for: donor excitation and emission, acceptor excitation and emission, and donor excitation and acceptor emission (so-called “FRET channel”). Next, acquisitions of donor- and acceptor-only cells are performed to correct for the bleed-through of donor emission into the acceptor emission channel and acceptor cross-excitation after donor excitation, respectively. In the end, three different strains should be imaged next to each other to avoid day-to-day variations in protein expression, microscopy setup, etc. Though the acquisition is then slightly more complex and error-prone in comparison to acceptor photobleaching, the calculation of the apparent FRET efficiency is again relatively simple, as it is already implemented in many microscopy and image analysis software tools. Sensitized emission can be similarly determined by “spectral FRET” recording full emission spectra after donor and acceptor excitation [77]. The key advantage of both techniques is the option of (semi-)continuous FRET measurements over time. This is even more apparent for the simplified version of sensitized emission recording, “ratiometric FRET”. Here, only ratios of acceptor and donor emission (or vice versa), invoked by donor excitation, are followed during a biological process or after its experimental intervention (substrate or inhibitor addition, etc.). The ratiometric readout also has a higher sensitivity to follow FRET changes in comparison to monitoring donor or acceptor signals separately (Figure 4C). Donor and acceptor emissions can be recorded either sequentially by changing microscope filter cubes, or simultaneously using an image splitting device containing both emission filters and an appropriate dichroic mirror. The simplicity and speed of recording makes ratiometric FRET the method of choice for analyses of relative FRET changes in real time (e.g., of calibrated FRET biosensors).
The presence of a FRET partner also changes the anisotropy (polarized character) of the fluorescence emitted by the donor/acceptor when the polarized light is used for its excitation. Techniques following fluorescence anisotropy are highly sensitive for FRET and offer fast readout (useful for high-throughput screens), but they are not quantitative. Importantly, they can be applied on a pool of molecules tagged with a single FP, where individual FP molecules work both as donor and acceptor because of an overlap between FP’s excitation and emission spectra. This special technique, called “homoFRET”, is often used to analyze clustering or homo-oligomerization of tagged molecules, as further detailed in [83].
Finally, in the presence of a FRET acceptor, donor molecules stay shorter in their excited state (as their energy relaxation by FRET is substantially faster than the relaxation by photon emission), which is connected to the shorter lifetime of their fluorescence. This can be followed by sophisticated techniques of fluorescence lifetime imaging microscopy (FLIM, or more precisely, FRET-FLIM), which compare changes in donor fluorescence lifetime in the presence or absence of an acceptor (Figure 4D). FRET-FLIM techniques follow either fluorescence decay of donor molecules simultaneously excited by a pulse laser (time domain measurements) or phase shifts of donor-emitted fluorescence (frequency domain measurements) [81,82]. Pools of donor molecules involved in—or absent of—FRET can be discerned by FRET-FLIM because of their different fluorescence lifetimes (Figure 4D). In addition, FRET-FLIM is also much less sensitive to concentration differences between donor and acceptor molecules in comparison to other FRET techniques. Altogether, FRET-FLIM offers deeper mechanistic insights into the analyzed FRET system at the expense of specialized microscopy instruments and complex analysis of acquired data. Theoretically, only two measurements are necessary: determination of the donor fluorescence lifetimes in strains containing and absent of an acceptor. Practically, several other controls are often needed to properly calibrate a sensitive FRET-FLIM system (cells with free donor FP, donor–acceptor fusion, etc.). In addition, to obtain statistically robust fluorescence decay data, thousands of emitted photons need to be registered. This usually requires a high number of donor molecules being recorded for a certain time, so low abundant proteins might not be suitable for FRET-FLIM. In conclusion, if not directly available in an adjacent expert laboratory or core facility, FRET-FLIM techniques are rather suited as an advanced step to study FRET systems already explored by less-elaborate FRET methods mentioned above.
The advantages and potential drawbacks of discussed FRET methods, as well as instrumental and analytical requirements, are summarized in Table 3.
5. Fluorescent Proteins and Imaging Tips for FRET Microscopy in Yeast
The choice of FPs used as the FRET donor and acceptor is very important for a successful FRET experiment. As already mentioned, FRET depends on the quantum yield of the donor and the extinction coefficient of the acceptor, two key characteristics constituting the in vitro brightness value of FPs. In addition, a substantial overlap between the donor emission and acceptor excitation spectra is critical for FRET. Several other FP characteristics are, however, important for its in vivo performance, especially for FRET measurements [47,86,87]. Foremost, it is essential to assess the practical in vivo brightness of FP in yeast, which is influenced by its folding and maturation time, pH and ion sensitivity, degradation rate, etc. Next, for FRET time-lapse experiments, the photostability of FPs is very important, as accumulation of photobleached FRET-inactive molecules decreases the FRET sensitivity and can influence the calculated FRET values. Finally, only monomeric FPs with simple decay kinetics and that are absent of photochromic effects should be used to avoid artifacts in FRET calculations [47,86,87].
Advantageously, yeast biologists have already tested and implemented many FPs for yeast in vivo imaging studies. These efforts culminated in the recent comprehensive study that compared important characteristics of many advanced versions of FPs in yeast [88]. Based on the current literature and our experimental expertise, we suggest below the most suitable FRET pairs and discuss their usefulness for various FRET approaches. Nevertheless, as development of new FPs continues, other combinations of FPs suitable for FRET in yeast will certainly be achievable after rigorous in vivo validation. To search for other FPs, we suggest the use of FPbase (www.fpbase.org), a curated database of available FPs, which also provides an intuitive, user-adoptable FRET calculator [89].
Because of their good spectral overlap and advantageous match of their brightness, cyan fluorescent proteins (CFPs) and yellow fluorescent proteins (YFPs) have often been used for FRET analyses, not only in yeast (see Table 2). This applies not only for traditional enhanced CFP and YFP (ECFP–EYFP) FRET donor–acceptor pair, but also for later implemented advanced CFP and YFP variants: mCerulean, CyPet, mTurquoise2, and mVenus, mCitrine, YPet, respectively. The limitations of CFP-YFP FRET pairs are: (i) relatively low brightness of CFPs, which together with high autofluorescence of yeast cytoplasm below 490 nm, decreases signal-to-noise ratio of their fluorescence, especially in the case of low-abundant proteins and sensors; (ii) some unwanted characteristics of YFPs, including their lower photostability, higher pH/ion sensitivity, and dimerization tendencies. Though not much brighter than ECFP, we suggest mTurquoise2 (mTq2) [90] as CFP-like donor because of its better signal-to-noise readout for several tested yeast protein structures (Milani et al.; in preparation). A very good substitute to YFPs is the green-yellow fluorescent protein mNeonGreen (mNG) [91], which in yeast is a very bright, fast-folding, and photostable monomeric FP with simple decay kinetics [88,92]. The blue shift of its excitation spectrum also increases its spectral overlap with CFPs. According to comprehensive tests in other systems [93] and in our practice [22,66] in yeast, mTq2-mNG constitutes a very robust FRET pair for many FRET techniques.
To avoid the interference with yeast cytosolic autofluorescence and to better visualize less abundant donor proteins, combinations of green and red fluorescent proteins (GFPs and RFPs) can be used as FRET donor–acceptor pairs. Though EGFP still has good fluorescent characteristics to serve as a bright FRET donor, mNG offers substantially higher brightness and better spectral overlap with RFP-based acceptors. Compared with many RFPs tested in yeast, mCherry and mScarlet-I [94] represent, in our opinion, the most suitable FRET acceptors because of their good and excellent brightness, respectively. However, though EGFP-mCherry and mNG-mScarlet-I FRET pairs are valuable for acceptor photobleaching, both mCherry and mScarlet-I come with some limitations for sensitized emission FRET techniques. First, the fluorescence of mCherry is too weak to be reliably monitored by ratiometric FRET. Second, though mScarlet-I is substantially brighter than mCherry and its ratiometric readout is, thus, possible, it is clearly less photostable. Careful correction for its photobleaching should be, therefore, applied for time-lapse sensitized emission experiments.
The power of yeast genetics and available tagging techniques offer multiple ways to fuse a suitable FP to a protein of interest. These techniques allow endogenous tagging of proteins, either N- or C-terminally (or even internally), in a fast and efficient way, often directly providing short linkers needed for the random orientation of the FP in the protein fusion. The full coverage of these techniques is beyond the scope of this review, so we list here only selected original works focused on FP tagging [95,96,97,98,99]. Similarly, the palette of tools for well-tuned expression of FRET biosensors from either a plasmid or from the genome is broad, so we suggest first testing an expression system used in the original study or established in your lab.
We conclude with several practical tips regarding cell and microscope preparation for FRET imaging in yeast. As autofluorescence of yeast cytosol and vacuoles can seriously interfere with the fluorescence signals of especially CFPs and RFPs, respectively, we suggest minimizing it by using a low-fluorescence minimal medium (without folic acid, riboflavin, and eventually tryptophan) and working with freshly grown early logarithmic cells. Also, movement of cells during imaging should be prevented by their stable attachment to the microscopy slide (e.g., by lectin concanavalin A). For extensive FRET experiments, it is also worth optimizing the optical configuration of the microscope (used excitation or emission filters and dichroic mirrors) to achieve the highest performance of your chosen FRET pair (e.g., minimized bleed-through and cross-talk signals). Finally, considering that in vivo FRET signal often constitutes only a small percentage of the total registered fluorescence, a careful control of its specificity is always desirable. This is imperative especially when the FRET donor and acceptor are two molecules of different abundance or mobility, as this can influence apparent FRET values (discussed in more detail in [79]). All necessary control strains (donor or acceptor only, no FRET control with clearly separated donor–acceptor pair, FRET positive donor–acceptor FPs fusions, etc.), including strains expressing protein fusions with interchanged FPs, should be considered to corroborate observed FRET signals.
6. Concluding Remarks
The outstanding ability to sensitively and non-invasively analyze molecular proximities and reactions directly in living cells has made FRET microscopy an invaluable tool for modern biomedical research. The importance and application of FRET in yeast will probably be ever-increasing, especially if it is coupled to current single molecule localization microscopy approaches [21], to which FRET is not only partially complementary, but even superior in regard to spatial resolution. In addition, FRET will certainly gain from current fast development of new microscopy tools and fluorescent probes. All of the above, applied on the experimentally robust and outstandingly characterized yeast models, gives strong promise that FRET studies will provide us with a great wealth of new mechanistic and systems information about fundamental cellular processes, often directly important for human wellness.
Author Contributions
conceptualization, M.S.; methodology, validation, investigation, M.S., E.P., and M.A.; writing—original draft preparation, M.S.; writing—review and editing, M.S., E.P., and M.A.; preparation of figures, M.A.; project administration, M.S.; funding acquisition, M.S.
Funding
This research was funded by Deutsche Forschunsgemeinschaft (DFG) Research Grant SK 305/1-1.
Acknowledgments
We thank Gabriele Malengo (Head of Flow Cytometry and Imaging Facility, Max Planck Institute for Terrestrial Microbiology) for his continuous help with our FRET questions and experiments. We apologize to researchers whose studies on FRET and fluorescent proteins in yeast we did not cover.
Conflicts of Interest
The authors declare no conflict of interest.
References
- Förster, T. Energiewanderung und Fluoreszenz. Naturwissenschaften 1946, 6, 166–175. [Google Scholar] [CrossRef]
- Förster, T. Zwischenmolekulare Energiewanderung und Fluoreszenz. Ann. Phys. 1948, 437, 55–75. [Google Scholar] [CrossRef]
- Terjung, S.; Belyaev, J. Fluorescent Imaging Techniques. FRET and Complementary Methods. In Optical Probes in Biology, 1st ed.; Zhang, J., Mehta, S., Schultz, C., Eds.; CRC Press: Boca Raton, FL, USA, 2014; pp. 33–70. [Google Scholar]
- Ishikawa-Ankerhold, H.C.; Ankerhold, R.; Drummen, G.P.C. Advanced fluorescence microscopy techniques-FRAP, FLIP, FLAP, FRET and FLIM. Molecules 2012, 17, 4047–4132. [Google Scholar] [CrossRef] [PubMed]
- Stryer, L. Fluorescence Energy Transfer as a Spectroscopic Ruler. Annu. Rev. Biochem. 2003, 47, 819–846. [Google Scholar] [CrossRef] [PubMed]
- Teunissen, A.J.P.; Pérez-Medina, C.; Meijerink, A.; Mulder, W.J.M. Investigating supramolecular systems using Förster resonance energy transfer. Chem. Soc. Rev. 2018, 47, 7027–7044. [Google Scholar] [CrossRef] [PubMed]
- Piston, D.W.; Kremers, G.-J. Fluorescent protein FRET: The good, the bad and the ugly. Trends Biochem. Sci. 2007, 32, 407–414. [Google Scholar] [CrossRef]
- Shrestha, D.; Jenei, A.; Nagy, P.; Vereb, G.; Szöllősi, J. Understanding FRET as a research tool for cellular studies. Int. J. Mol. Sci. 2015, 16, 6718–6756. [Google Scholar] [CrossRef]
- Jares-Erijman, E.A.; Jovin, T.M. FRET imaging. Nat. Biotechnol. 2003, 21, 1387–1395. [Google Scholar] [CrossRef]
- Jares-Erijman, E.A.; Jovin, T.M. Imaging molecular interactions in living cells by FRET microscopy. Curr. Opin. Chem. Biol. 2006, 10, 409–416. [Google Scholar] [CrossRef] [Green Version]
- Damelin, M.; Silver, P.A. Mapping interactions between nuclear transport factors in living cells reveals pathways through the nuclear pore complex. Mol. Cell 2000, 5, 133–140. [Google Scholar] [CrossRef]
- Damelin, M.; Silver, P.A. In Situ Analysis of Spatial Relationships between Proteins of the Nuclear Pore Complex. Biophys. J. 2002, 83, 3626–3636. [Google Scholar] [CrossRef] [Green Version]
- Joglekar, A.; Chen, R.; Lawrimore, J. A Sensitized Emission Based Calibration of FRET Efficiency for Probing the Architecture of Macromolecular Machines. Cell. Mol. Bioeng. 2013, 6, 369–382. [Google Scholar] [CrossRef] [PubMed] [Green Version]
- Aravamudhan, P.; Felzer-Kim, I.; Gurunathan, K.; Joglekar, A.P. Assembling the protein architecture of the budding yeast kinetochore-microtubule attachment using FRET. Curr. Biol. 2014, 24, 1437–1446. [Google Scholar] [CrossRef]
- Guo, W.; Kumar, S.; Görlitz, F.; Garcia, E.; Alexandrov, Y.; Munro, I.; Kelly, D.J.; Warren, S.; Thorpe, P.; Dunsby, C.; et al. Automated Fluorescence Lifetime Imaging High-Content Analysis of Förster Resonance Energy Transfer between Endogenously Labeled Kinetochore Proteins in Live Budding Yeast Cells. SLAS Technol. 2019, 24, 308–320. [Google Scholar] [CrossRef]
- Flory, M.R.; Carson, A.R.; Muller, E.G.; Aebersold, R. An SMC-domain protein in fission yeast links telomeres to the meiotic centrosome. Mol. Cell 2004, 16, 619–630. [Google Scholar] [CrossRef]
- Muller, E.G.D.; Snydsman, B.E.; Novik, I.; Hailey, D.W.; Gestaut, D.R.; Niemann, C.A.; Toole, E.T.O.; Giddings, T.H.; Sundin, B.A.; Davis, T.N. The Organization of the Core Proteins of the Yeast Spindle Pole Body. Mol. Cell. Biol. 2005, 16, 3341–3352. [Google Scholar] [CrossRef] [Green Version]
- Kollman, J.M.; Zelter, A.; Muller, E.G.D.; Fox, B.; Rice, L.M.; Davis, T.N.; Agard, D.A. The Structure of the gamma-Tubulin Small Complex: Implications of Its Architecture nad Flexibility for Microtubule Nucleation. Mol. Cell. Biol. 2008, 19, 207–215. [Google Scholar] [CrossRef]
- Gryaznova, Y.; Caydasi, A.; Malengo, G.; Sourjik, V.; Pereira, G. A FRET-based study reveals site-specific regulation of spindle position checkpoint proteins at yeast centrosomes. Elife 2016, 5, 1–27. [Google Scholar] [CrossRef]
- Viswanath, S.; Bonomi, M.; Kim, S.J.; Klenchin, V.A.; Taylor, K.C.; Yabut, K.C.; Umbreit, N.T.; Van Epps, H.A.; Meehl, J.; Jones, M.H.; et al. The molecular architecture of the yeast spindle pole body core determined by Bayesian integrative modeling. Mol. Biol. Cell 2017, 28, 3298–3314. [Google Scholar] [CrossRef] [Green Version]
- McDonald, N.A.; Lind, A.L.; Smith, S.E.; Li, R.; Gould, K.L. Nanoscale architecture of the Schizosaccharomyces pombe contractile ring. Elife 2017, 6, 1–23. [Google Scholar] [CrossRef]
- Skruzny, M.; Pohl, E.; Gnoth, S.; Malengo, G.; Sourjik, V. The protein architecture of the endocytic coat analyzed by FRET. BioRxiv 2018. [Google Scholar] [CrossRef]
- Warren, D.T.; Andrews, P.D.; Gourlay, C.W.; Ayscough, K.R. Sla1p couples the yeast endocytic machinery to proteins regulating actin dynamics. J. Cell Sci. 2002, 115, 1703–1715. [Google Scholar] [PubMed]
- Mc Intyre, J.; Muller, E.G.D.; Weitzer, S.; Snydsman, B.E.; Davis, T.N.; Uhlmann, F. In vivo analysis of cohesin architecture using FRET in the budding yeast Saccharomyces cerevisiae. EMBO J. 2007, 26, 3783–3793. [Google Scholar] [CrossRef] [PubMed] [Green Version]
- Bhaumik, S.R.; Raha, T.; Aiello, D.P.; Green, M.R. In vivo target of a transcriptional activator revealed by fluorescence resonance energy transfer. Genes Dev. 2004, 18, 333–343. [Google Scholar] [CrossRef] [PubMed] [Green Version]
- Miller, A.; Chen, J.; Takasuka, T.E.; Jacobi, J.L.; Kaufman, P.D.; Irudayaraj, J.M.K.; Kirchmaier, A.L. Proliferating Cell Nuclear Antigen (PCNA) is required for cell cycle-regulated silent chromatin on replicated and nonreplicated genes. J. Biol. Chem. 2010, 285, 35142–35154. [Google Scholar] [CrossRef] [PubMed]
- Hustedt, N.; Seeber, A.; Sack, R.; Tsai-Pflugfelder, M.; Bhullar, B.; Vlaming, H.; van Leeuwen, F.; Guénolé, A.; van Attikum, H.; Srivas, R.; et al. Yeast PP4 interacts with ATR homolog Ddc2-Mec1 and regulates checkpoint signaling. Mol. Cell 2015, 57, 273–289. [Google Scholar] [CrossRef] [PubMed]
- Overton, M.C.; Blumer, K.J. G-protein-coupled receptors function as oligomers in vivo. Curr. Biol. 2000, 10, 341–344. [Google Scholar] [CrossRef] [Green Version]
- Jansma, D.B.; Miller, D.; Friesen, J.D. Protein interaction quantified in vivo by spectrally resolved fluorescence. Biochem. J. 2005, 277, 265–277. [Google Scholar]
- Stoneman, M.R.; Paprocki, J.D.; Biener, G.; Yokoi, K.; Shevade, A.; Kuchin, S.; Raicu, V. Quaternary structure of the yeast pheromone receptor Ste2 in living cells. Biochim. Biophys. Acta-Biomembr. 2017, 1859, 1456–1464. [Google Scholar] [CrossRef]
- Singh, A.; Severance, S.; Kaur, N.; Wiltsie, W.; Kosman, D.J. Assembly, activation, and trafficking of the Fet3p·Ftr1p high affinity iron permease complex in Saccharomyces cerevisiae. J. Biol. Chem. 2006, 281, 13355–13364. [Google Scholar] [CrossRef]
- Sinani, D.; Adle, D.J.; Kim, H.; Lee, J. Distinct mechanisms for Ctr1-mediated copper and cisplatin transport. J. Biol. Chem. 2007, 282, 26775–26785. [Google Scholar] [CrossRef] [PubMed]
- Strachotová, D.; Holoubek, A.; Kučerová, H.; Benda, A.; Humpolíčková, J.; Váchová, L.; Palková, Z. Ato protein interactions in yeast plasma membrane revealed by fluorescence lifetime imaging (FLIM). Biochim. Biophys. Acta-Biomembr. 2012, 1818, 2126–2134. [Google Scholar] [CrossRef] [PubMed] [Green Version]
- Dye, B.T.; Schell, K.; Miller, D.J.; Ahlquist, P. Detecting protein-protein interaction in live yeast by flow cytometry. Cytom. Part A 2005, 63, 77–86. [Google Scholar] [CrossRef] [PubMed]
- Tabke, K.; Albertmelcher, A.; Vitavska, O.; Huss, M.; Schmitz, H.; Wieczorek, H. Reversible disassembly of the yeast V-ATPase revisited under in vivo conditions. Biochem. J. 2014, 462, 185–197. [Google Scholar] [CrossRef] [PubMed]
- Schreiber, G.; Barberis, M.; Scolari, S.; Klaus, C.; Herrmann, A.; Klipp, E. Unraveling interactions of cell cycle-regulating proteins Sic1 and B-type cyclins in living yeast cells: A FLIM-FRET approach. FASEB J. 2011, 26, 546–554. [Google Scholar] [CrossRef]
- Slaughter, B.D.; Schwartz, J.W.; Li, R. Mapping dynamic protein interactions in MAP kinase signaling using live-cell fluorescence fluctuation spectroscopy and imaging. Proc. Natl. Acad. Sci. USA 2007, 104, 20320–20325. [Google Scholar] [CrossRef] [Green Version]
- Mallik, S.; Yang, W.; Norstrom, E.M.; Mastrianni, J.A. Live cell fluorescence resonance energy transfer predicts an altered molecular association of heterologous PrPSc with PrPC. J. Biol. Chem. 2010, 285, 8967–8975. [Google Scholar] [CrossRef]
- Rubel, A.A.; Ryzhova, T.A.; Antonets, K.S.; Chernoff, Y.O.; Galkin, A.P. Identification of PrP sequences essential for the interaction between the PrP polymers and Aβ peptide in a yeast-based assay. Prion 2013, 7, 469–476. [Google Scholar] [CrossRef]
- Saleh, A.A.; Bhadra, A.K.; Roy, I. Cytotoxicity of mutant huntingtin fragment in yeast can be modulated by the expression level of wild type huntingtin fragment. ACS Chem. Neurosci. 2014, 5, 205–215. [Google Scholar] [CrossRef]
- Sergeeva, A.V.; Sopova, J.V.; Belashova, T.A.; Siniukova, V.A.; Chirinskaite, A.V.; Galkin, A.P.; Zadorsky, S.P.; Sopova, J.V.; Belashova, T.A.; Siniukova, V.A. Amyloid properties of the yeast cell wall protein Toh1 and its interaction with prion proteins Rnq1 and Sup35. Prion 2019, 13, 21–32. [Google Scholar] [CrossRef]
- Damelin, M.; Silver, P. Analysis of Protein Interactions In Vivo with Fluorescence Resonance Energy Transfer (FRET). Cold Spring Harb. Protoc. 2006. [Google Scholar] [CrossRef] [PubMed]
- Bhaumik, S.R. Analysis of in vivo targets of transcriptional activators by fluorescence resonance energy transfer. Methods 2006, 40, 353–359. [Google Scholar] [CrossRef] [PubMed]
- Overton, M.C.; Blumer, K.J. Use of fluorescence resonance energy transfer to analyze oligomerization of G-protein-coupled receptors expressed in yeast. Methods 2002, 27, 324–332. [Google Scholar] [CrossRef]
- Llopis, J.; McCaffery, J.M.; Miyawaki, A.; Llopis, J.; Heim, R.; McCaffery, J.M.; Adams, J.A.; Ikura, M.; Tsien, R.Y. Fluorescent Indicators for Ca2 + Based on Green Fluorescent Proteins and Calmodulin. Nature 1997, 388, 882–887. [Google Scholar]
- Broussard, J.A.; Green, K.J. Research Techniques Made Simple: Methodology and Applications of Förster Resonance Energy Transfer (FRET) Microscopy. J. Investig. Dermatol. 2017, 137, e185–e191. [Google Scholar] [CrossRef]
- Hochreiter, B.; Garcia, A.; Schmid, J. Fluorescent Proteins as Genetically Encoded FRET Biosensors in Life Sciences. Sensors 2015, 15, 26281–26314. [Google Scholar] [CrossRef] [Green Version]
- Marx, V. Probes: FRET sensor design and optimization. Nat. Methods 2017, 14, 949–953. [Google Scholar] [CrossRef]
- Bermejo, C.; Ewald, J.C.; Lanquar, V.; Jones, A.M.; Frommer, W.B. In vivo biochemistry: Quantifying ion and metabolite levels in individual cells or cultures of yeast. Biochem. J. 2011, 438, 1–10. [Google Scholar] [CrossRef]
- Oku, M.; Hoseki, J.; Ichiki, Y.; Sakai, Y. A fluorescence resonance energy transfer (FRET)-based redox sensor reveals physiological role of thioredoxin in the yeast Saccharomyces cerevisiae. FEBS Lett. 2013, 587, 793–798. [Google Scholar] [CrossRef]
- Bermejo, C.; Haerizadeh, F.; Sadoine, M.S.C.; Chermak, D.; Frommer, W.B. Differential regulation of glucose transport activity in yeast by specific cAMP signatures. Biochem. J. 2013, 452, 489–497. [Google Scholar] [CrossRef] [Green Version]
- Choi, S.; Hu, Y.M.; Corkins, M.E.; Palmer, A.E.; Bird, A.J. Zinc transporters belonging to the Cation Diffusion Facilitator (CDF) family have complementary roles in transporting zinc out of the cytosol. PLoS Genet. 2018, 14, 1–23. [Google Scholar] [CrossRef] [PubMed]
- Qiao, W.; Mooney, M.; Bird, A.J.; Winge, D.R.; Eide, D.J. Zinc binding to a regulatory zinc-sensing domain monitored in vivo by using FRET. Proc. Natl. Acad. Sci. USA 2006, 103, 8674–8679. [Google Scholar] [CrossRef] [PubMed]
- Wegner, S.V.; Arslan, H.; Sunbul, M.; Yin, J.; He, C. Dynamic Copper(I) Imaging in Mammalian Cells with a Genetically Encoded Fluorescence Copper(I) Sensor. J. Am. Chem. Soc. 2010, 132, 2567–2569. [Google Scholar] [CrossRef] [PubMed]
- Yano, T.; Oku, M.; Akeyama, N.; Itoyama, A.; Yurimoto, H.; Kuge, S.; Fujiki, Y.; Sakai, Y. A Novel Fluorescent Sensor Protein for Visualization of Redox States in the Cytoplasm and in Peroxisomes. Mol. Cell. Biol. 2010, 30, 3758–3766. [Google Scholar] [CrossRef] [Green Version]
- Ho, C.-H.; Frommer, W.B. Fluorescent sensors for activity and regulation of the nitrate transceptor CHL1/NRT1.1 and oligopeptide transporters. Elife 2014, 3, 1–21. [Google Scholar] [CrossRef]
- Jones, A.M.; Danielson, J.Å.H.; Manojkumar, S.N.; Lanquar, V.; Grossmann, G.; Frommer, W.B. Abscisic acid dynamics in roots detected with genetically encoded FRET sensors. Elife 2014, 2014, 1–30. [Google Scholar] [CrossRef]
- Khan, T.; Kandola, T.S.; Wu, J.; Venkatesan, S.; Ketter, E.; Lange, J.J.; Rodríguez Gama, A.; Box, A.; Unruh, J.R.; Cook, M.; et al. Quantifying Nucleation In Vivo Reveals the Physical Basis of Prion-like Phase Behavior. Mol. Cell 2018, 71, 155–168. [Google Scholar] [CrossRef]
- Guerrero, J.L.; O’Malley, M.A.; Daugherty, P.S. Intracellular FRET-based Screen for Redesigning the Specificity of Secreted Proteases. ACS Chem. Biol. 2016, 11, 961–970. [Google Scholar] [CrossRef]
- Shin, I.; Ray, J.; Gupta, V.; Ilgu, M.; Beasley, J.; Bendickson, L.; Mehanovic, S.; Kraus, G.A.; Nilsen-Hamilton, M. Live-cell imaging of Pol II promoter activity to monitor gene expression with RNA IMAGEtag reporters. Nucleic Acids Res. 2014, 42, e90. [Google Scholar] [CrossRef]
- Conlon, P.; Gelin-Licht, R.; Ganesan, A.; Zhang, J.; Levchenko, A. Single-cell dynamics and variability of MAPK activity in a yeast differentiation pathway. Proc. Natl. Acad. Sci. USA 2016, 113, E5896–E5905. [Google Scholar] [CrossRef] [Green Version]
- Colombo, S.; Broggi, S.; Collini, M.; D’Alfonso, L.; Chirico, G.; Martegani, E. Detection of cAMP and of PKA activity in Saccharomyces cerevisiae single cells using Fluorescence Resonance Energy Transfer (FRET) probes. Biochem. Biophys. Res. Commun. 2017, 487, 594–599. [Google Scholar] [CrossRef]
- Suzuki, A.; Badger, B.L.; Haase, J.; Ohashi, T.; Erickson, H.P.; Salmon, E.D.; Bloom, K. How the kinetochore couples microtubule force and centromere stretch to move chromosomes. Nat. Cell Biol. 2016, 18, 382–392. [Google Scholar] [CrossRef] [Green Version]
- Freikamp, A.; Cost, A.-L.; Grashoff, C. The Piconewton Force Awakens: Quantifying Mechanics in Cells. Trends Cell Biol. 2016, 26, 838–847. [Google Scholar] [CrossRef]
- Skruzny, M.; Brach, T.; Ciuffa, R.; Rybina, S.; Wachsmuth, M.; Kaksonen, M. Molecular basis for coupling the plasma membrane to the actin cytoskeleton during clathrin-mediated endocytosis. Proc. Natl. Acad. Sci. USA 2012, 109, E2533–E2542. [Google Scholar] [CrossRef]
- Abella, M.; Andruck, L.; Malengo, G.; Skruzny, M. Mechanobiology of endocytic vesicle formation analyzed by FRET force sensors. Manuscript in preparation.
- Fehr, M.; Frommer, W.B.; Lalonde, S. Visualization of maltose uptake in living yeast cells by fluorescent nanosensors. Proc. Natl. Acad. Sci. USA 2002, 99, 9846–9851. [Google Scholar] [CrossRef] [Green Version]
- Ha, J.S.; Song, J.J.; Lee, Y.M.; Kim, S.J.; Shin, C.S.; Lee, S.G. Design and Application of Highly Responsive FRET Biosensors for Sugar Detection in Living Yeast. Appl. Environ. Microbiol. 2007, 73, 7408–7414. [Google Scholar] [CrossRef]
- Bermejo, C.; Haerizadeh, F.; Takanaga, H.; Chermak, D.; Frommer, W.B. Dynamic analysis of cytosolic glucose and ATP levels in yeast using optical sensors. Biochem. J. 2010, 432, 399–406. [Google Scholar] [CrossRef] [Green Version]
- Bermejo, C.; Haerizadeh, F.; Takanaga, H.; Chermak, D.; Frommer, W.B. Optical sensors for measuring dynamic changes of cytosolic metabolite levels in yeast. Nat. Protoc. 2011, 6, 1806–1817. [Google Scholar] [CrossRef]
- Peroza, E.A.; Ewald, J.C.; Parakkal, G.; Skotheim, J.M.; Zamboni, N. A genetically encoded Förster resonance energy transfer sensor for monitoring in vivo trehalose-6-phosphate dynamics. Anal. Biochem. 2015, 474, 1–7. [Google Scholar] [CrossRef]
- Imamura, H.; Nhat, K.P.H.; Togawa, H.; Saito, K.; Iino, R.; Kato-Yamada, Y.; Nagai, T.; Noji, H. Visualization of ATP levels inside single living cells with fluorescence resonance energy transfer-based genetically encoded indicators. Proc Natl Acad Sci USA 2009, 106, 75–78. [Google Scholar] [CrossRef]
- Papagiannakis, A.; Niebel, B.; Wit, E.C.; Heinemann, M. Autonomous Metabolic Oscillations Robustly Gate the Early and Late Cell Cycle. Mol. Cell 2017, 65, 285–295. [Google Scholar] [CrossRef] [Green Version]
- Okada, S.; Ota, K.; Ito, T. Circular permutation of ligand-binding module improves dynamic range of genetically encoded FRET-based nanosensor. Protein Sci. 2009, 18, 2518–2527. [Google Scholar] [CrossRef] [Green Version]
- Ameen, S.; Ahmad, M.; Mohsin, M.; Qureshi, M.I.; Ibrahim, M.M.; Abdin, M.Z.; Ahmad, A. Designing, construction and characterization of genetically encoded FRET-based nanosensor for real time monitoring of lysine flux in living cells. J. Nanobiotechnol. 2016, 14, 1–11. [Google Scholar] [CrossRef] [Green Version]
- Eichhof, I.; Ernst, J.F. Oxygen-independent FbFP: Fluorescent sentinel and oxygen sensor component in Saccharomyces cerevisiae and Candida albicans. Fungal Genet. Biol. 2016, 92, 14–25. [Google Scholar] [CrossRef]
- Padilla-Parra, S.; Tramier, M. FRET microscopy in the living cell: Different approaches, strengths and weaknesses. Bioessays 2012, 34, 369–376. [Google Scholar] [CrossRef]
- Pietraszewska-Bogiel, A.; Gadella, T.W. FRET microscopy: From principle to routine technology in cell biology. J. Microsc. 2010, 241, 111–118. [Google Scholar] [CrossRef]
- Ma, L.; Yang, F.; Zheng, J. Application of fluorescence resonance energy transfer in protein studies. J. Mol. Struct. 2014, 1077, 87–100. [Google Scholar] [CrossRef] [Green Version]
- Sun, Y.; Rombola, C.; Jyothikumar, V.; Periasamy, A. Förster Resonance Energy Transfer Microscopy and Spectroscopy for Localizing Protein–Protein Interactions in Living Cells. Cytom. A 2013, 83, 780–793. [Google Scholar] [CrossRef]
- Becker, W. Fluorescence lifetime imaging-techniques and applications. J. Microsc. 2012, 247, 119–136. [Google Scholar] [CrossRef]
- Ebrecht, R.; Don Paul, C.; Wouters, F.S. Fluorescence lifetime imaging microscopy in the medical sciences. Protoplasma 2014, 251, 293–305. [Google Scholar] [CrossRef]
- Snell, N.E.; Rao, V.P.; Seckinger, K.M.; Liang, J.; Leser, J.; Mancini, A.E.; Rizzo, M.A. Homotransfer FRET reporters for live cell imaging. Biosensors 2018, 8, 89. [Google Scholar] [CrossRef] [PubMed]
- Sun, Y.; Wallrabe, H.; Seo, S.-A.; Periasamy, A. FRET Microscopy in 2010: The Legacy of Theodor Förster on the 100th Anniversary of his Birth. ChemPhysChem 2010, 12, 462–474. [Google Scholar] [CrossRef] [PubMed]
- Mund, M.; van der Beek, J.A.; Deschamps, J.; Dmitrieff, S.; Hoess, P.; Monster, J.L.; Picco, A.; Nédélec, F.; Kaksonen, M.; Ries, J. Systematic Nanoscale Analysis of Endocytosis Links Efficient Vesicle Formation to Patterned Actin Nucleation. Cell 2018, 174, 884–896. [Google Scholar] [CrossRef] [PubMed]
- Bajar, B.T.; Wang, E.S.; Zhang, S.; Lin, M.Z.; Chu, J. A guide to fluorescent protein FRET pairs. Sensors 2016, 16, 1488. [Google Scholar] [CrossRef]
- Day, R.N.; Davidson, M.W. Fluorescent proteins for FRET microscopy: Monitoring protein interactions in living cells. Bioessays 2012, 34, 341–350. [Google Scholar] [CrossRef]
- Botman, D.; de Groot, D.H.; Schmidt, P.; Goedhart, J.; Teusink, B. In vivo characterisation of fluorescent proteins in budding yeast. Sci. Rep. 2019, 9, 2234. [Google Scholar] [CrossRef] [Green Version]
- Lambert, T.J. FPbase: A community-editable fluorescent protein database. Nat. Methods 2019, 16, 277–278. [Google Scholar] [CrossRef]
- Goedhart, J.; von Stetten, D.; Noirclerc-Savoye, M.; Lelimousin, M.; Joosen, L.; Hink, M.A.; van Weeren, L.; Gadella, T.W.J.; Royant, A. Structure-guided evolution of cyan fluorescent proteins towards a quantum yield of 93%. Nat. Commun. 2012, 3, 751–759. [Google Scholar] [CrossRef]
- Shaner, N.C.; Lambert, G.G.; Chammas, A.; Ni, Y.; Cranfill, P.J.; Baird, M.A.; Sell, B.R.; Allen, J.R.; Day, R.N.; Israelsson, M.; et al. A bright monomeric green fluorescent protein derived from Branchiostoma lanceolatum. Nat. Methods 2013, 10, 407–409. [Google Scholar] [CrossRef]
- Khmelinskii, A.; Meurer, M.; Ho, C.-T.; Besenbeck, B.; Fuller, J.; Lemberg, M.K.; Bukau, B.; Mogk, A.; Knop, M. Incomplete proteasomal degradation of green fluorescent proteins in the context of tandem fluorescent protein timers. Mol. Biol. Cell 2016, 27, 360–370. [Google Scholar] [CrossRef] [Green Version]
- Mastop, M.; Bindels, D.S.; Shaner, N.C.; Postma, M.; Gadella, T.W.J.; Goedhart, J. Characterization of a spectrally diverse set of fluorescent proteins as FRET acceptors for mTurquoise2. Sci. Rep. 2017, 7, 11999. [Google Scholar] [CrossRef] [PubMed]
- Bindels, D.S.; Haarbosch, L.; van Weeren, L.; Postma, M.; Wiese, K.E.; Mastop, M.; Aumonier, S.; Gotthard, G.; Royant, A.; Hink, M.A.; et al. mScarlet: A bright monomeric red fluorescent protein for cellular imaging. Nat. Methods 2016, 14, 53–56. [Google Scholar] [CrossRef] [PubMed]
- Janke, C.; Magiera, M.M.; Rathfelder, N.; Taxis, C.; Reber, S.; Maekawa, H.; Moreno-Borchart, A.; Doenges, G.; Schwob, E.; Schiebel, E.; et al. A versatile toolbox for PCR-based tagging of yeast genes: New fluorescent proteins, more markers and promoter substitution cassettes. Yeast 2004, 21, 947–962. [Google Scholar] [CrossRef] [PubMed]
- Khmelinskii, A.; Meurer, M.; Duishoev, N.; Delhomme, N.; Knop, M. Seamless gene tagging by endonuclease-driven homologous recombination. PLoS ONE 2011, 6, e23794. [Google Scholar] [CrossRef] [PubMed]
- Young, C.L.; Raden, D.L.; Caplan, J.L.; Czymmek, K.J.; Robinson, A.S. Cassette series designed for live-cell imaging of proteins and high-resolution techniques in yeast. Yeast 2012, 29, 119–136. [Google Scholar] [CrossRef] [PubMed] [Green Version]
- Lee, S.; Lim, W.A.; Thorn, K.S. Improved Blue, Green, and Red Fluorescent Protein Tagging Vectors for S. cerevisiae. PLoS ONE 2013, 8, e67902. [Google Scholar] [CrossRef] [PubMed]
- Higuchi-Sanabria, R.; Garcia, E.J.; Tomoiaga, D.; Munteanu, E.L.; Feinstein, P.; Pon, L.A. Characterization of Fluorescent Proteins for Three- and Four-Color Live-Cell Imaging in S. cerevisiae. PLoS ONE 2016, 11, e0146120. [Google Scholar] [CrossRef]
Figure 1.
Basic principles of Förster resonance energy transfer (FRET). (A) Jablonski diagram illustrating excitation and emission of the donor fluorophore and FRET between the donor and acceptor fluorophores, resulting in acceptor emission. (B) Dependence of FRET efficiency on the distance R between donor and acceptor molecules. Förster radius R0 is the distance at which half of the energy of the excited donor is transferred by FRET. (C) Excitation/absorption (Ex) and emission (Em) spectra of mTurquoise2 donor (D) and mNeonGreen acceptor (A) FRET pair. Spectral overlap between mTurquoise2 emission and mNeonGreen excitation spectra, which is essential for FRET, is highlighted in orange.
Figure 2.
Mapping the organization of yeast protein complexes with FRET. (A) General scheme of FRET-based protein proximity mapping between proteins A, B, and C, tagged with fluorescent proteins (FPs) either N- or C-terminally. (B) No FRET and FRET between indicated FP-fusion proteins of Schizosaccharomyces pombe cell division contractile ring. See [21] for further details. (C) FRET between indicated FP-fusion proteins of Saccharomyces cerevisiae endocytic coat complex is shown as an increase of green fluorescent protein (GFP) donor fluorescence intensity after mCherry acceptor photobleaching. See [22] for further details. (A,C) Images adopted from [22]; (B) image taken from Figure 5 of [21]. Scale bars: 4 μm (B), 2 μm (C).

Figure 3.
Common types of FP-based FRET biosensors. In these sensors, change in distance (or orientation) of appended FPs is followed by change in FRET between them. This can be used to monitor: (A) protease activity causing the cleavage of a particular linker between FPs; (B) presence of ligand or posttranslational modification on the sensory part of the sensor, which is recognized by other parts of the sensor, causing its conformational change; (C) molecular force/tension applied over the sensor inserted in force-bearing protein. See legend at the bottom part of the figure for further details. Adopted from [47].

Figure 4.
Basic principles of FRET microscopy techniques. (A) Acceptor photobleaching. Increase in donor fluorescence after the photo-inactivation of acceptor FP by a laser signalizes FRET. (B) Sensitized emission. FRET causes enhanced emission of acceptor fluorescence and decreased emission of donor fluorescence. These changes can be measured either over the whole spectrum (spectral FRET) or in specific wavelength windows (tri-cube FRET). (C) Ratiometric FRET. The simplest readout of sensitized emission, when the ratio of acceptor/donor fluorescence is followed over time. (D) FRET-FLIM. FRET decreases the fluorescence lifetime of the donor. Pools of FRET-involved and FRET-absent donor molecules are discernible by their different fluorescence lifetimes.


Table 1.
Protein complexes analyzed by FRET in yeast.
| Protein Complex | FRET Technique 1,2 | FRET Donor–Acceptor 1,2 | References |
|---|---|---|---|
| Nuclear pore complex (NPC) | sensitized emission | CFP-YFP | [11,12,42] |
| Spindle pole body (SPB) | sensitized emission acceptor photobleaching | CFP-YFP mTq2-YFP | [16,17,18,19,20] |
| Kinetochore | sensitized emission FLIM | GFP-mCherry mTq2-YFP | [13,14,15] |
| Contractile ring | acceptor photobleaching | GFP/mNG-mCherry | [21] |
| Endocytic coat | acceptor photobleaching | GFP-mCherry mTq-mNG mNG-mScarlet | [22] |
| Cohesin | sensitized emission | CFP-YFP | [24] |
| SAGA-Gal4 transcription factor | acceptor photobleaching spectral FRET | CFP-YFP | [25,43] |
| PCNA-SAS-I complex | FLIM | CFP-YFP | [26] |
| ATR complex Dcp2-Mec1- PP4 phosphatase Psy2-Php3 | sensitized emission | GFP-RFP | [27] |
| Ste2 oligomerization | spectral FRET | CFP/GFP-YFP | [28,29,30,44] |
| Fet3-Ftr1 iron permease | spectral FRET | CFP-YFP | [31] |
| Ctr1 transporter oligomerization and copper binding | spectral FRET | CFP-YFP | [32] |
| Ato1-Ato2 proteins | acceptor photobleaching, FLIM | GFP-tdimer2 CFP-Venus | [33] |
| V-ATPase disassembly | sensitized emission | CFP-YFP | [34] |
| Tom70 oligomerization | sensitized emission | CFP-YFP | [35] |
| CDK inhibitor Sic1-cyclins | FLIM | mCerulean-YFP | [36] |
| Ste5-Fus3 interaction | acceptor photobleaching | GFP-mStrawberry | [37] |
| Prp prion aggregation | donor photobleaching | CFP-YFP | [38] |
| Prp-amyloid β interaction | acceptor photobleaching | CFP-YFP | [39] |
| HTT huntingtin aggregation | acceptor photobleaching | CFP-Venus | [40] |
| Toh1 aggregation with Rnq1 and Sup35 prion proteins | acceptor photobleaching | CFP-YFP | [41] |
1 For individual FRET techniques and fluorescent proteins, see please the main text. 2 CFP, cyan fluorescent protein; YFP, yellow fluorescent protein; mTq2, mTurquoise2; FLIM, fluorescence lifetime imaging microscopy; GFP, green fluorescent protein; mNG, mNeonGreen.
Table 2.
FRET biosensors in yeast.
| Studied Analyte/Process | Sensor Name (Sensor Origin) | FRET Donor–Acceptor (FRET Method) 1 | References |
|---|---|---|---|
| Maltose | FLIPmal (MBP) | CFP-YFP (spectral FRET) | [67,68] |
| Glucose (Galactose) | FLIPglu sensors (MglD) | CFP-Venus | [69,70] |
| Trehalose-6P | T6P-TRACKs (TreR) | CFP-Venus | [71] |
| ATP | AT1.03 sensors (ε subunit of FoF1-ATP synthase) | CFP-Venus | [69,72,73] |
| Histidine | FLIP-cpHisJ194 (HisJ) | CFP-Venus | [74] |
| Lysine | FLIPK (LAO) | CFP-YFP | [75] |
| Zinc ion | ZF1/2, ZF3/4, ZapCY1/2 (Zap1) | CFP-YFP/Citrine | [52,53] |
| Redox state | Redoxfluor (Yap1) | Cerulean-Citrine | [50,55] |
| Oxygen | YFOS (FbFP) | FbFP-YFP (spectral FRET) | [76] |
| Nitrate Oligopeptides | NiTrac sensors, PepTrac sensors | mCerulean-Aphrodite (spectral FRET) | [56] |
| Abscisic acid | ABACUS1 sensors | Cerulean-Citrine | [57] |
| Prion proteins nucleation | AmFRET | mEos3.1 (FACS) | [58] |
| Amyloid β cleavage by evolved protease | PrECISE | CyPet-Ypet (FACS) | [59] |
| PolII promoter activity | IMAGEtags (RNA aptamers) | Cy3-Cy5 (sensitized emission) | [60] |
| MAPK signaling pathway | yEKAREV | CFP-YPet | [61] |
| cAMP/PKA signaling pathway | Epac2-camps (Epac2) AKAR3 | CFP-YFP CFP-cpVenus | [62] |
| Force for chromosome segregation | Ndc80 tension sensor | CFP-YPet | [63] |
| Force for endocytic vesicle formation | molecular tension sensors in Sla2 protein | mTq2-mNG | [64,66] |
1 If a method other than ratiometric FRET was used, it is specified in parentheses.
Table 3.
Comparison of FRET microscopy techniques.
| FRET Technique | Advantages | Disadvantages |
|---|---|---|
| acceptor photobleaching | easy to set up and calculate | endpoint assay (time-lapse measurements only indirectly) |
| sensitized emission (including ratiometric FRET) | easy to set up time-lapse measurements | acquisition of controls necessary for FRET calculation (not for ratiometric FRET) |
| FRET-FLIM | pools of FRET-involved/absent molecules discernable time-lapse measurements | complex setup and data analysis |
© 2019 by the authors. Licensee MDPI, Basel, Switzerland. This article is an open access article distributed under the terms and conditions of the Creative Commons Attribution (CC BY) license (http://creativecommons.org/licenses/by/4.0/).
Share and Cite
MDPI and ACS Style
Skruzny, M.; Pohl, E.; Abella, M. FRET Microscopy in Yeast. Biosensors 2019, 9, 122. https://doi.org/10.3390/bios9040122
AMA Style
Skruzny M, Pohl E, Abella M. FRET Microscopy in Yeast. Biosensors. 2019; 9(4):122. https://doi.org/10.3390/bios9040122
Chicago/Turabian StyleSkruzny, Michal, Emma Pohl, and Marc Abella. 2019. "FRET Microscopy in Yeast" Biosensors 9, no. 4: 122. https://doi.org/10.3390/bios9040122
Note that from the first issue of 2016, this journal uses article numbers instead of page numbers. See further details here.