
Assessing the Protective Quality of Wax Coatings on Bronze Sculptures Using Hydrogel Patches in Impedance Measurements

 ,
,
Abstract
:
1. Introduction
2. Materials and Methods
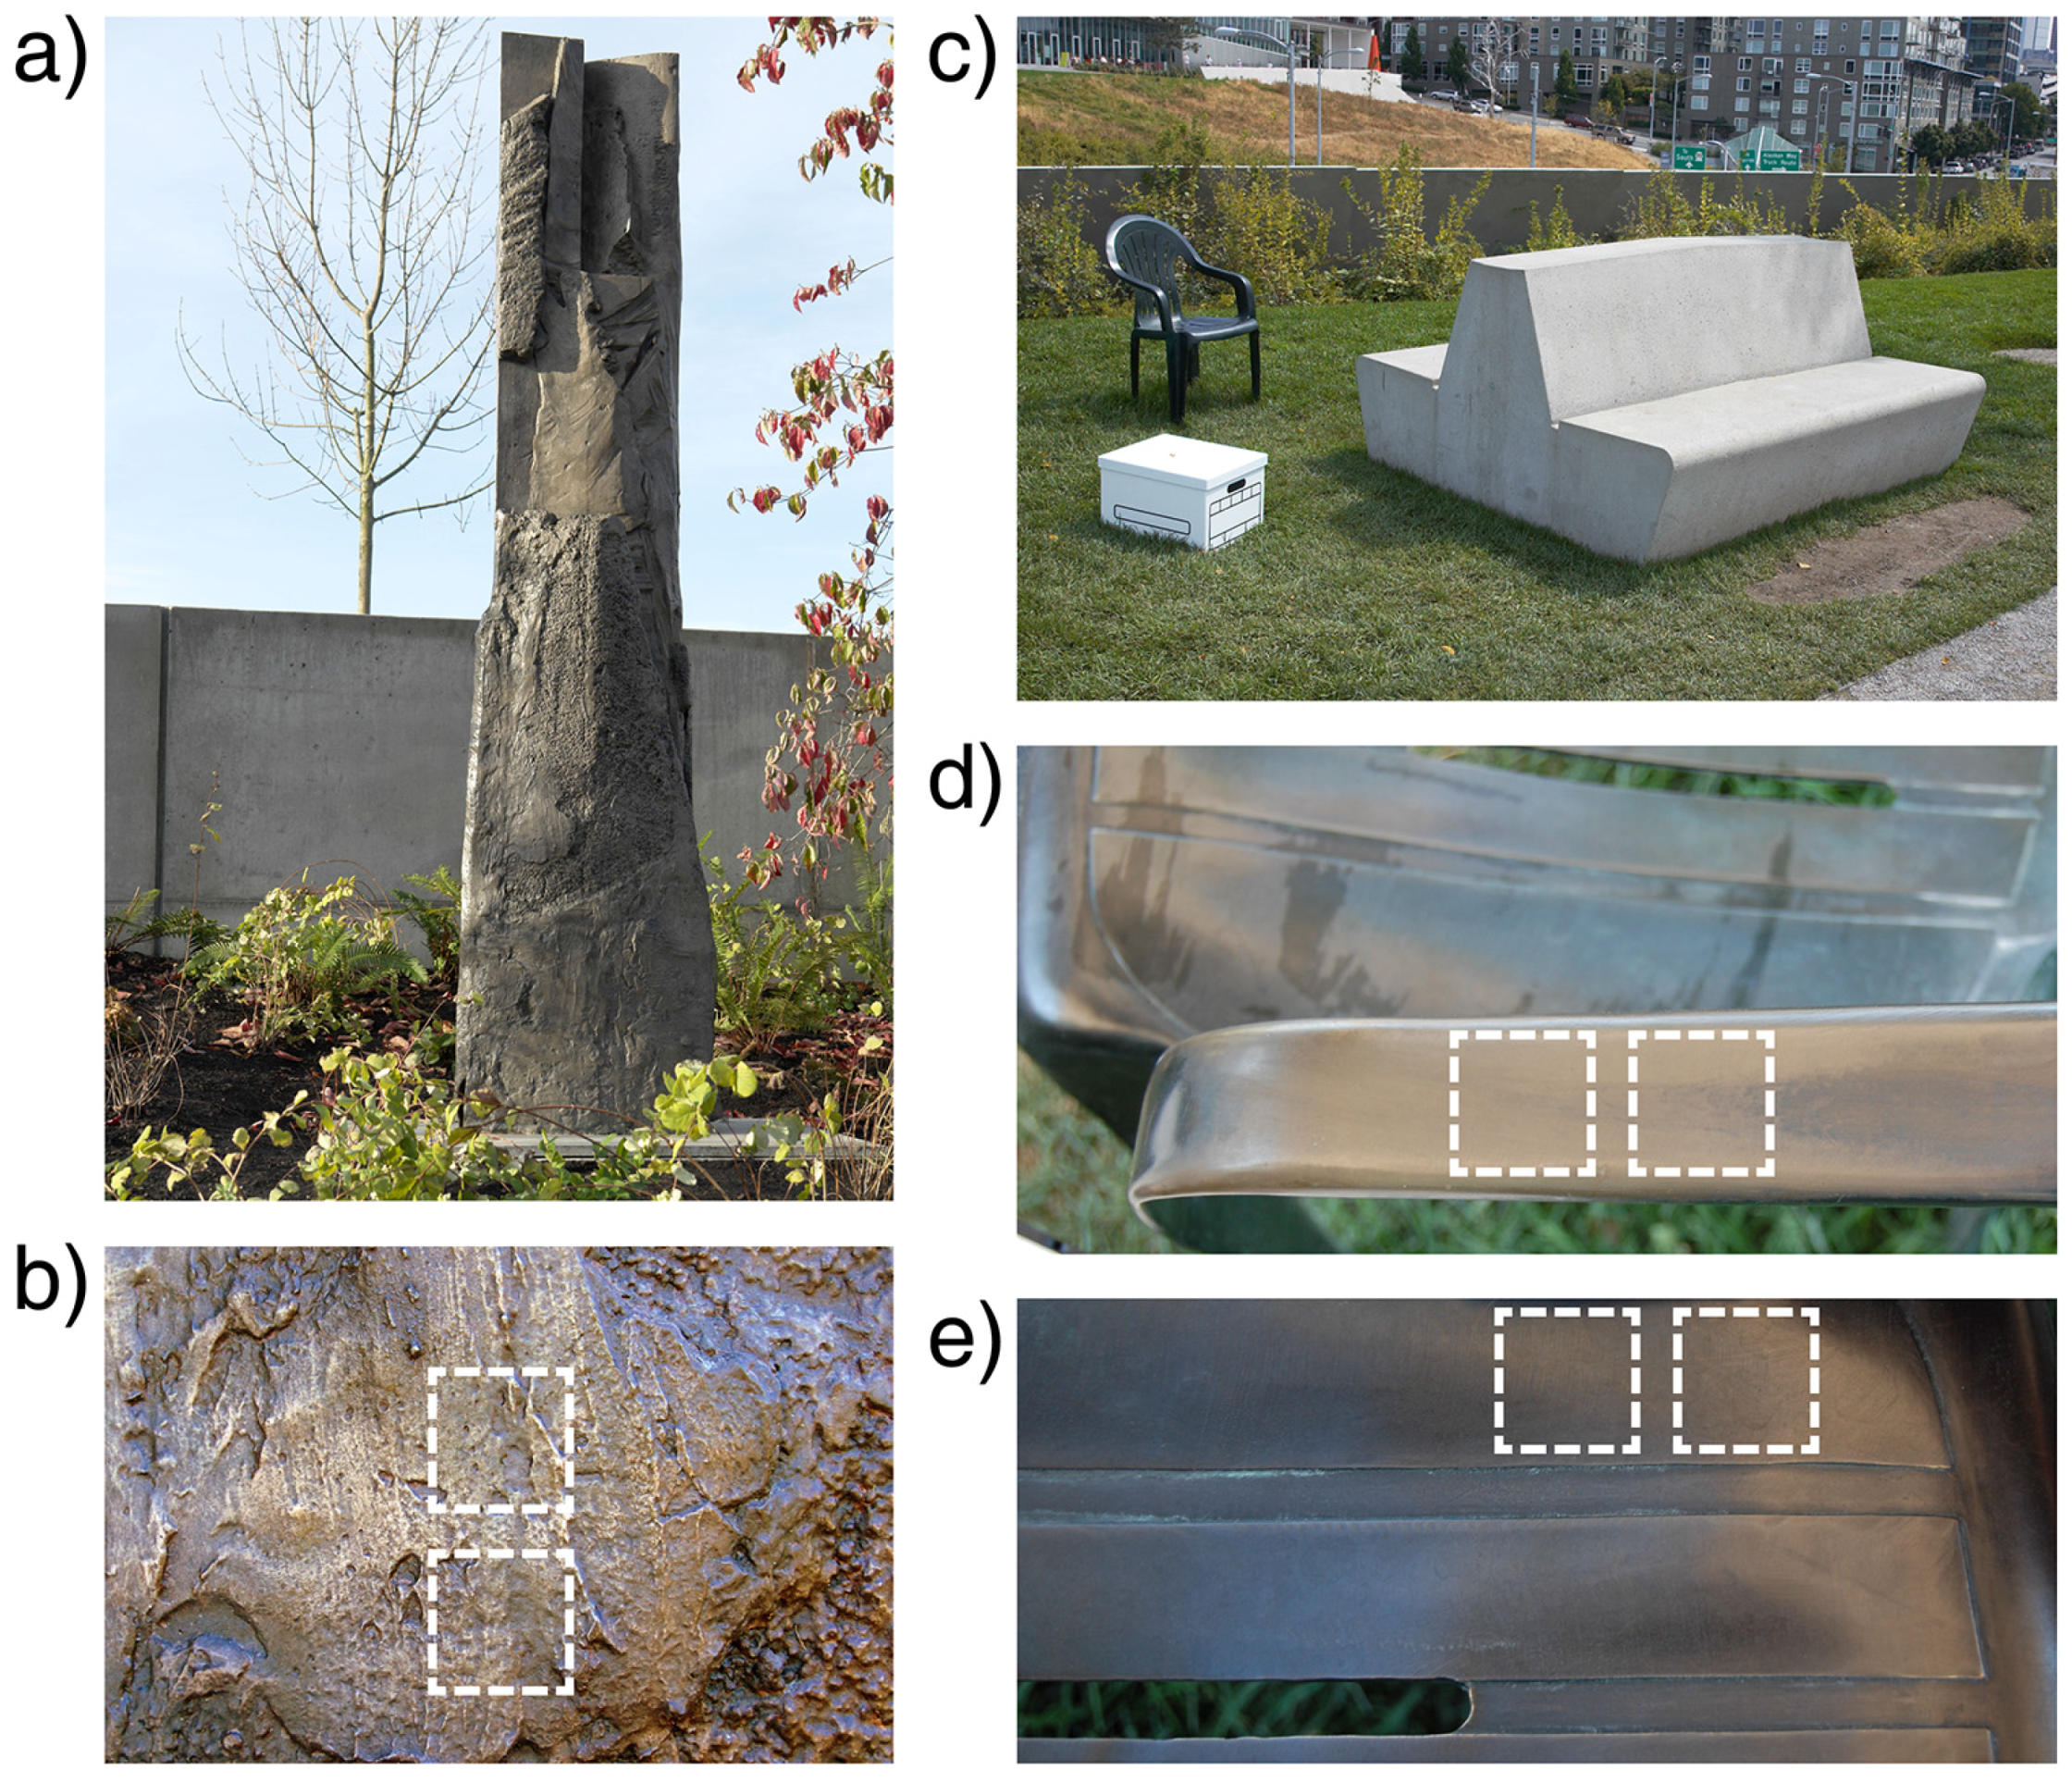
2.1. Outdoor Sculptures
2.2. Test Plates
2.3. Hydrogel Electrode Synthesis
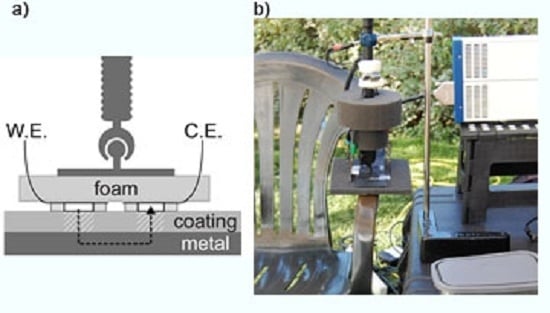
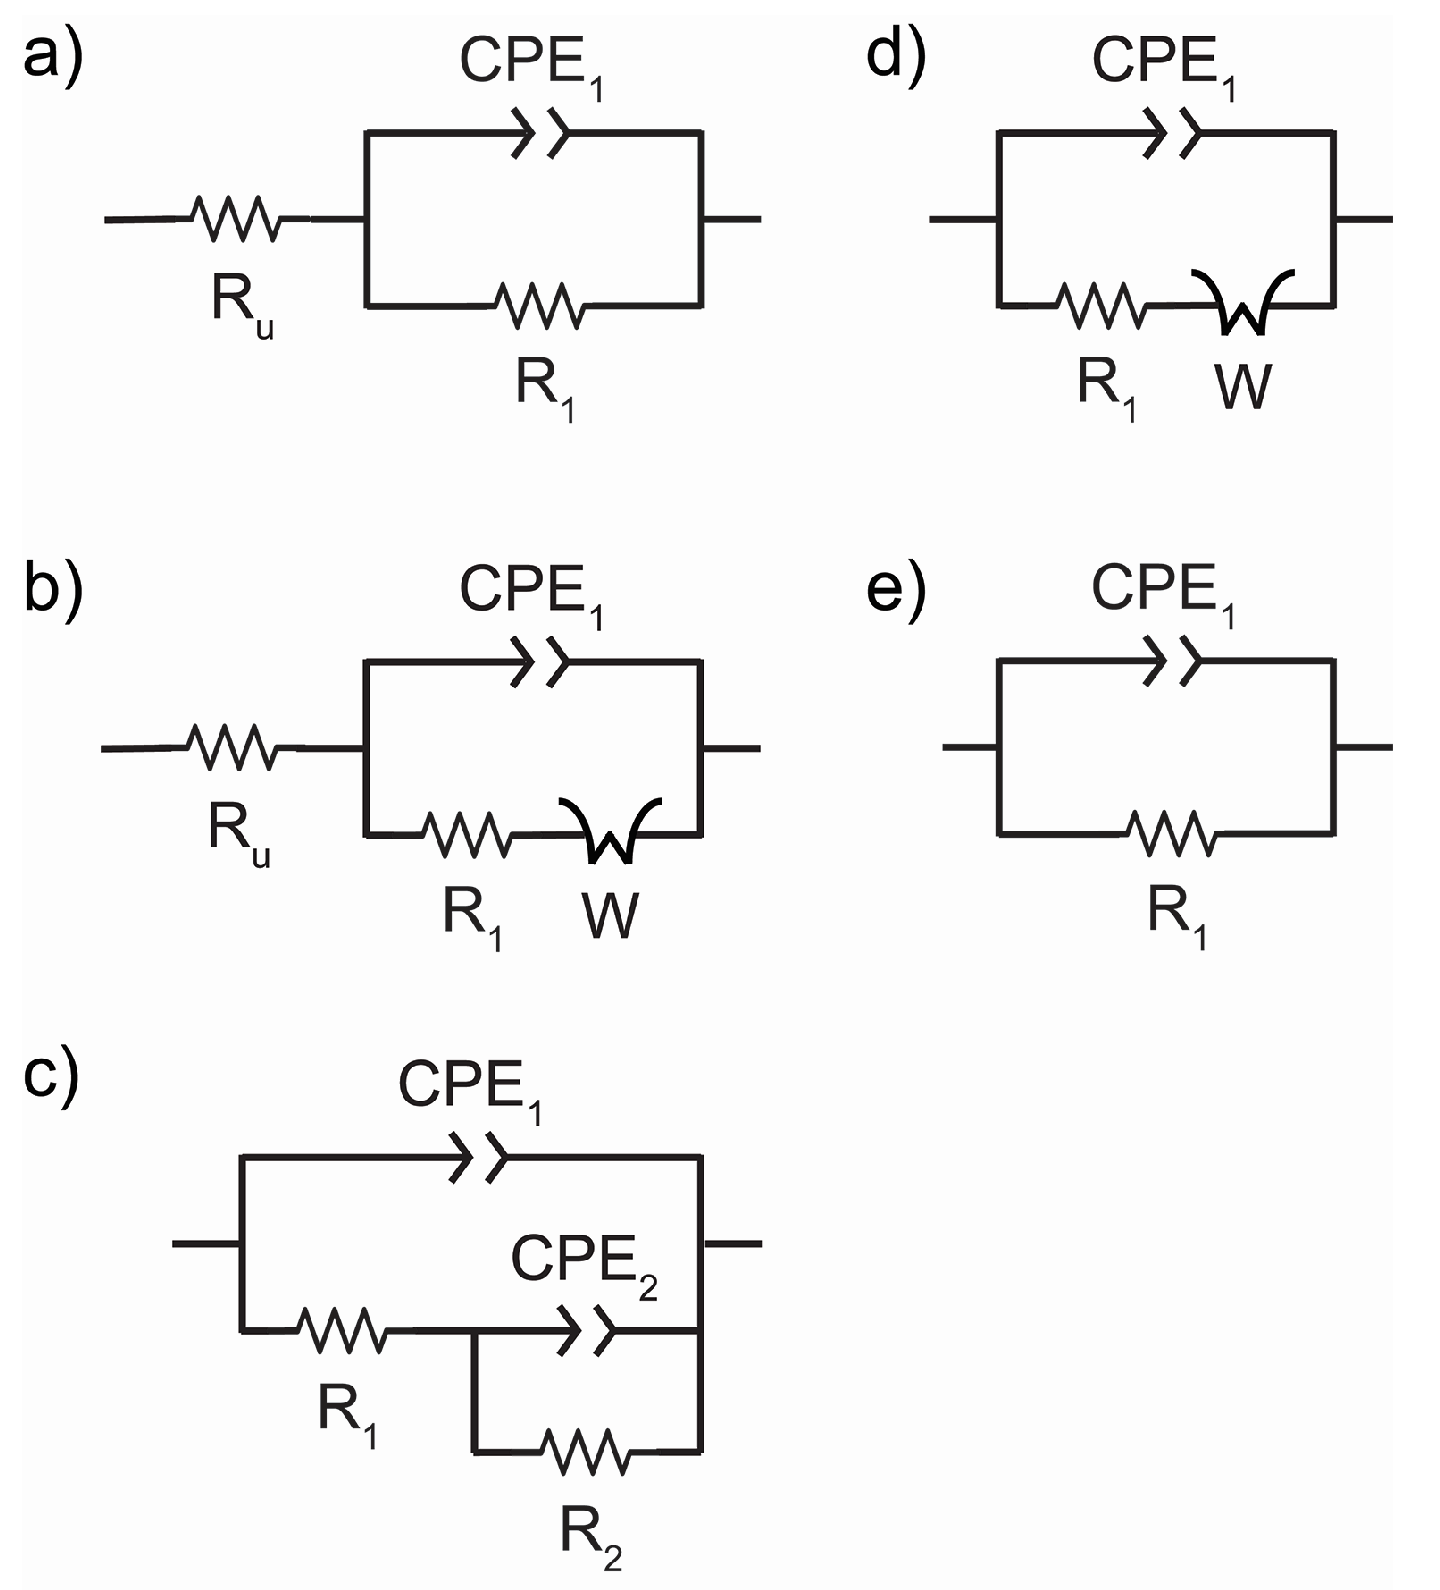
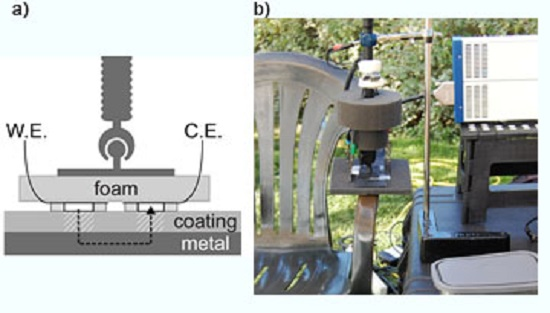
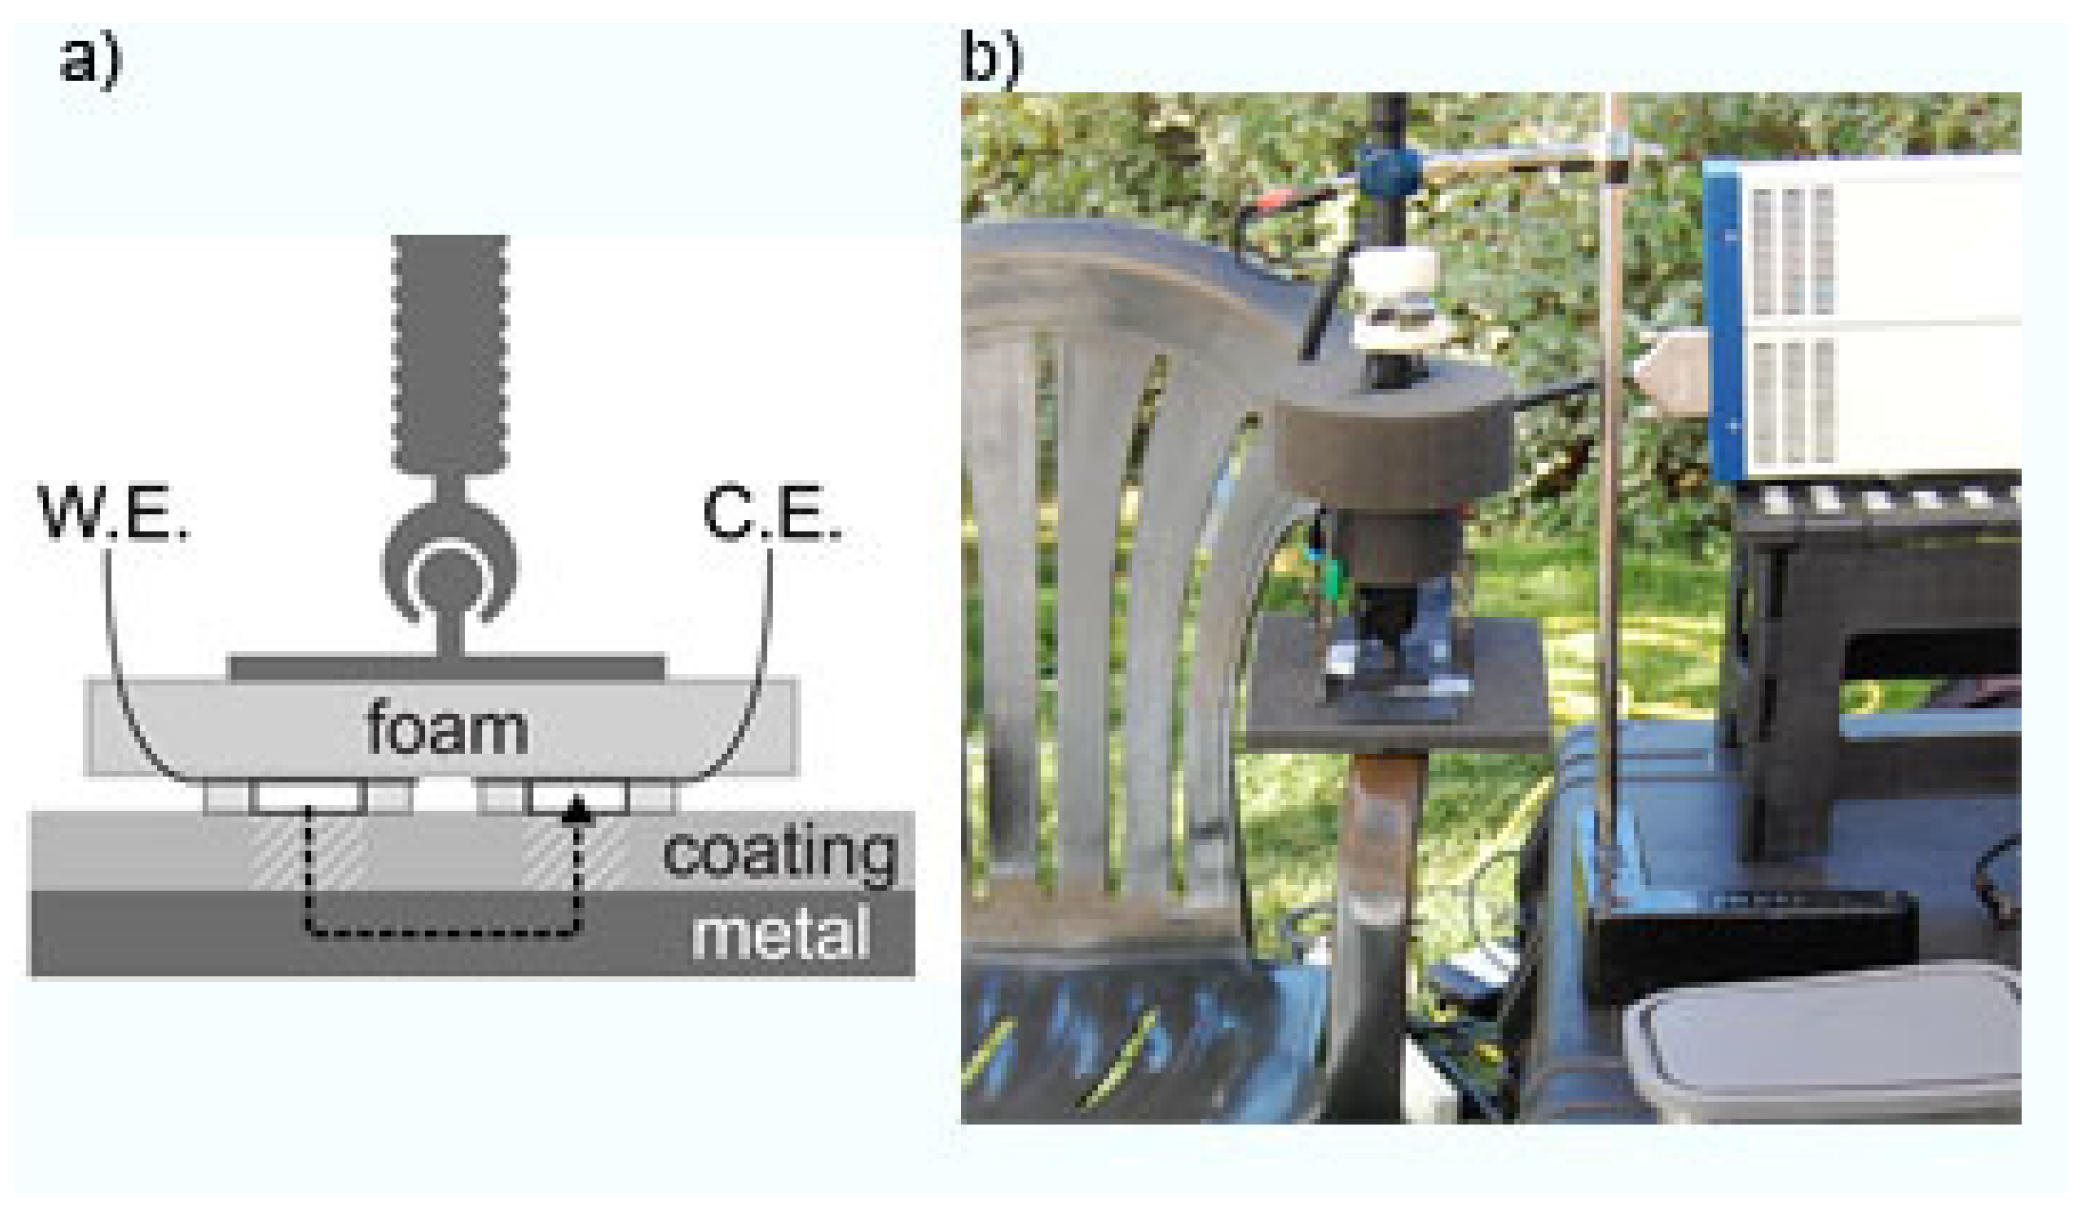
2.4. Electrochemical Impedance Spectroscopy
3. Results and Discussion
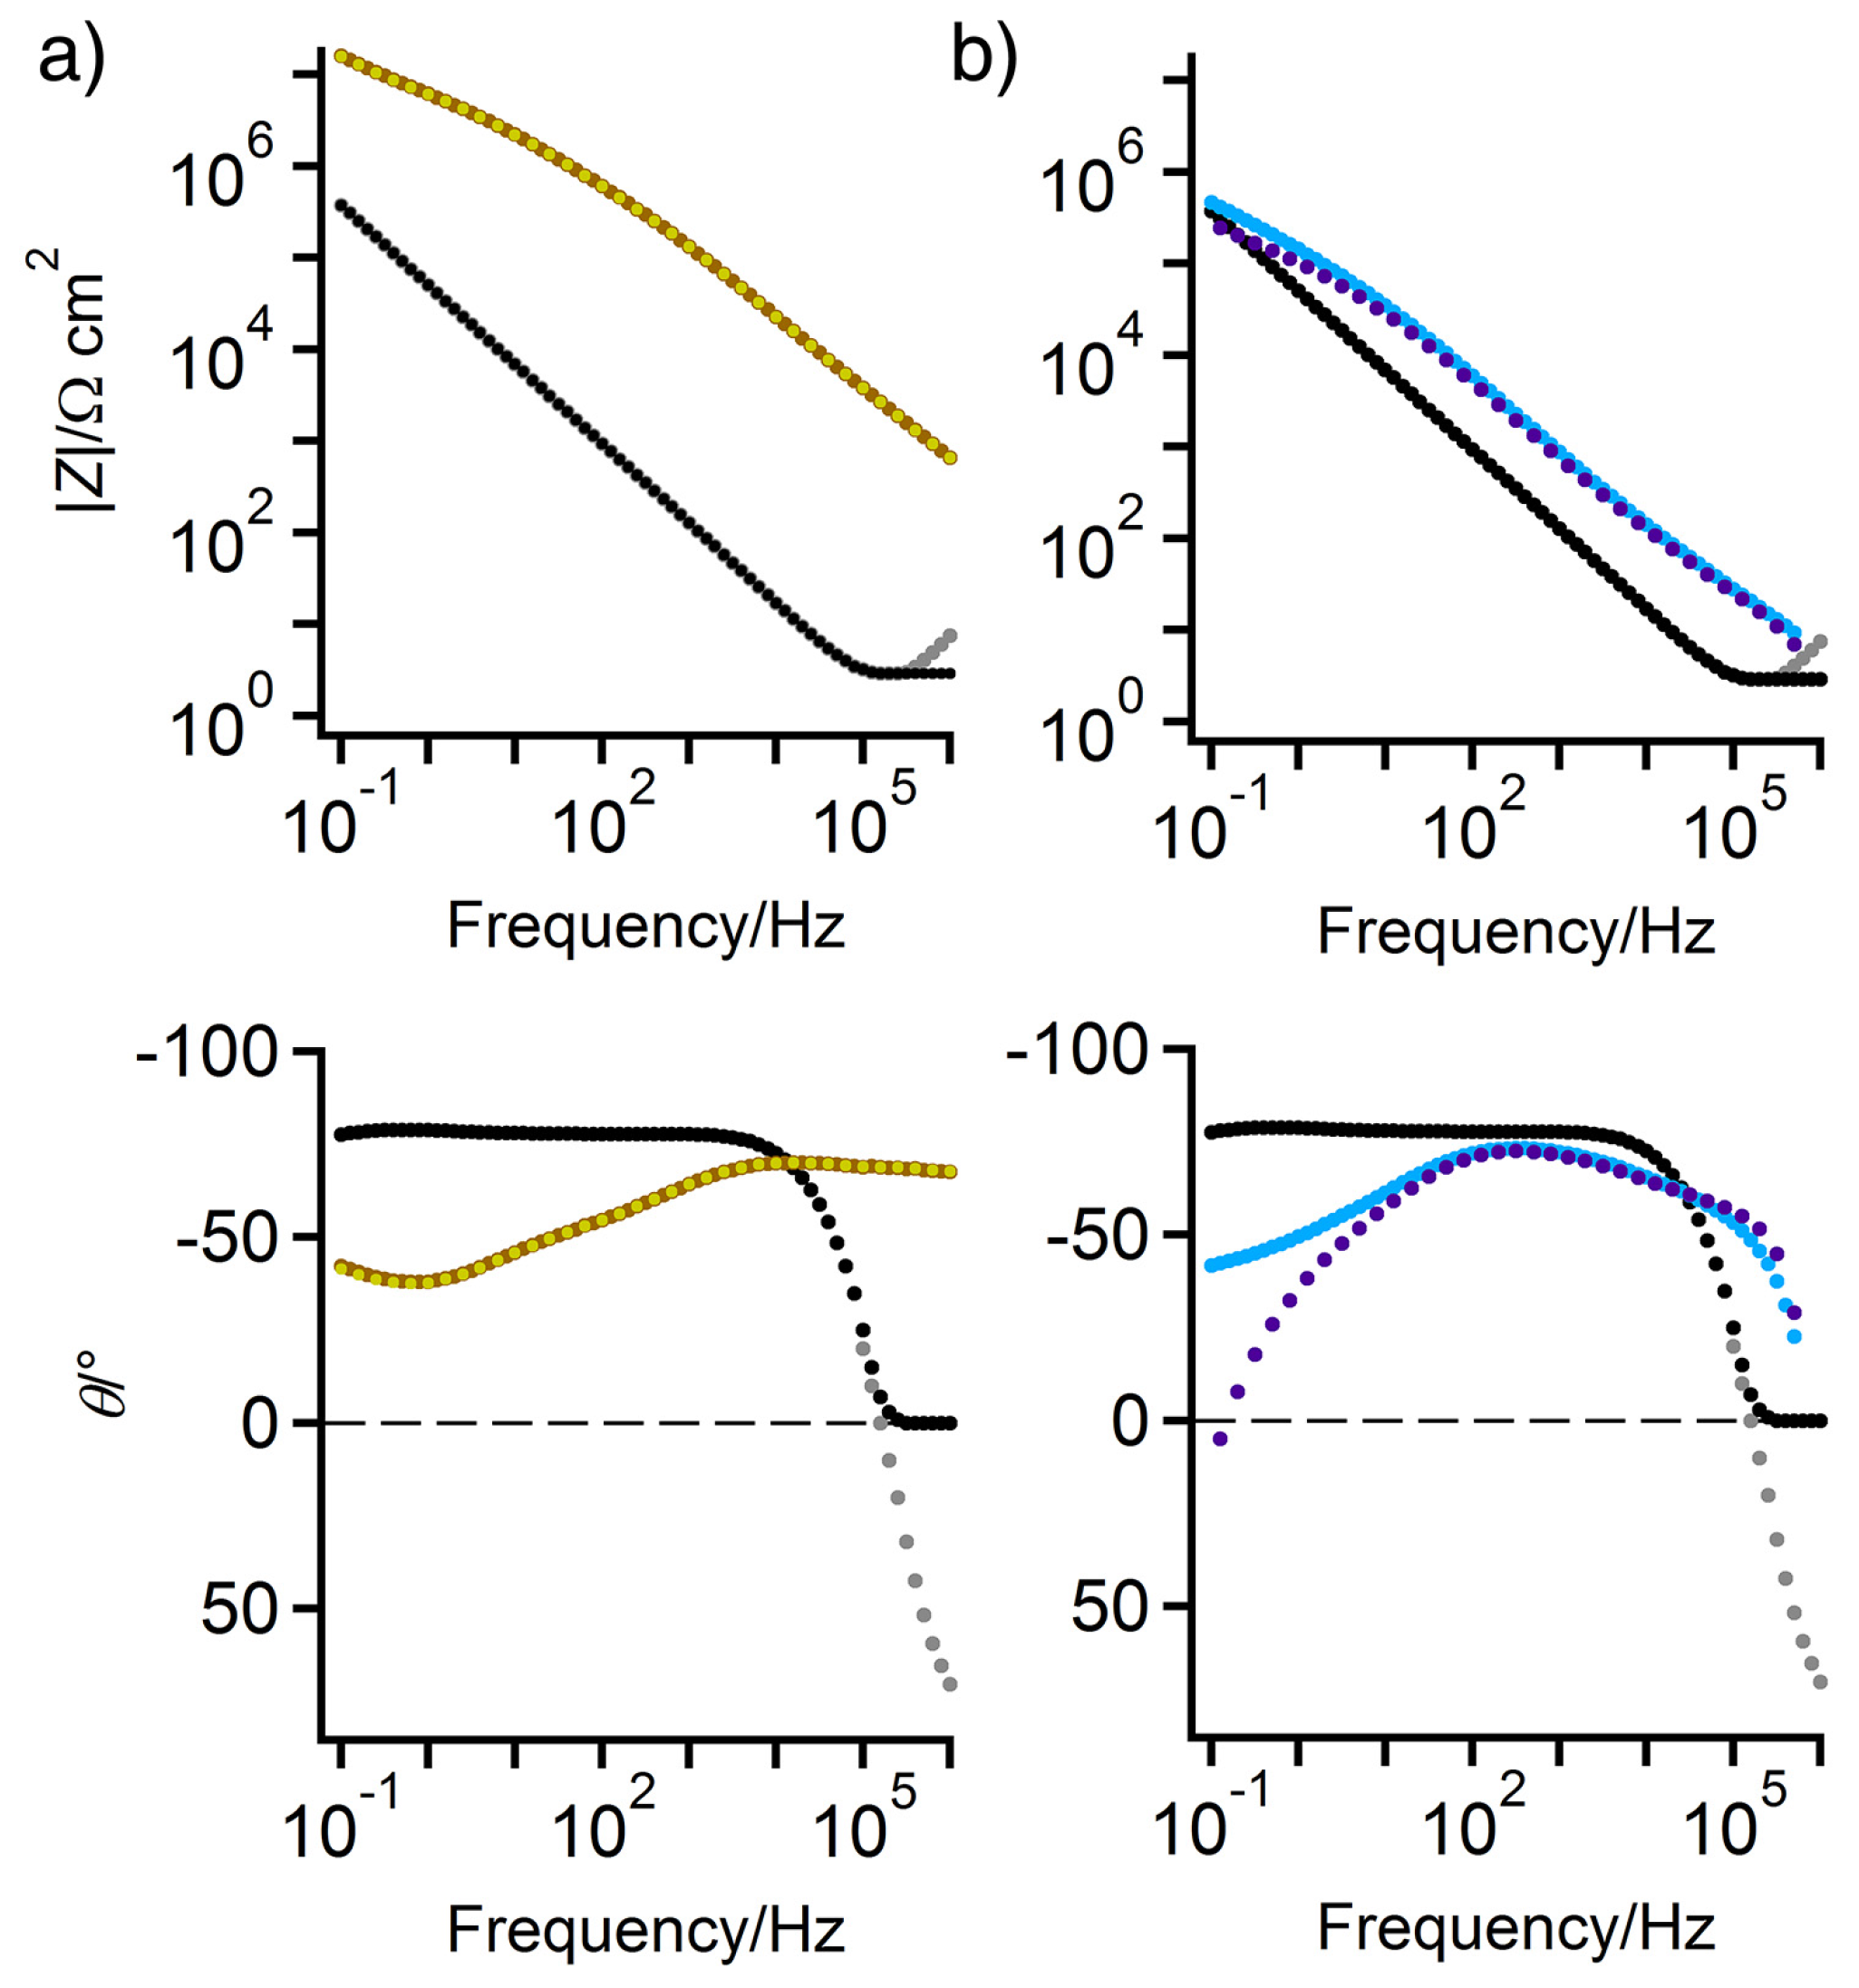
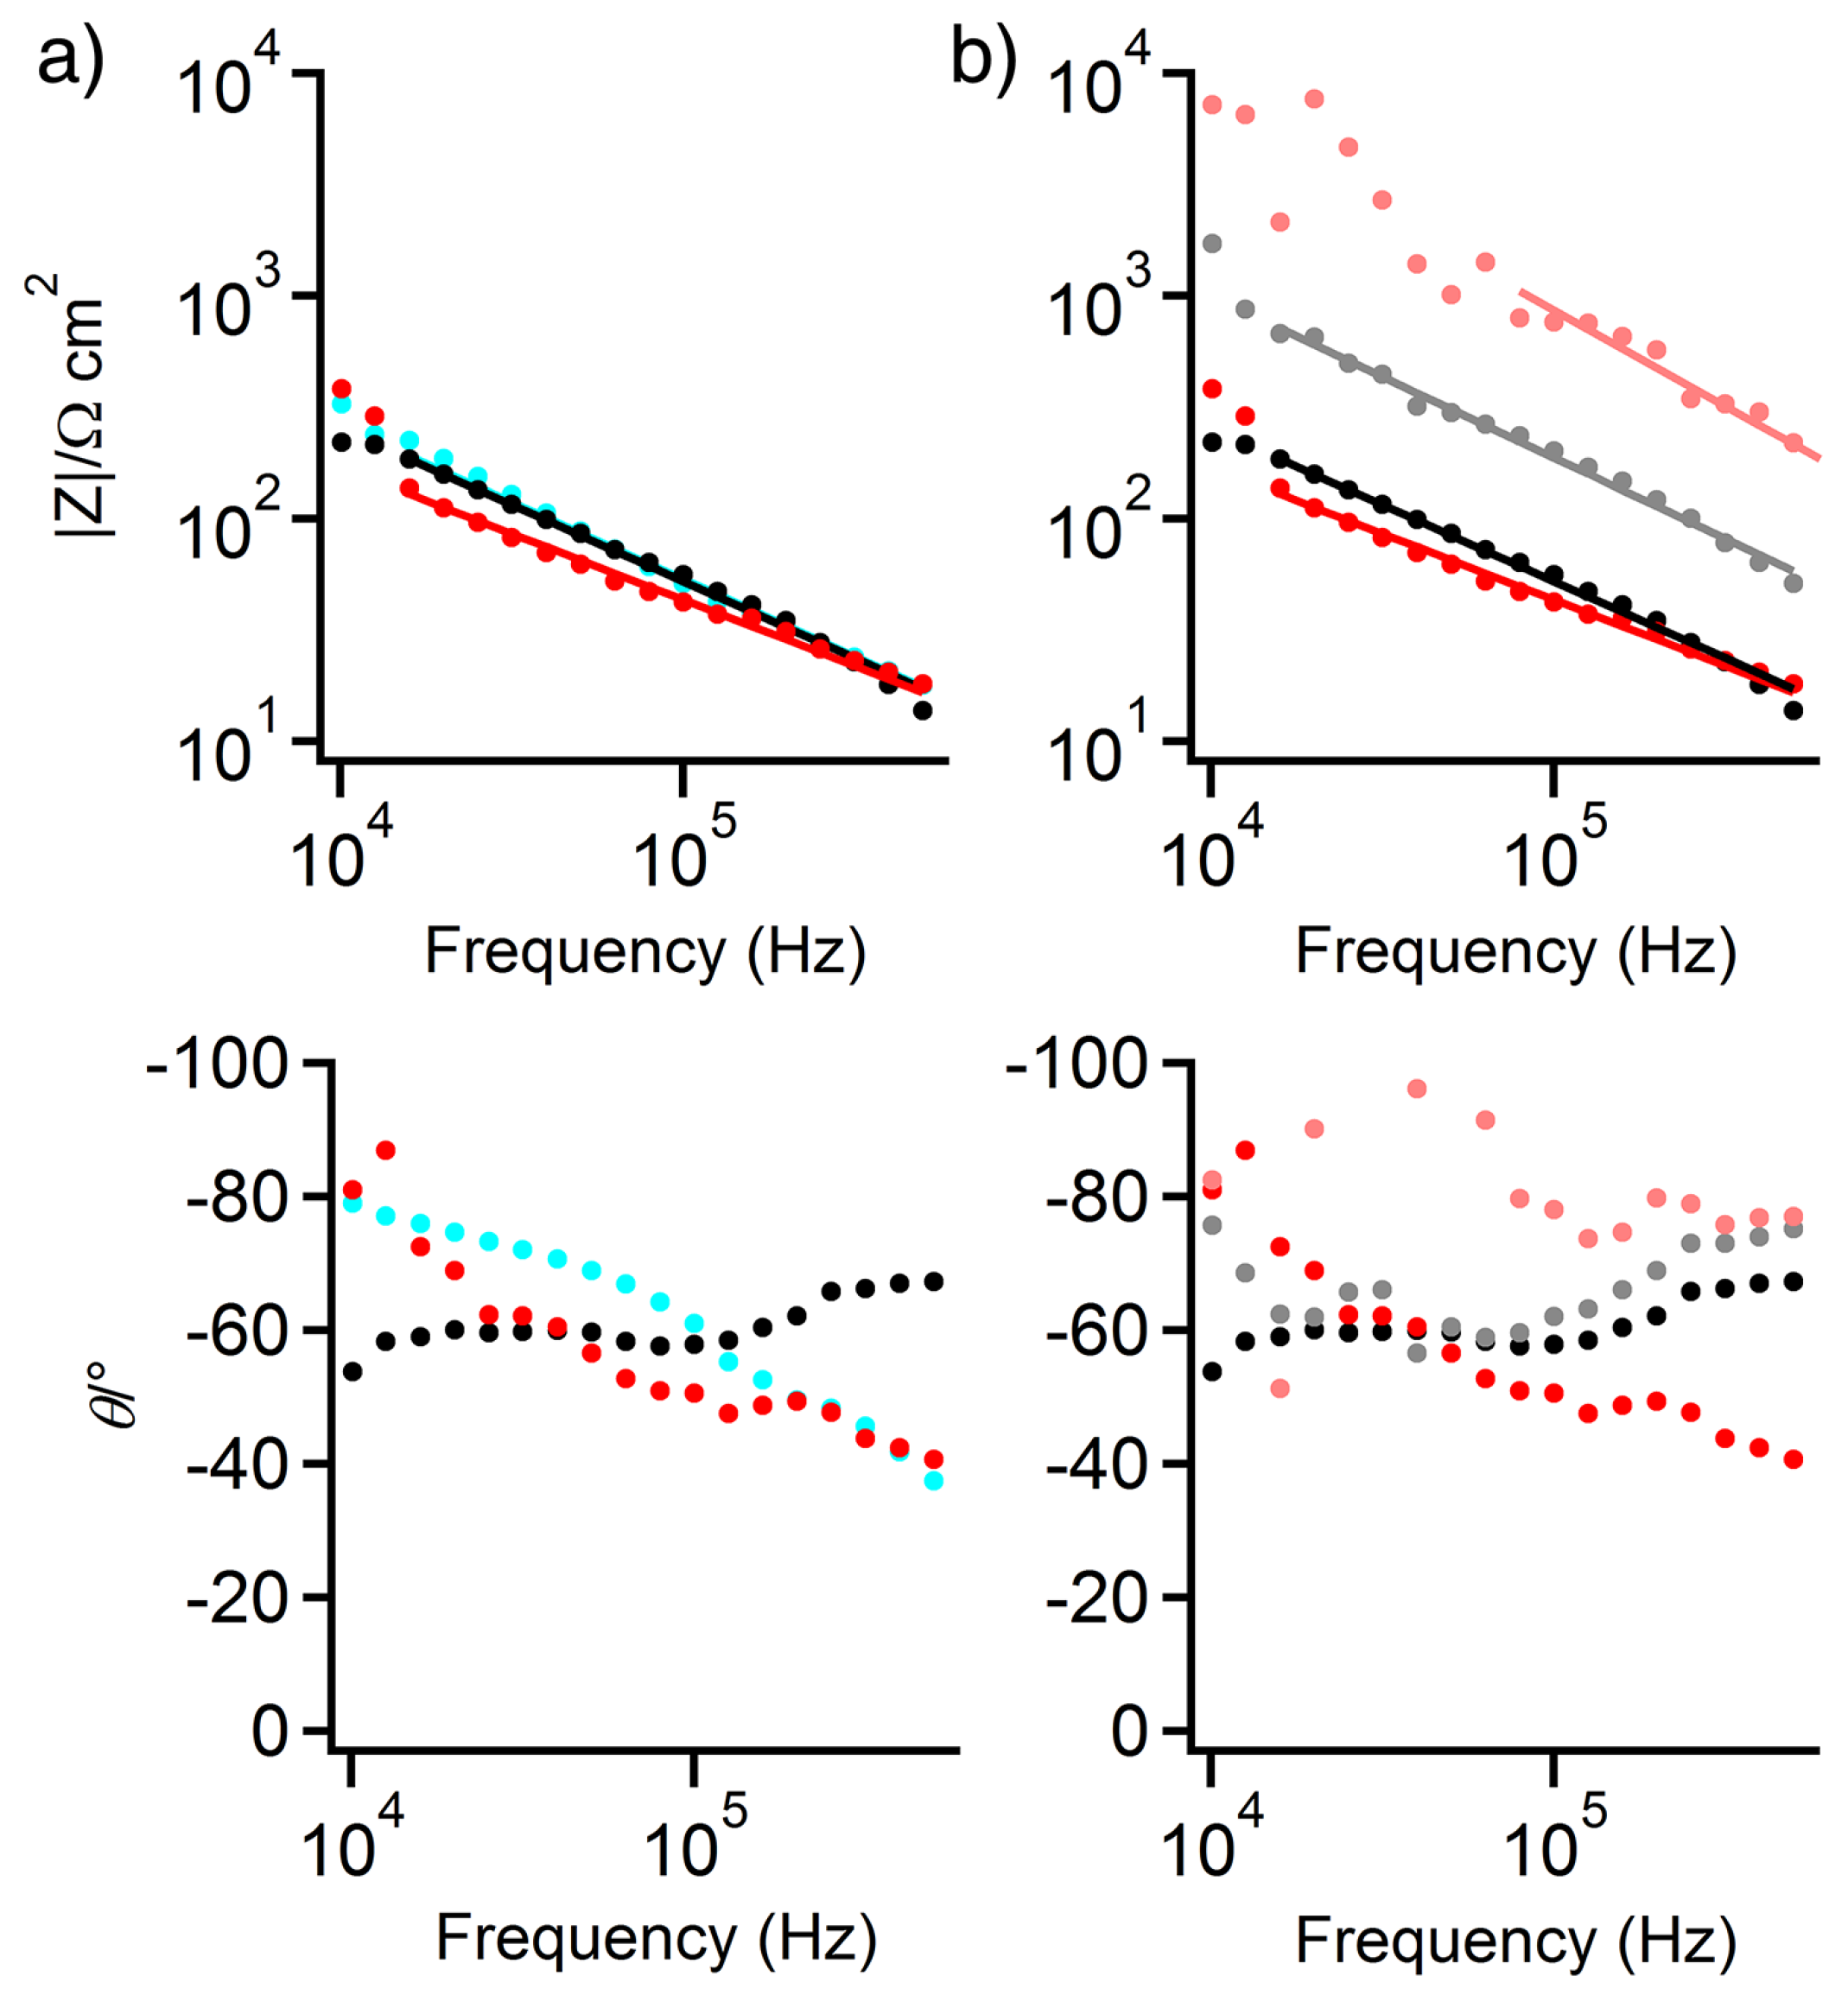
3.1. Hydrogel Cell Background Impedance
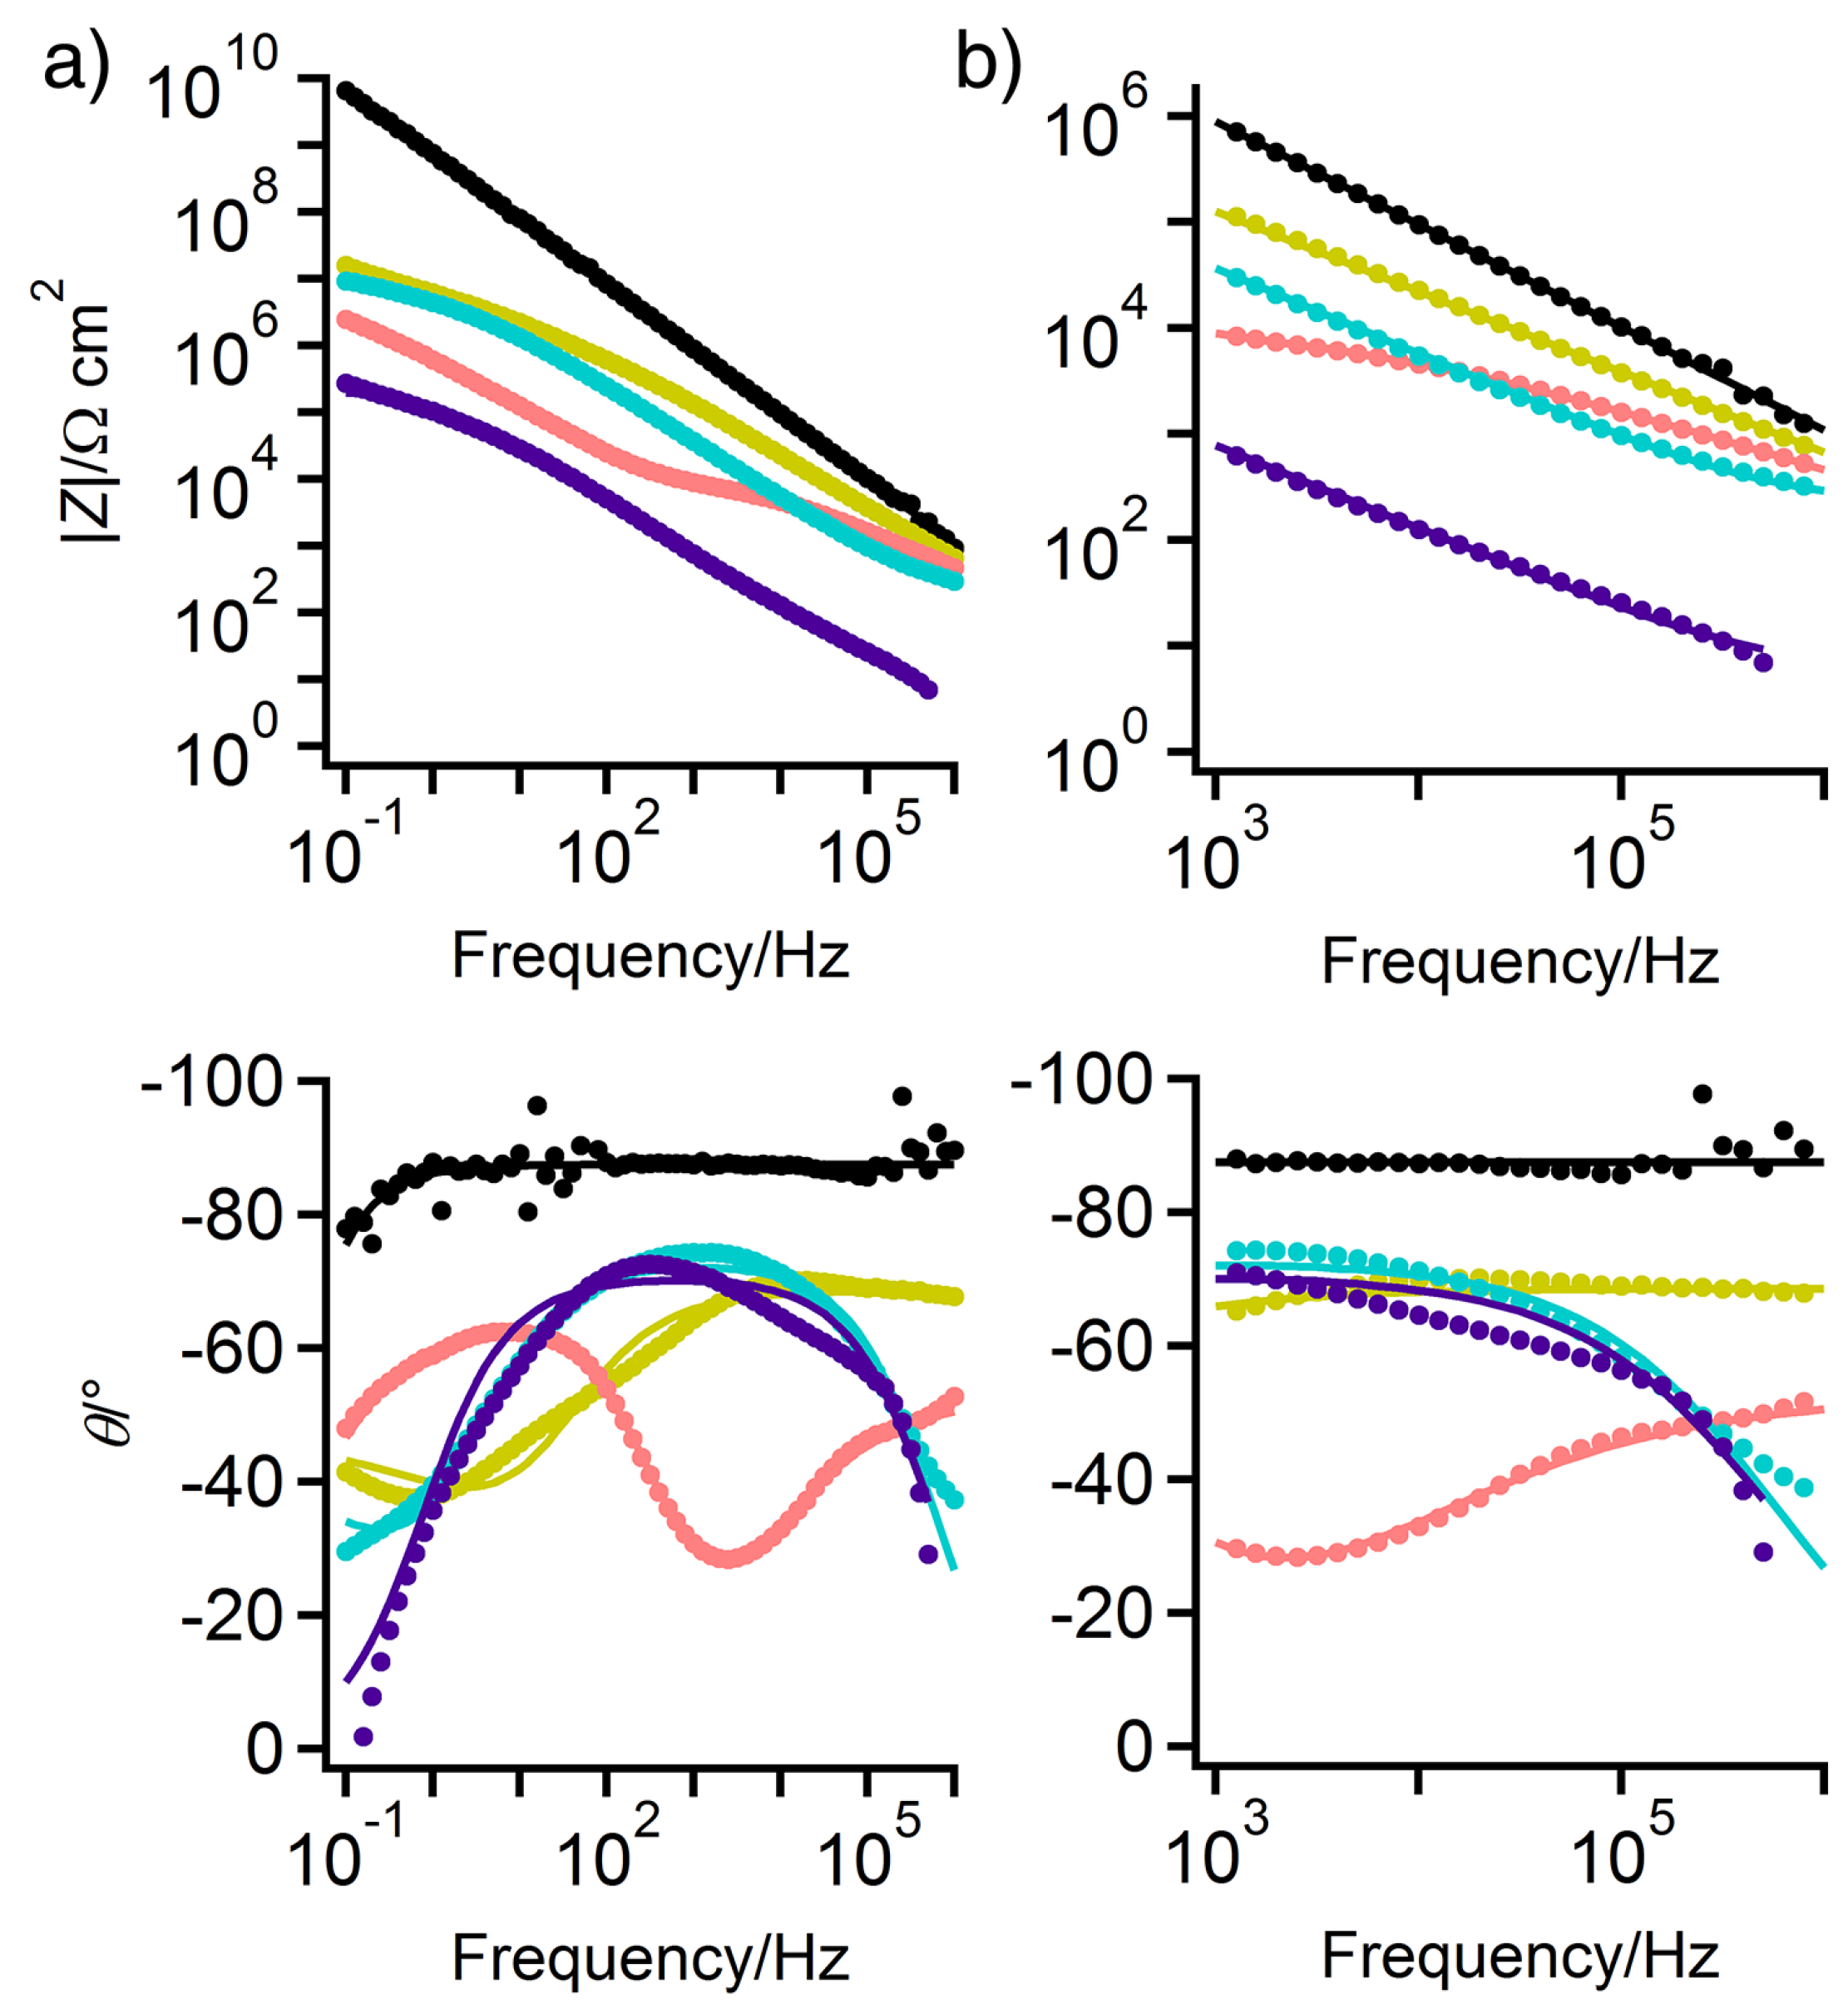
3.2. EIS of Wax-Coated Bronze Sculptures
3.3. EIS of Test Panels
4. Conclusions
Acknowledgments
Author Contributions
Conflicts of Interest
Appendix

| Sample | Ru/Ω·cm2 | Y0,1/S sα·cm−2 | α1 | R1/Ω·cm2 |
| PA | 5.46 (±0.474) | 1.33 (±0.043) × 10−6 | 0.785 (±0.0037) | 2.15 (±0.076) × 105 |
| WA | 220 (±5.37) | 2.32 (±0.094) × 10−8 | 0.809 (±0.0018) | 4.62 (±0.142) × 106 |
| WPA | – | 2.29 (±0.056) × 10−7 | 0.583 (±0.0017) | 1.03 (±0.011) × 104 |
| W | – | 9.95 (±0.250) × 10−9 | 0.762 (±0.0022) | 2.36 (±0.096) × 106 |
| B44 | – | 2.27 (±0.028) × 10−10 | 0.972 (±0.0013) | 3.22 (±0.512) × 1010 |
| Sample | Y0,2/S sα·cm−2 | α2 | R2/Ω·cm2 | |
| PA | – | – | – | |
| WA | 1.73 (±0.061) × 10−7 | 0.5 | – | |
| WPA | 2.22 (±0.042) × 10−7 | 0.786 (±0.0026) | 8.97 (±0.242) × 106 | |
| W | 7.34 (±0.131) × 10−8 | 0.5 | – | |
| B44 | – | – | – |
References
- Otieno-Alego, V.; Health, G.; Hallam, D.; Creagh, D. Electrochemical evaluation of the anti-corrosion performance of waxy coatings for outdoor bronze conservation. In Proceedings of the International Conference on Metals Conservation, Draguignan, France, 27–29 May 1998; pp. 309–314.
- Cano, E.; Bastidas, D.M.; Argyropoulos, V.; Fajardo, S.; Siatou, A.; Bastidas, J.M.; Degrigny, C. Electrochemical characterization of organic coatings for protection of historic steel artefacts. J. Solid State Electrochem. 2010, 14, 453–463. [Google Scholar] [CrossRef] [Green Version]
- Cano, E.; Lafuente, D.; Bastidas, J.M. Use of EIS for the evaluation of the protective properties of coatings for metallic cultural heritage: A review. J. Solid State Electrochem. 2010, 14, 381–391. [Google Scholar] [CrossRef] [Green Version]
- Domingues, J.; Bonelli, N.; Giorgi, R.; Baglioni, P. Chemical semi-IPN hydrogels for the removal of adhesives from canvas paintings. Appl. Phys. A Mater. Sci. Process. 2014, 114, 705–710. [Google Scholar] [CrossRef]
- Pizzorusso, G.; Fratini, E.; Eiblmeier, J.; Giorgi, R.; Chelazzi, D.; Chevalier, A.; Baglioni, P. Physicochemical Characterization of Acrylamide/Bisacrylamide Hydrogels and Their Application for the Conservation of Easel Paintings. Langmuir 2012, 28, 3952–3961. [Google Scholar] [CrossRef] [PubMed]
- Alba, N.A.; Sclabassi, R.J.; Sun, M.G.; Cui, X.T. Novel Hydrogel-Based Preparation-Free EEG Electrode. IEEE Trans. Neural Syst. Rehabil. Eng. 2010, 18, 415–423. [Google Scholar] [CrossRef] [PubMed]
- England, A.E.; Clare, T.L. Synthesis and Characterization of Flexible Hydrogel Electrodes for Electrochemical Impedance Measurements of Protective Coatings on Metal Sculptures. Electroanalysis 2014, 26, 1059–1067. [Google Scholar] [CrossRef]
- Mansfeld, F.; Kendig, M.W. Electrochemical Impedance Tests for Protective Coatings; Laboratory Corrosion Tests and Standards; ASTM International: Philadelphia, PA, USA, 1985; pp. 122–142. [Google Scholar]
- Amirudin, A.; Thierry, D. Application of electrochemical impedance spectroscopy to study the degradation of polymer-coated metals. Prog. Org. Coat. 1995, 26, 1–28. [Google Scholar] [CrossRef]
- Van Westing, E.P.M.; Ferrari, G.M.; de Wit, J.H.W. The determination of coating performance with impedance measurements-I. Coating polymer properties. Corros. Sci. 1993, 34, 1511–1530. [Google Scholar] [CrossRef]
- Swartz, N.A.; Clare, T.L. Understanding the differences in film formation mechanisms of two comparable solvent based and water-borne coatings on bronze substrates by electrochemical impedance spectroscopy. Electrochim. Acta 2012, 62, 199–206. [Google Scholar] [CrossRef]
- Price, C.; Hallam, D.; Heath, G.; Creagh, D.; Ashton, J. An electrochemical study of waxes for bronze sculpture. In Proceedings of the International Conference on Metals Conservation, Semur en Auxois, France, 25 September 1997; pp. 233–241.
- Letardi, P.; Beccaria, A.; Marabelli, M.; Ercolo, G.D. Application of electrochemical impedance mesurements as a tool for the characterization of the conservation and protection state of bronze works of art. In Proceedings of the International Conference on Metals Conservation, Draguignan, France, 27–29 May 1998; pp. 303–308.
- Clare, T.L. Evaluation of fluorinated protective coatings for outdoor metals. In Proceedings of the International Conference on Metals Conservation, Amsterdam, The Netherlands, 23–26 October 2007; pp. 83–87.
- Corbellini, S.; Parvis, M.; Grassini, S. Noninvasive Solution for Electrochemical Impedance Spectroscopy on Metallic Works of Art. IEEE Trans. Instrum. Meas. 2012, 61, 1193–1200. [Google Scholar] [CrossRef]
- England, A.H.; Clare, T.L. Synthesis and characterization of flexible hydrogel electrodes for electrochemical impedance measurements of protective coatings on metal sculptures. Electroanal 2014, 26, 1059–1067. [Google Scholar] [CrossRef]
- Hsu, C.H.; Mansfeld, F. Technical note: Concerning the conversion of the constant phase element parameter Y-0 into a capacitance. Corrosion 2001, 57, 747–748. [Google Scholar] [CrossRef]
- Walter, G.W. A review of impedance plot methods used for corrosion performance analysis of painted metals. Corros. Sci. 1986, 26, 681–703. [Google Scholar] [CrossRef]
- Freger, V.; Bason, S. Characterization of ion transport in thin films using electrochemical impedance spectroscopy. I. Principles and theory. J. Membr. Sci. 2007, 302, 1–9. [Google Scholar] [CrossRef]
- Swartz, N.A.; Clare, T.L. On the protective nature of wax coatings for culturally significant outdoor metalworks. J. Am. Inst. Conserv. 2015, 54, 181–201. [Google Scholar] [CrossRef]


| Sample | Metal | Patina | Coating | Aging Method | Thickness/μm | |
|---|---|---|---|---|---|---|
| Sculpture | PPU | Bronze | Yes | Microcrystalline wax | Outdoors | 52.3 ± 27 |
| C1 | Bronze | Yes | Microcrystalline wax | Outdoors | 32.6 ± 2.9 | |
| C2 | Bronze | Yes | Microcrystalline wax | Outdoors | 42.6 ± 5.6 | |
| C1b | Bronze | Yes | Microcrystalline wax | Outdoors | 37.8 ± 6.4 | |
| C2b | Bronze | Yes | Microcrystalline wax | Outdoors | 39.9 ± 5.3 | |
| Test | W | Bronze | No | Renaissance wax | NA | 11.2 ± 4.5 |
| B44 | Bronze | No | B-44 | NA | 37.2 ± 3.5 | |
| PA | Bronze | Yes | NA | QUV 500 hrs | 3.8 ± 1.1 | |
| WA | Bronze | No | Renaissance wax | QUV 1250 hrs | 17.8 ± 2.6 | |
| WPA | Bronze | Yes | Renaissance wax | QUV 1500 hrs | 14.8 ± 5.2 | |
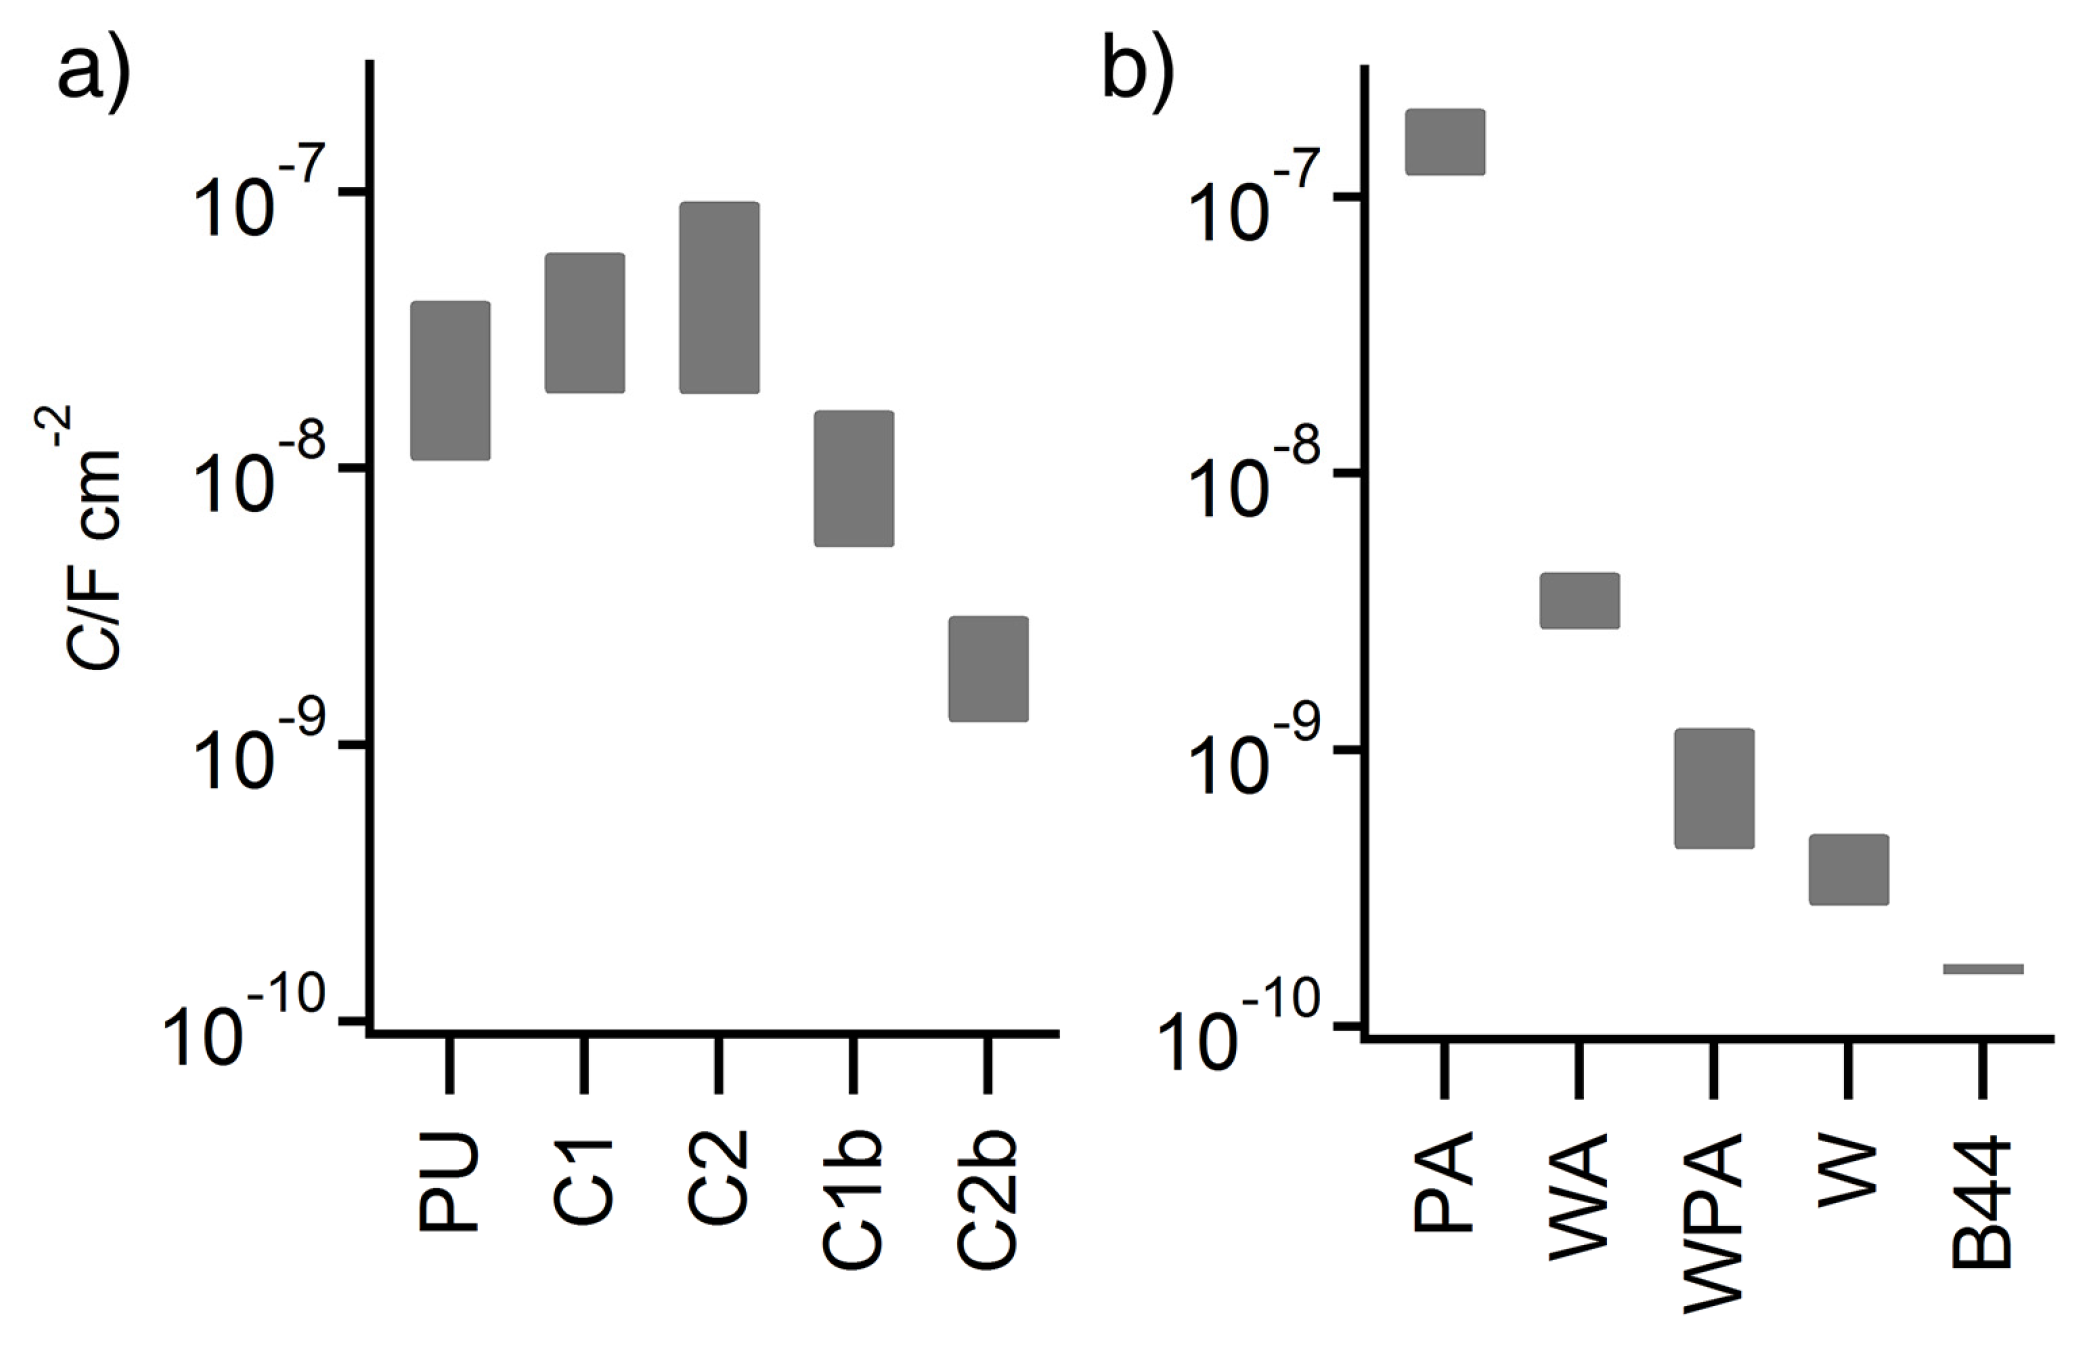
| Sample | Y0/S sα·cm−2 | α | C/nF·cm−2 |
|---|---|---|---|
| PPU | 1.84 (±0.492) × 10−6 | 0.691 (±0.020) | 10.7–40.6 |
| C1 | 1.97 (±0.234) × 10−6 | 0.689 (±0.009) | 18.7–60.5 |
| C2 | 8.32 (±1.59) × 10−6 | 0.594 (±0.014) | 18.6–92.7 |
| C1b | 3.22 (±0.517) × 10−7 | 0.728 (±0.012) | 5.20–16.3 |
| C2b | 1.19 (±0.276) × 10−8 | 0.860 (±0.016) | 1.21–2.94 |
| Sample | Y0/S sα·cm−2 | α | C/nF·cm−2 |
|---|---|---|---|
| PA | 1.33(±0.043) × 10−6 | 0.785(±0.0037) | 120–210 a |
| WA | 2.32(±0.039) × 10−8 | 0.809(±0.0018) | 2.74–4.41 a |
| WPA | 2.29(±0.056) × 10−7 | 0.583(±0.0017) | 0.438–1.20 b |
| W | 9.95(±0.250) × 10−9 | 0.762(±0.0022) | 0.274–0.498 b |
| B44 | 2.27(±0.028) × 10−10 | 0.972(±0.0013) | 0.155–0.169 c |
© 2016 by the authors; licensee MDPI, Basel, Switzerland. This article is an open access article distributed under the terms and conditions of the Creative Commons Attribution (CC-BY) license (http://creativecommons.org/licenses/by/4.0/).
Share and Cite
England, A.H.; Hosbein, K.N.; Price, C.A.; Wylder, M.K.; Miller, K.S.; Clare, T.L. Assessing the Protective Quality of Wax Coatings on Bronze Sculptures Using Hydrogel Patches in Impedance Measurements. Coatings 2016, 6, 45. https://doi.org/10.3390/coatings6040045
England AH, Hosbein KN, Price CA, Wylder MK, Miller KS, Clare TL. Assessing the Protective Quality of Wax Coatings on Bronze Sculptures Using Hydrogel Patches in Impedance Measurements. Coatings. 2016; 6(4):45. https://doi.org/10.3390/coatings6040045
Chicago/Turabian StyleEngland, Alice H., Kathryn N. Hosbein, Capri A. Price, Morgan K. Wylder, Kenna S. Miller, and Tami Lasseter Clare. 2016. "Assessing the Protective Quality of Wax Coatings on Bronze Sculptures Using Hydrogel Patches in Impedance Measurements" Coatings 6, no. 4: 45. https://doi.org/10.3390/coatings6040045