1. Introduction
Carbon steel is used in offshore structures where corrosion, mainly caused by the constituents of seawater, is often exacerbated by fluctuating temperature and oxygen availability [
1,
2]. Oxygen availability is considered a key parameter influencing the corrosion of steel. Its supply to the steel surface is determined by the oxygen concentration in seawater, movement of the seawater, oxygen diffusion coefficient in seawater, and corrosion product formation [
3,
4]. Advances in offshore and drilling engineering allow extraction of oil and gas from deeper waters where higher temperatures along the pipelines and conduits are expected [
5].
It is generally recognized that calcareous deposits will form on cathodically polarized steel surfaces when exposed to seawater as long as conditions allowing the nucleation and growth of these deposits are met. The calcareous deposits are beneficial to the structure since they act as a barrier to diffusion of dissolved oxygen [
5]. Seawater is mildly alkaline (pH 7.8–8.3) and it is reported that a minimum pH of 9.5 and 7.5 is required at 25 °C for the deposition of Mg(OH)
2 and CaCO
3 layers, respectively [
5,
6,
7,
8,
9]. A higher pH is required for the deposition of Mg(OH)
2 since seawater is usually unsaturated with Mg(OH)
2, while surface seawater is supersaturated with CaCO
3 [
10].
The pH values, however, are mainly specified through theoretical approaches, with few experimental data available to support it so far, especially at higher temperatures.
Dexter and Lin [
11] estimated the local pH on steel subjected to cathodic polarization by a galvanostatic method, considering the buffering capacity and ionic strength of seawater at 25 °C, and compared the model values with their experimental values using a microelectrode technique by applying current densities of 0, 20, and 100 µA/cm
2. From the modelling, they obtained a maximum interfacial pH of 9.9, while the experimental value reached 10.2 at the highest current density. They highlighted that the difference is related to the distance of the micro-pH electrode from the steel surface, estimated to be 50 and 100 µm while the modelling gave values right at the steel surface. Also, the modelling did not consider the hydrogen evolution, only the oxygen reduction as cathodic reaction. Salgavo et al. [
8] analyzed alloy 600 (UNS N06600) sample cathodically polarized to −0.8 V to −1.2 V (Ag/AgCl) in natural seawater at temperatures between 13 °C and 27 °C. The probe was 1 mm from the metal surface and the maximum pH value recorded was 10.7 at −1.2 V (Ag/AgCl). Lewandowski et al. [
12] found pH values between 9.5 and 10 at −1.0 V (SCE) on 304 stainless steel (AISI 304SS) surface in synthetic seawater at room temperature. The distance between the pH microelectrode and the stainless steel surface was not specified.
It is evident from the above discussion that the local pH depends on cathodic polarization which ultimately governs the formation of calcareous deposits in seawater. However, experimental studies related to local pH at temperatures above 30 °C were not found in the literature. Moreover, polarization from a sacrificial anode such as TSA, at the temperatures applied in this study has not been covered in publications so far. This study aims to address this knowledge gap and, for such purpose, experiments were designed to acquire local pH data on TSA coatings and steel surfaces cathodically polarized by a TSA coating, while both considering exposure to seawater at 30 °C and 60 °C. The implication of deposit formation on the corrosion performance of TSA-coated steel in seawater is also discussed.
2. Materials and Methods
2.1. Specimen Preparation
Four carbon steel coupons (conforming to BS EN 10027-1 S355J2G4) were sprayed with commercially pure aluminum using a twin-wire arc spray system (TWAS) with a 528 gun (Metallisation Ltd., Dudley, UK).
Table 1 shows both the steel and Al wire composition, while
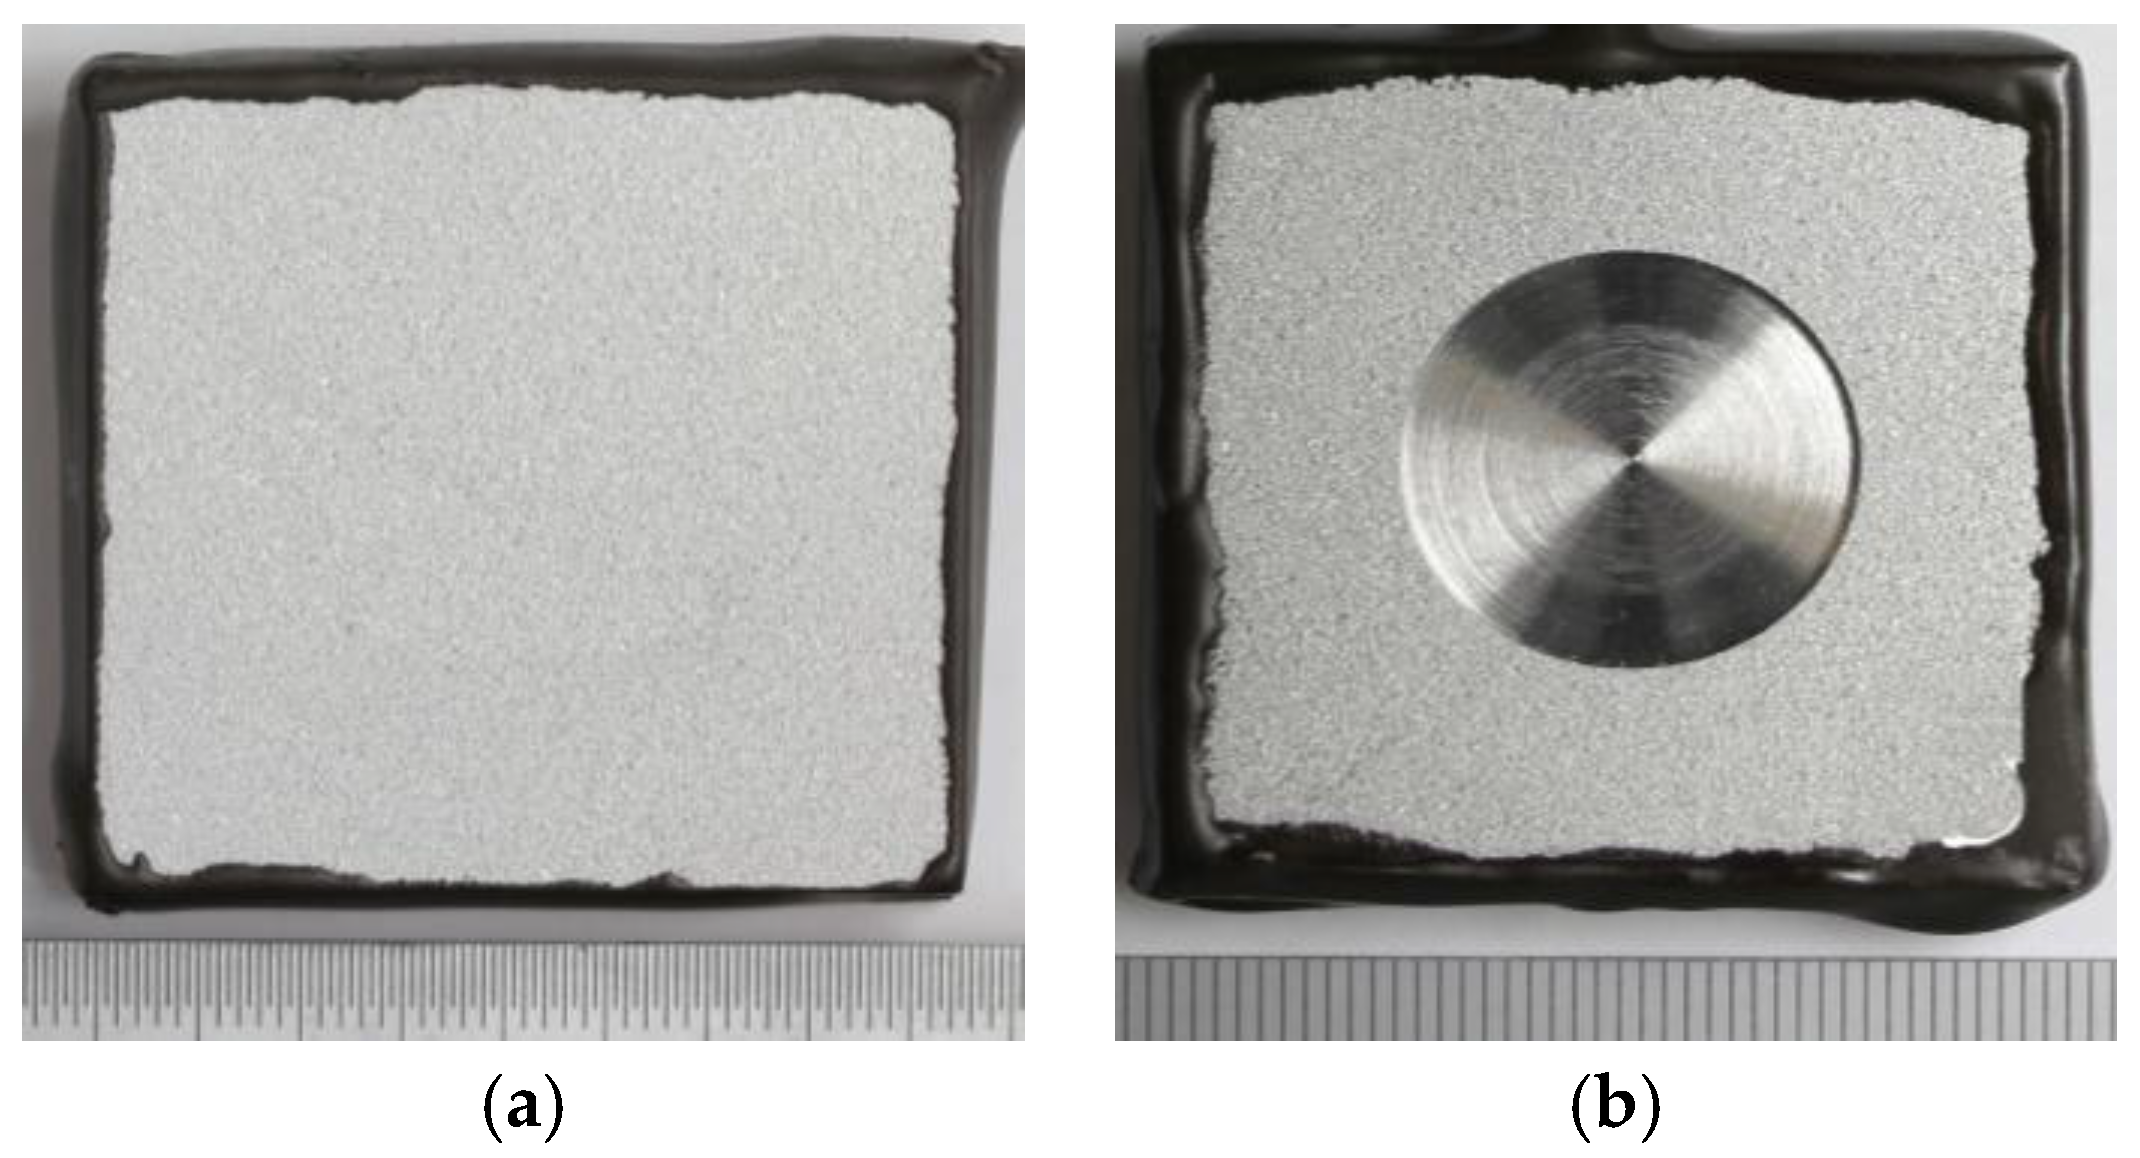
Table 2 gives the parameters used for the coating production. Holidays (Ø 20 mm, 0.8 mm depth, exposing 20% of the specimen surface area) were drilled on two coated specimens to expose the underlying steel (
Figure 1). The dimension of the specimens was 40 × 40 × 6 mm
3 and their back and edges were covered with a polymeric resin.
2.2. Exposure Tests and pH Measurements
The specimens were exposed to synthetic seawater (composition given in
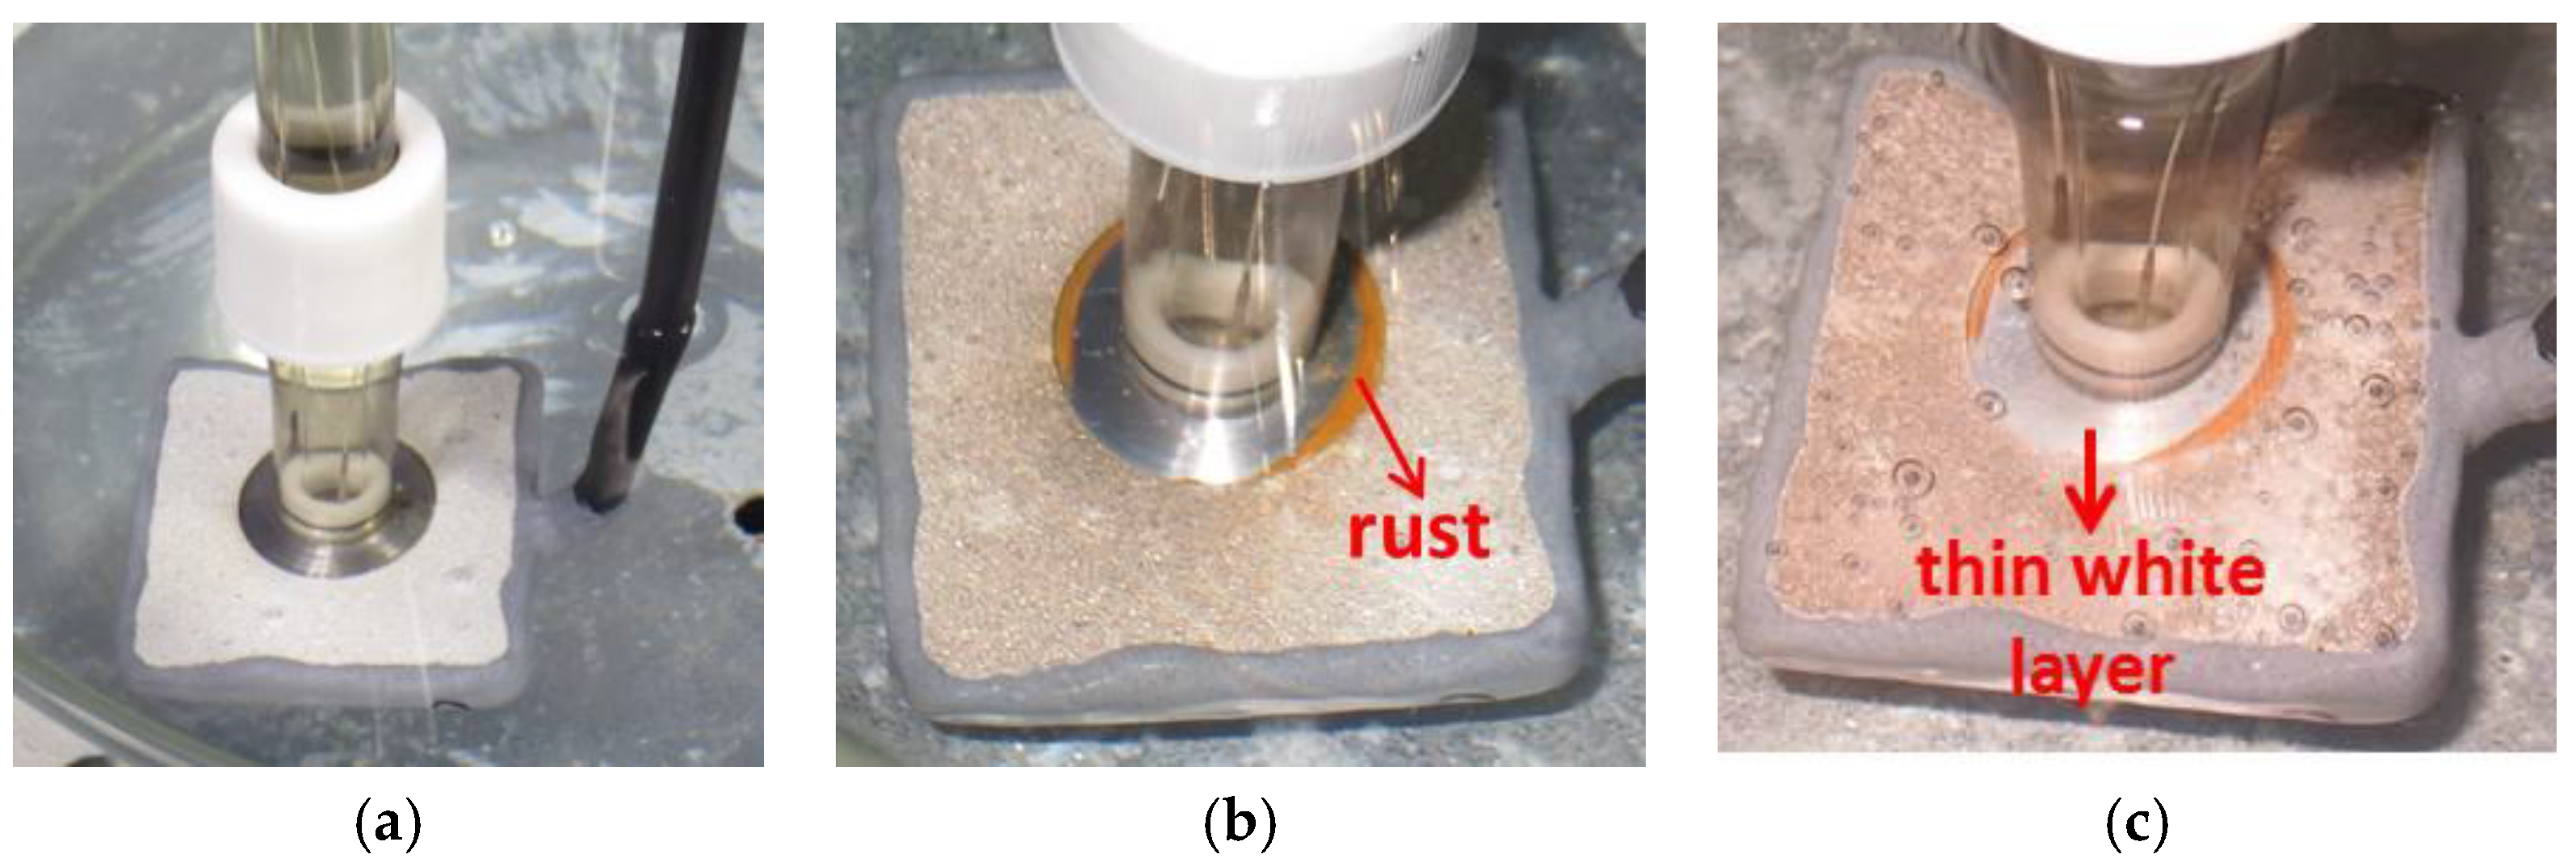
Table 3) at two temperatures: 30 °C and 60 °C. A flat tip pH electrode was positioned, touching the sample’s surface and in the case of the coupon with the holiday, the pH electrode was centered in the holiday region touching the steel surface (
Figure 2a and
Figure 3a at 30 °C and 60 °C, respectively).
A pH-meter was used for data acquisition and a temperature compensator was also employed. The temperature was set by adjusting the water bath heater settings. The evaporative loss was replenished by adding deionized water. At 30 °C, this was done once every two days with a few milliliters of water since the evaporation rate was low. At 60 °C, the evaporation loss was much greater and required replenishment twice a day, i.e., in the morning and in the evening. The deionized water was heated to the approximate temperature of the bulk seawater prior to addition, however, a small fluctuation in pH was observed during the addition.
The tests were monitored until reasonably stable pH values were reached, which in most cases took up to 350 h. The pH of the bulk seawater (away from the sample surface) was recorded daily. Prior to each experiment, the pH electrode was calibrated in buffer solutions of pH 7 and 10. Each test was carried out in separate reactors to avoid contamination. For comparison, a reactor filled with synthetic seawater only (without any specimen) had its pH measured twice a day in order to record the pH change without the influence of any sample.
2.3. Microstructural Characterization and Phase Identificiation
After testing, the specimens were dried and photographed. The samples with holidays had their top surfaces and cross sections analyzed by ZEISS 1455EP scanning electron microscope (SEM, Carl Zeiss AG, Oberkochen, Germany) and energy dispersive X-ray (EDX, Carl Zeiss AG, Oberkochen, Germany) in order to identify the chemical elements present. Prior to analysis, the samples were sputter coated with Au to provide a conductive layer. X-ray diffraction (XRD) was also carried out on the powder collected from the holiday region and the TSA coating surface. A Bruker D8-Advanced (Bruker Corporation, Billerica, MA, USA) was used to identify the crystalline phases. Bragg-Brentano geometry was employed to measure the diffraction intensity from 5° to 80° (2θ) with 0.01° step size. CuKα radiation (λ = 1.541 Å) was used and the X-ray unit was operated with an accelerating voltage of 40 kV. The software Diffrac.Suite.Eva (Version 4.1.1, Bruker AXS GmbH, Karlsruhe, Germany) was used for analyzing the peaks and background correction was applied.
The EDX analyses were performed in different areas of the samples in top view and cross section. In order to simplify, different labels were used to identify the different areas with the same composition.
3. Results
3.1. Visual Inspection
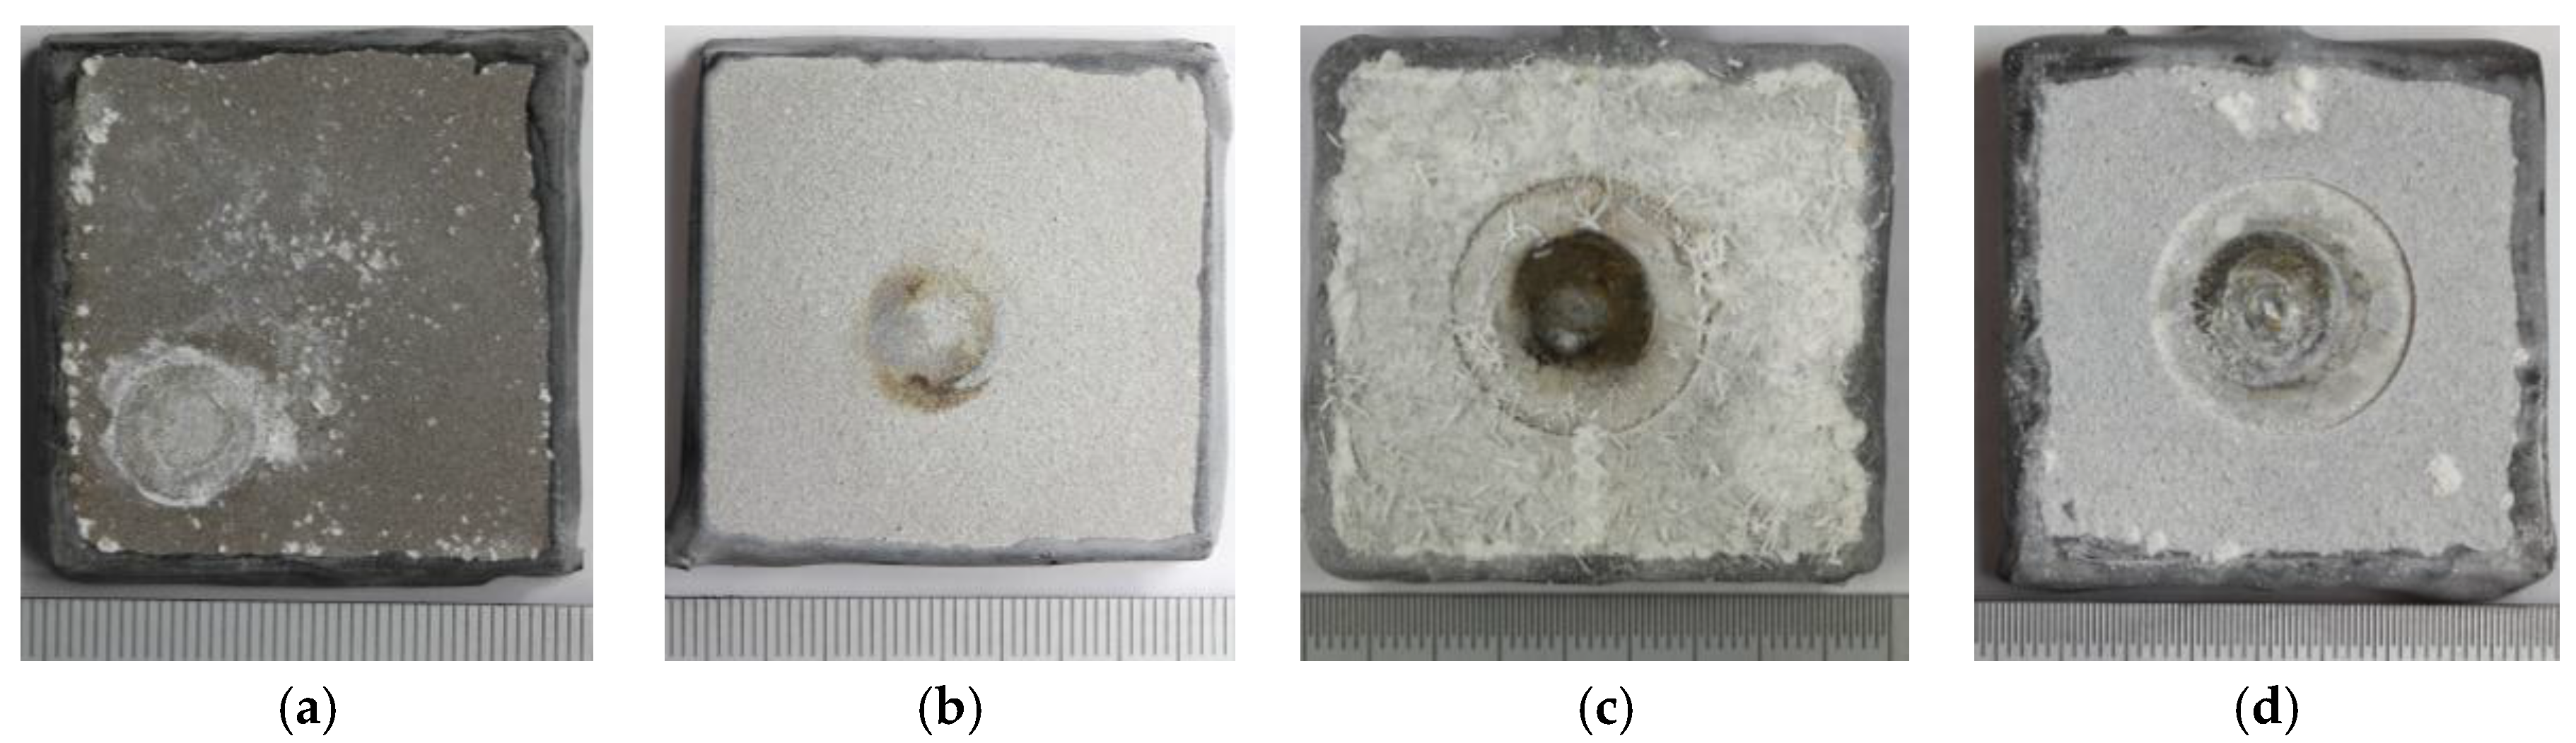
Figure 4 shows the images of the samples after exposure to synthetic seawater for up to 350 h. The change in the appearance of specimen surface due to the deposition of corrosion product or calcareous matter was expected. However, some differences between the specimens were also observed. The circles formed on surfaces were caused by the contact of the pH probe tip on the specimen. Although the pH probe may have perturbed the growth of calcareous deposit in that region just below the probe, it is not expected to modify the characteristics in the whole steel surface away from the probe (in the exposed holiday region).
3.2. Microstructural Characterization
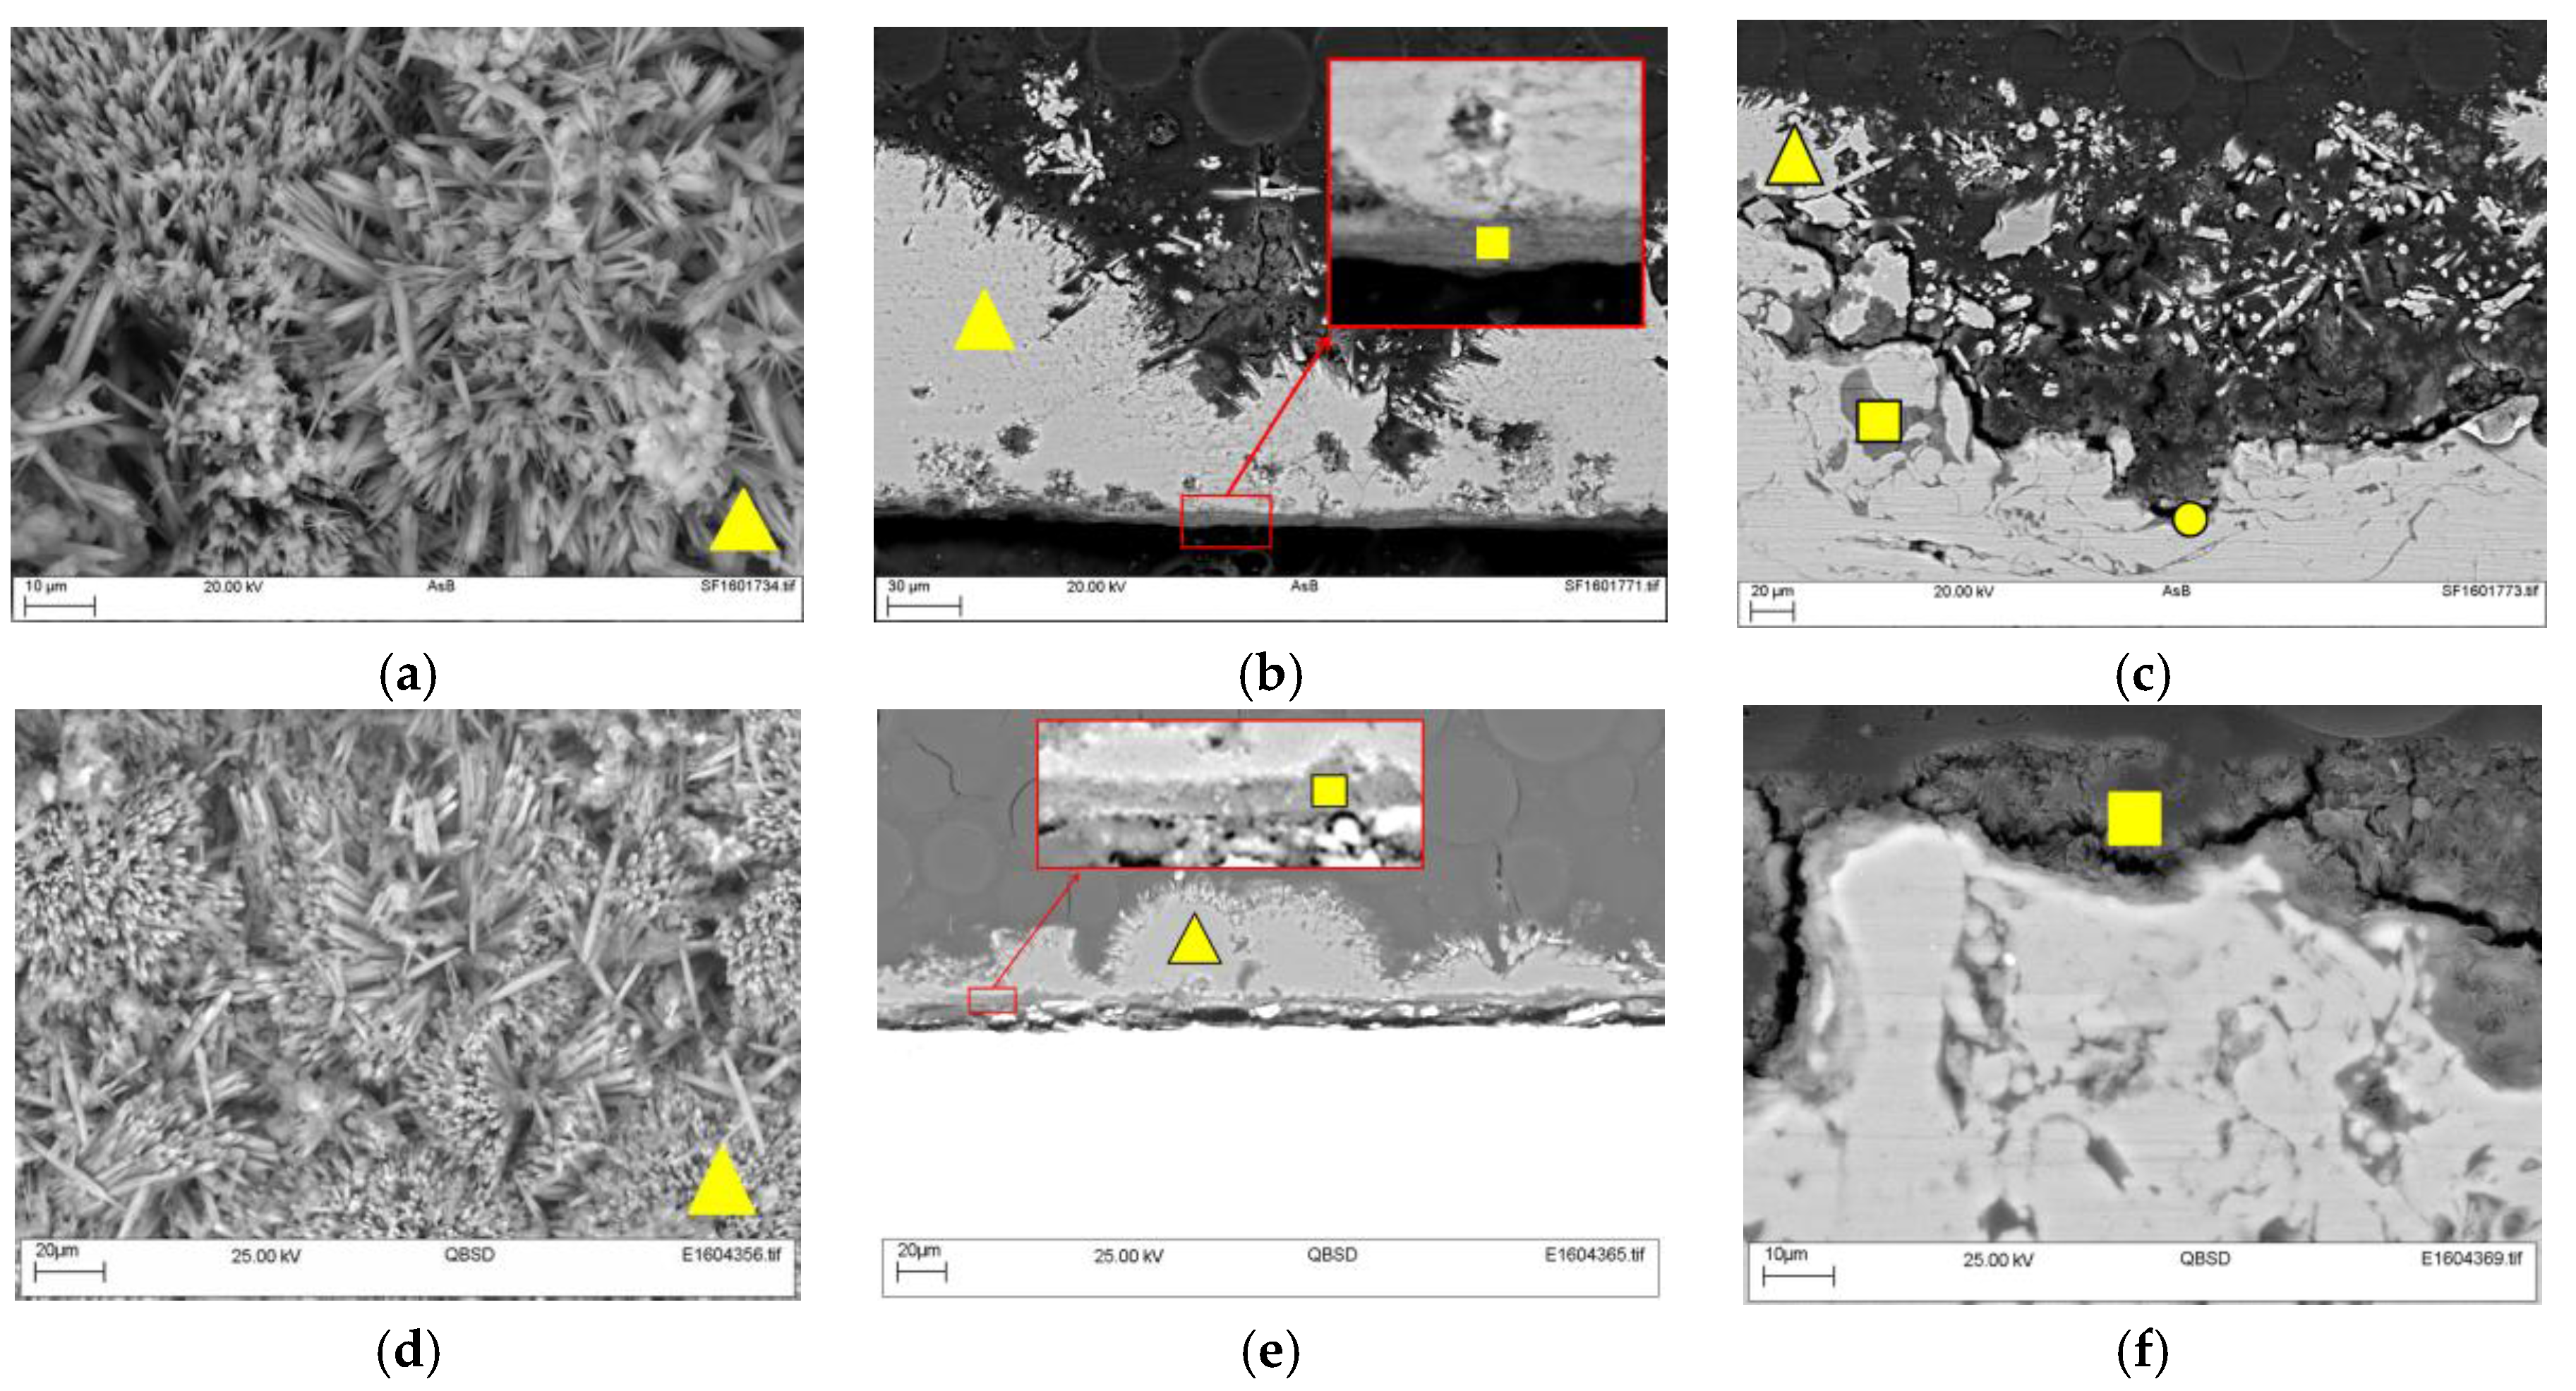
Figure 5 shows the microstructure of the deposit formed on the steel surface at 30 °C and 60 °C in the top view and cross-section. In the top view (
Figure 5a,b) it is possible to see the needle structure, typical of aragonite [
9,
14]. In the cross-sections (
Figure 5b,e) it was possible to identify two layers: A very thin dark grey layer below a thicker lighter grey layer. The regions were labeled according to their composition, as evidenced by EDX.
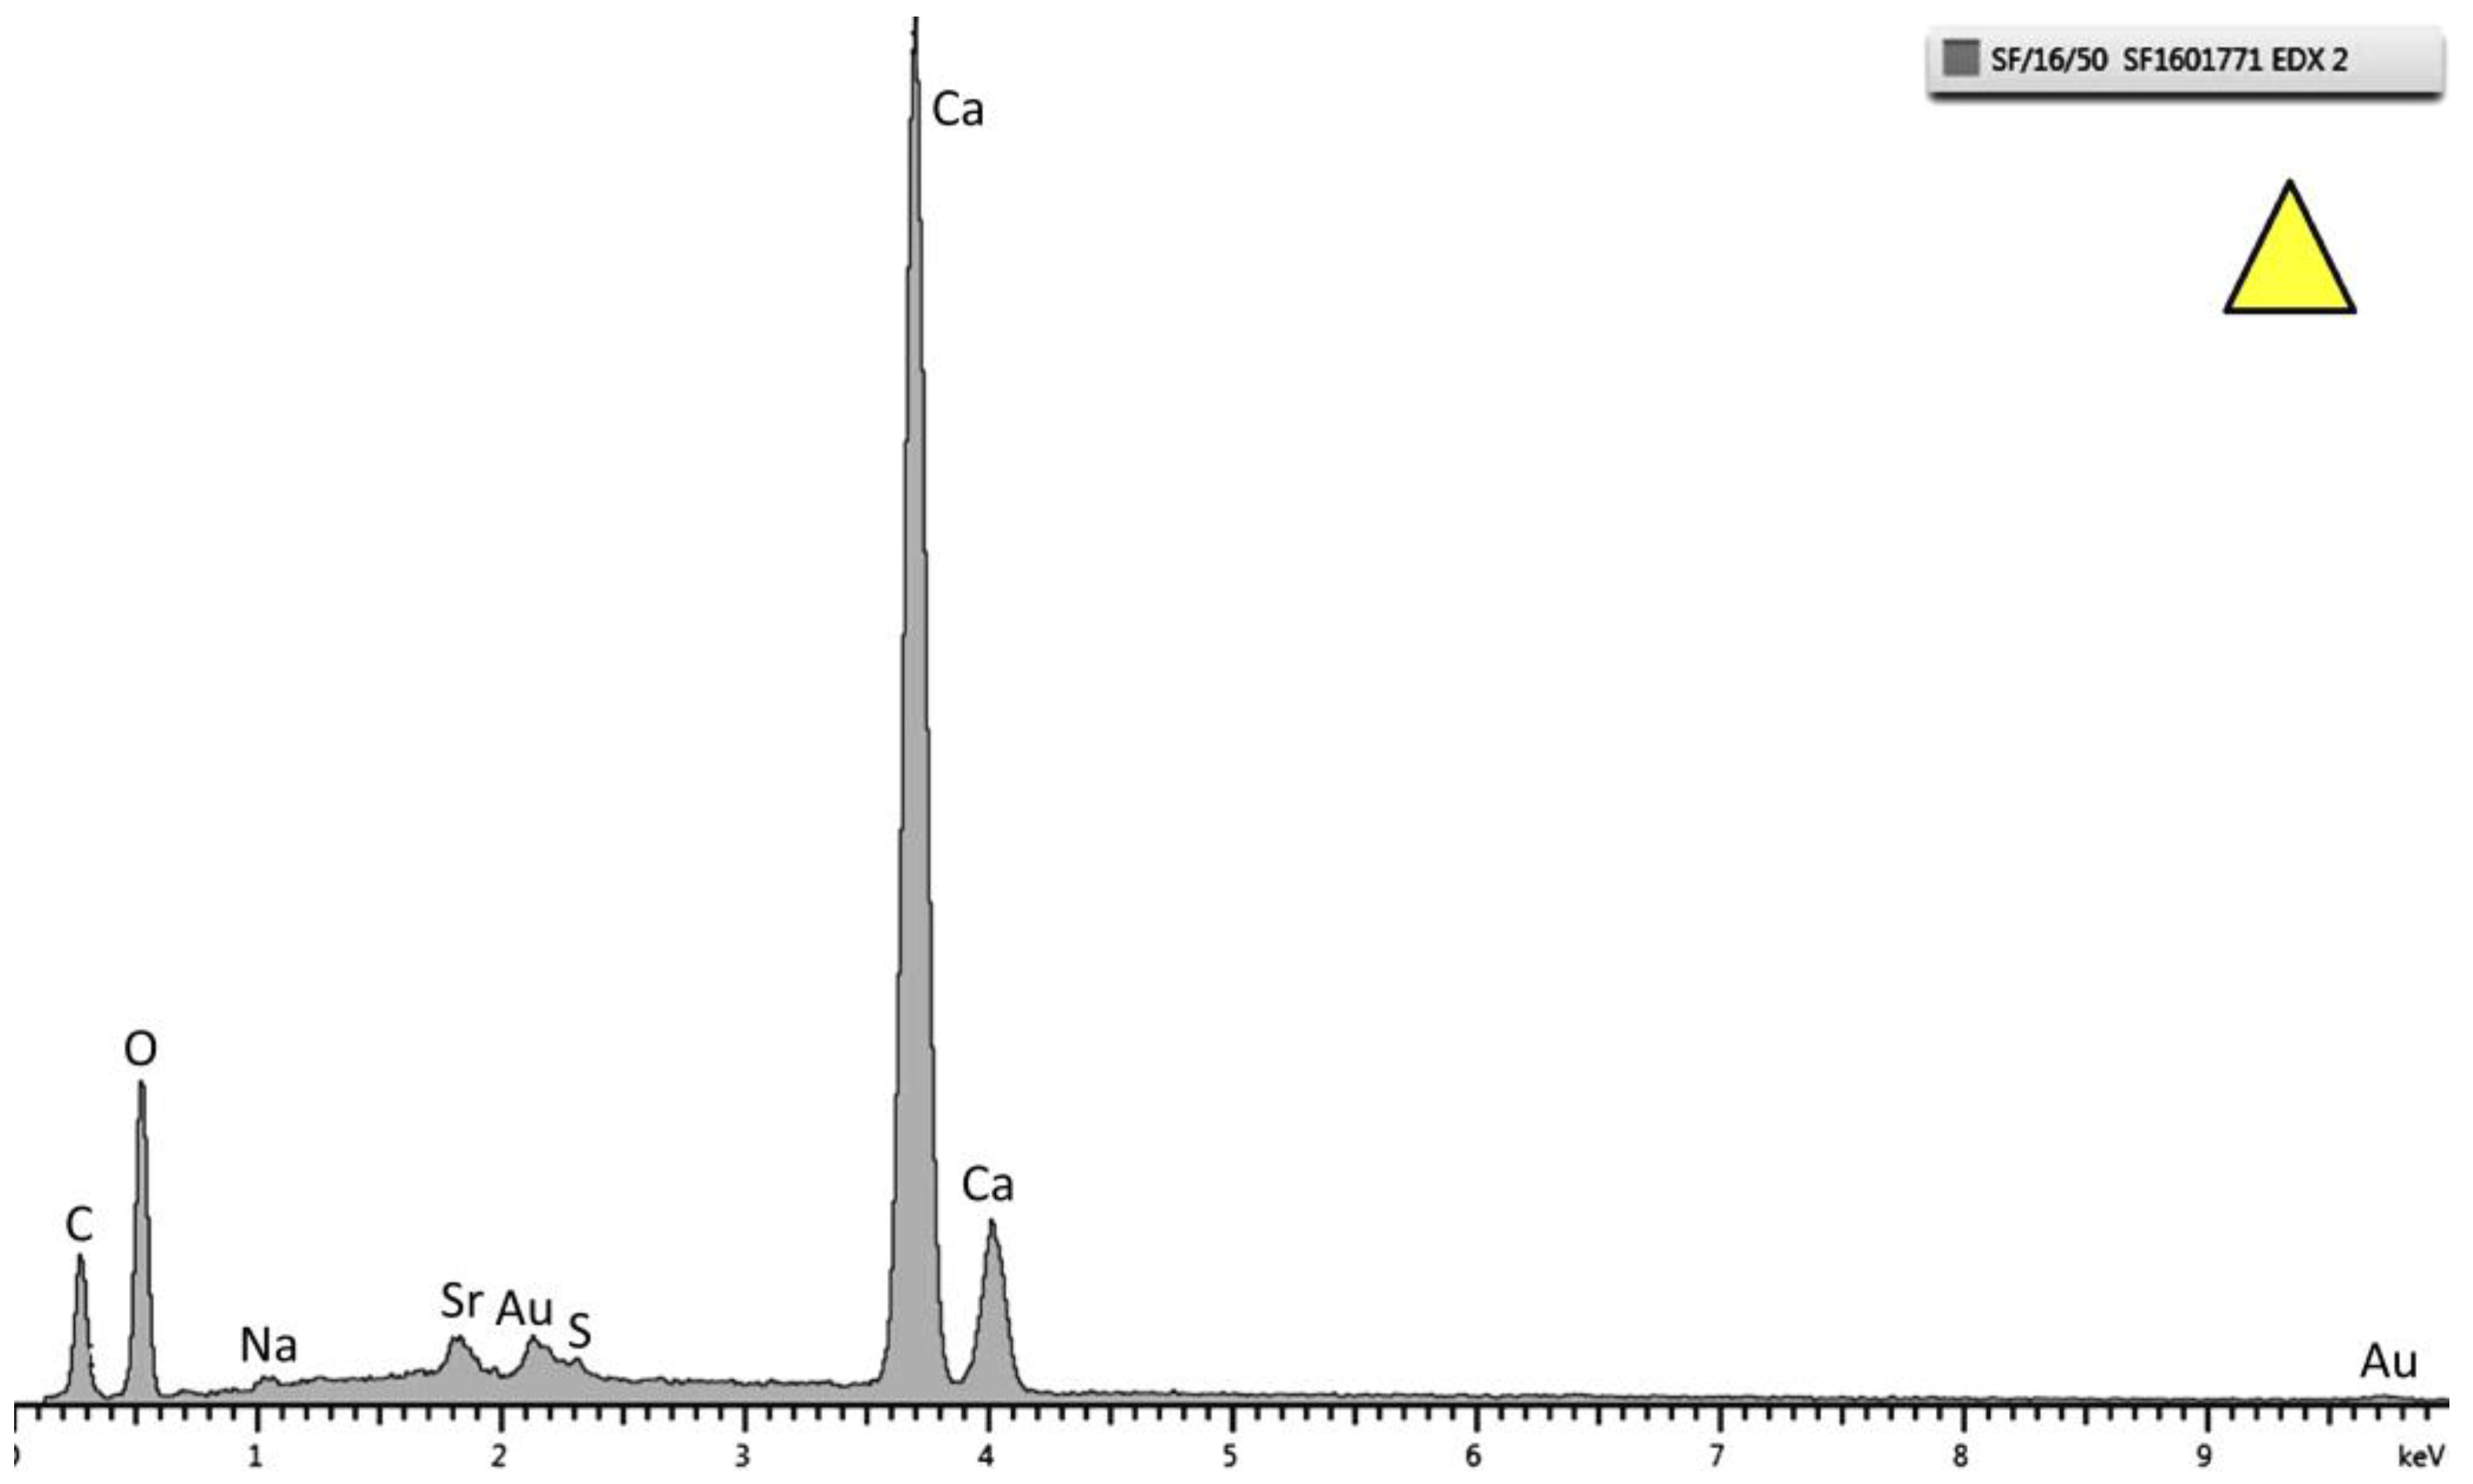
It is important to highlight that the microstructural analysis was performed in a region away from the pH probe where the growth of the deposit was not affected by the presence of the probe. The constituents were identified by EDX analysis from both temperatures, where the main peaks of Ca, C, and O (
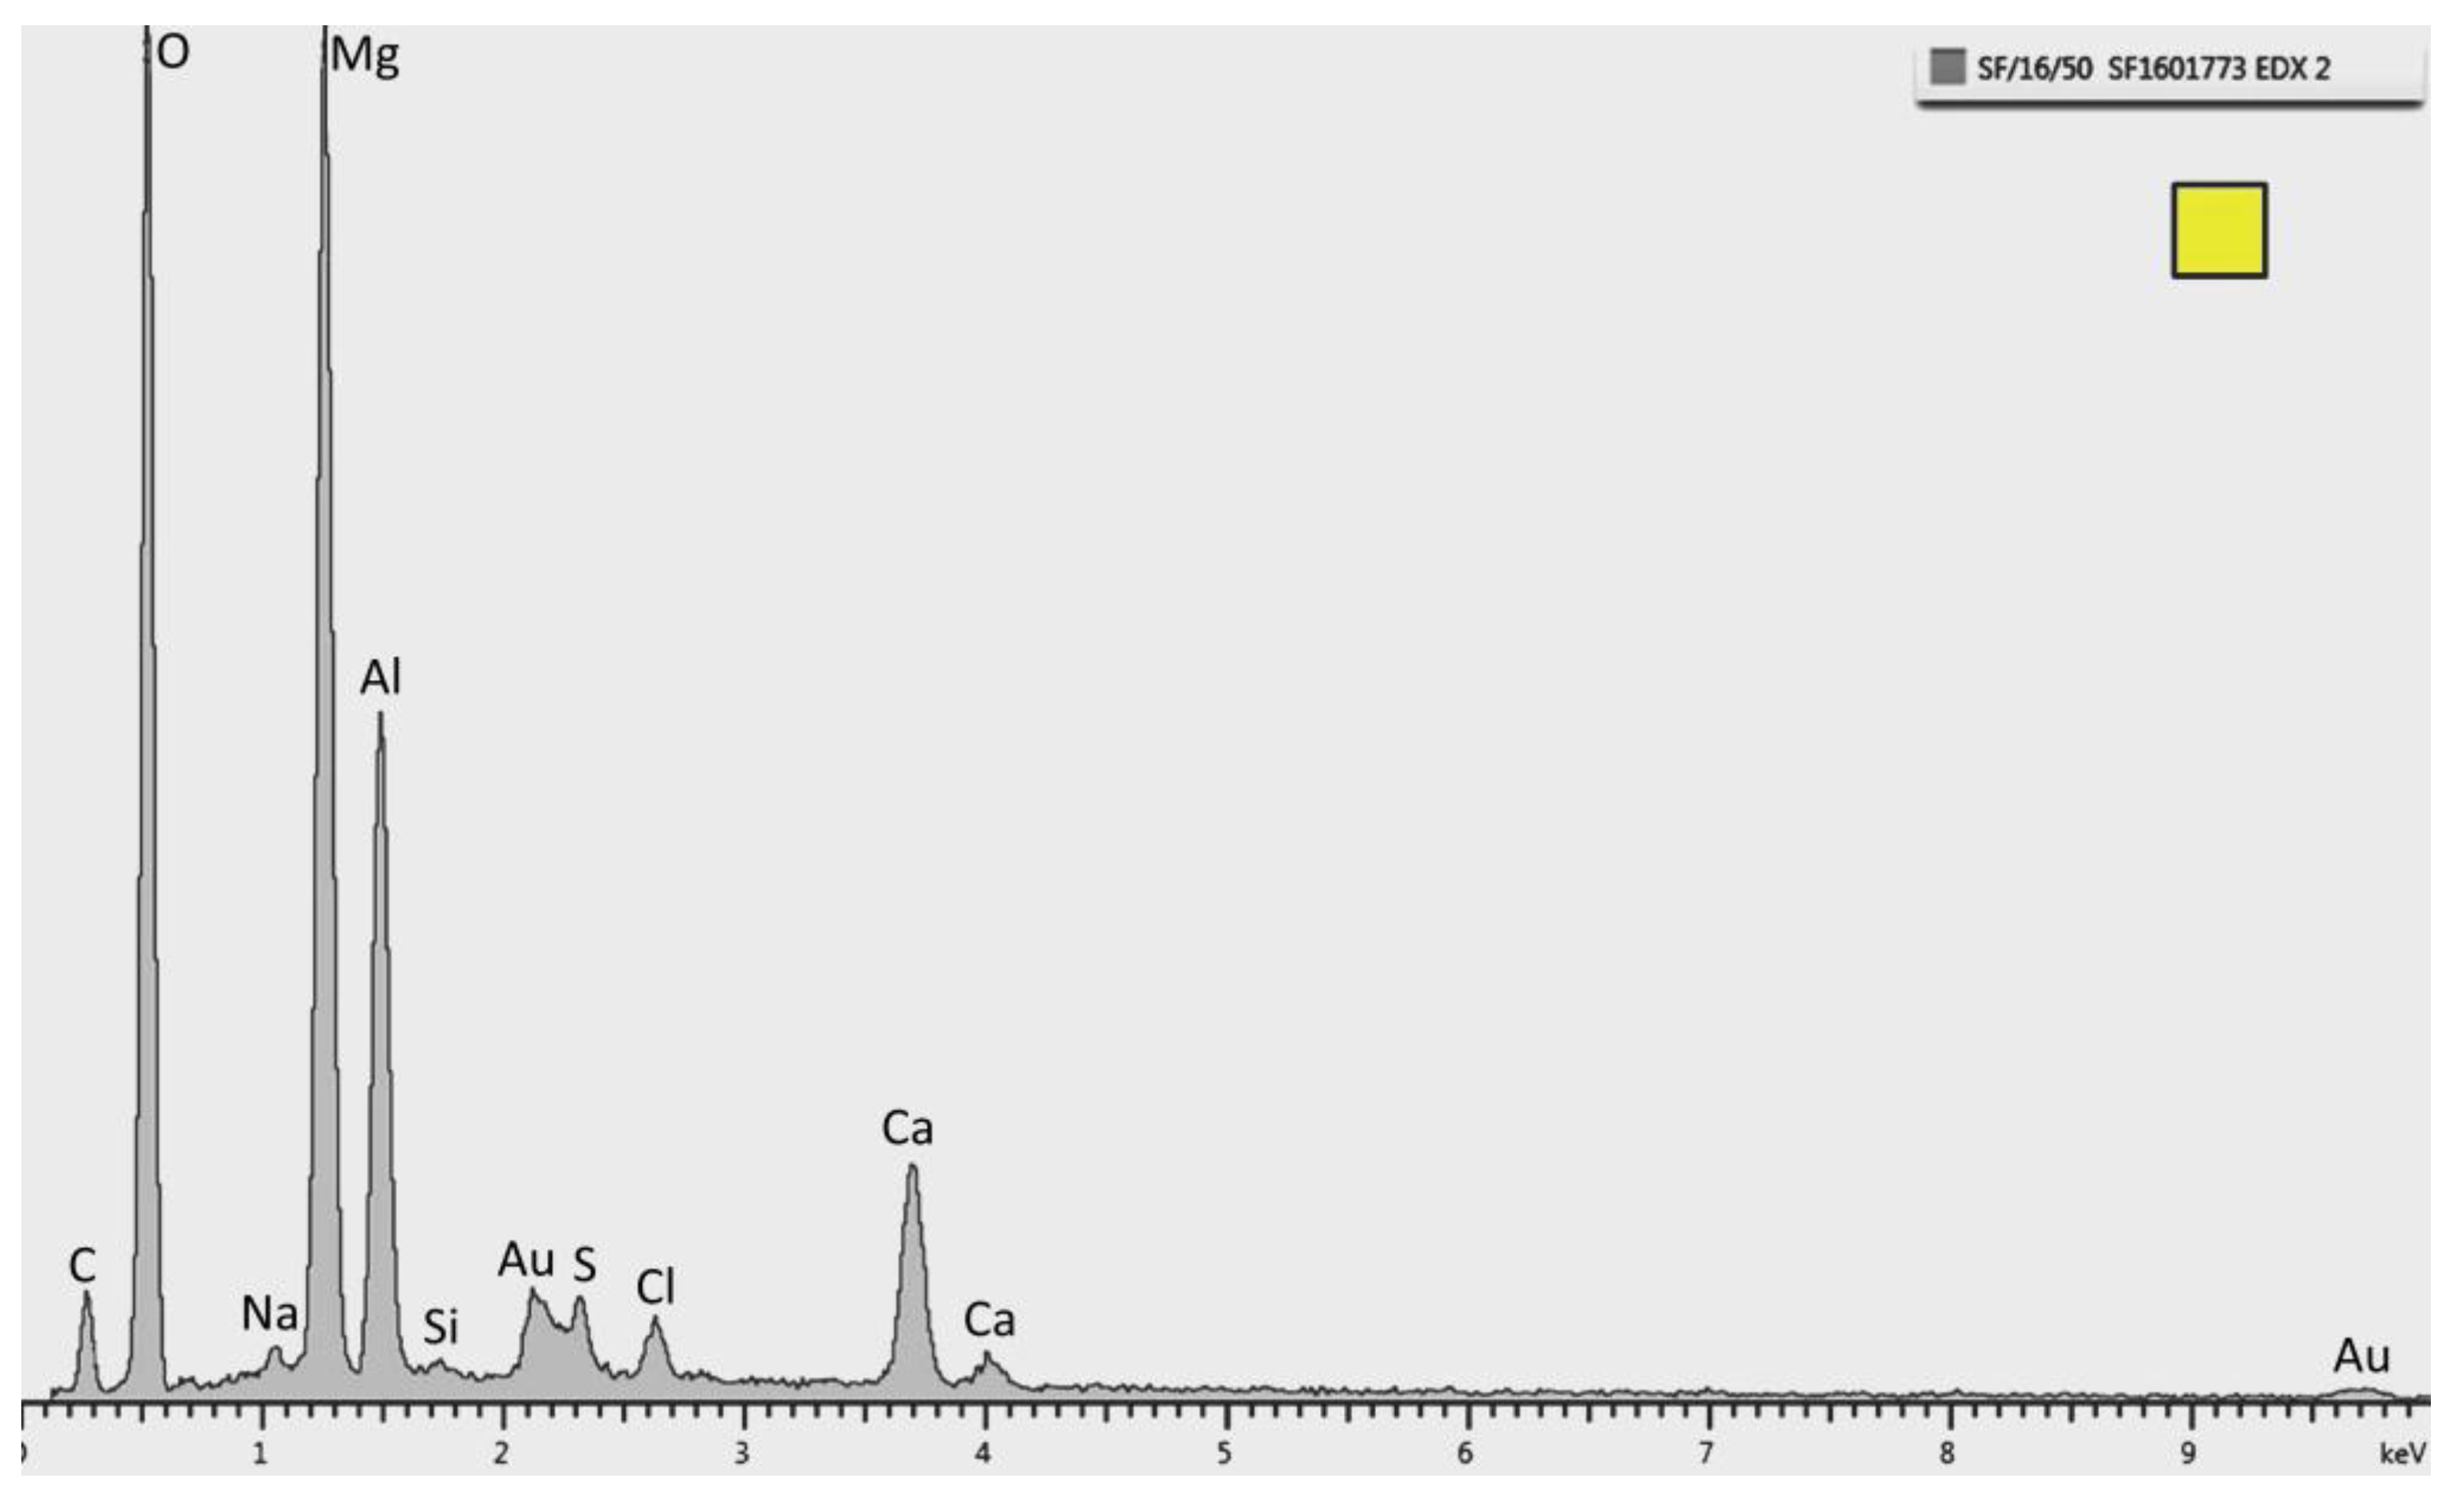
Figure 6) and Mg and O (
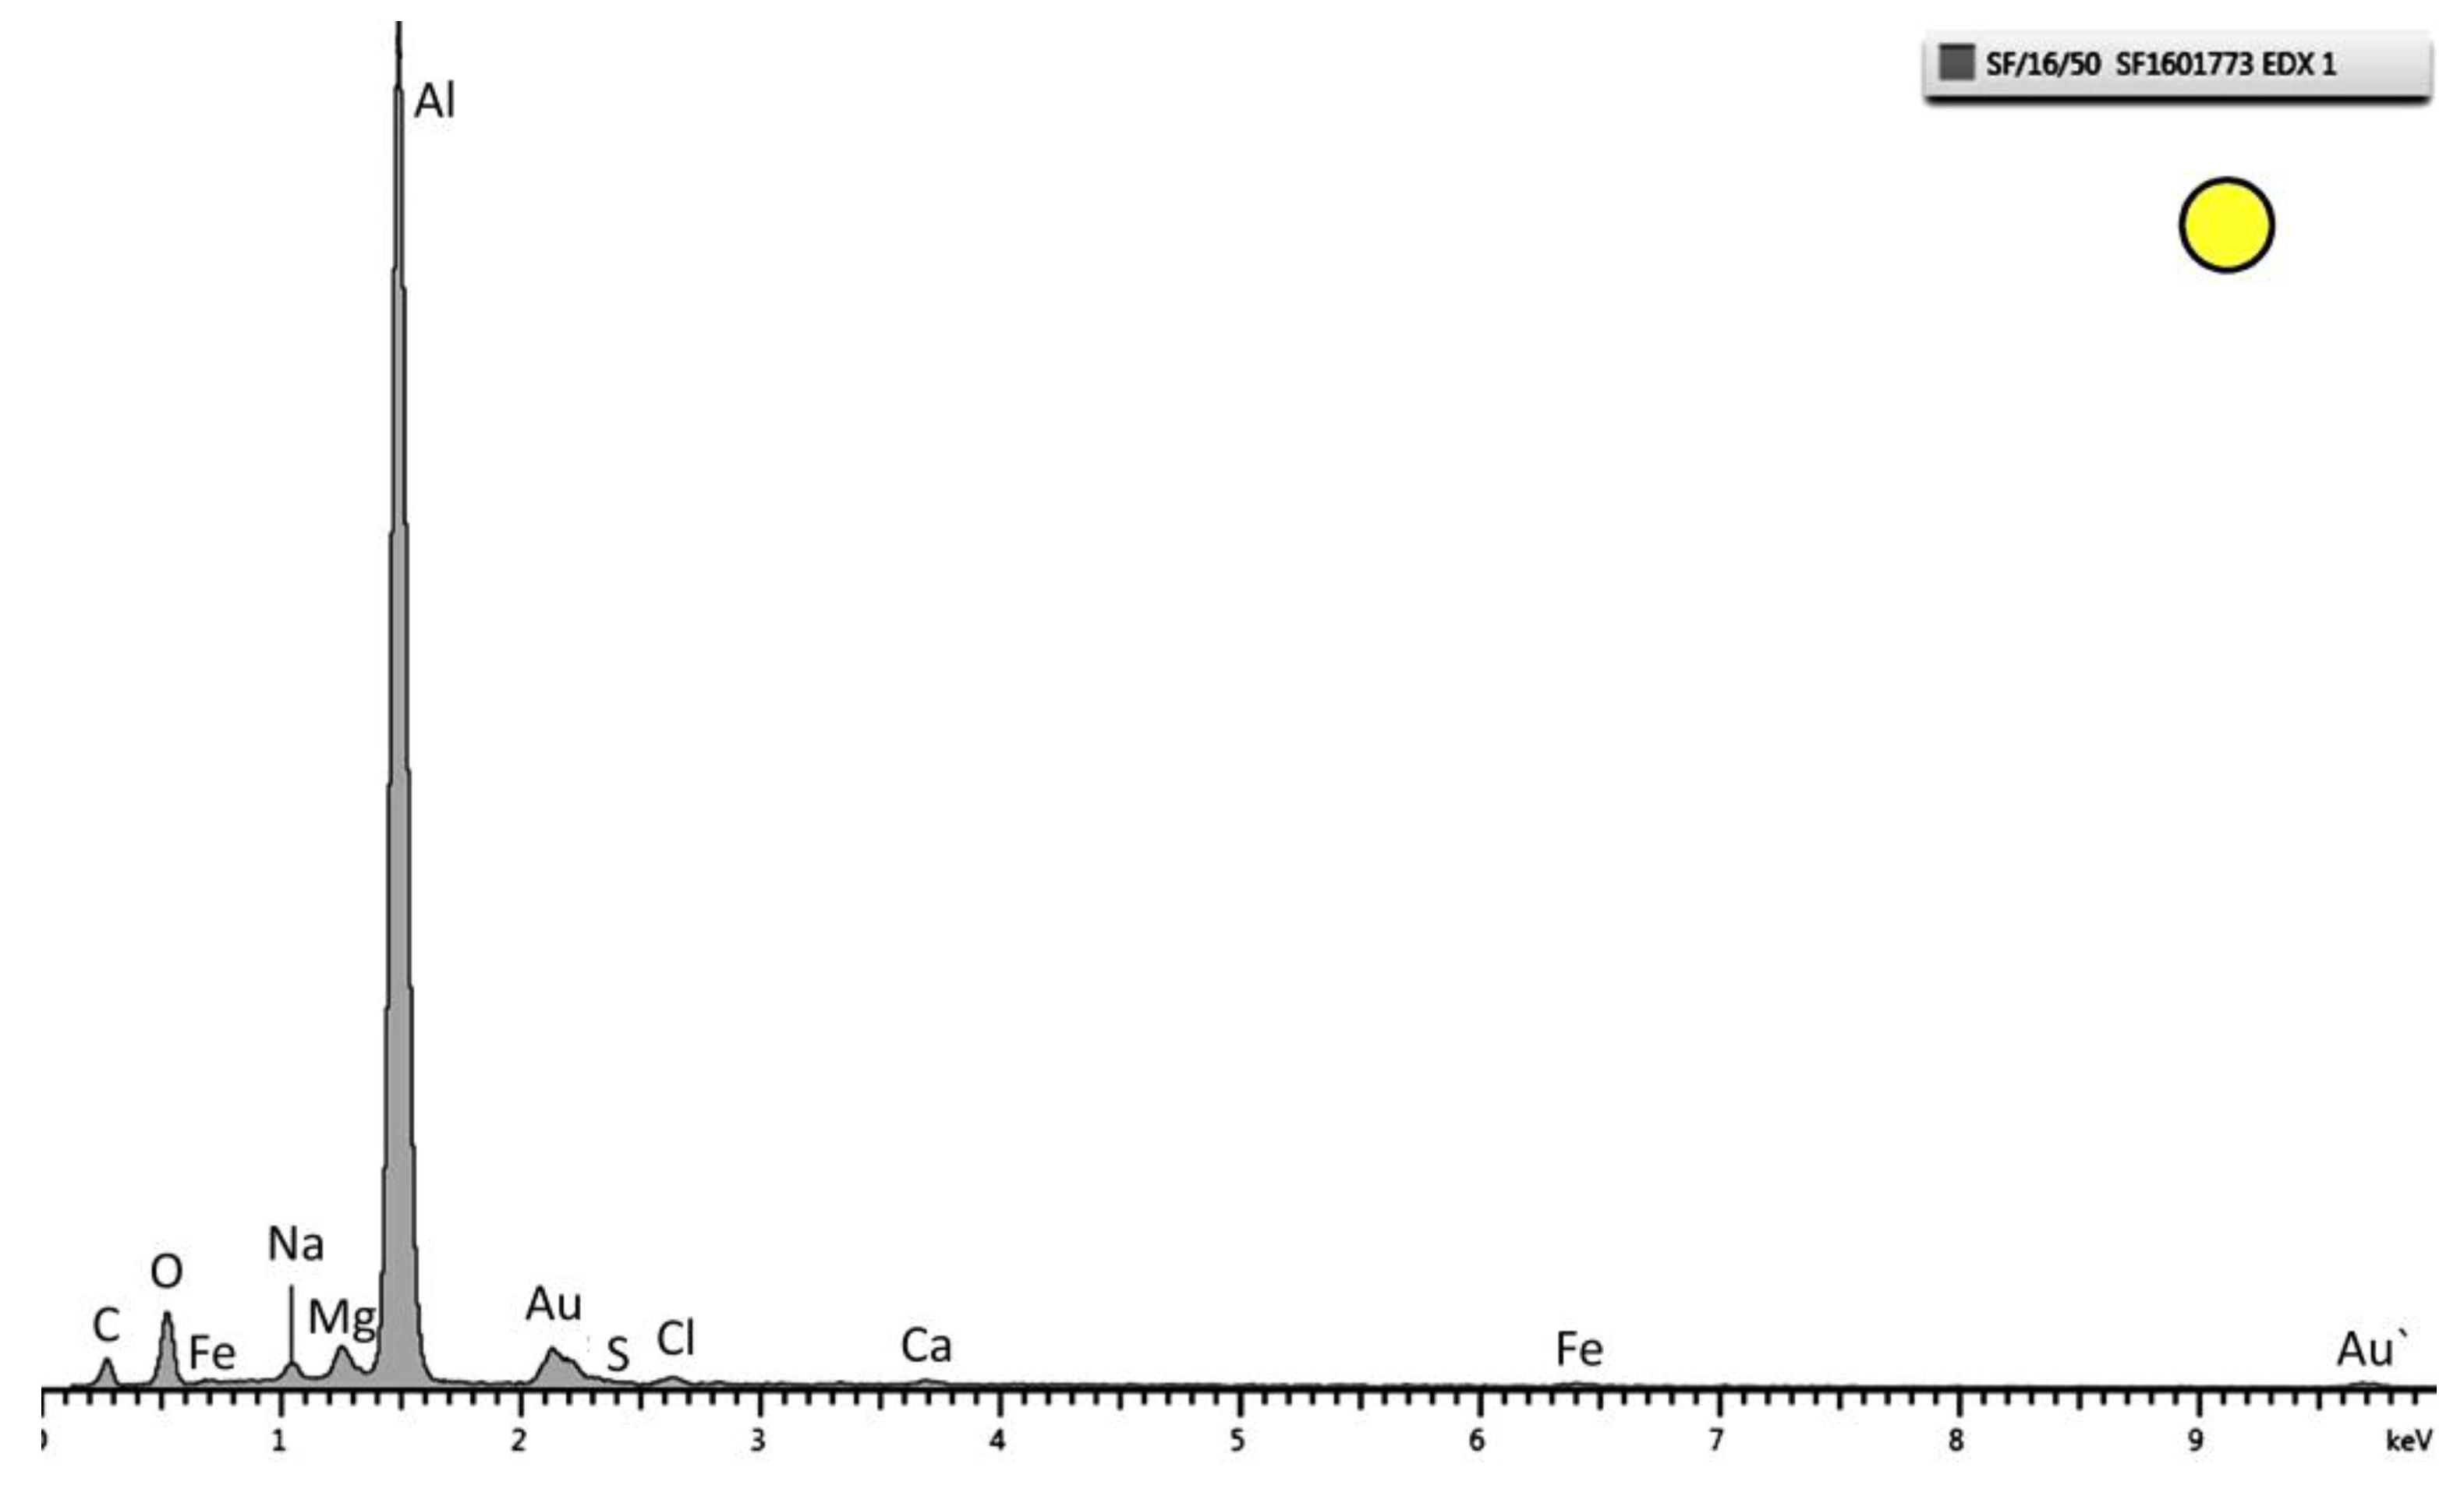
Figure 7) appeared. Al and O peaks were also observed on TSA (
Figure 8).
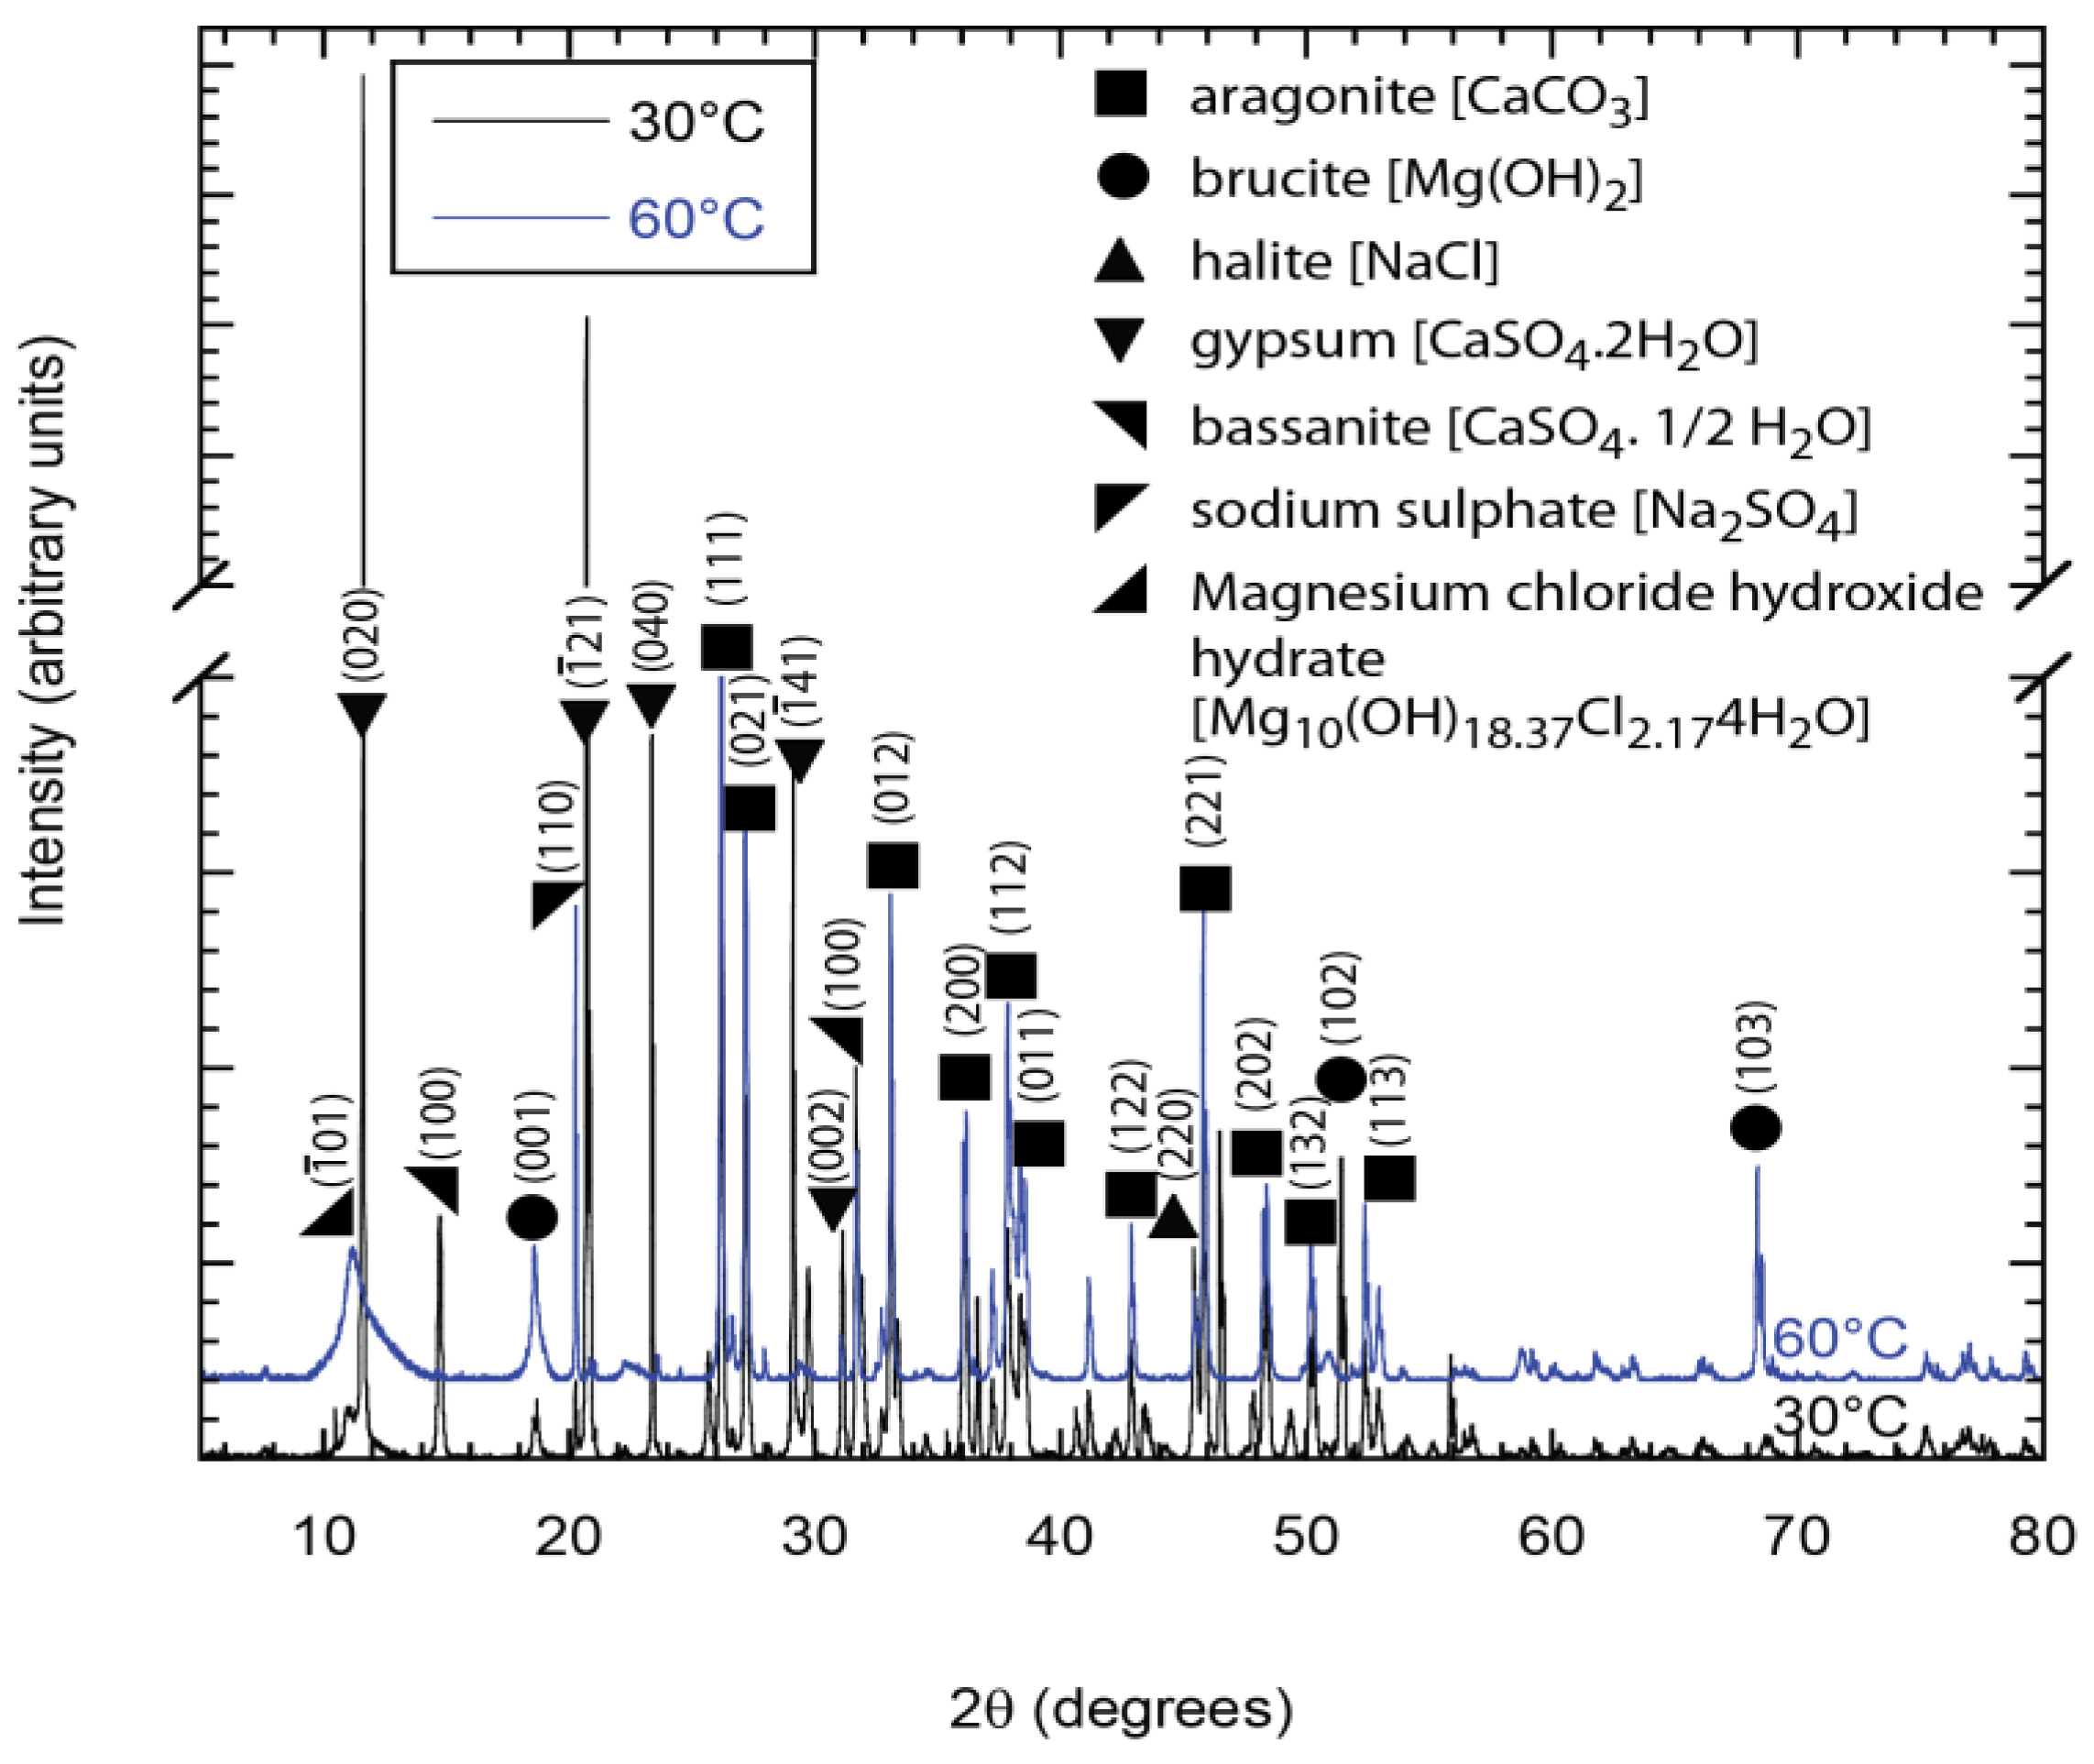
The XRD analyses confirmed the presence of CaCO
3 and Mg(OH)
2 (
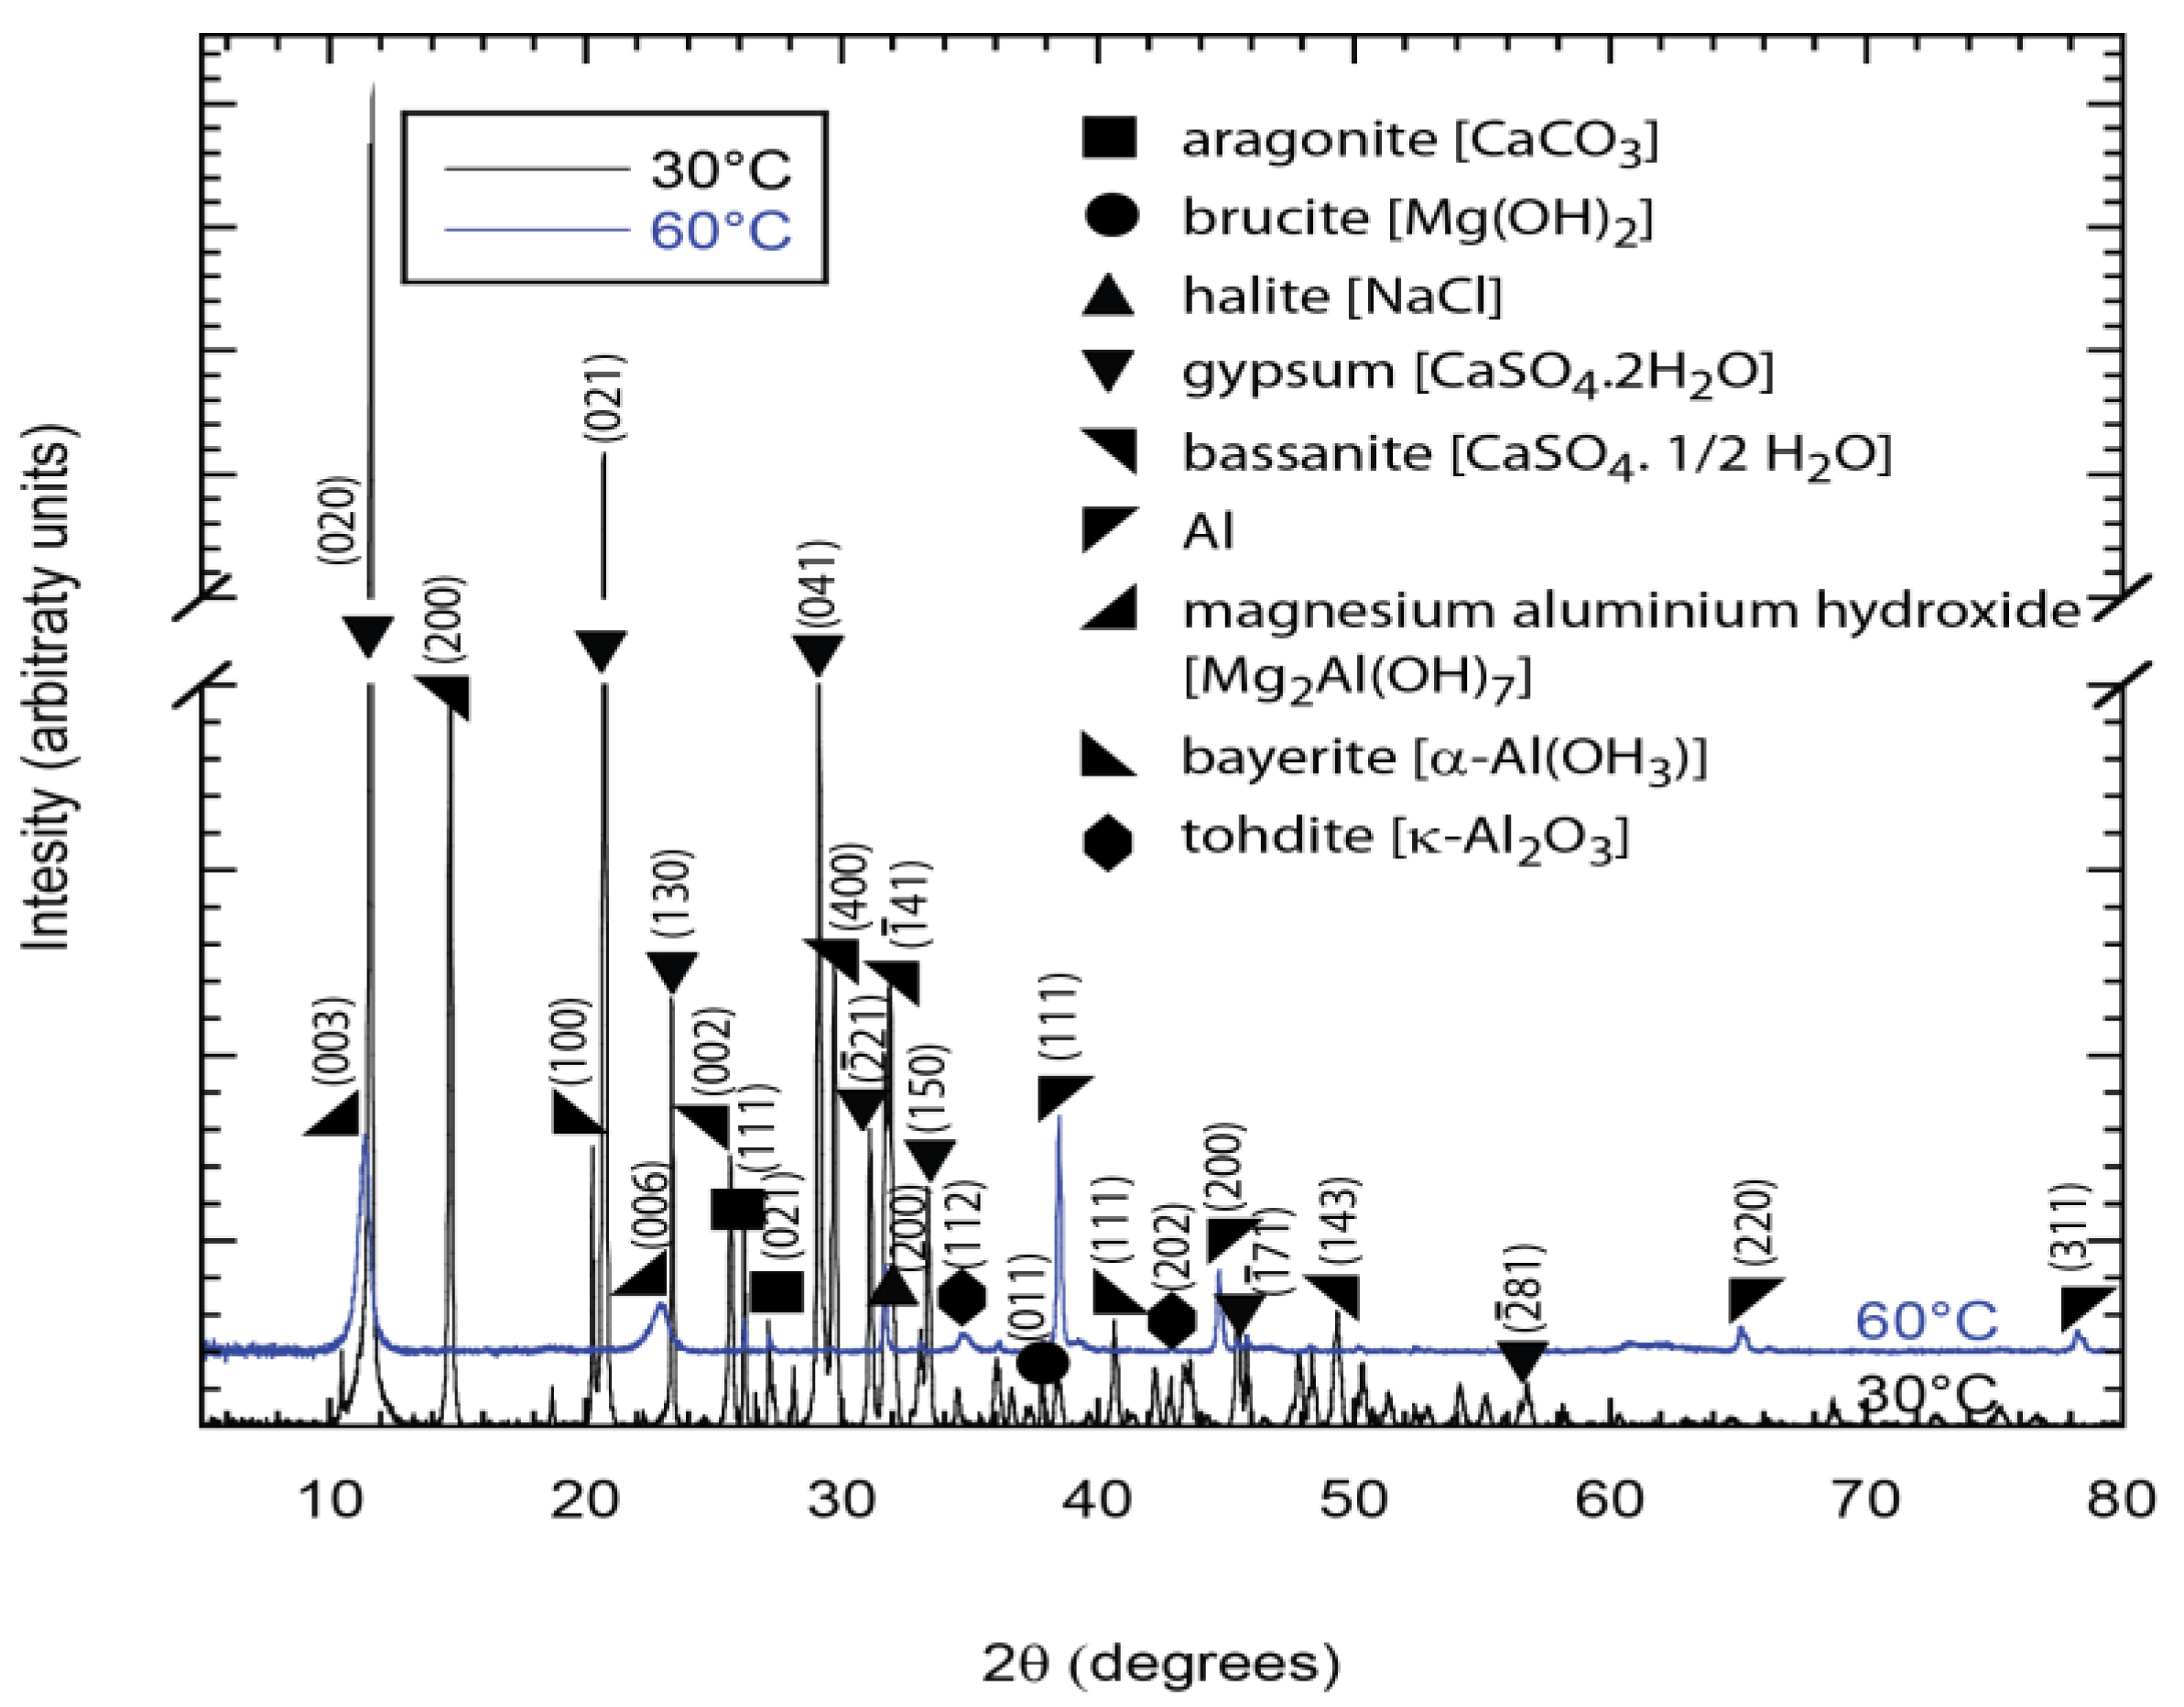
Figure 9) and Al(OH)
3 plus K-Al
2O
3 (
Figure 10). Some constituents of synthetic seawater appeared in the XRD pattern, but were not always detected in the EDX spectra because the latter was performed in localized regions of the specimens while the XRD window is a bit wider with information collected from a greater volume of the deposit. The XRD results also show the presence of other compounds (like NaCl, CaSO
4, etc.) normally found in synthetic seawater (
Figure 9 and
Figure 10).
The CaSO
4 products found by XRD were in the basanite and gypsum forms. The CaSO
4 has similar solubility values at 30 °C and 60 °C (0.209 and 0.204/100 g water, respectively) [
15]. It has been reported that gypsum does not precipitate in a single step, occurring instead after basanite (CaSO
4·0.5H
2O) nucleation as part of a multi-stage crystallization process. Therefore, it is possible that at 30 °C the basanite nucleation was favorable which facilitated further formation of gypsum. This apparently did not happen at 60 °C [
16]. Different crystal orientations are marked in the XRD pattern and it can be observed that the same chemical compounds appear in different patterns. This phenomenon is named polymorphism, where solids with the same chemical composition can exist in different crystal structures or different phases. This transformation changes with temperature and/or pressure [
17]. Therefore, the presence of different patterns for Mg(OH)
2 and CaCO
3 at different temperatures is not unexpected.
3.3. pH Profiles
3.3.1. Synthetic Seawater at 30 °C and 60 °C
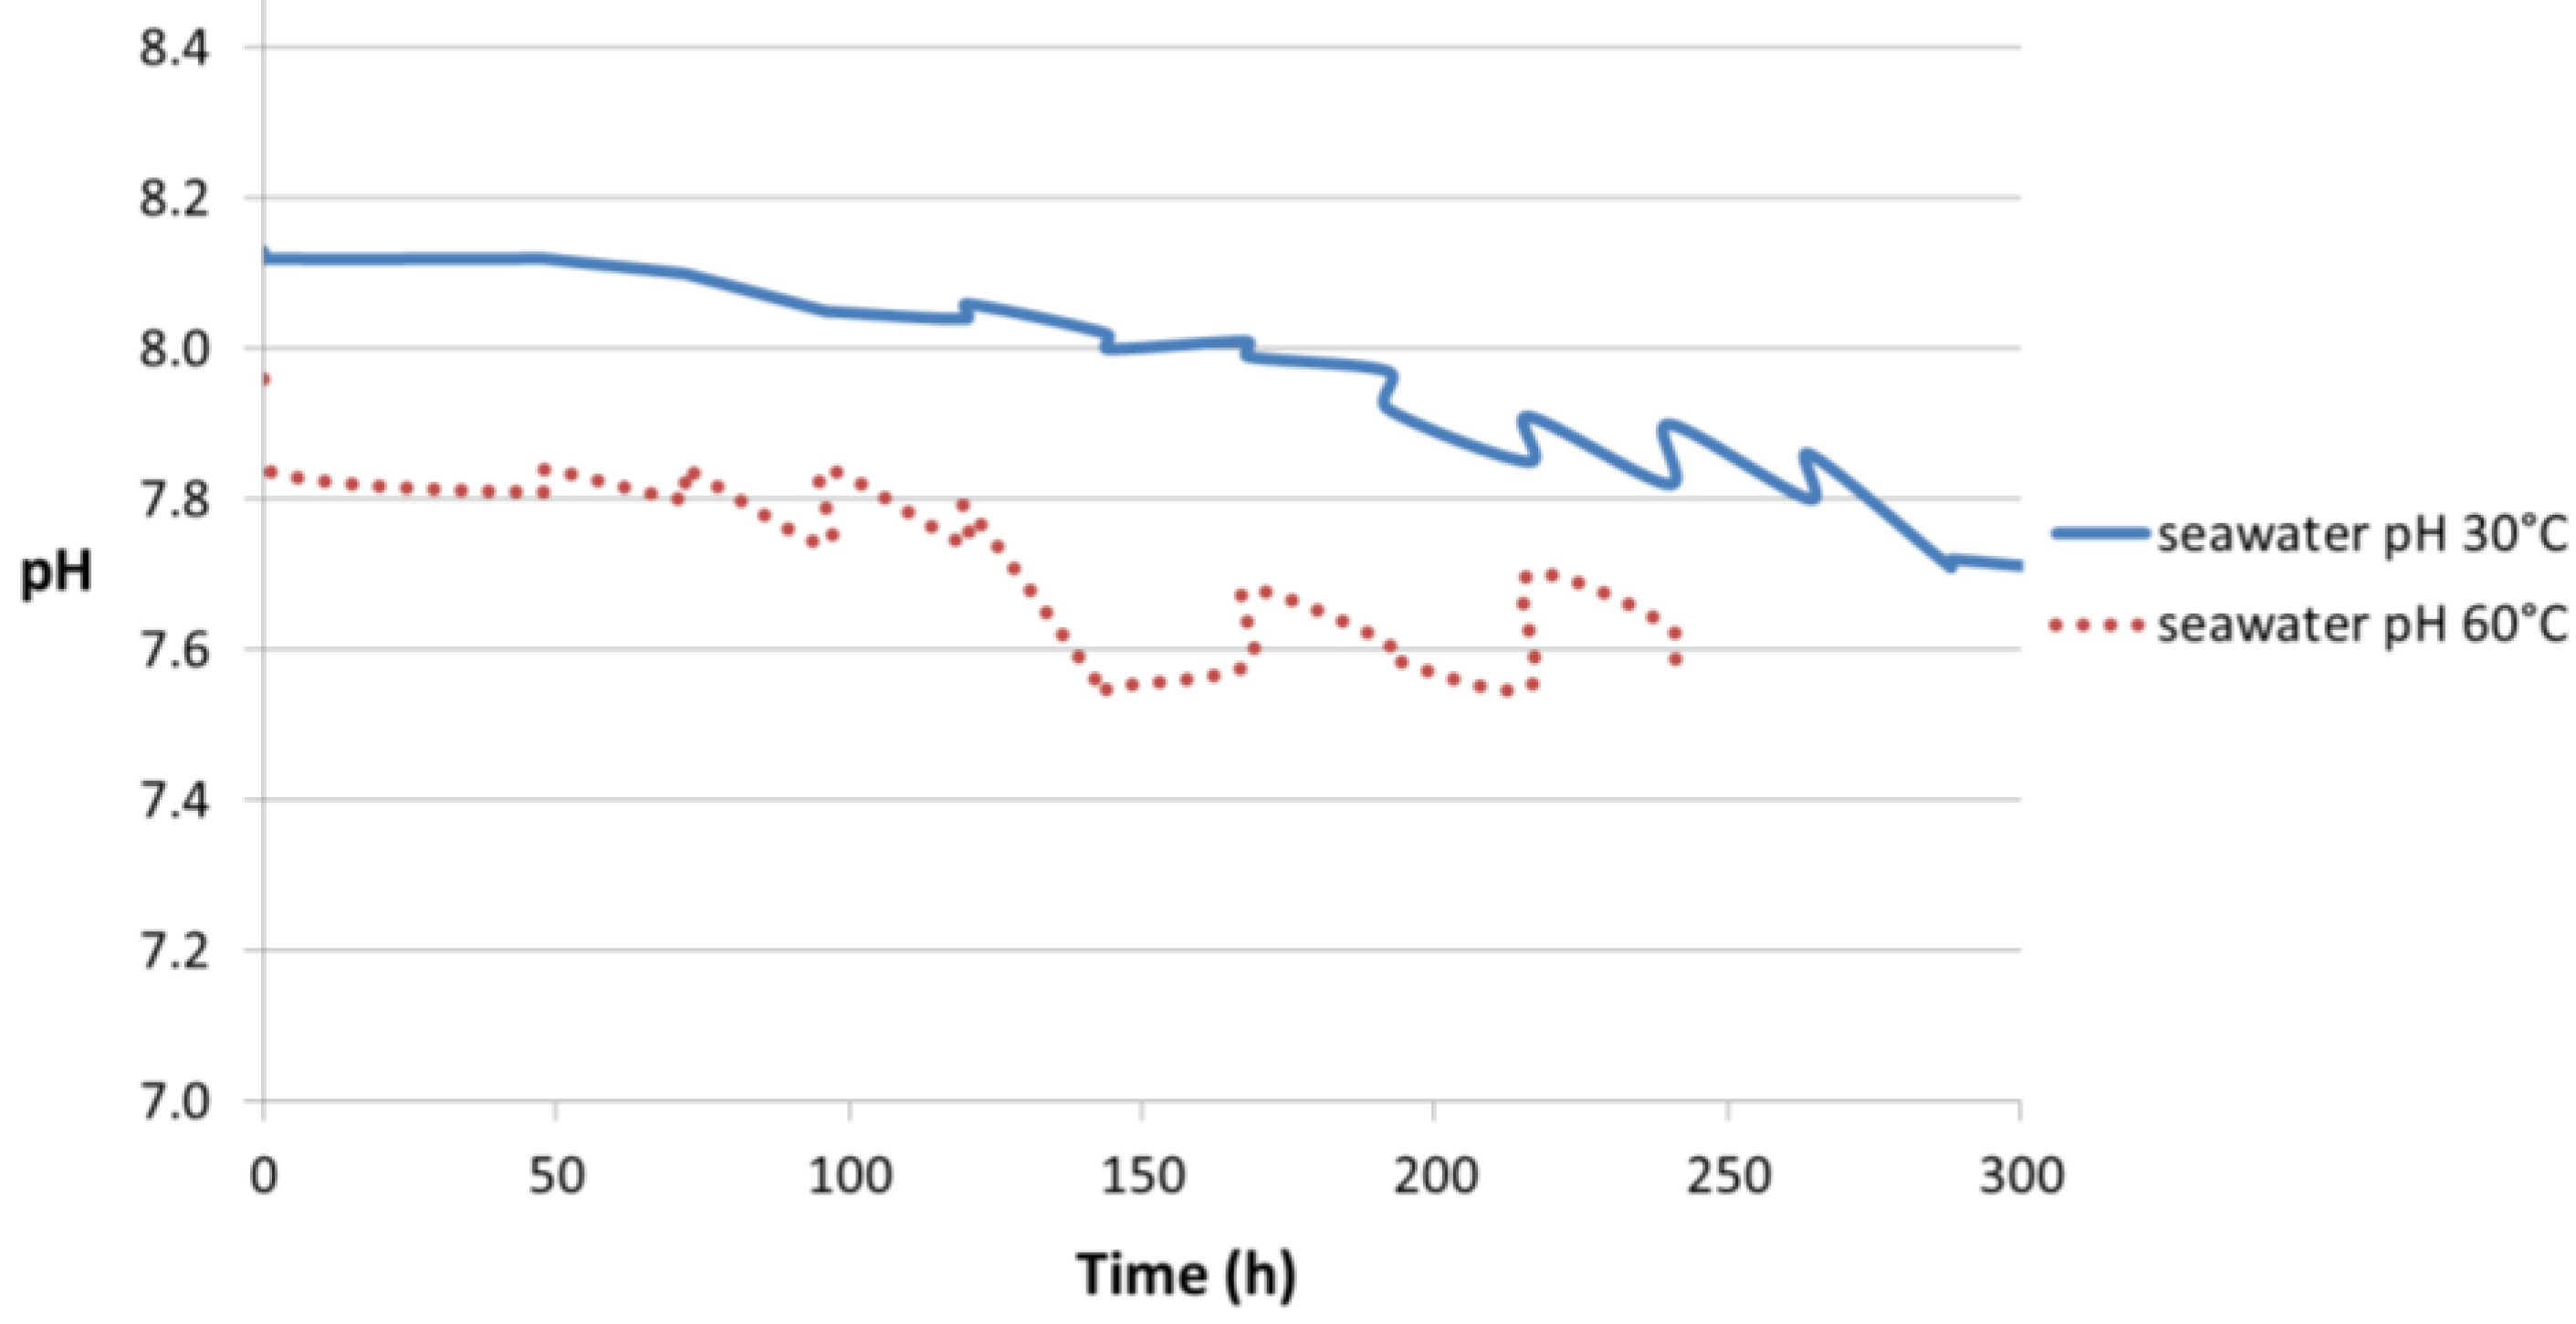
The seawater pH profile as a function of time is shown in
Figure 11. It can be seen that the pH profile of synthetic seawater changed slightly when at 30 °C compared to 60 °C. The measured seawater pH value was 8.17 at 19.5 °C, prior to starting the test at 30 °C and 60 °C. At 30 °C, the seawater pH was 8.13 at the start which decreased to 7.70 after approximately 300 h. At 60 °C, the pH was 7.96 at the start and dropped to 7.6 after 240 h. Both cases presented a point in time when the decrease in pH occurred rapidly. This happened after 190 h and 120 h at 30 °C and 60 °C, respectively.
3.3.2. TSA-Coated Steel Specimen
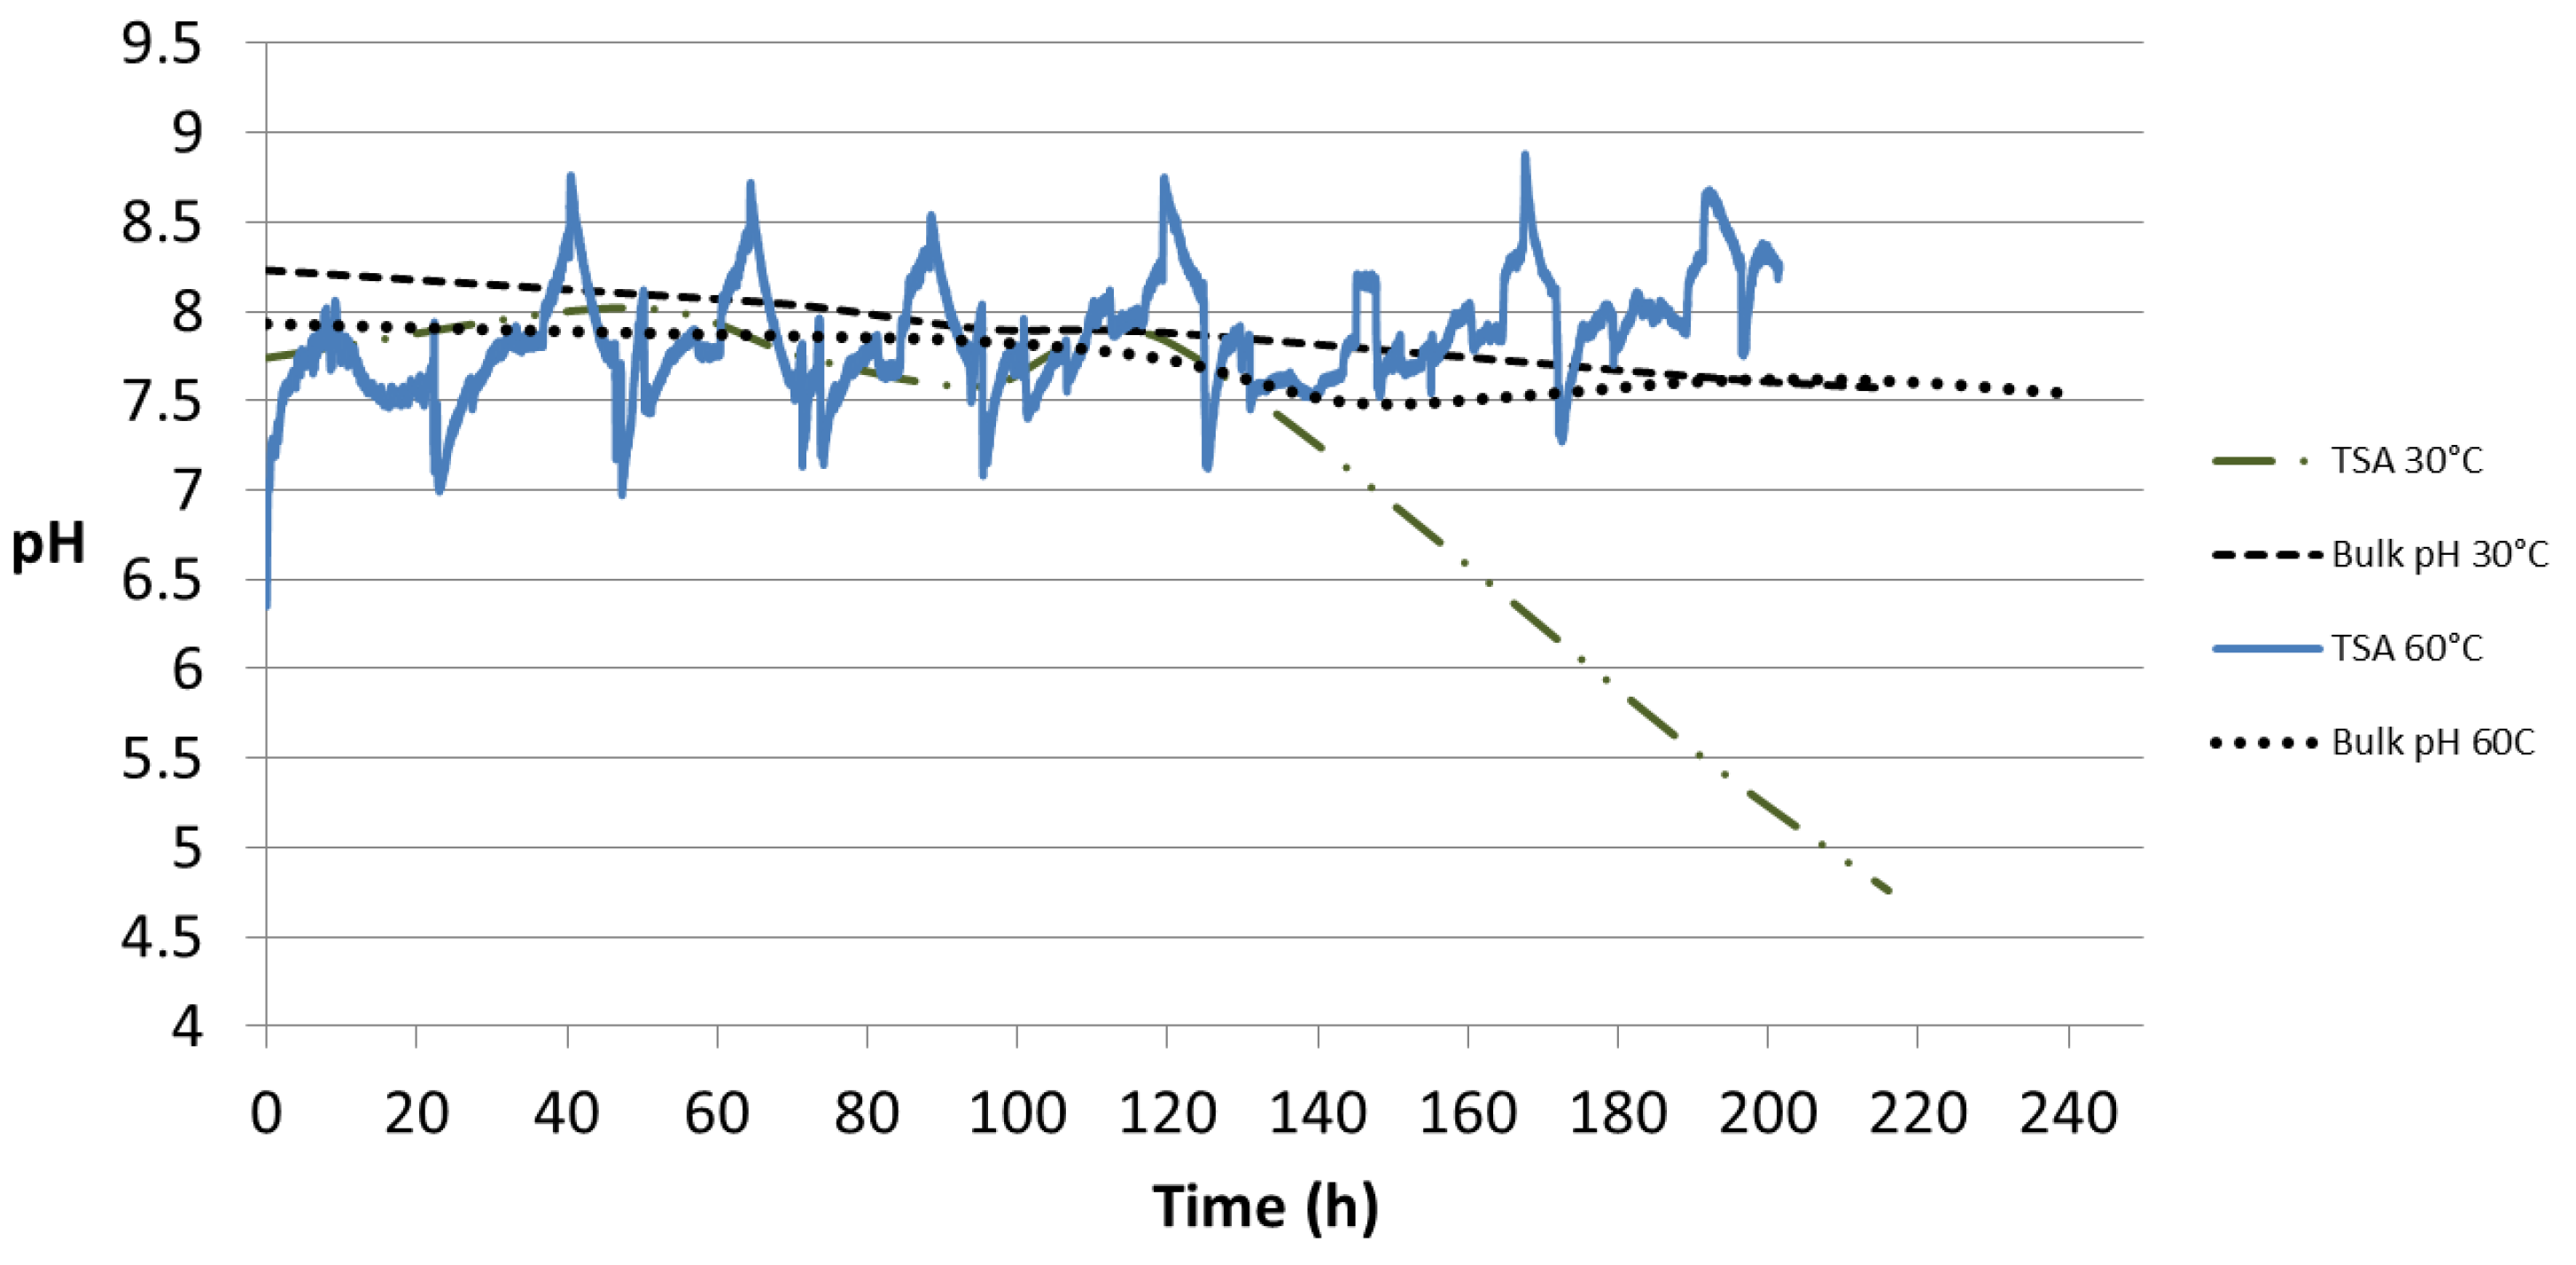
The pH profile from the TSA coating is shown in
Figure 12. At 30 °C it shows an initial pH of 7.74 which started decreasing after 120 h and reached a value of 4.76 after 220 h. The bulk pH for the same test dropped from 8.23 to 7.57 during the same period. At 60 °C, an initial pH of 6.41 was recorded which later was found to fluctuate between 7.0 and 8.5 after 200 h of test. The pH of bulk seawater changed from 7.93 to 7.54 in 240 h.
3.3.3. TSA-Coated Steel Specimen with Holidays
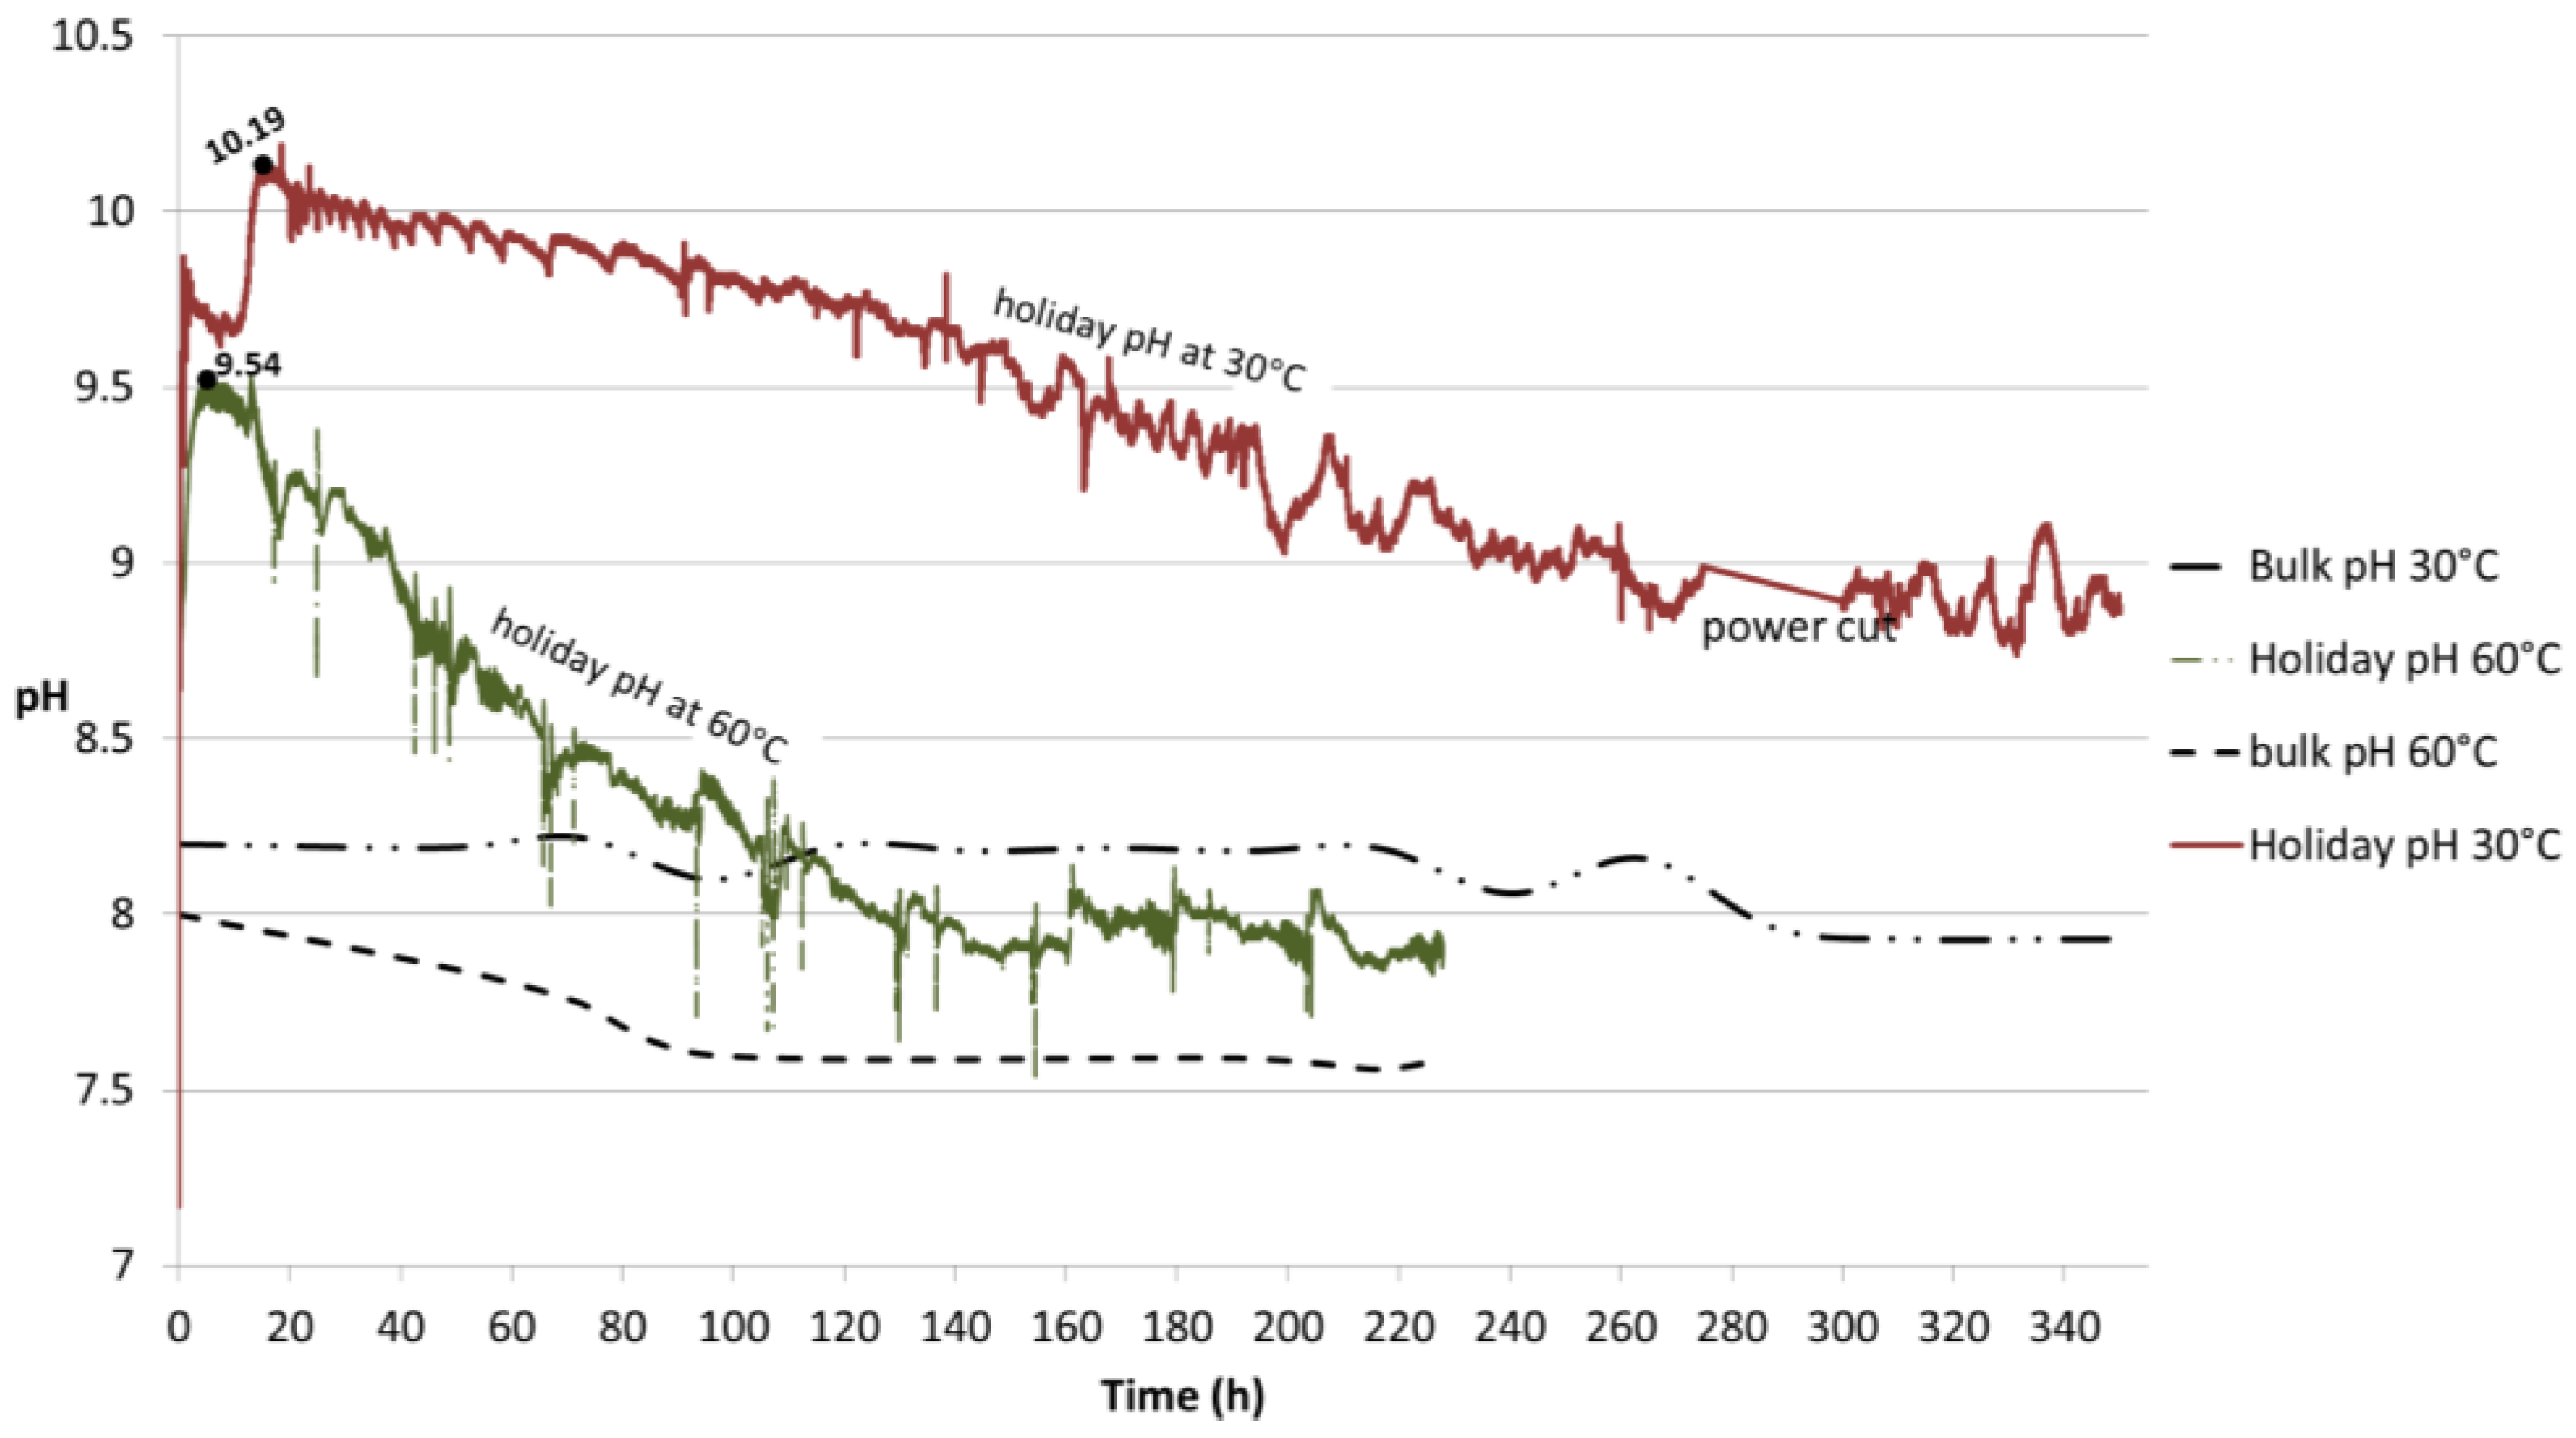
Samples with holiday showed a clear difference in the pH profile at the two temperatures tested, namely 30 °C and 60 °C (
Figure 13). The local pH at 30 °C was monitored for 350 h and the initial pH of 7.2 increased to 9.87 followed by a slight decrease to around 9.6 before reaching a maximum of 10.19 in approximately 20 h, after which a smooth slope occurred until stabilization was achieved at pH 8.8. The sample exposed to 60 °C presented an initial pH of 7.51 and reached a peak in value of 9.54 in 4 h, followed by a sharper decrease until stabilization at pH 7.9 after 220 h of exposure. The low peaks observed at this temperature seem to be associated with the addition of deionized water to replenish the evaporation loss. At both temperatures, stabilization in local pH is preceded by a drop and subsequent stabilization of the bulk pH.
The method used to measure pH may raise some concerns regarding the effect of obstruction to oxygen diffusion by the pH probe to the steel surface and thus giving incorrect pH data. However, prior to the test at 30 °C, which was the first to be run, the approximate values expected from previous studies had already been achieved. Although data at 30 °C was not available in the literature, the 25 °C literature data was not expected to be too different. The values in our 30 °C experiment were similar to reported room temperature data, already described in this paper. The comparison between modelling results (with no contact of the probe with the sample surface) from the literature and our experimental data were comparable. Although the past studies employed applied potentials, our experiments at open circuit potential with TSA coating polarizes the steel without an external potential being applied. Thus, no discrepancy in the results of the experiment at 30 °C was expected when compared to past studies at 25 °C. The local morphology of the calcareous deposit was possibly altered directly at the pH probe location, but not in its surroundings. Moreover, it should be highlighted that although a very careful pH probe calibration was performed prior to each test, the results are expected to be approximate values.
Bearing the above in mind it was possible to register some events. Firstly, at 30 °C (
Figure 2b,c) some Fe-containing corrosion products (rust-like appearance) may have formed on the edges of the exposed steel area, which means that initial steel corrosion might have taken place. The picture was taken after 18 h of testing. Similar observations were also reported by Yang et al. [
18] who indicated that on a cathodically polarized steel surface, the compound that is initially precipitated next to the iron-containing corrosion products is possibly brucite. The presence of brucite in the vicinity of iron hydroxides was explained by the co-precipitation of brucite during the formation of corrosion products when steel corrodes. The possibility of co-precipitation is based on the work by Packter and Derby [
19] who established and examined the mechanisms of co-precipitation of magnesium and iron hydroxides from aqueous solution using potentiometric titration.
The initial corrosion of steel did not seem to proceed further as the Fe-containing corrosion product layer was limited to the initial area seen after 18 h. This did not extend any further even after 82 h. However, after 82 h a thin white deposit covering the steel surface was noted. This seems to have prevented the steel from corroding further. It is important to highlight that the time when the pictures were acquired does not necessarily represent the start of the event, but the time at which it was observed.
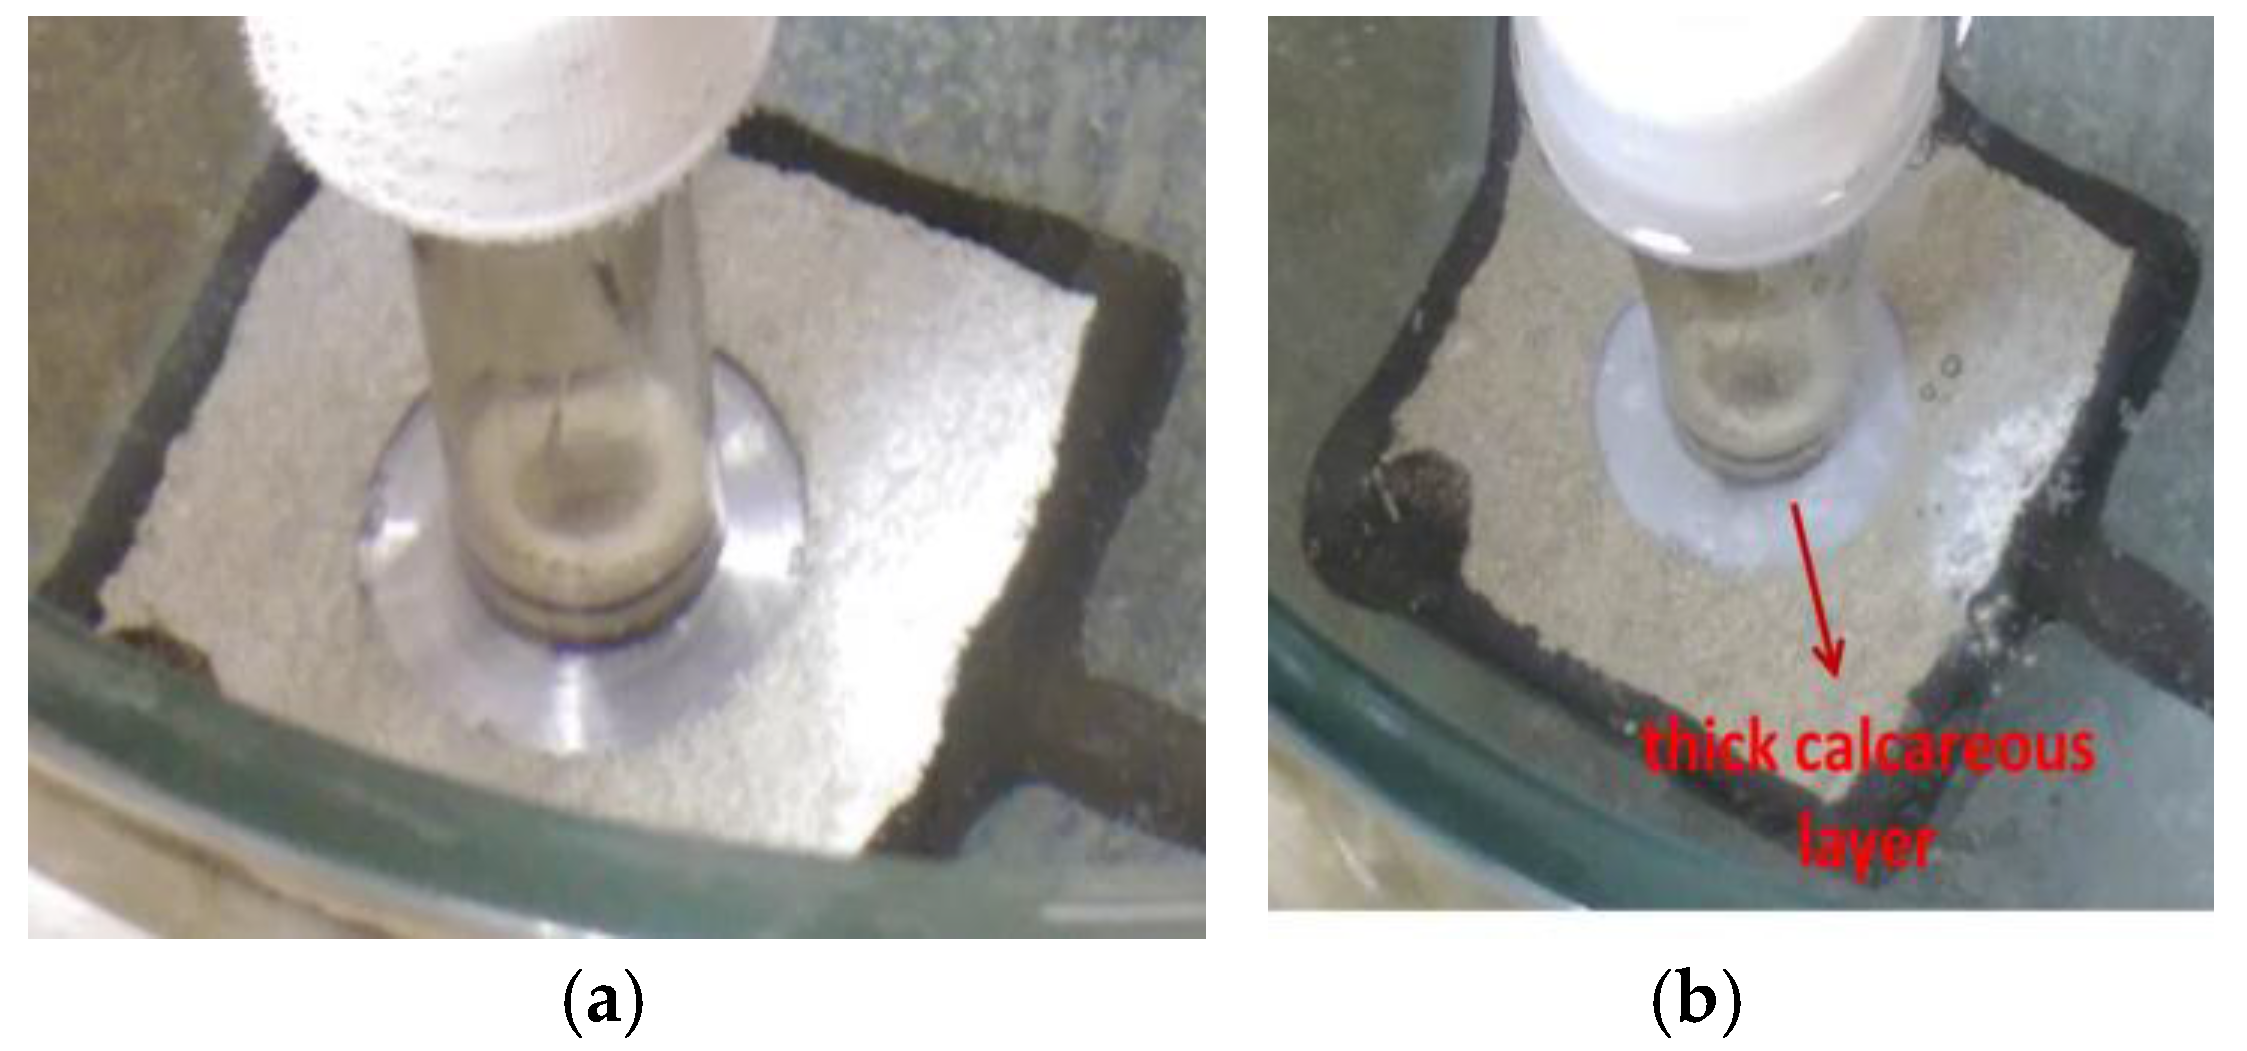
At 60 °C, a thick layer covering the whole holiday was observed after 17 h of exposure (
Figure 3b). A much faster kinetic response is expected at elevated temperature (60 °C) as compared to 30 °C. This will be further discussed in
Section 4.3.2.
4. Discussion
4.1. Bulk Seawater pH Profile
Figure 11 shows the pH of synthetic seawater decreasing with time. This can be explained by the change in solution chemistry in air. The properties of seawater are dependent on temperature and solution chemistry. The latter is often defined by the concentration of dissolved gases and salts [
16]. The salinity of seawater is generally 3.5 wt % and the pH varies between 7.8 and 8.3 at room temperature. The pH is mainly controlled by the reactions involving the dissolution of CO
2 from air and the presence of un-dissociated boric acid (H
3BO
3) due to the buffering capacity of these compounds [
4,
20,
21]. Also, the seawater evaporation leads to a saturation/supersaturation of some salts and their subsequent precipitation. The removal of some salts from solution also leads to changes in the pH. The first salt to be precipitated is CaCO
3, but only a small amount as predicted by the relatively low concentration (0.014% by weight) of bicarbonate and carbonate ions in seawater. When the volume of seawater is reduced to 19% of its original volume, calcium sulfate is precipitated either as an anhydrite (CaSO
4) or as gypsum (CaSO
4·2H
2O). Sodium chloride in the form of halite (NaCl) is formed in higher amount when the volume is reduced to 9.5% of the original one. The final volume (4%) may contain the highly soluble chlorides of potassium and magnesium [
22]. The pH will show a variation as the compounds “salt out” of seawater.
The pH difference in the beginning of the test observed in
Figure 11 (8.13 at 30 °C and 7.96 at 60 °C) can be explained by the change in the ionic product of water (
Kw) which increases with temperature (values are given in
Section 4.3.3). This means that self-dissociation of water is increasing and a greater number of H
+ ions (or more accurately, H
3O
+) are present in solution at 60 °C. It must be noted that the electrical neutrality of water is not altered as equal number of OH
− ions are also present.
However, for the current study, the presence of CO
2 is also significant in determining the pH. The CO
2 present in air (400 ppmv) will dissolve in the surface water depending on the temperature and the presence of other dissolved ions, following Henry’s law. The dissolution of CO
2 in water can be represented by Equations (1) and (2) and results is an increase in acidity (generation of H
+) or a decrease in the pH. Further discussion of the effect of temperature on CO
2 solubility in water is given in
Section 4.3.2.
Thus, the dissolution of CO
2 in seawater plays an important role in the gradual decrease of pH observed in
Figure 11.
4.2. Local pH Profiles on the TSA Surface
Aluminum alloys of the 1xxx, 3xxx, 5xxx, and 6xxx series show good resistance to seawater as the passive film formed can resist attack by most seawater constituents. However, the tenacity of the surface oxide is dependent on the pH, temperature, chloride concentration etc. If the pH shifts outside the range 4.0 to 8.5 the stability of the oxide is compromised [
2]. As shown in
Figure 11, the local pHs, both at 30 °C and 60 °C were between 4.5 and 8.5 until 200 h exposure and in this pH range passivation is expected at 25 °C because of the formation of Al
2O
3·H
2O [
23]. However in this study the specimens were also exposed to seawater at 60 °C. An increase in temperature is likely to lead to an increase in the reaction kinetics, but the corrosion process is also dependent on the formation of precipitates and the change in the oxide film formed. Thus, the corrosion rate is unlikely to increase significantly unless the oxide layer dissolves rapidly [
1,
23].
The passive layer on aluminum is composed of (i) an inner amorphous oxide/hydrated oxide layer (adjacent to the aluminum surface) whose thickness depends on the temperature and (ii) a thicker outer layer of hydrated oxide [
23]. As shown previously in
Figure 10, two different types of aluminum oxide were formed: Al(OH)
3 at 30 °C and K-Al
2O
3 at 60 °C.
At 30 °C the rapid drop in pH is probably linked to the effect of the Cl
− ions acting on the aluminum oxide layer. The effect of these ions on the passive film is not entirely clear, but so far the following has been discussed in the literature—breakdown of the passive film and its dissolution due to the attack of Cl
− ions in the discontinuity of the film where a pit is formed, dissolving aluminum at the bottom (anode area) as shown in Equation (3) [
1,
23,
24]:
The generation of H
+ will decrease the pH as observed. Chloride ions migrate within the pit and form AlCl
3 which dissolves in the solution. However, for the pit to be able to propagate, a critical bulk chloride concentration of 1.6 M is needed, which is greater than that in seawater (0.57 M) [
24]. However, the local chloride concentration in the pit may reach such values if evaporation of seawater occurs.
In the interfacial region, AlCl
3 is also likely to form by the reaction between the chloride ions and the passive film following Equation (5). This equilibrium is important since it will determine if the pit will keep growing or cease to grow. The H
+ formed in Equation (4) is also involved in the formation of AlCl
3 from hydrated alumina, which is generally formed when Al is in contact with water. If AlCl
3 is formed, the pit will keep growing [
25]. The reaction can be written as:
However, more research is required to understand the role of the Cl
− ions in destabilization and dissolution of the passive film [
24].
On the other hand, if Al
2O
3 is formed, the pit will passivate and become inactive and this happens when the solution within the pit is reverted to the composition of the bulk solution [
3,
24]. Thus, the relatively constant pH at 60 °C between 7 and 8.5 may have occurred due to passivation of Al
2O
3.
4.3. Local pH Profiles in the Holiday Region
4.3.1. General Remarks on the Precipitation of CaCO3 and Mg(OH)2 from Seawater
For a better understanding of the mechanism of calcareous deposit formation, some relations and interdependencies must be considered. One would expect that the corrosion rate will increase with the rise in temperature and that the oxygen content will play an important role in seawater corrosivity. However, in this work the TSA coating acted as an anode to the steel and a calcareous deposit formed and acted as a barrier to the oxygen diffusion to the initially exposed steel surface in the holiday region [
25]. Two main events happened which led to the precipitation of calcareous matter; (i) high local production of hydroxyl ions (OH
−) at the steel surface/seawater interface (Equation (6)); and (ii) ionic products of the ions comprising the deposits exceeding the solubility product of magnesium and calcium compounds, leading to precipitation [
9,
18,
25]. The exchange of electrons allows hydrogen evolution as shown in Equation (7).
According to the literature, Mg(OH)
2 will precipitate as long as the local pH reaches 9.5 (at room temperature), following the equilibrium shown in Equation (8) [
5,
6,
7,
8,
9,
26].
Such an increase in OH
− ions (Equation (6)) also affects the calco-carbonate equilibrium (which is governed by the dissolution and subsequent dissociation of CO
2 in seawater) at the steel surface, shifting the equilibrium in Equation (9) to the right where the formation of CaCO
3 will be further favored following Equation (10), as long as a minimum pH of 7.5 at room temperature is reached [
5,
8,
9,
10,
14,
27,
28].
Thus, the formation of CaCO
3 is dependent on the calco-carbonic equilibrium shown above. The reactions are initiated by the absorption of carbon dioxide into the surface water, which lowers the pH by dissociation and decreases the saturation of the carbonates [
25].
4.3.2. Effect of Temperature on Solubility
The lower solubility of calcium carbonate at higher temperature favors its precipitation, as shown in
Table 4 (temperatures close to the test conditions are reported due to the limited availability of data in the literature). However, as mentioned previously, the presence of gases such as CO
2 will also contribute to the formation of CaCO
3.
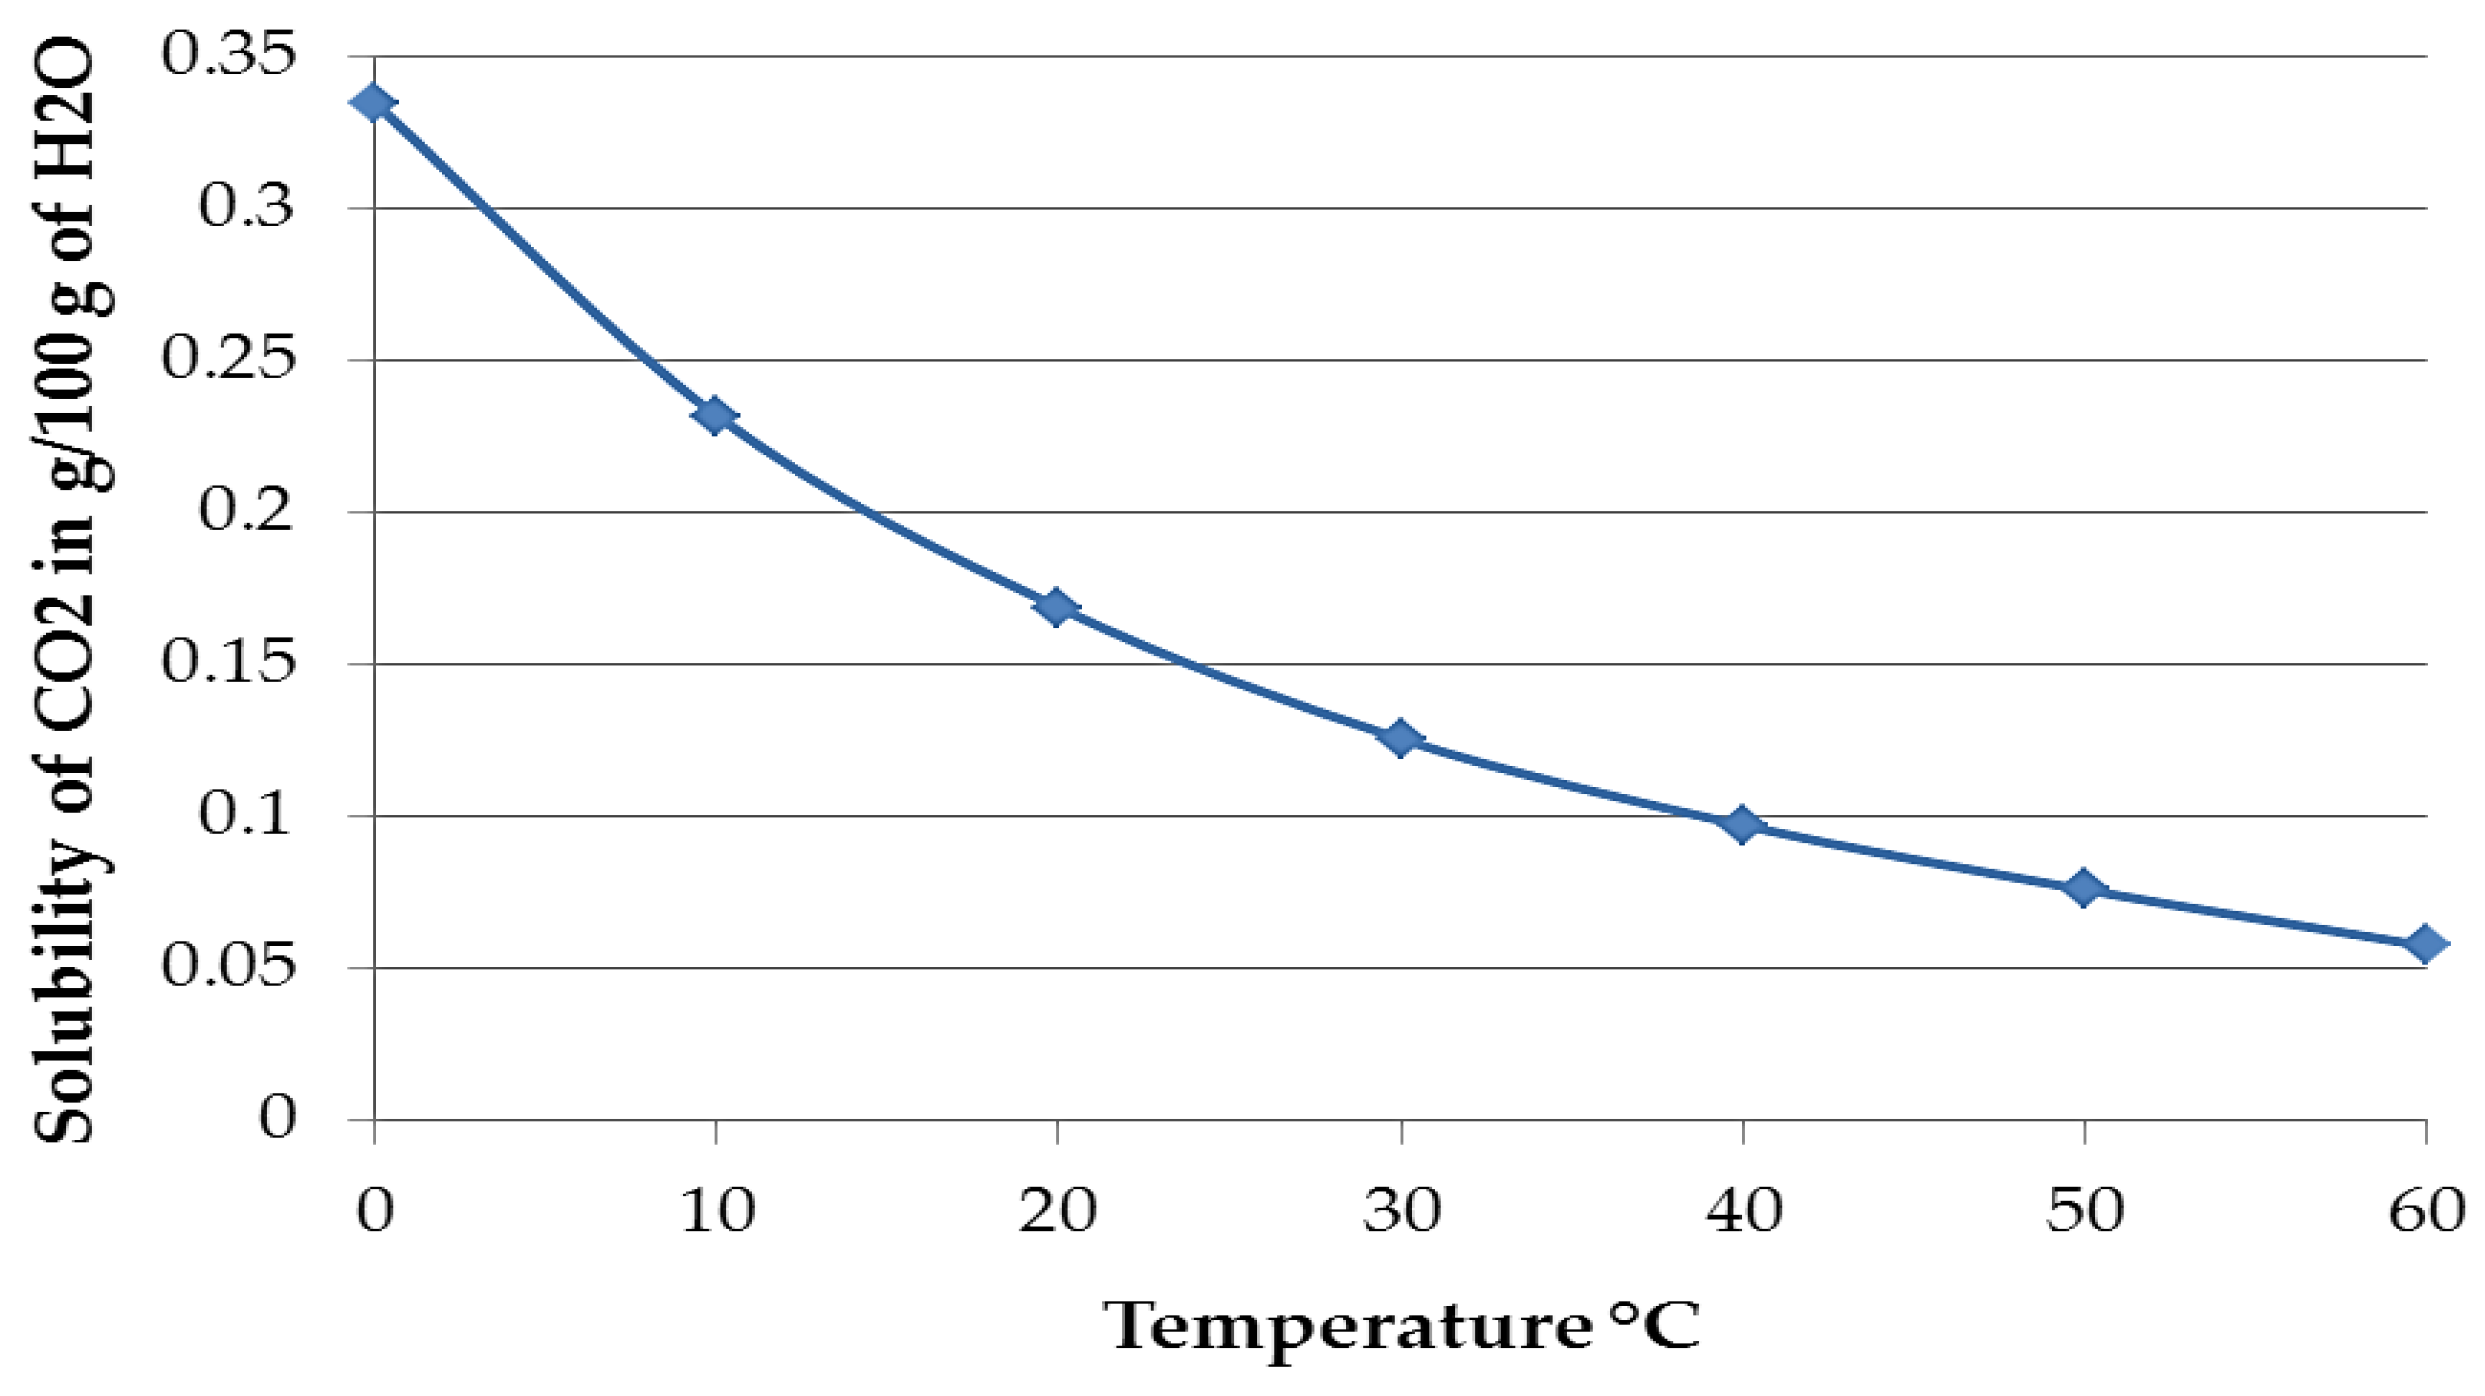
Figure 14 shows the solubility of pure CO
2 in water at different temperatures up to 60 °C, expressed in the amount of substance that is soluble in 100 g of water. The solubility of CO
2 at 30 °C is 0.1257 g/100 g, while at 60 °C it is 0.0576 g/100 g and it can be speculated that the increase in temperature and the consequent reduction of CO
2 solubility may also decrease the probability of CaCO
3 formation [
15,
29]. Although the data above is for pure CO
2 at 1 atm and the amount of CO
2 in air is 400 ppmv, the logic is still likely to be valid. Thus, the lack of copious calcium carbonate on TSA may be due to (i) the pH at the TSA surface not being ideal for precipitation; (ii) the consumption of the carbonates formed from dissolved CO
2 took place before the possibility of forming calcium carbonate outside the holiday region; and (iii) the kinetics of formation of Al corrosion product on the TSA surface outweighed the kinetics of deposition of CaCO
3.
Table 4 also suggests that a higher amount of brucite would form at higher temperature, primarily due to (i) the greater amount of Mg
2+ in synthetic seawater solution compared to Ca
2+ and the lesser solubility of Mg(OH)
2 and (ii) the lesser availability of dissolved carbonates (due to reduced solubility of CO
2). This could be observed in
Figure 5 where more brucite was formed outside the holiday region, on the TSA coating surface.
It can be observed in
Figure 13 that maxima in the peaks were reached very quickly followed by a drop. At first, the cathodic reaction increases the [OH
−] at the steel surface (
Figure 2b) which results in a pH increase. Such an increase is hindered when the local pH is high as at 10.19 at 30 °C and 9.54 at 60 °C. Those high pHs are favorable for Mg(OH)
2 precipitation, which will be further proved in
Section 4.3.3 [
30]. This is a very thin base layer (measured as 6 µm) as observed in
Figure 5b,e. Although very thin, this layer is able to hinder the diffusion of oxygen towards the steel surface in some of the areas, where it starts to form. The layer serves as a base layer for the further growth of CaCO
3, which is dependent on CO
2 diffusion as mentioned earlier and therefore on the calco-carbonate equilibrium (Equations (1) and (2)). Thus, the CO
2 is also being consumed to form CaCO
3, delaying the pH stabilization as the CaCO
3 is still being formed. Once both layers are fully formed, it acts as a natural barrier against further steel corrosion [
6,
9,
27,
30]. In summary, two events are taking place even after the maximum peak at 30 °C; (i) local formation of OH
− and (ii) consumption of CO
2 for the formation of CaCO
3.
At 60 °C, the calcareous deposit was already formed within 17 h (
Figure 3b), straight after the maximum peak was reached. This faster limitation (of hindrance) of oxygen towards the steel surface, whose content is already less than at 30 °C [
31], rapidly blocks further cathodic reaction or the generation of OH
−, decreasing the pH faster than at 30 °C. Considering the less availability of CO
2 in solution at 60 °C; it seems that the pH was more dependent on the local [OH
−] at 60 °C.
4.3.3. Minimum Local pH at 30 °C and 60 °C for the Precipitation of Deposits
In order to better understand the environment that leads to the growth of the calcareous deposit on a steel surface, it is important to know the favorable pH for the precipitation to occur. These values are known at 25 °C, but information is lacking for the temperatures used in this study. The minimum pHs for precipitation of brucite and aragonite were calculated from thermodynamic data of the different species associated with the precipitation of brucite and aragonite (as presented in Equations (8) and (10)), given in
Table 5. The ∆
G° for the reactions were then calculated at 30 °C and 60° using Equation (11). From the data it was possible to calculate the solubility product (
Ksp) of each compound shown in Equation (12), where
R is the ideal gas constant.
From Equation (8), we can write the solubility product equilibrium in Equation (13) which shows the relationship of the Mg(OH)
2 solubility product with the concentration of its ionic constituents:
which leads to Equation (14):
From the ionic product of water (
Kw) it is possible to draw the correlation in Equation (15). Values of
Kw are available in the literature [
34,
35].
Kw is defined as:
which can be used to calculate the pH as in Equation (16), where the relationship for the minimum precipitation pH is shown. In synthetic seawater, the concentration of Mg
2+ was calculated from the data in
Table 3 as 0.054 M. The solubility product data was taken from
Table 6.
In the same way, the precipitation pH of CaCO
3 can be calculated, however, here Equation (9) must be considered which relates the formation of CaCO
3 to the concentration of OH
−. The molar concentration of OH
− is equal to the concentration of
(following Equation (9)) and therefore the relationship in Equation (17) can be derived which further results in Equation (18). The concentration of Ca
2+ in synthetic seawater was calculated from the data in
Table 3 as 0.010 M.
With the data and expressions arranged, it was possible to calculate the minimum pH for the precipitation of both compounds: Mg(OH)
2 and CaCO
3. The results are summarized in
Table 7.
The results show that the conditions for the precipitation of compounds were governed by the environment created in this study as the local pH reached values higher (as 10.19 at 30 °C and 9.54 at 60 °C) than the required minimum (
Figure 13). The exact pH when the compounds started precipitating is difficult to define as it depends on complex interactions between different factors. The presence of Mg
2+ in solution, for example, was reported to inhibit the nucleation of CaCO
3 [
14]. Neville and Morizot [
9] considered that the primary function of Mg
2+ is to form a Mg-containing layer which makes the conditions favorable for the formation of CaCO
3. In addition, Barchiche et al. [
6,
36] mentioned that the presence of sulfate ions can hinder the deposition of CaCO
3 and favor the precipitation of magnesium hydroxide although the mechanism is not entirely clear. These considerations are important to understand in that prior to the formation of the brucite layer (which consumes the Mg
2+ ions from the solution by forming a precipitate) no aragonite should be formed in the present experiments. These previous experimental data may help us understand the reasons for the delay in the deposition of CaCO
3 and why it is only formed at a higher pH than the calculated values.
Lee and Ambrose [
31] mentioned that although the amount the dissolved oxygen content in water increases with a decrease in temperature, the diffusion coefficient of oxygen is diminished as well as the hydrogen evolution reaction, which can explain the lower pH necessary to precipitate Mg(OH)
2 at 60 °C compared to 30 °C.
4.3.4. CaCO3 Precipitation at 30 °C and 60 °C
One can wrongly assume that CaCO
3 will precipitate in acidic media at 60 °C, once its precipitation pH is found to be 6.6. However, it should be noted that the neutral point of water is defined as 7 at room temperature (25 °C), which is shifted to a different value at higher temperature. The neutral point of water at 30 °C and 60 °C can be easily found using the respective
Kw values already mentioned. The neutrality occurs when
and thus, as shown in Equation (20), it can be rewritten as
From the above equation the neutral point of water at 30 °C is calculated to be 6.92 and at 60 °C it is 6.51. This means that the precipitation of all the compounds tookplace at a pH greater than the neutral point of water (alkaline environments) at the temperature concerned.
Yang et al. [
18] calculated the minimum precipitation pH of calcium carbonate and magnesium hydroxide based on the solubility product data as 7.58 and 10 at 20 °C. No experimental pH measurement was carried out. The pH value found in the current study for the precipitation of CaCO
3 at 30 °C, which was 7.61, was very close to the value calculated by Yang et al. [
18]. The slight difference is likely due to difference in the solubility values at the two temperatures. This may suggest that at temperatures up to 30 °C, the aragonite precipitation is not very sensitive to temperature change (between the temperature range 20 °C to 30 °C), while brucite had its minimum pH decreased from 10 to 8.86 within a 10 degree centigrade difference. However at 60 °C, the aragonite presented a higher fall in the pH value for precipitation compared to brucite. The results show that complex relations exist between the temperature and the pH required for the precipitation of the compounds.
5. Summary and Conclusions
The study covered the pH measurement in synthetic seawater, on a TSA surface and on the steel surface under cathodic protection at 30 °C and 60 °C. The pH of synthetic seawater changed with an increase in temperature due to (i) the change in dissociation constant of water which ultimately lowers the neutral pH of water with temperature; (ii) dissolution and dissociation of CO2 from air in synthetic seawater; and (iii) the possible deposition of salts on the reactor wall. The local pH of the TSA coating increased with time at 60 °C and the opposite behavior was observed at 30 °C, in a mechanism related to the formation of Al(OH)3 and hydrolysis of Al3+ in the presence of Cl− ions. The AlCl3 possibly formed in the chloride solution when hydrolysis leads to acidification and decreases the pH.
The pH in the holiday region, which represents the local pH of a cathodically polarized steel, showed a peak of 10.19 and stabilized at 8.8 at 30 °C. At 60 °C, the maximum peak occurred at 9.54 with the final pH measured at 7.9. The pH probe was touching the steel surface, so it is not expected that a correction in the values needs to be considered. However, a small gap between the actual measured region and the steel-seawater interface is likely.
Calculations showed that the minimum pH necessary for the precipitation of Mg(OH)2 (brucite) in synthetic seawater is 8.86 at 30 °C and 8.01 at 60 °C, while for CaCO3 the values are 7.61 and 6.66 for the above temperatures. It must be noted that these pH values are not the values when the compounds actually started to precipitate, but values theoretically predicted. The first deposit to be formed was a Mg-containing layer, which favored the growth of an aragonite (CaCO3) layer on it, although other factors also influence CaCO3 formation, for example the dissolution and subsequent dissociation of CO2 in seawater.
The effect of temperature on solubility was discussed in this paper. The CO2 solubility in seawater, and CaCO3 and Mg(OH)2 solubility in water were taken into account to calculate the minimum local pH required for the precipitation of deposits on the cathodically polarized steel surface. Thus, it is clear that the surface temperature of offshore pipelines carrying hot fluids will dictate the growth mechanism of calcareous deposits. Moreover, further studies at higher temperatures than 60 °C, possibly at elevated pressures need to be explored to understand the behavior of deposits under deep sea conditions. These could not be carried out in this research due to the limitation in the temperature and pressure capability of the available pH probes.
The formation of these layers (Ca-and Mg-containing deposits) on exposed steel has serious implications on the life of polarized steel structures. Generally, one would use galvanic anodes to polarize offshore steel structures, but the use of TSA coating as an evenly distributed anode on the steel surface has its advantages; firstly, as a barrier, and secondly, as a sacrificial coating when damaged. The ability of TSA to protect steel when damaged even at 60 °C is important for designers of structures which may experience hot seawater in service. If the Ca-and Mg-containing deposits restrict the ingress of corrosive species to the steel surface (exposed by coating damage), they can reduce the loss of TSA significantly, thus improving the life of the structure. The mechanism of deposit formation in the holiday region, enhanced by increase in local pH as elucidated here will, hopefully, help our understanding of the protective function TSA offers. Further, this will help us understand the general mechanism of protection of steel structures when cathodic protection (CP) is employed.
Acknowledgments
The work was funded by TWI. Nataly Ce would like to thank CNPQ and BG for the PhD scholarship. The authors also acknowledge the contribution of TWI staff, especially Mike Bennett, Ryan Bellward, and Sheila Stevens.
Author Contributions
Shiladitya Paul conceived and designed the tests; Nataly Ce carried out the tests, microstructural characterization, and wrote the paper; Shiladitya Paul reviewed the paper, made final changes, and contributed with technical knowledge.
Conflicts of Interest
The authors declare no conflict of interest.
References
- Ghali, E.; Revie, R.W. Corrosion Resistance of Aluminum and Magnesium Alloys: Understanding, Performance, and Testing, 1st ed.; John Willey & Sons: Hoboken, NJ, USA, 2010; pp. 160–173. [Google Scholar]
- Talbot, D.; Talbot, J. Corrosion Science and Technology, 2nd ed.; CRC Press: Boca Raton, FL, USA, 2007; pp. 453–454. [Google Scholar]
- Revie, R.W. Uhlig’s Corrosion Handbook, 3rd ed.; John Wiley & Sons: Hoboken, NJ, USA, 2011. [Google Scholar]
- Shifler, D.A. Understanding Material Interactions in Marine Environments to Promote Extended Structural Life. Corros. Sci. 2005, 47, 2335–2352. [Google Scholar] [CrossRef]
- Palmer, A.C.; Roger, A.K. Subsea Pipeline Engineering, 2nd ed.; PennWell: Tulsa, OK, USA, 2008; pp. 247–264. [Google Scholar]
- Barchiche, C.; Deslouis, C.; Gil, O.; Refait, P.; Tribollet, B. Characterization of Calcareous Deposits by Eletrochemical Method Role of Sulphates, Calcium Concentration and Temperature. Electrochim. Acta 2004, 49, 2833–2839. [Google Scholar] [CrossRef]
- Deslouis, C.; Festy, D.; Gil, O.; Rius, G.; Touzain, S.; Tribollet, B. Characterization of Calcareous Deposits in Artificial Seawater by Impedance Techniques–I. Deposit of CaCO3 without Mg(OH)2. Electrochim. Acta 1997, 43, 2833–2839. [Google Scholar]
- Salgavo, G.; Maffi, S.; Magagnin, L.; Benedetti, A.; Pasqualin, S.; Olzi, E. Calcareous Deposits, Hydrogen Evolution and pH on Structures under Cathodic Polarization in Seawater. In Proceedings of the Thirteenth International Offshore and Polar Engineering Conference, Honolulu, HI, USA, 25–30 May 2003. [Google Scholar]
- Neville, A.; Morizot, A.P. Calcareous Scales Formed by Cathodic Protection—An Assessment of Characteristics and Kinectics. J. Cryst. Growth 2002, 243, 490–502. [Google Scholar] [CrossRef]
- Moller, H. The Influence of Mg2+ on the Formation of Calcareous Deposits on a Freely Corroding Low Carbon Steel in Seawater. Corros. Sci. 2007, 49, 1992–2001. [Google Scholar] [CrossRef]
- Dexter, S.C.; Lin, S.H. Calculation of Seawater pH at Polarized Metal Surfaces in the Presence of Surface Films. Corrosion 1992, 48, 50–60. [Google Scholar] [CrossRef]
- Lewandowski, Z.; Lee, W.C.; Characklis, W.G.; Little, B. Dissolved Oxygen and pH Microelectrode Measurements at Water-Immersed Metal Surfaces. Corrosion 1989, 45, 92–98. [Google Scholar] [CrossRef]
- ASTM D1141–98–Standard Practice for the Preparation of Substitute Ocean Water; ASTM International: Materials Park, OH, USA, 2013.
- Barchiche, C.; Deslouis, C.; Festy, D.; Gil, O.; Refait, P.; Touzain, S.; Tribollet, B. Characterization of Calcareous Deposits in Artificial Seawater by Impedance Techniques 3-Deposit of CaCO3 in the Presence of Mg(II). Eletrochim. Acta 2003, 48, 1645–1654. [Google Scholar] [CrossRef]
- Perry, R.H.; Green, D.W. Perry’s Chemical Engineers’ Handbook, 7th ed.; McGraw-Hill Professional: New York, NY, USA, 1997; pp. 2–122. [Google Scholar]
- Driessche, A.V.; Benning, L.G.; Ossorio, M.; Blanco, J.D.R.; Bots, P.; Ruiz, J.M.G. The Role and Implications of Bassanite as a Stable Precursor Phase to Gypsum Precipitation. Science 2012, 336, 69–72. [Google Scholar] [CrossRef] [PubMed]
- Buchanan, R.C.; Park, T. Materials Crystal Chemistry, 1st ed.; CRC Press: New York, NY, USA, 1997. [Google Scholar]
- Yang, Y.; Scantlebury, J.D.; Koroleva, E.V. A Study of Calcareous Deposits on Cathodically Protected Mild Steel in Artificial Seawater. Metals 2015, 5, 439–456. [Google Scholar] [CrossRef]
- Packter, A.; Derby, A. Co-precipitation of magnesium iron III hydroxide powders from aqueous solutions. Cryst. Res. Technol. 1986, 21, 1391–1400. [Google Scholar] [CrossRef]
- Hunter, K.A. The Temperature Dependence of pH in Surface Seawater. Deep Sea Res. Part I Oceanogr. Res. Papers 1998, 45, 1919–1930. [Google Scholar] [CrossRef]
- Ijsseling, F.P. General Guidelines for Corrosion Testing of Materials for Marine Applications: Literature review on Sea Water as Test Environment. Br. Corros. J. 1989, 24, 53–78. [Google Scholar] [CrossRef]
- Wright, J.M.; Colling, A. Seawater: Its Composition, Properties and Behaviour, 2nd ed.; Butterworth-Heinemann: Milton Keynes, UK, 1995. [Google Scholar]
- Davis, J.R. Corrosion of Aluminum and Aluminum Alloys. In ASM Handbook, 1st ed.; ASM International: Materials Park, OH, USA, 1999; pp. 25–42. [Google Scholar]
- Macleod, I. Stabilization of Corroded Aluminium. Stud. Conserv. 1983, 28, 1–7. [Google Scholar] [CrossRef]
- Shifler, D.A. Corrosion Performance and Testing of Materials in Marine Environments. In Corrosion in Marine and Saltwater Environments II: Proceedings of the International Symposium; Shifler, D.A., Tsuru, T., Natishan, P.M., Eds.; The Electrochemical Society: Honolulu, HI, USA, 2004; pp. 1–12. [Google Scholar]
- Shreir, L.L.; Jarman, R.A.; Burstein, G.T. Corrosion. Metal/Environment Reactions, 3rd ed.; Butterworth-Heinemann Ltd.: Oxford, UK, 1994. [Google Scholar]
- Akamine, K.; Kashiki, I. Corrosion Protection of Steel by Calcareous Electrodeposition in Seawater (Part 1). Zairy Kankyo 2002, 51, 496–501. [Google Scholar] [CrossRef]
- Hartt, W.H.; Culberson, C.H.; Smith, W.S. Calcareous Deposits on Metal Surfaces in Seawater–A Critical review. Corrosion 1984, 40, 609–618. [Google Scholar] [CrossRef]
- Robert, C.; Lide, D.L. CRC Handbook of Chemistry and Physics, 70th ed.; CRC Press: Boca Raton, FL, USA, 1995. [Google Scholar]
- Yan, J.F.; Nguyen, T.V.; White, R.E.; Griffin, R.B. Mathematical Modeling of the Formation of Calcareous Deposits on Cathodically Protected Steel in Seawater. J. Electrochem. Soc. 1993, 140, 733–744. [Google Scholar] [CrossRef]
- Lee, R.U.; Ambrose, J.R. Influence of Cathodic Protection Parameters on Calcareous Deposit Formation. Corrosion 1988, 44, 887–891. [Google Scholar] [CrossRef]
- Anderson, G.M. Thermodynamics of Natural Systems, 2nd ed.; Cambridge Press: Cambridge, UK, 2009. [Google Scholar]
- Lide, D.L. CRC Handbook of Chemistry and Physics, 86th ed.; CRC Press: Boca Raton, FL, USA, 2005. [Google Scholar]
- Marsden, J.O.; House, C.I. The Chemistry of Gold Extraction, 2nd ed.; Society for Mining Metallurgy & Exploration: Littleton, CO, USA.
- Whitten, K.W.; Davis, R.E.; Peck, L.; Stanley, G.G. Chemistry, 10th ed.; Cengage Learning: Boston, Belmont, USA, 2013. [Google Scholar]
- Barchiche, C.; Deslouis, C.; Gil, O.; Joiret, S.; Refait, P.; Tribollet, B. Role of Sulphate Ions on the Formation of Calcareous Deposits on Steel in Artificial Seawater; the Formation of Green Rust Compounds during Cathodic Protection. Electrochim. Acta 2009, 54, 3580–3588. [Google Scholar] [CrossRef]
Figure 1.
Thermally sprayed aluminum (TSA)-coated carbon steel specimens used for the local pH test: (a) without defect; and (b) with 20% holiday exposing the steel substrate.
Figure 1.
Thermally sprayed aluminum (TSA)-coated carbon steel specimens used for the local pH test: (a) without defect; and (b) with 20% holiday exposing the steel substrate.
Figure 2.
Photographs showing the specimen (with holiday) exposed to 30 °C seawater. (a) At the beginning of the test showing the position of the probe on the sample; (b) after 18 h showing formation of rust on the edges of the holiday at pH 10.08; and (c) after 82 h showing a thin white layer in the holiday at pH 9.84.
Figure 3.
Photographs showing the specimen (with holiday) exposed to 60 °C seawater. (a) At the beginning of the test showing the position of the probe on the sample; (b) after 17 h showing the holiday covered by a visible deposit of calcareous matter, pH 9.2.
Figure 3.
Photographs showing the specimen (with holiday) exposed to 60 °C seawater. (a) At the beginning of the test showing the position of the probe on the sample; (b) after 17 h showing the holiday covered by a visible deposit of calcareous matter, pH 9.2.
Figure 4.
Photographs of TSA-coated specimens after up to two weeks exposure to synthetic seawater showing surface without holiday at 30 °C (a), and 60 °C (b); and surface with holiday at 30 °C (c), and 60 °C (d).
Figure 4.
Photographs of TSA-coated specimens after up to two weeks exposure to synthetic seawater showing surface without holiday at 30 °C (a), and 60 °C (b); and surface with holiday at 30 °C (c), and 60 °C (d).
Figure 5.
Calcareous deposits formed on the steel surface (in the holiday region) of the TSA coated sample: (a) 30 °C sample—holiday area in top view; (b) 30 °C sample—holiday area in cross-section; (c) 30 °C sample—TSA area in cross-section; (d) 60 °C sample—holiday area in top view; (e) 60 °C sample—holiday area in cross-section; (f) 60 °C sample—TSA area in cross-section.
Figure 6.
Energy dispersive X-ray (EDX) pattern of the top layer marked as a triangle in
Figure 5. Strong peaks of Ca, C, and O are observed. This specific spectrum is from the sample tested at 30 °C.
Figure 6.
Energy dispersive X-ray (EDX) pattern of the top layer marked as a triangle in
Figure 5. Strong peaks of Ca, C, and O are observed. This specific spectrum is from the sample tested at 30 °C.
Figure 7.
EDX pattern of the layer marked as a square in
Figure 5. Strong peaks of Mg and O are observed. This specific spectrum is from the sample tested at 30 °C.
Figure 7.
EDX pattern of the layer marked as a square in
Figure 5. Strong peaks of Mg and O are observed. This specific spectrum is from the sample tested at 30 °C.
Figure 8.
EDX pattern of the layer marked as a circle in
Figure 5. Strong peaks of Al and O are observed. This specific spectrum is from the sample tested at 30 °C.
Figure 8.
EDX pattern of the layer marked as a circle in
Figure 5. Strong peaks of Al and O are observed. This specific spectrum is from the sample tested at 30 °C.
Figure 9.
X-ray diffraction (XRD) patterns showing the predominant presence of brucite and aragonite in deposits from the holiday region of samples exposed to synthetic seawater at 30 °C and 60 °C.
Figure 9.
X-ray diffraction (XRD) patterns showing the predominant presence of brucite and aragonite in deposits from the holiday region of samples exposed to synthetic seawater at 30 °C and 60 °C.
Figure 10.
X-ray diffraction (XRD) patterns showing the presence of aluminum oxide in deposits from the TSA region of samples exposed to synthetic seawater at 30 °C and 60 °C. Al in the deposit is from the TSA.
Figure 10.
X-ray diffraction (XRD) patterns showing the presence of aluminum oxide in deposits from the TSA region of samples exposed to synthetic seawater at 30 °C and 60 °C. Al in the deposit is from the TSA.
Figure 11.
pH profiles of synthetic seawater in air at 30 °C and 60 °C without any specimen.
Figure 11.
pH profiles of synthetic seawater in air at 30 °C and 60 °C without any specimen.
Figure 12.
pH profiles obtained from the flat probe at 30 °C and 60 °C. The probe was in contact with the TSA-coated specimen surface without any holiday. The pH of the bulk seawater is also portrayed.
Figure 12.
pH profiles obtained from the flat probe at 30 °C and 60 °C. The probe was in contact with the TSA-coated specimen surface without any holiday. The pH of the bulk seawater is also portrayed.
Figure 13.
pH profiles obtained from the flat probe at 30 °C and 60 °C. The probe was in contact with the holiday region of the TSA-coated specimen. The pH of the bulk seawater is also portrayed.
Figure 13.
pH profiles obtained from the flat probe at 30 °C and 60 °C. The probe was in contact with the holiday region of the TSA-coated specimen. The pH of the bulk seawater is also portrayed.
Figure 14.
Solubility of pure CO
2 in water up to 60 °C. Data taken from Perry and Green [
15].
Figure 14.
Solubility of pure CO
2 in water up to 60 °C. Data taken from Perry and Green [
15].
Table 1.
Composition of the substrate steel (S355) and coating consumable (wt %).
Table 1.
Composition of the substrate steel (S355) and coating consumable (wt %).
| Component | C | Mn | Si | S | P | Fe | N | V | Cu | Al |
|---|
| EN10025S355J2G3 | 0.12 | 1.39 | 0.39 | 0.019 | 0.014 | Bal. | 0.003 | 0.065 | − | − |
| Al wire (coating) | − | <0.01 | 0.07 | − | − | 0.21 | 0.01 | − | <0.01 | Bal. |
Table 2.
The spray parameters used for coating production.
Table 2.
The spray parameters used for coating production.
| Wire Diameter (mm) | Wire Feed Rate (g/min) | Spray Distance (mm) | Increment Step (mm) | Traverse Speed (m/s) | Nominal Thickness (µm) |
|---|
| 2.3 | 98.7 | 95 | 15 | 0.5 | 300 |
Table 3.
Synthetic seawater composition [
13].
Table 3.
Synthetic seawater composition [
13].
| Compound | Concentration (g/L) | Compound | Concentration (g/L) |
|---|
| NaCl | 24.53 | NaHCO3 | 0.201 |
| MgCl2 | 5.20 | KBr | 0.101 |
| Na2SO | 4.09 | H3BO3 | 0.025 |
| CaCl2 | 1.16 | SrCl2 | 0.025 |
| KCl | 0.695 | NaF | 0.003 |
Table 4.
Solubility of CaCO
3 and Mg(OH)
2 in water at different temperatures [
15,
29].
Table 4.
Solubility of CaCO
3 and Mg(OH)
2 in water at different temperatures [
15,
29].
| Compound | Temperature (°C) | Solubility (g/100 mL) |
|---|
| CaCO3 | 25 | 0.0153 |
| 75 | 0.0019 |
| Mg(OH)2 | 35 | 0.00098 |
| 72 | 0.00069 |
Table 5.
Thermodynamic properties of different species in aqueous solution at 25 °C [
32,
33].
Table 5.
Thermodynamic properties of different species in aqueous solution at 25 °C [
32,
33].
| Element | ∆H°f (kJ/mol) | S° (J/mol K) |
|---|
| −677.1 | −56.9 |
| −542.8 | −53.1 |
| (aragonite) | −1207 | 88.7 |
| −466.85 | −138.07 |
| −230 | −10.8 |
| −924.53 | 63.18 |
Table 6.
Calculated values of ∆G° and Ksp of brucite and aragonite at 30 °C and 60 °C.
Table 6.
Calculated values of ∆G° and Ksp of brucite and aragonite at 30 °C and 60 °C.
| Compound | Temperature (°C) | ∆G° (J·mol−1) | Ksp (mol3·L−3) |
|---|
| Mg(OH)2 | 30 | 65,024.77 | 6.24 × 10⁻¹² |
| 60 | 71,922.47 | 5.28 × 10⁻¹² |
| CaCO3 | 30 | 47,335.90 | 6.97 × 10⁻⁹ |
| 60 | 53,296.90 | 4.39 × 10⁻⁹ |
Table 7.
Summary of values and calculated minimum pH for the precipitation of brucite and aragonite.
Table 7.
Summary of values and calculated minimum pH for the precipitation of brucite and aragonite.
| Temperature (°C) | Concentration (M) in Synthetic Seawater ASTM D1141 [13] | Ionic Product of Water (Kw) | Minimum pH for Precipitation |
|---|
| [Mg2+] | [Ca2+] | | |
|---|
| 30 | 0.054 | 0.010 | 1.47 × 10⁻¹⁴ | 8.86 | 7.61 |
| 60 | 0.054 | 0.010 | 9.6 × 10⁻¹⁴ | 8.01 | 6.66 |
© 2017 TWI Ltd. Licensee MDPI, Basel, Switzerland. This article is an open access article distributed under the terms and conditions of the Creative Commons Attribution (CC BY) license (http://creativecommons.org/licenses/by/4.0/).


