
A Specified Procedure for Distress Identification and Assessment for Urban Road Surfaces Based on PCI


Department of Civil, Constructional and Environmental Engineering, Università degli Studi di Roma “La Sapienza”, DICEA—via Eudossiana, 18, Rome 00184, Italy
*
Author to whom correspondence should be addressed.
Coatings 2017, 7(5), 65; https://doi.org/10.3390/coatings7050065
Submission received: 28 February 2017
/
Revised: 6 April 2017
/
Accepted: 19 April 2017
/
Published: 30 April 2017
(This article belongs to the Special Issue Low Environmental Impact Coatings for Road Pavements)
Abstract
:In this paper, a simplified procedure for the assessment of pavement structural integrity and the level of service for urban road surfaces is presented. A sample of 109 Asphalt Concrete (AC) urban pavements of an Italian road network was considered to validate the methodology. As part of this research, the most recurrent defects, those never encountered and those not defined with respect to the list collected in the ASTM D6433 have been determined by statistical analysis. The goal of this research is the improvement of the ASTM D6433 Distress Identification Catalogue to be adapted to urban road surfaces. The presented methodology includes the implementation of a Visual Basic for Application (VBA) language-based program for the computerization of Pavement Condition Index (PCI) calculation with interpolation by the parametric cubic spline of all of the density/deduct value curves of ASTM D6433 distress types. Also, two new distress definitions (for manholes and for tree roots) and new density/deduct curve values were proposed to achieve a new distress identification manual for urban road pavements. To validate the presented methodology, for the 109 urban pavements considered, the PCI was calculated using the new distress catalogue and using the ASTM D6433 implemented on PAVERTM. The results of the linear regression between them and their statistical parameters are presented in this paper. The comparison of the results shows that the proposed method is suitable for the identification and assessment of observed distress in urban pavement surfaces at the PCI-based scale.
1. Introduction
Pavements are one of the major assets of urban roadway systems. Maintenance and rehabilitation of these assets to maintain and achieve an acceptable level of service is a difficult challenge for urban development [1]. Since the 1970s, state highway agencies in the United States and Canada have been applying the Pavement Management Systems (PMS) to manage their assets, and they have evolved to be reliable tools for the effective management of interurban pavement networks; since then, their use has been spreading worldwide. The pavement management process provides a systematic and consistent method for the selection of maintenance and repair needs by evaluating the pavement performance at the network level [2].
In general, an adequate PMS should incorporate a set of tools able to provide a network-level inventory of pavement surface distress and conditions and network management tools, including the prediction of pavement condition, budget planning, inspection scheduling and economic analysis, for determining the most cost-effective maintenance and repair strategy considering the Life-Cycle Cost Analysis (LCCA) [3,4,5].
Several methods have been proposed worldwide to support the pavement management process by the development of pavement condition data as a major factor in the pavement management process [6], so researchers and highway agencies around the United States [7,8,9] have developed different pavement distress indices to measure the pavement’s structural integrity and pavement surface operation by aggregating several distress types to measure the overall condition of the pavement. Similarly, other researchers [10] had been working to develop global indexes considering pavement, roadside barriers and road structures.
Regardless, many PMS developed worldwide include other indexes based on road surface properties, such as roughness, which is related to pavement ride quality, load induced on the pavement, and driver’s comfort [11]. Roughness is measured using high performance equipment (profiler, profilometer, or profilograph) [12], which detects road profiles in real time, and the acquired data are analyzed in terms of frequency-weighted vertical acceleration awz according to ISO 2631 [13] or by the worldwide-recognized International Roughness Index (IRI) [14]. However, these techniques require an initial high investment and qualified staff for managing the data, so the use of these technologies is reduced to large agencies to manage large networks, and their use is very limited for small pavement road networks, where simple methods are used, such as visual surveys.
The main contribution to the state-of-the-art was the development of the Pavement Condition Index (PCI) rating procedure based on a numerical scale, from 100 (perfect condition) to 0 (failed pavement) [15], developed by the U.S. Army Corps of Engineers (USACE). The procedure was adopted by the American Society for Testing and Materials (ASTM) and documented in ASTM D6433 [16] Standard Test Method for Roads and Parking Lots Parking Lots Pavement Condition Index Surveys, and ASTM D5340 [17] Standard Test Method for Airport Pavement Condition Index Survey. This methodology has been widely used throughout the United States.
USACE subsequently developed the commercial software PAVERTM (version 7.0, Colorado State University, Fort Collins, CO, USA) [18], which uses the ASTM PCI calculation for describing the pavement’s condition and predicts future pavement conditions, helping managers to determine priorities and the optimal time to perform repair and maintenance activities. PAVERTM has been widely used by the U.S. Department of Defense (DOD) for the management of U.S. military airfields.
European experiences so far are very limited, mainly being concentrated on airfield pavements. In Ireland [19], the United Kingdom [20] and the Netherlands [21], some procedures and guidelines have been development to use the PCI methodology and PAVERTM to assess pavement condition and define pavement maintenance policies.
However, the European background in distress identification and management of roadway pavements is limited. The French institute of science and technology for transport, spatial planning, development and networks (in French: Institut français des sciences et technologies des transports, de l'aménagement et des réseaux IFSTTAR) has developed guidelines [22] for pavement distress identification in roadways. Additionally, only recently, in Ireland, a study of the Irish regional road network in 2012 [23] includes the assessment of the condition of pavement surfaces using a simplified index from 1 (failed pavement) to 10 (perfect conditions), based on the Pavement Surface Evaluation and Rating (PASER) rating scale, [24] methodology pioneered by the Wisconsin Department of Transportation (Madison, WI, USA) for local roads of the State of Wisconsin in the U.S.
It is important to say that the above-cited methodologies for a distress identification catalogue, such as ASTM D6433, are suited for roadways in the United States, and not for pavement distresses frequently seen on of European urban roads.
The application of PMS to urban areas are still very limited; only recently, some researchers have been working to adapt the PCI rating system for its use in urban areas, to manage pavement maintenance of sidewalks [25] and roadway pavements [26].
Recently, researchers [27,28,29] have proposed the development of a comprehensive PCI called the Urban Pavement Condition Index (UPCI) for the assessment of Chilean urban pavements. They have developed new distress evaluation guidelines, including the principal distresses present in the urban network and not considered in ASTM D6433, such as catch basins and manhole covers.
A manhole cover becomes a roadway hazard when it is not flush with the road surface. Motorcycle riders are at the highest risk with respect to uneven, loose or improperly-placed manhole covers. Hitting a manhole cover that is slightly open while traveling on two wheels can result in accidents with severe injuries or death. The manhole covers (or simply referred to as manholes) can also cause damage to vehicles and environmental impacts in terms of vibration and noise [30].
Furthermore, the determination of new deduct value curves from those of the ASTM D6433 has been developed [31] to suit the requirements and needs of flexible pavements in the State of Virginia.
In India [32,33], and in other developing countries [34,35], some researchers have developed methods combining different distress index equations and PCI using a reduced number of distresses starting with the ASTM D6433 catalogue. To each distress, different weights were assigned based on expert opinion to take into account their influence on overall pavement conditions.
The research presented in this paper attempts to fill the existing gap in the state-of-the-art in urban pavement maintenance by introducing a simple, effective and affordable PMS procedure.
2. Materials and Methods
2.1. Framework of the Presented Methodology
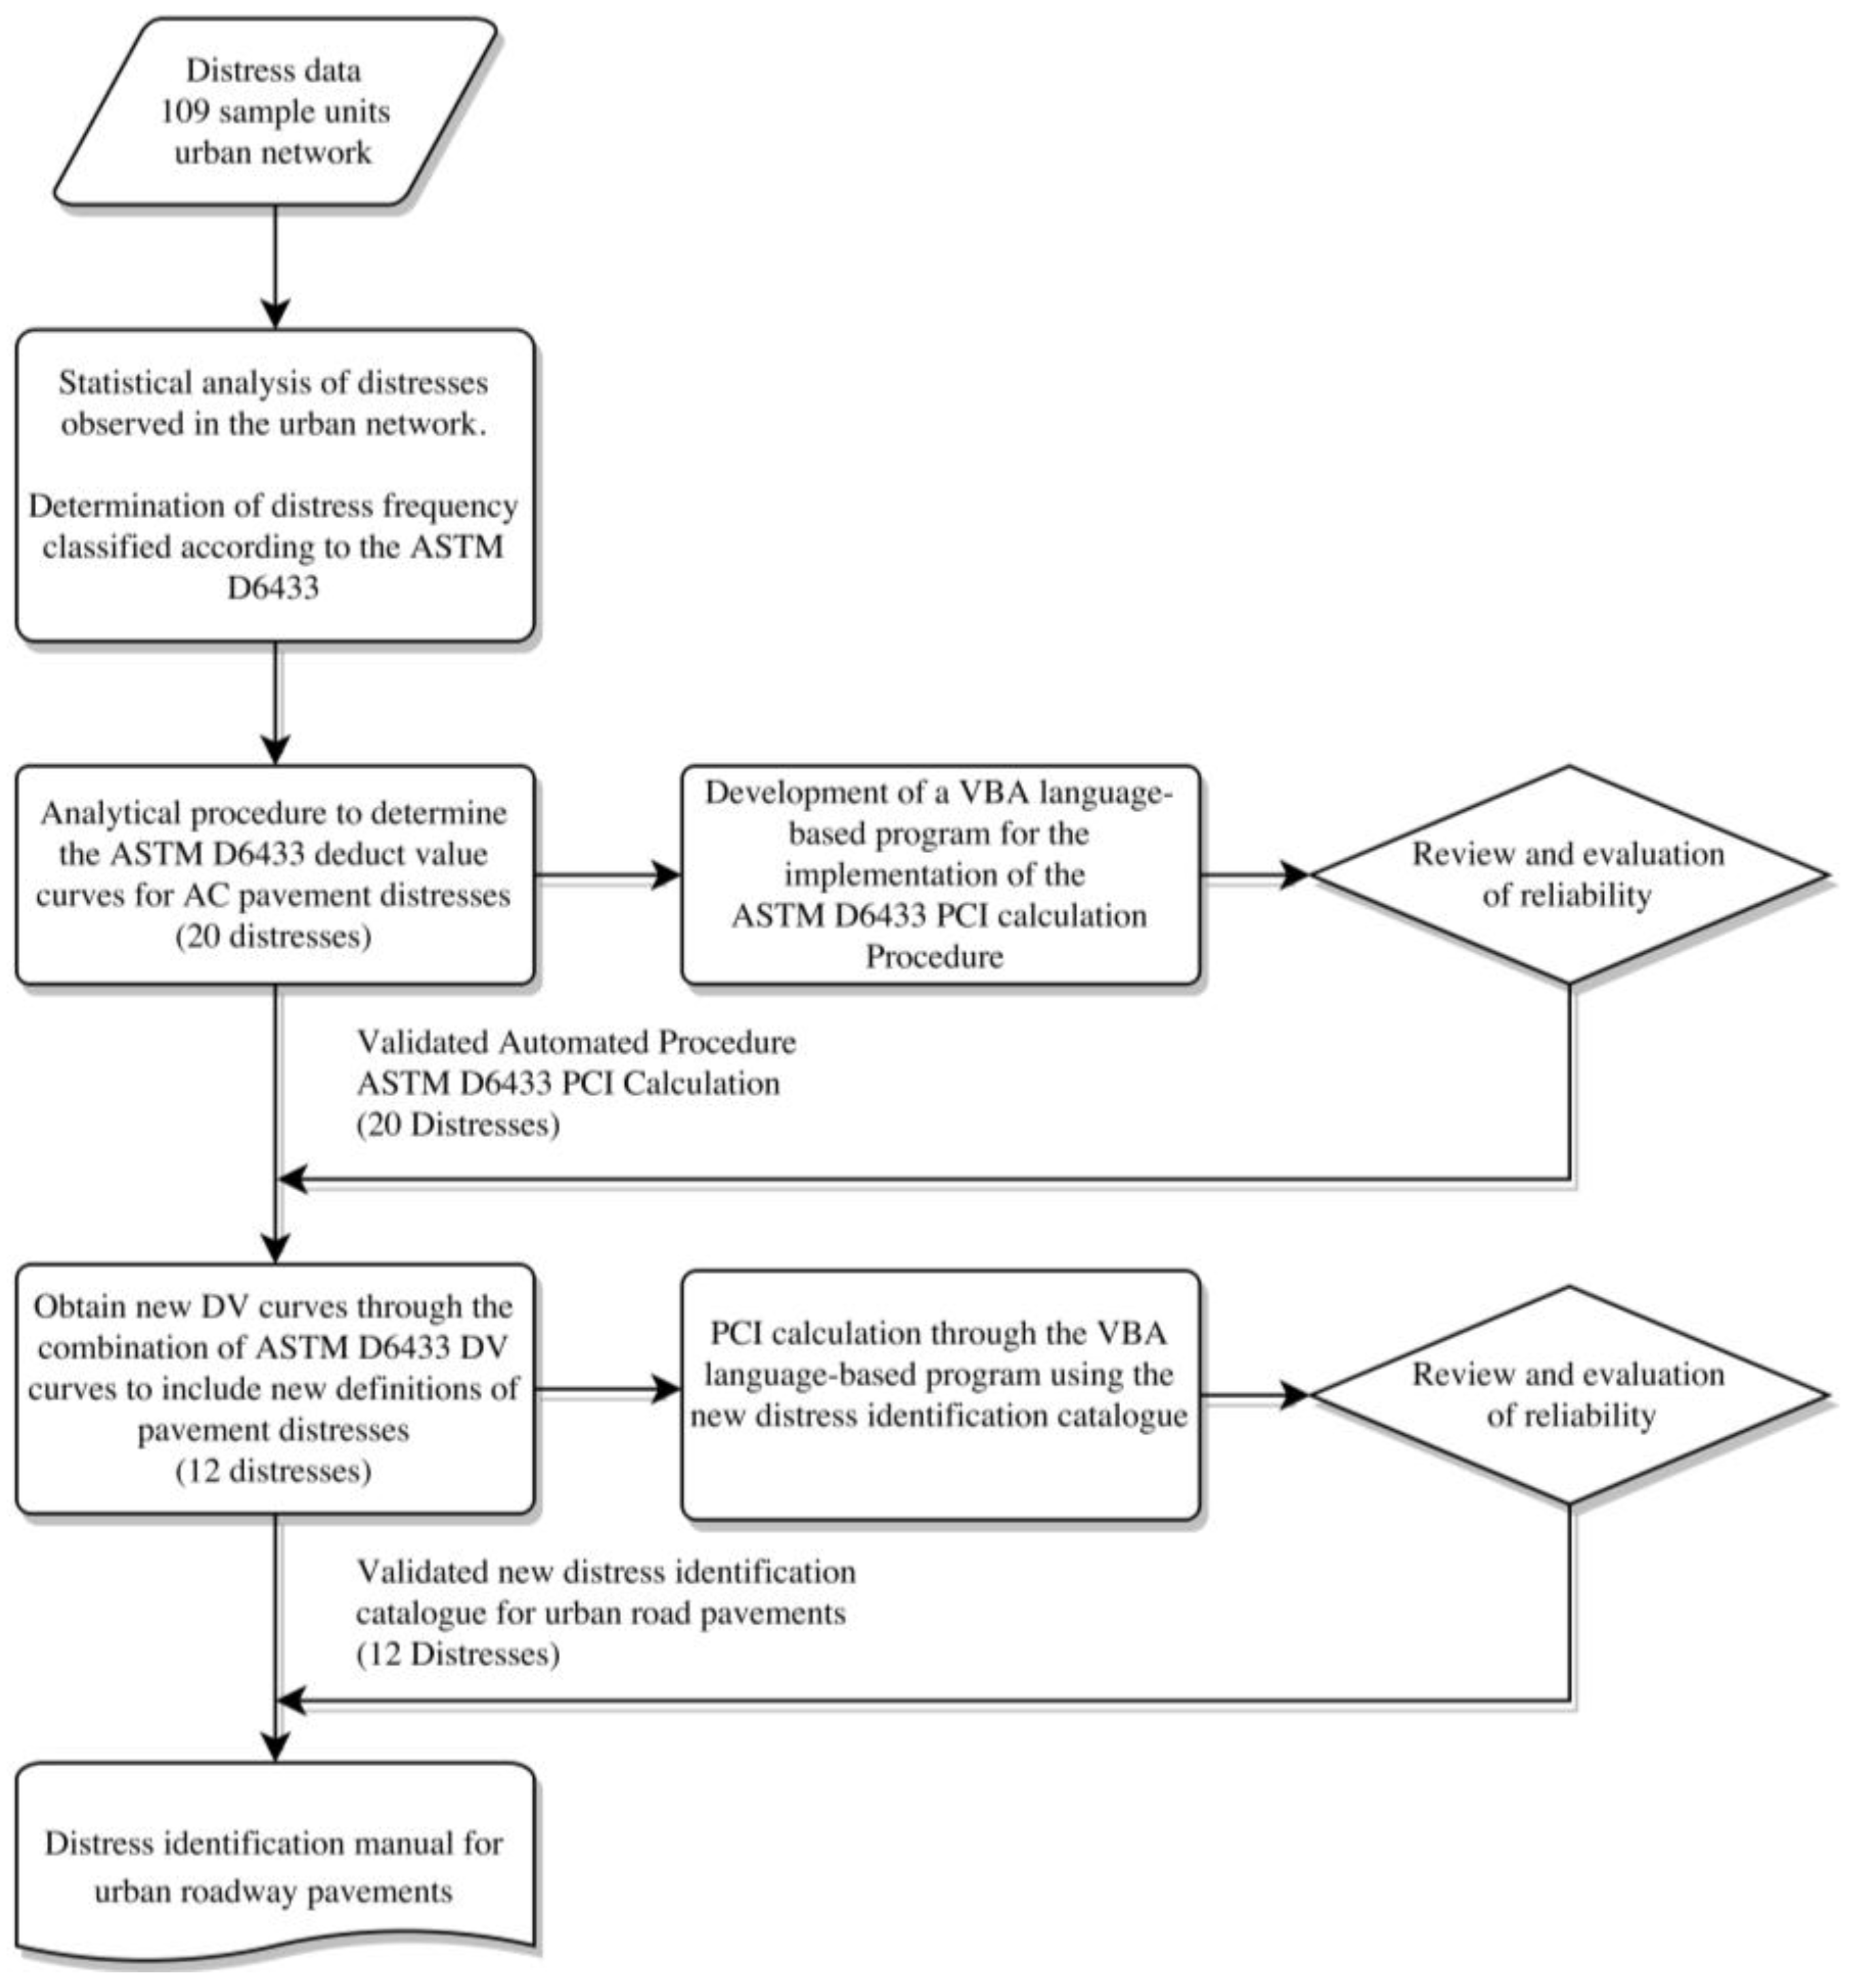
Challenge: Update the distress identification catalogue to the morphology and needs of Italian urban pavement surfaces (Figure 1).
The main objectives of this work are:
- Perform a statistical analysis of distresses observed in an Italian road network from those that are collected in the ASTM Standard D6433 Distress Identification Catalogue to identify the most frequent distresses.
- Determine how the ASTM D6433 distress definition could be upgraded to suit the pavement condition of urban roads looking for the identification, improvement and simplification of the pavement distress identification catalogue.
- Find an analytical procedure to determine the ASTM D6433 deduct value curves for Asphalt Concrete (AC) roadway pavement distresses (20 distresses).
- Implement the ASTM D6433 PCI calculation procedure through a Visual Basic for Application (VBA) language-based program.
- Obtain new deduct value curves through the combination of ASTM D6433 distress deduct value curves to evaluate observed distress in Italian urban road networks that are not defined in ASTM D6433.
- Achieve a simplified new distress identification catalogue for urban road AC pavements to assess the pavement condition at a PCI-based scale. Evaluate the reliability and the accuracy of the new methodology by comparing the PCI values calculated and those with the ASTM D6433 catalogue in an Italian urban road network (109 sample units).
2.2. Statistical Analysis of Distress Distribution in an Urban Road Network
The PCI methodology is a rating system that measures the pavement integrity and surface operational condition based on a numerical scale (Figure 2). According to this methodology, the pavement network is divided into branches, sections and sample units [15]. Pavement surveys are performed in sample units. It is an accurate, consistent, systematic and repeatable rating method based on a visual survey to assess pavement surface distresses by the identification of the type, severity and density of each distress.
The ASTM D6433 defines 20 distress types for AC pavement (Table 1). Each combination of distress density, distress severity and distress type has an associated deduct value as a weighting factor that indicates the influence of each combination on the pavement condition. The ASTM D6433 Distress Identification manual provides guidelines to pavement inspectors to correctly identify each distress type and severity. Each deduct value is determined by using available master curves provided in the Distress Identification Catalogue documented in the ASTM D6433 Appendix X3 [16].
In the context of a previous case study [36,37] aimed to implement a Pavement Management System (PMS) for urban areas considering the Vehicle Operating Costs (VOC), an Italian urban road network was inspected using visual surveys. The pavement distress data were assessed manually by two inspectors with simple tools (a hand odometer wheel and a straightedge). The evaluators were able to inspect the entire Network 1 for a low cost, in a short period of time (a total of two weeks) without high economic commitments, and with minimal road interruptions.
The inspected urban road network (total area of 33,190 m2) was divided into branches and sections according to the definition of the ASTM D6433. A total of 58 Sample Units (SU) at the network level and 127 SU at the project level was inspected. A total sample of 109 AC SU (25,711 m2) was considered in this study, excluding the parking lot areas and those SU related to particular types of pavements (low traffic, pedestrian roads, etc.). This sampling is considered as representative of an Italian road network including SU with different construction dates and characteristics.
To accomplish the objectives of this paper, some statistical analyses were performed within the same sample to determine the distress frequency classified according to ASTM D6433.
The distress density and associated deduct values of each distress type were summed for the entire sample. Distress types were grouped into distinct categories separating those that have a low distress density, those that cannot be grouped with other distresses and those with high density. The results are reported in Table 2.
As observed, there are 7 distresses whose density quantities associated in the inspected urban road network has a very low frequency value (1%); other distresses can be grouped under two different categories by their similar characteristics (4 distresses into category Cracking and 3 distresses into category Surface deformations). Moreover, there are some distress types that cannot be considered under the same group due to their characteristics or due to frequencies or total deduct values that are very high (Raveling, Alligator cracking, Block cracking, Rutting, Patching and Utility Cut Patching and Potholes). This analysis highlights the influence of weight in the network pavement condition of certain defects that have reduced density values but a higher percentage of total deduct value as Potholes. This result agrees with the PCI methodology that assigns a greater weight with respect to other distresses. In another case, (i.e., rutting), the PCI methodology assigns a lower weight with respect to other distresses. However, this does not mean that this distress is less important with respect to other distresses. In fact, the distress rutting appears in the pavement at the end of the degradation process. The same happens for the distress alligator cracking: it appears in the pavement as the final stage of the degradation process.
Therefore, the rutting and the alligator cracking distresses are more likely to be found in pavement with low PCI value.
Those findings have been confirmed in other statistical analyses performed on the same network. Therefore, distress types had been grouped according to the 4 categories defined above (cracking, visco-elastic deformations, surface defects and others) plus the 3 individual distresses (rutting, potholes and alligator cracking).
Considering the results of the statistical analysis of these 7 distresses, grouping the value of the SU into one of three PCI categories (adequate, medium or unsatisfactory) it is possible to evaluate the global progressive degradation in all SU inspected.
In this way, deduct values associated with distress type, severity levels and quantities have been summed and classified under the same PCI category, see Figure 3 and Table 3.
When the PCI value is still high (adequate condition, Figure 3a) the most frequent distresses that occur in the sections are cracking, visco-plastic deformations and surface defects; accounting for 84% of total deduct value in SU. The distresses rutting and alligator cracking are still missing in the pavement, confirming our earlier assumption.
When the pavement degradation is medium (Medium Condition, Figure 3c) the categories Visco-plastic deformations, Cracking, Surface defects and other are the most frequent distresses that occur in the sections; accounting for 85% of the total deduct value in the SU. Finally, the typical distresses associated with the last stages of the degradation progress (potholes and alligator cracking) begin to appear in some pavement sections. When the PCI value is very low (unsatisfactory condition, Figure 3c) the most frequent distresses that occur in the sections are rutting, potholes and alligator cracking. This account for 58% of total deduct value in the SU, along with other distresses from different stages of the degradation progress.
2.3. Computerization of ASTM D6433 Procedure
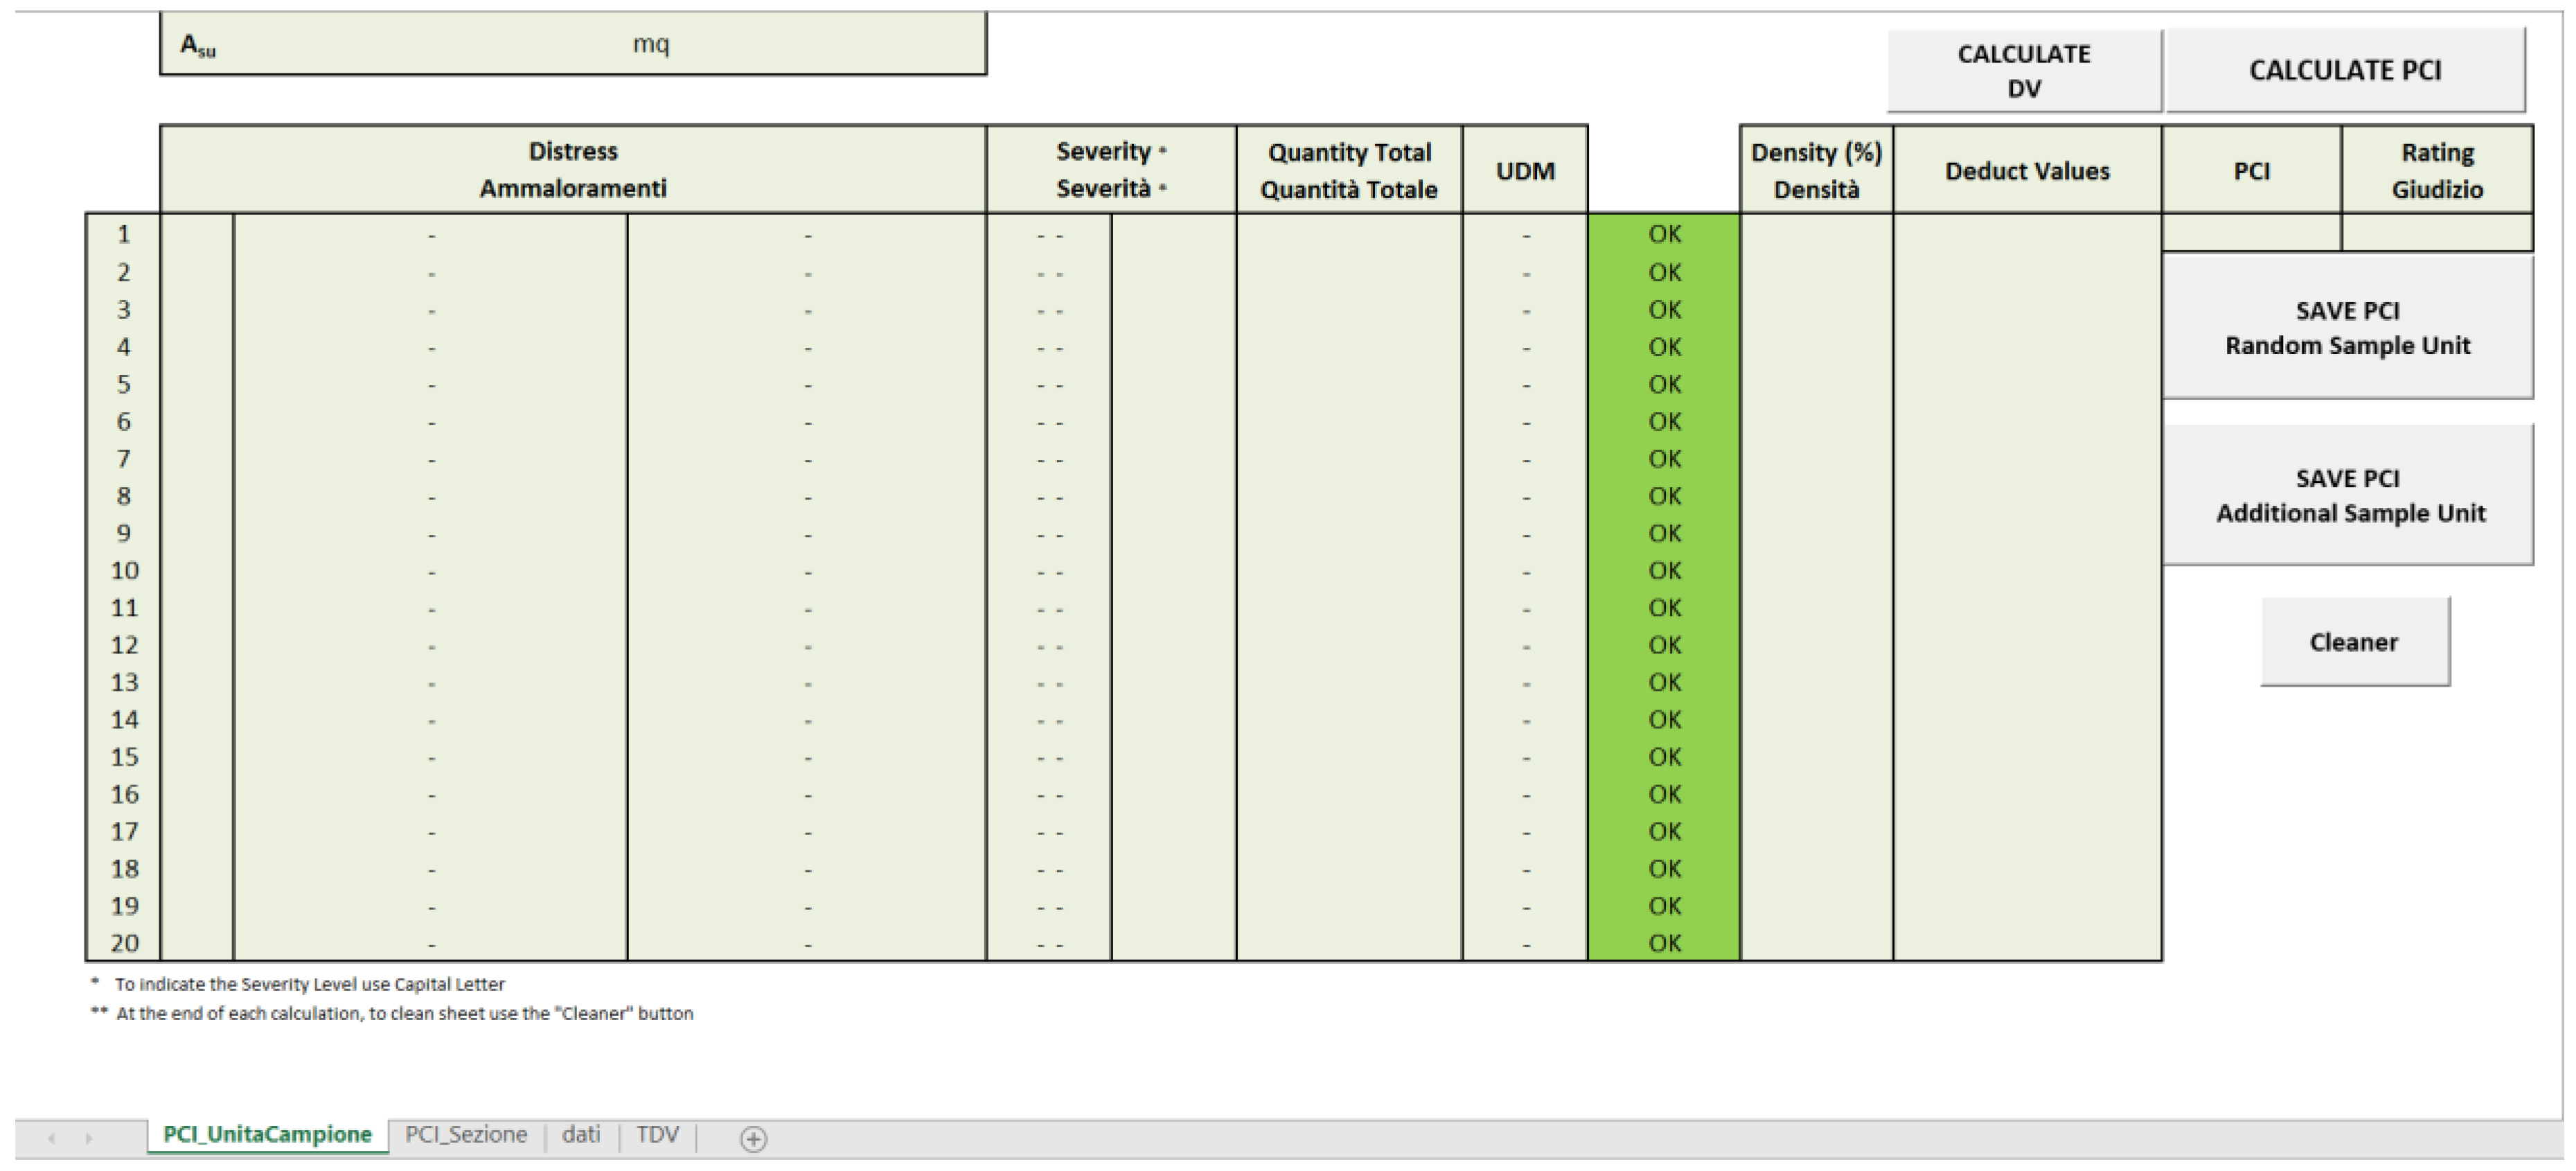
To accomplish the objective of this work, the PCI calculation standardized procedure (1) described in ASTM D6433 was implemented through a VBA language based program to calculate the PCI of each SU. Figure 4 shows the main program window, which enables data entry for a given SU (distress, severity level and quantity), the deduct values and overall sample unit PCI is provided.
It is necessary to use an adequate Distress Identification Catalogue reflecting the characteristics of pavement surveyed and a standardized procedure to make repeatable investigations for the entire network. To this end, some US highway agencies that apply PMS procedures have developed internal reference catalogues for pavement distress identification.
The PCI of each SU is calculated as described in Equation (1), by adding up the total quantity of each type distress, severity level from inspection data, and recording them in the “total severity”. The units for the quantities may be square meters, linear meters, or number of occurrences, depending on the distress type.
PCI calculation involves the determination of the Deduct value to weight each combination of type, severity and density of distress within each SU. Therefore, it was necessary to digitize each density/deduct value curve (master curves collected in ASTM D6433 on paper) to accurately determine the value of the deduct value in an Automated PCI calculation Procedure.
For each distress type (20 in total for AC pavement) and level of severity (generally (L) low, (M) medium and (H) high), an interpolation curve can be determined using a Hermite Polynomial Interpolating Curve. For each density/deduct value curve, the coordinates of 10 points Qi were determined (log10di = Ldi: logarithm of density, DVi: deduct value) from ASTM D6433 Appendix X3 [16]. These points were used to obtain a smooth continuous function in which each piecewise polynomial is a parametric cubic spline specified in Hermite procedure (Figure 5).
For each segment Qi(u) (Ldi(u),DVi(u)), between each pair of known data points, the parametric cubic polynomial expressions can be written as follows:
with u ∈ [0,1] and i = 0, 1, 2, … 9.
For 10 control points given in the plane (Ld, DV), interpolated by 9 cubic polynomial segments, 4 × 2 = 8 coefficients are needed to define each segment, therefore 8 × 9 = 72 coefficients should be determined (4 × 9 = 36 coefficients for each Ld(u) and DV(u) parametric function).
The available equations (for each Ld and DV variable) are the following:
- 2 × 10 = 20 equations for each polynomial segment passing through each pair of adjacent control points;
- 9 equations for first derivative continuity in contact points (C1 continuity);
- 9 equations for second derivative continuity in contact points (C2 continuity).
The total equation count is 4 × 10 − 2 = 38 (76 in total) while the needed equations are 4 × 10 = 40 (80 in total).
To obtain the other 2 equations (4 in total) it was necessary to set tangent and/or curvature values at the first and at the last control points, through first and/or second parametric derivative values. The system of equations can be expressed through control point coordinates, first and second derivatives of the 9 internal and the 2 external control points.
In this way, for the i-th polynomial segment of each curve in the parametric plane (u, Ld or u, DV), see Figure 6, the equations, for example, consider the variable DV (the same for Ld):
and the equations expressing the first derivative at the beginning (Di−1) and at the end (Di) of i-th polynomial segments are:
In the Equations (3) and (4), DVi−1, DVi, Di−1 and Di are respectively the control points coordinates and the first derivative value (at the beginning and at the end of i-th segment). From Equations (3) and (4) it is possible to obtain algebraic expressions of coefficients:
To obtain the C2 continuity, it is necessary to impose the following second derivative conditions in the 9 internal control points (6):
with i = 1, 2, …, 10; obtaining (7):
Then, substituting the algebraic expressions of coefficient (5) in (7) the expressions of second derivative of curve are obtained (8):
and simplifying (9):
If the second derivative at the endpoints is equal to zero, the “natural” cubic spline is obtained. By imposing the second derivative condition at the first subdomain of the piecewise (i = 0), Equation (10) is obtained:
Substitute the algebraic expression of coefficient (5) with (10), the following expression (11) is obtained and simplified (12):
Similarly, for the last subinterval of the piecewise (i = 9):
The Equations (9), (12) and (13) can be collected in matrix form. The 10 unknowns are grouped in D = [D0, D1, …, D9] that can be calculated by inverting the tridiagonal matrix H (and similarly for Ld variable):
Knowing the coefficients of each segment of the curve (for all distress and for all levels of severity), it is possible to calculate, starting by a value of density, the corresponding value of deduct value and so on.
The next step is the calculation of maximum Corrected Deduct Value (CDV) that will be subtracted from 100 obtaining the PCI of the sample unit. The PCI within each section is calculated by averaging the PCI of each sample unit.
The whole algorithm was implemented writing a code in VBA (see Figure 4) and capable of calculating the PCI of a section starting from its distress.
2.4. Definition of New Distress Identification Catalogue for Asphalt Concrete Pavements in Urban Areas
One of the objectives of this work is to achieve a simplified new distress identification catalogue for urban road AC pavements to assess the pavement condition in a PCI based scale. This section is intended to propose a simplified distresses catalogue comparing that one contained in ASTM D6433 considering the results of statistical analysis presented in this article (Table 2 and Table 3) on a representative sample of an urban pavement road network.
Although the list of distresses in ASTM D6433 appears complete and exhaustive, the use of such a catalogue for urban pavements could be difficult to apply for the road network operators and maintenance agencies have little incentive to adopt a PMS.
In addition, the use of ASTM D6433 catalogue has shown difficulties for some inspectors of urban pavements due to the widespread presence of pavements distresses that are not listed in ASTM D6433.
Specifically, Manholes and Tree roots. These distresses, before this proposal of integration, were associated with other distresses respectively as Patching and Swell. However, it was often very difficult to instruct the inspectors on the choice of the type of distress to be attributed, so much so that often these distresses were completely neglected during inspections.
For this reason, it was considered appropriate to drastically reduce the number of distresses (from 20 to 10 distresses) present in the catalogue for the calculation of the PCI and add the two missing distresses. These adjustments should be made in order to avoid distorting the PCI numerical significance in its rating scale that appears to be universally accepted.
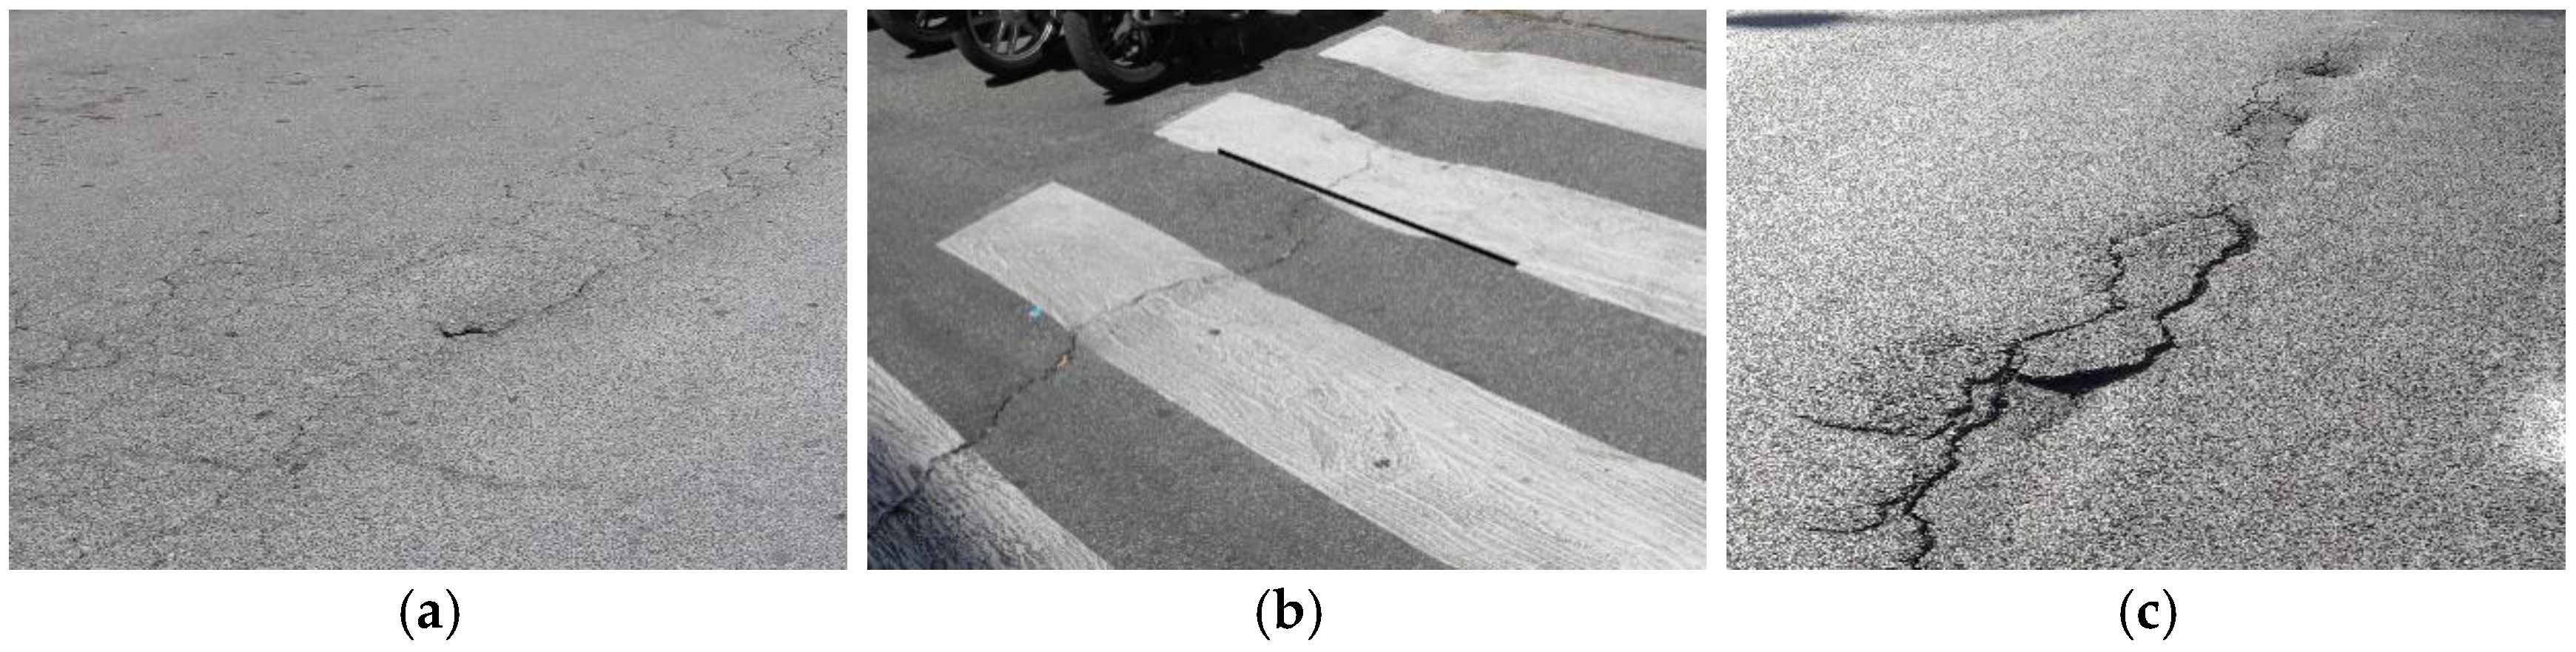
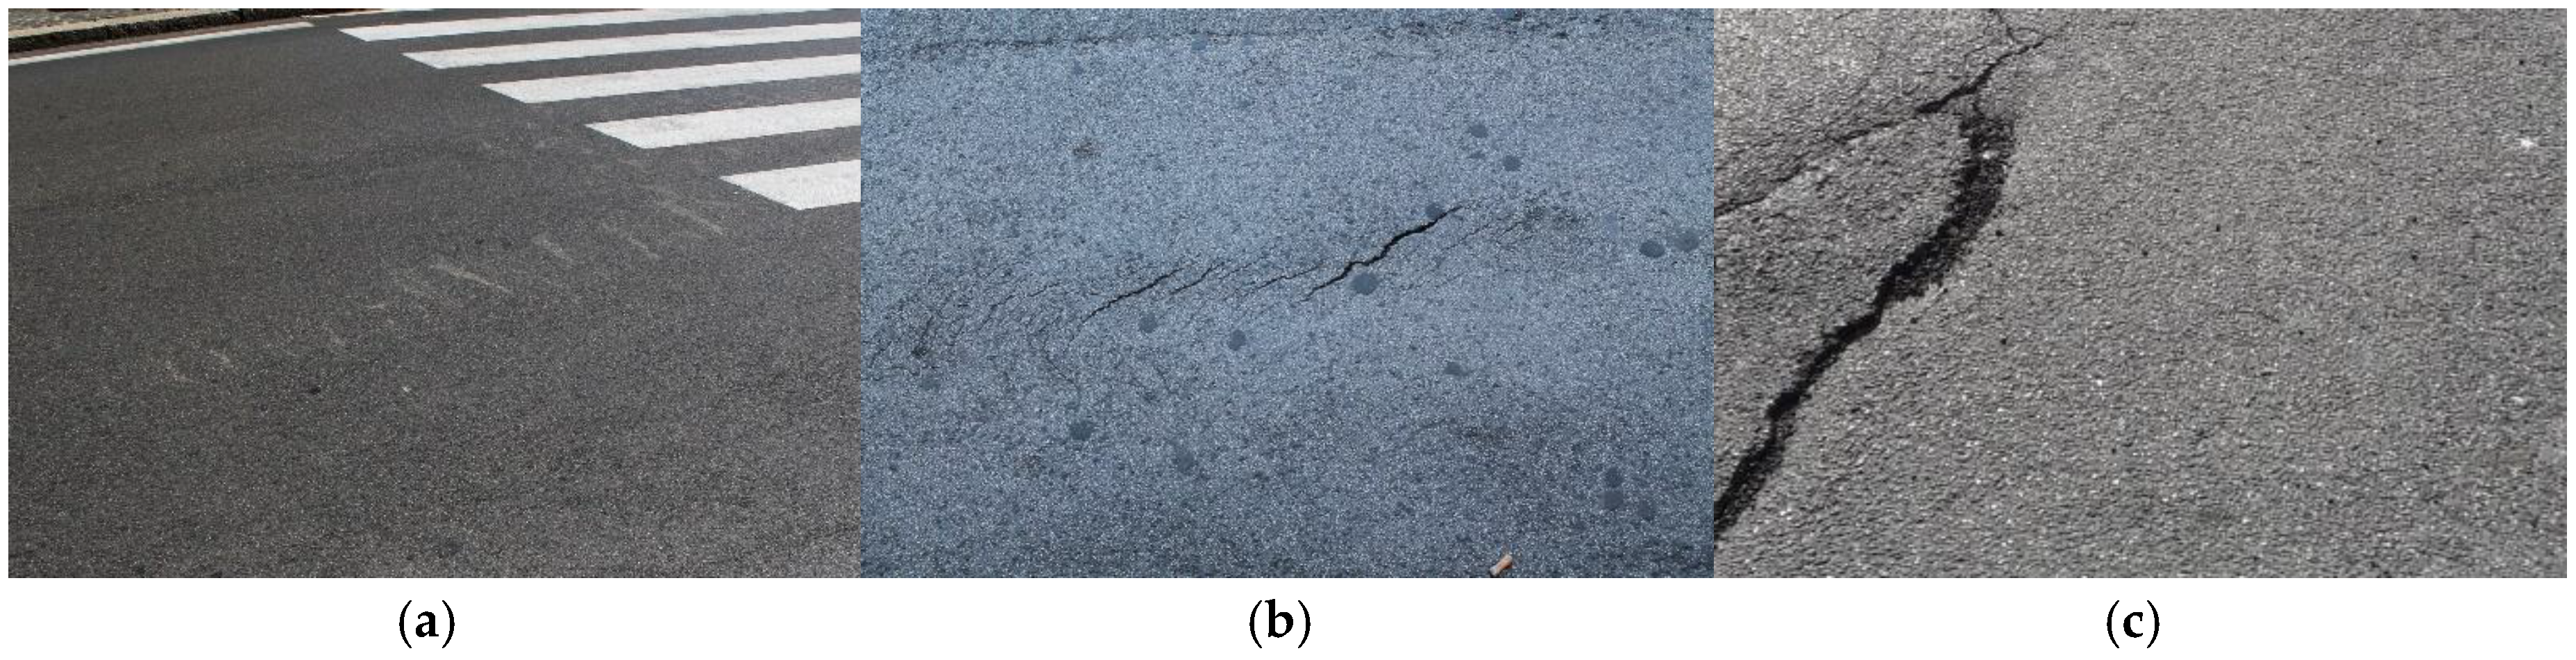
Consequently, to upgrade the ASTM D6433 catalogue for application on Italian urban roads, some distress types collected in the ASTM Standard Guide and whose quantities are measured in the same unit of measurement and belonging to the same group are combined with each other to facilitate the inspection activity as indicated in Table 4. Four new defects have been defined by combining others—N_3. Linear and isolated cracking (Figure A1), N_4. Surface deformations (Figure A2), N_6. Failure surface grip (Figure A3) and N_10. Slippage cracking (Figure A4); and two new distress types are defined—N_11. Patching (Figure A5) and N_12. Tree Roots (Figure A6); six distresses remain unchanged (N_1. Alligator cracking, N_2. Block cracking, N_5. Rutting, N_7. Potholes, N_8. Patching and N_9. Railroad crossing).
The proposed Distress Identification Catalogue is composed of 12 distress types, listed and classified in different groups. In the same way, the Distress Identification Catalogue defines for each distress type, (1) a description of the distress type; (2) a guide to determine the severity levels; (3) how to measure and count the distress type and severity; (4) representative photo (s) to help inspectors to identify the severity level of distress and; (5) the deduct value curve for each distress type.
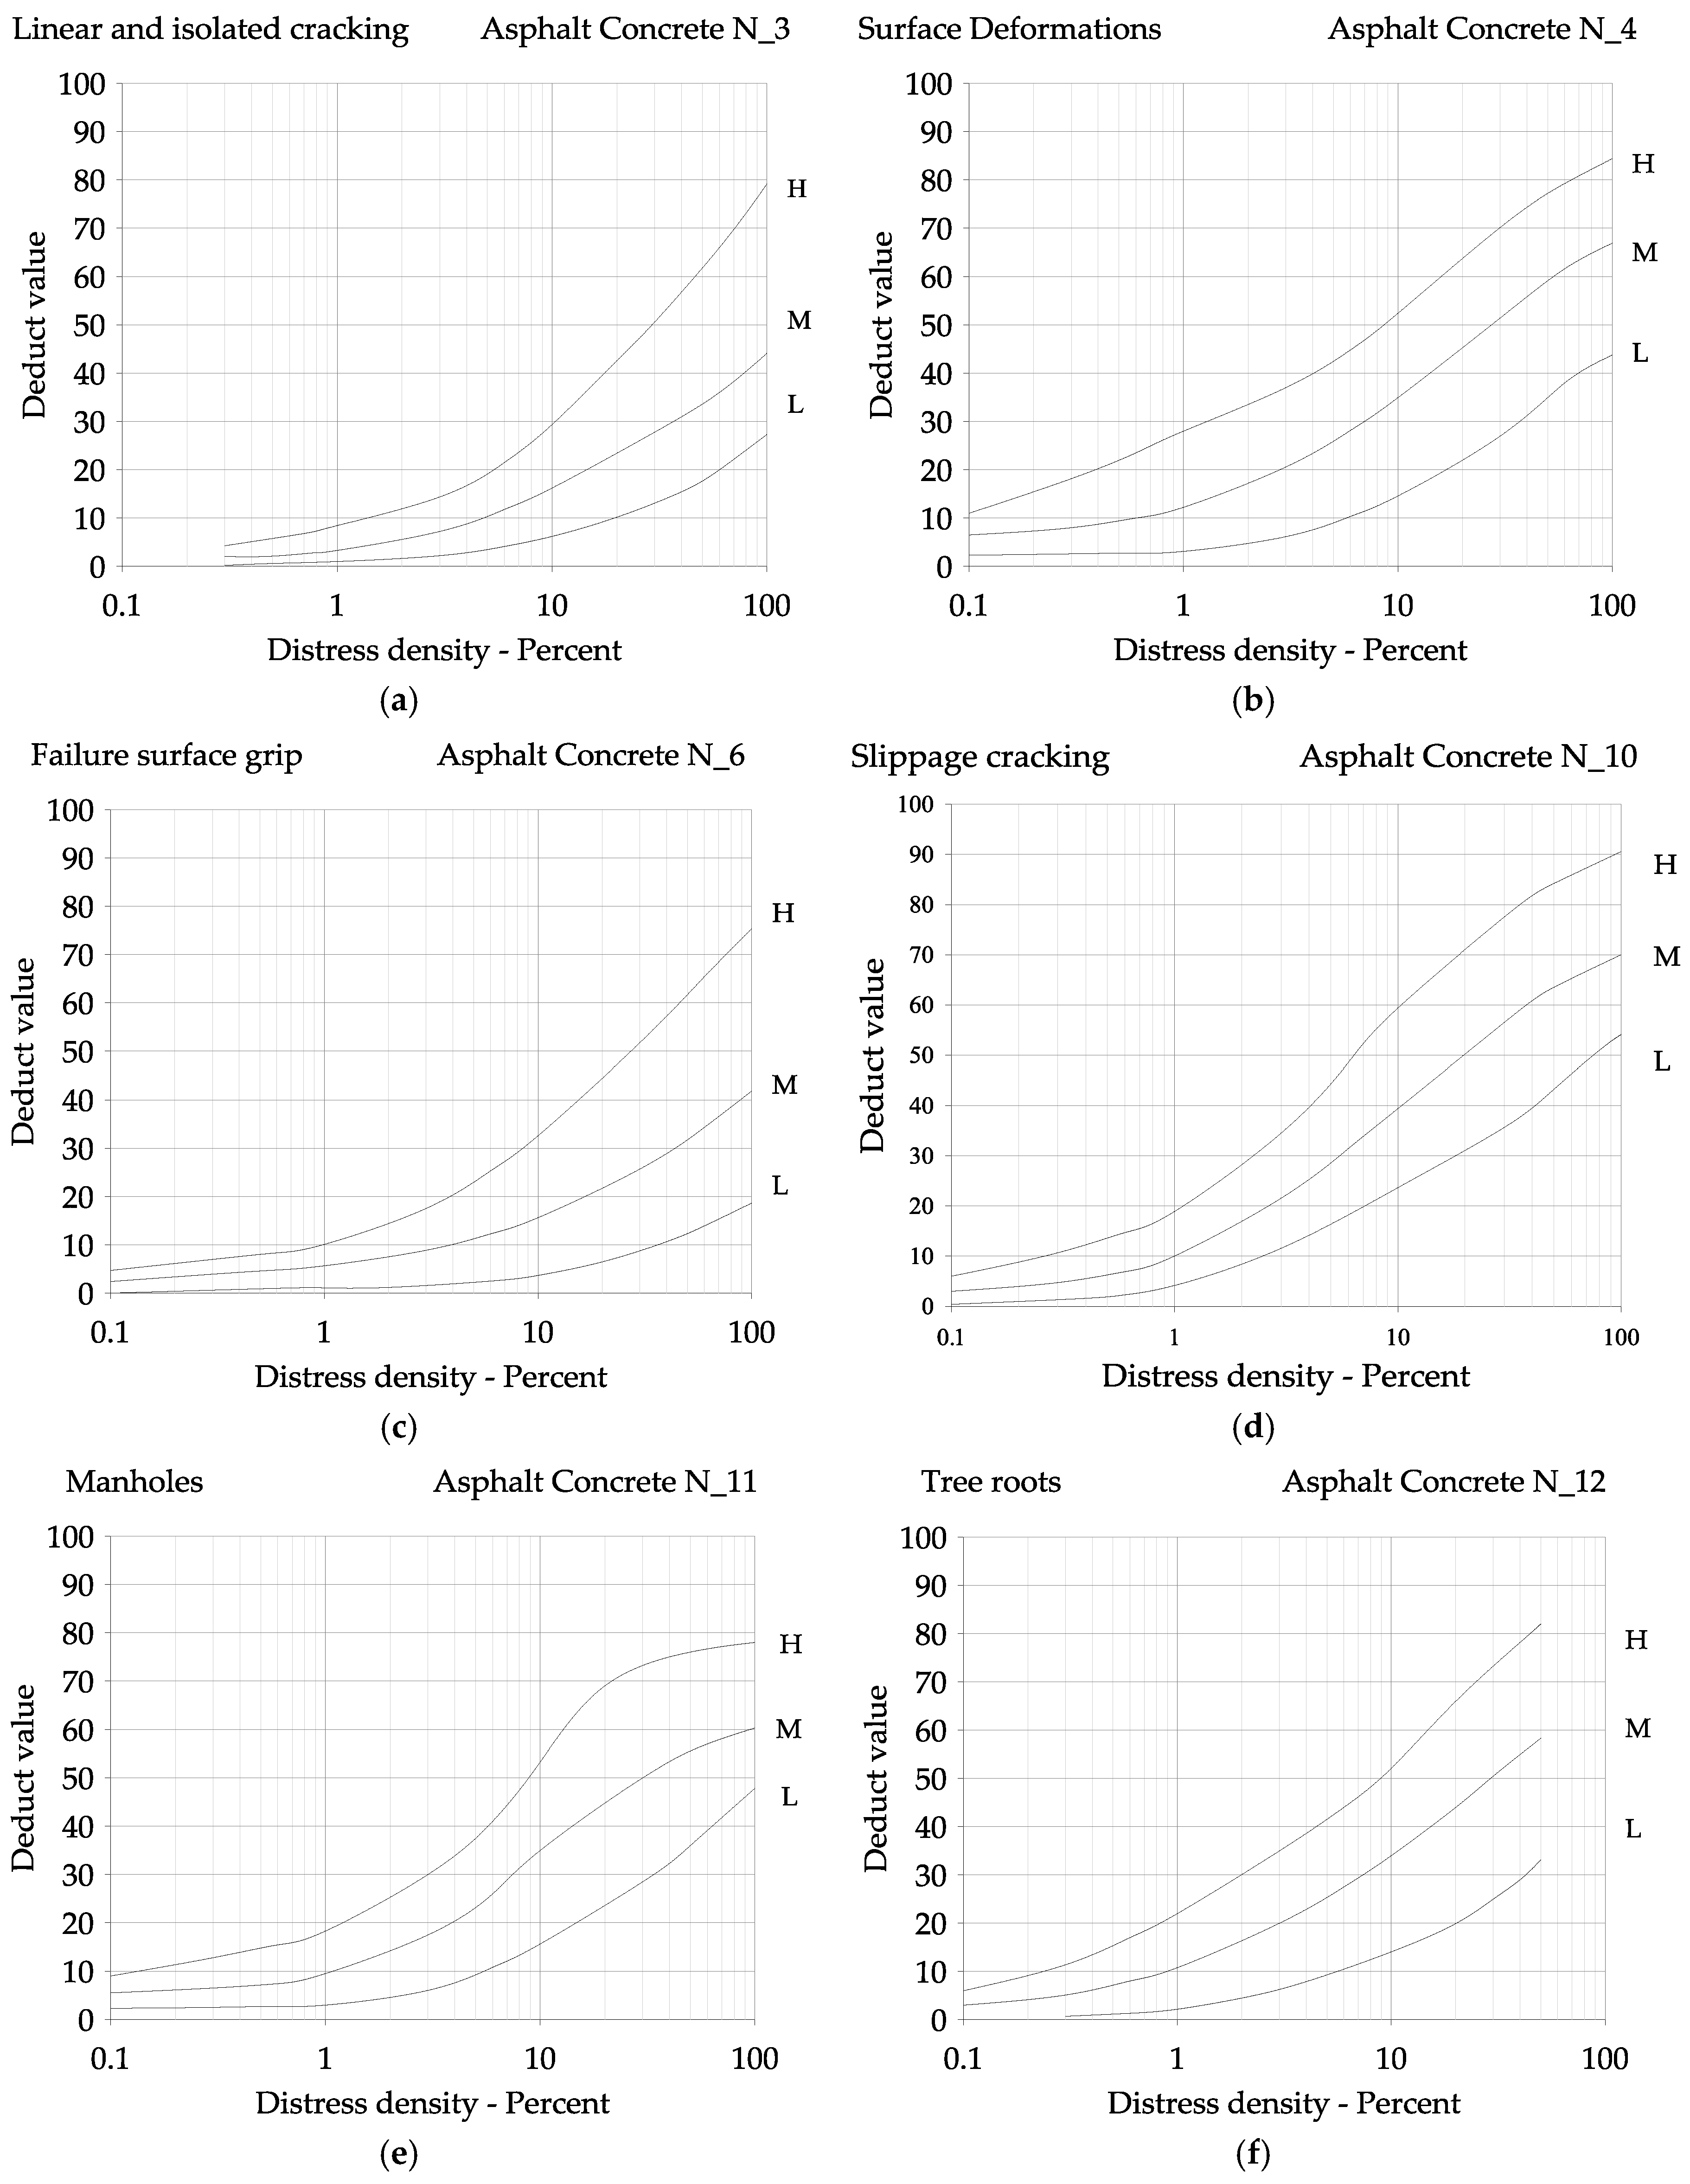
The deduct value curve of new distresses is obtained as a combination of the ASTM D6433 deduct value curves of they are composed. The new deduct value curve was written as a continuous function using the Polynomial Interpolating Curve Hermite for the interpolating of ten pairs of values (density, DV) obtained by averaging the ten pairs of values (density, DV) of each deduct value curve that has to be combined (Figure A7). These inspection guidelines for the new distress definitions for urban road pavements are defined in Table 5 and Appendix A.
The new distress type N_3. Linear and Isolated Cracking definition was obtained as the combination of ASTM D6433 7. Edge cracking; 8. Joint reflection; 9. Lane/Shoulder drop-off and 10. Longitudinal and transverse cracking, all of those distresses classified as cracking and measured in linear meters, allowing the inspector recording these distresses under the same code.
Likewise, the new distress N_4. Surface deformations is defined as the union of distresses classified under the same, group Visco-plastic deformations: ASTM D6433 distress 4. Bumps and sags, 5. Please check. Corrugation, 6. Depression and 18. Swell, measured in square meters, being much simpler to identify.
Distress N_6. Failure surface grip, classified under the Surface defects group is obtained as the combination of ASTM D6433 distress 2. Bleeding, 12. Polished Aggregate, 19. Raveling and 20. Weathering, measured in square meters.
Similarly, distress N_10. Slippage cracking is defined as the combination of ASTM D6433 distresses 16. Shoving, 17. Slippage cracking, both distresses are measured in square meters, to consider the traffic tangential action. These distresses can be found in roadway points where there are repeated braking and accelerations linked to roadway areas overlays are poorly bonded with the underlying layer.
The main novelty of proposed distress identification catalogue for urban road pavements assimilates two innovative distress definitions in the catalogue that ASTM D6433 does not consider; N_11. Manholes and N_12. Tree roots.
For the first distress, this choice is motivated to catalog the catch basins and manholes in pavement condition assessment due to their importance as a singular and very common distress in Italian Urban Roads (Figure A5). This innovative definition allows considerations of the catch basins, manholes. These features have a strong presence in urban roadways and induce other distresses in surrounding areas that very negatively affects drive quality and causes damage to the vehicles. These distress are not currently considered by the ASTM D6433 PCI calculation procedure. The quantities of this distress are measured in square meters
Another distress that the Standard Practice ASTM D6433 does not include is N_12. Tree roots distress. This defined on the new distress identification catalogue for urban areas for its importance and its wide presence in Italian Urban Roads (Figure A6). The appearance of this distress is linked to the presence of large trees in the roadside of urban streets which may create a raise in the pavement on the road side and /or a break in the pavement leading to accidents and vehicle damage.
The density-deduct value curve associated with N_12. Tree roots is calculated as the combination of ASTM D6433 11. Patching and Utility Patching and 18. Swell. The severity level should be considered by the Table A1. The quantities of this defect are measured in square meters.
3. Results
As mentioned above, the new definition of the catalogue distresses, motivated by simplifying identification and defining the two new distresses, should not distort the PCI value. In addition, it is necessary to validate the digitization of density/deduct value curves to verify the correctness of the calculations.
Therefore, the results analysis was divided into three various different stages. In the first stage, a comparison between the sample units’ PCI obtained with commercial software PAVERTM and the sample units’ PCI calculated using the proposed procedure is conducted of the total sample of 109 sections of the Italian Road Network.
This comparison was used to validate the procedure adopted to interpolate deduct value curves for the ASTM D6433 Distress Identification Catalogue.
Next, new analytical density-deduct value curves were generated for the new distresses and a specified procedure for distress identification and assessment for urban road surfaces was conformed. In this second stage the two new distresses (N_11. Manholes and N_12. Tree roots) were not considered to evaluate whether the merging of the various distresses into the distress categories it can work. When these distresses were found in the sample unit, the calculation of the PCI was replaced by Patching and Swell. The objective of this second stage is to demonstrate that new deduct value curves can be obtained by the combination of the deduct value curves collected on ASTM D6433 and can be used to define new ones without a large variation in terms of PCI.
Finally, the last stage consisted of calculating the sample units’ PCI using the new distress identification catalogue proposed by the reduction of the number of distresses from 20 distresses to 12 distresses as presented above. The objective of this third stage is demonstrate that new distress identification catalogue for urban road pavements can be used without a large variation in terms of PCI.
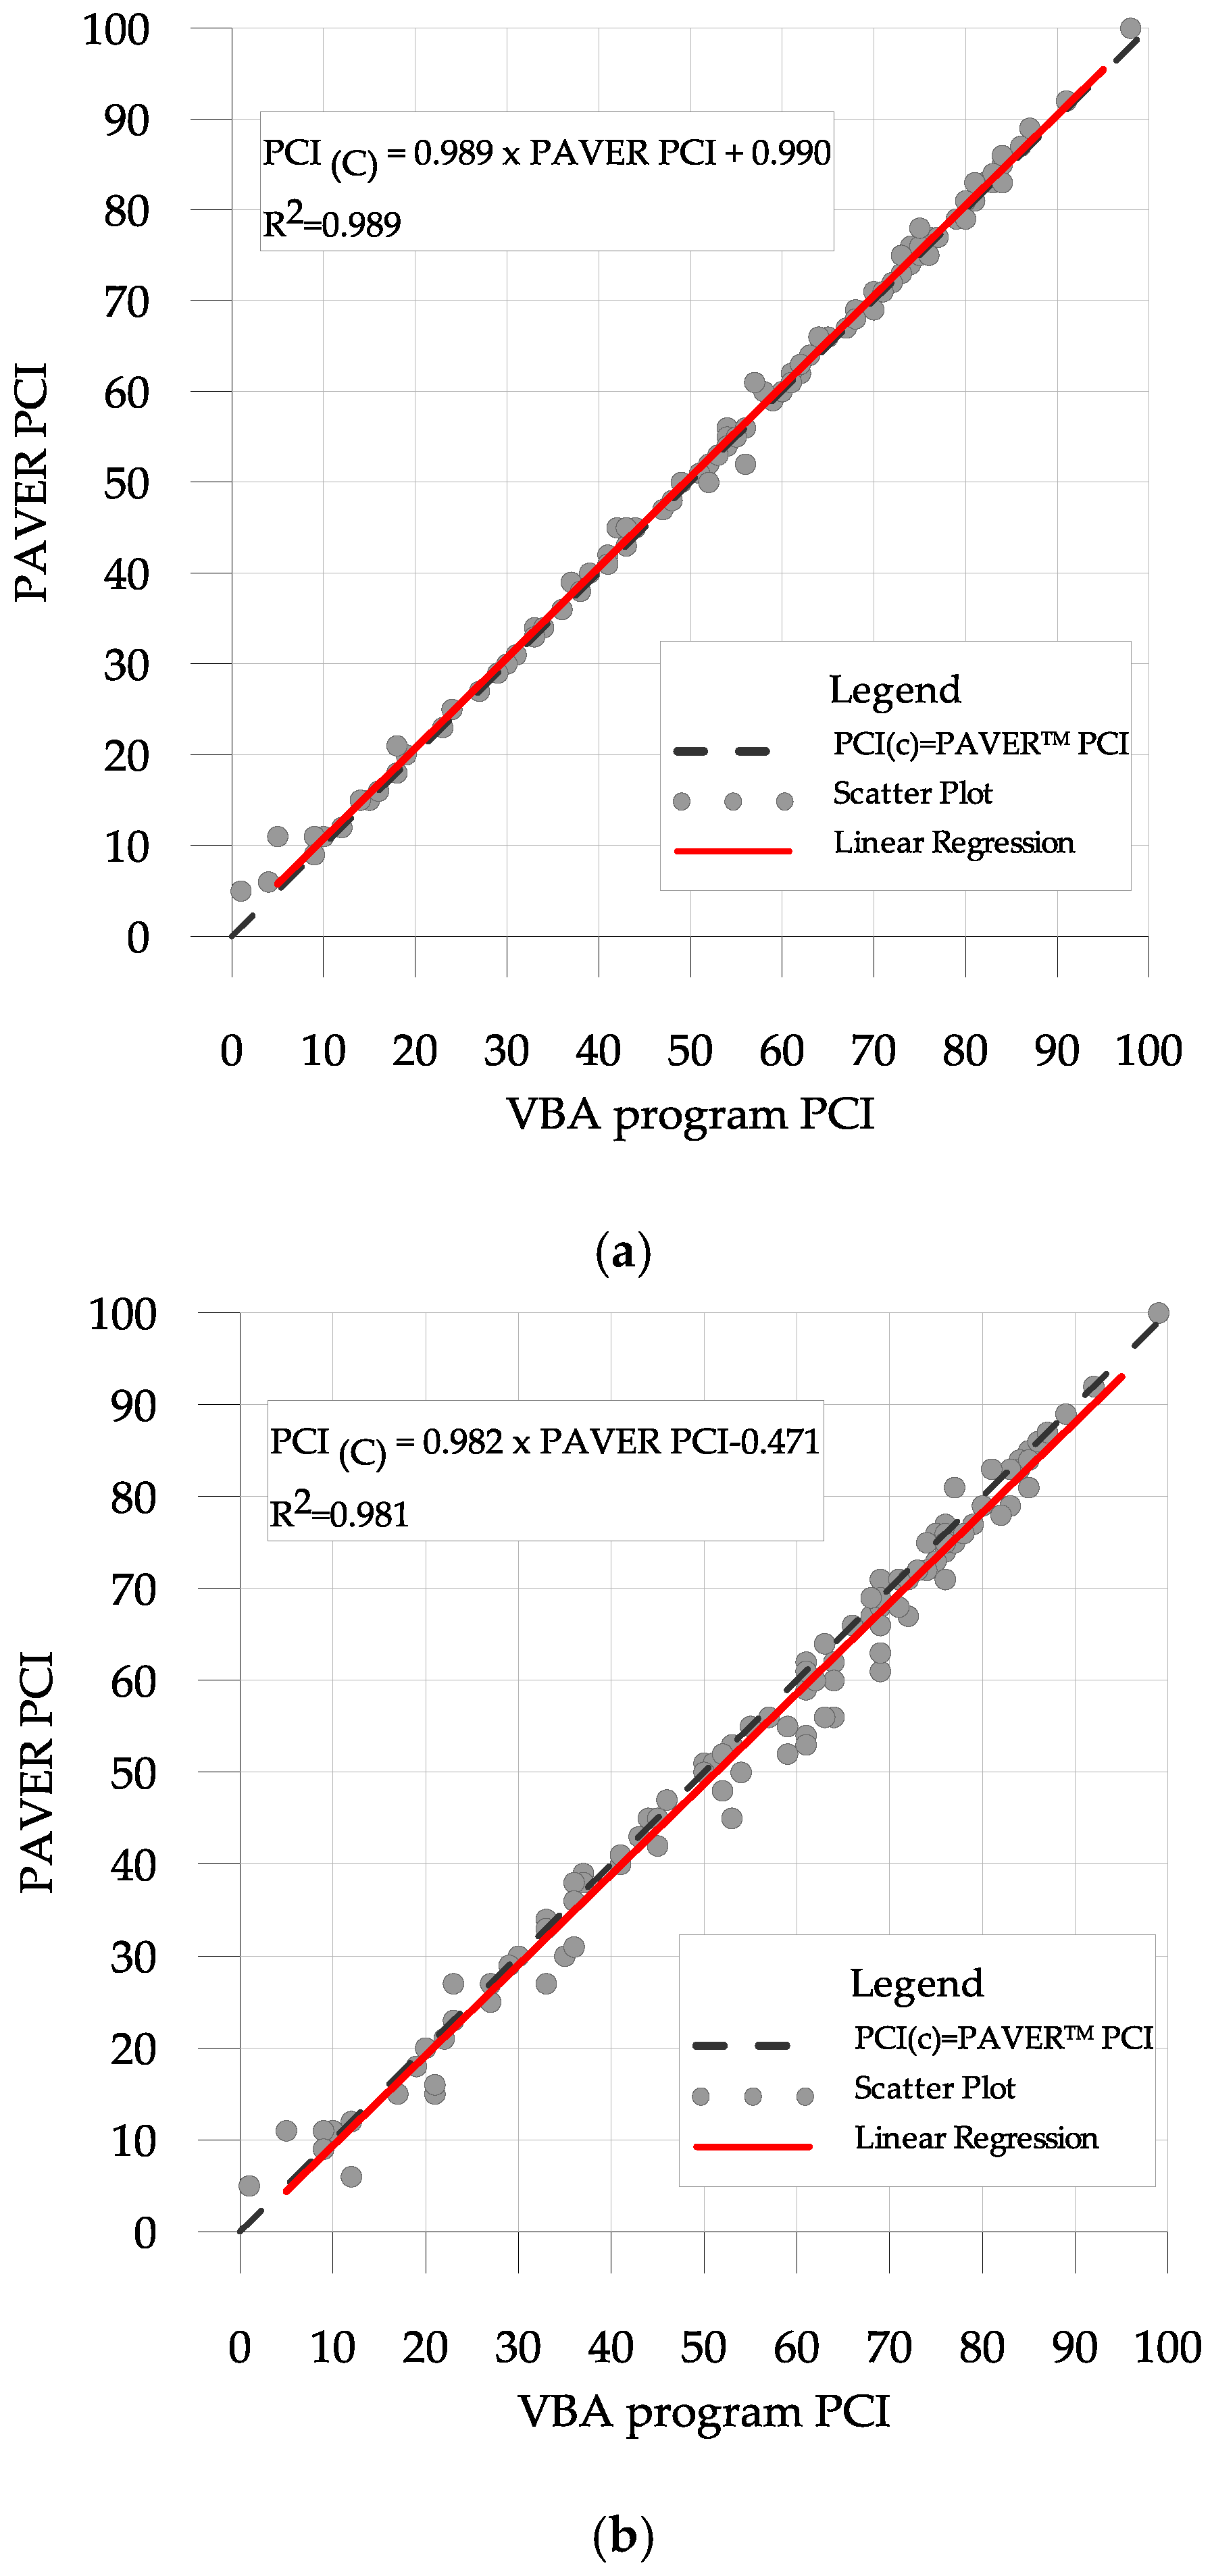
Considering 109 SU belonging to the urban network, PCI was calculated with both the PAVERTM program and with the VBA program, considering the definition of ASTM D6433 distresses. The results of this regression are shown in the Figure 7a.
Next, the PCI was calculated with the VBA program following the definition of distresses by the merging of distress in the categories (in total 10 distresses); the regression with the PCI calculated with the PAVERTM is shown in the Figure 7b.
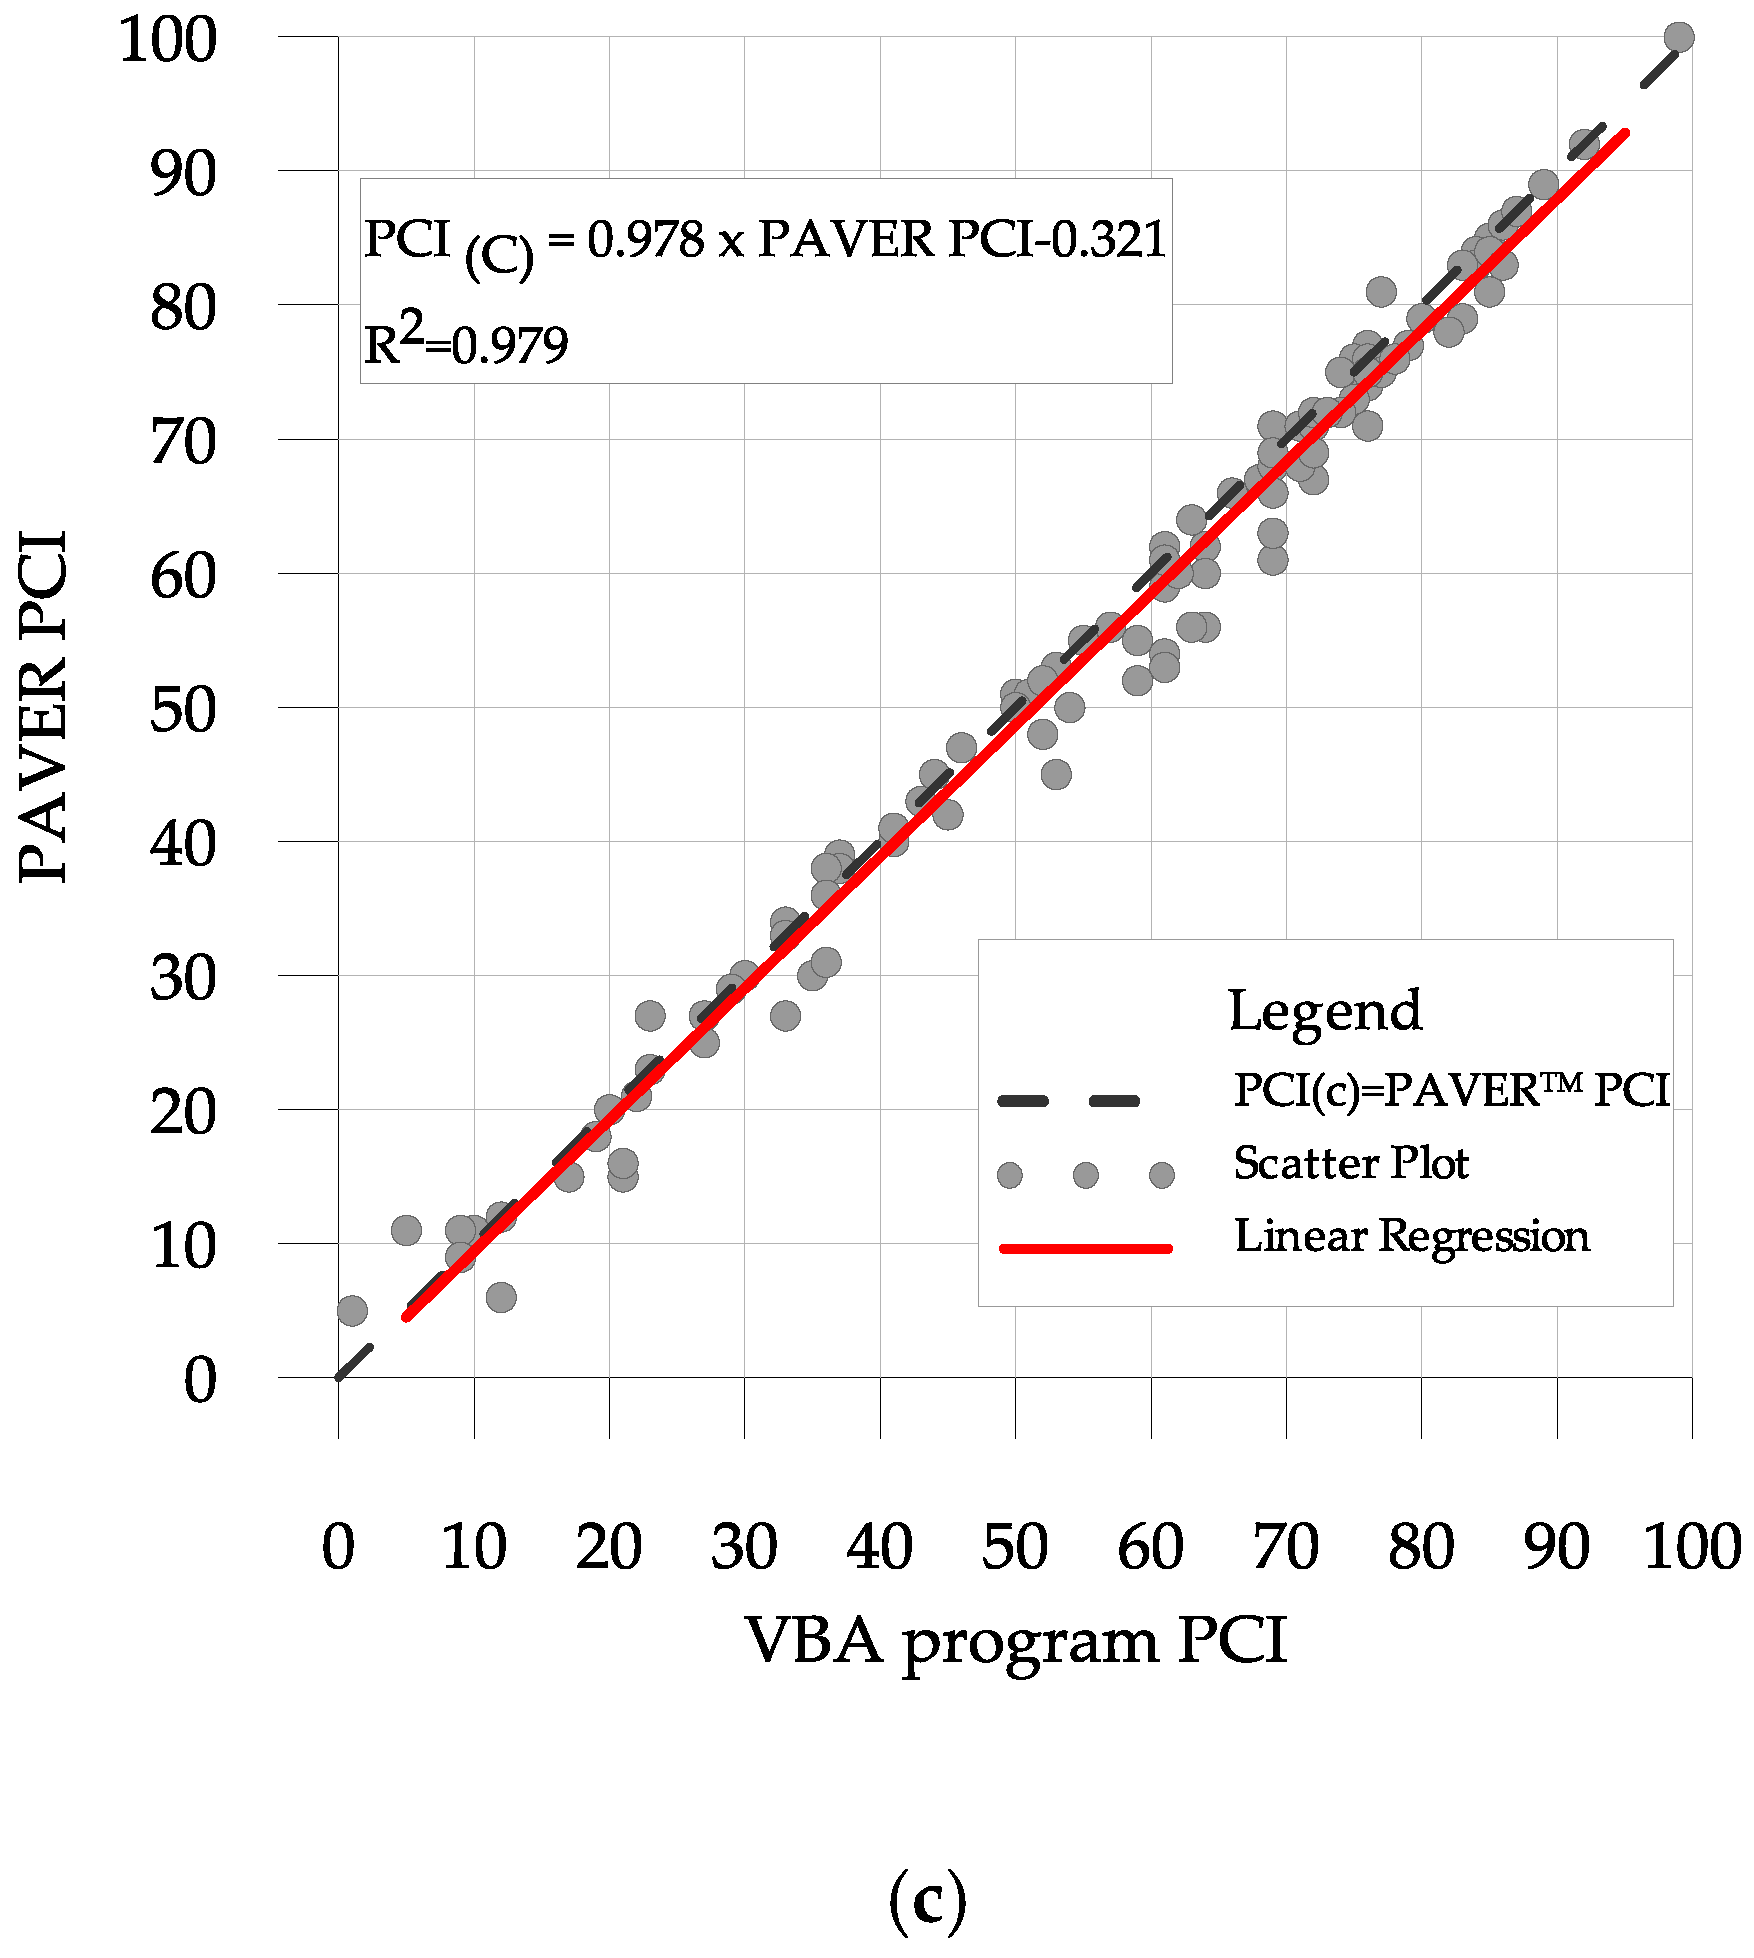
Finally, the PCI was calculated with the VBA program and using the definition of the 12 distresses (including the new ones for a total of 12 distresses); the regression with the PCI calculated with the PAVERTM is shown in the Figure 7c.
As observed from the Figure 7, there is a strong correlation with the PAVERTM software PCI value and calculated PCI through the automated procedure. In fact, the coefficient of determination, R2, is very close to 1 in all cases, increasing from 0.979 (New distress identification Catalogue including N_11. Manholes and N_12. Tree roots) to 0.989 (ASTM D6433 PCI—20 distresses). The results of statistics regression are reported in Table 6 and Table 7.
Table 6 shows the results of the ANOVA-F test performed to test the overall (global) fit of the regression model, which is used to perform a statistical hypothesis test to compare an idealized null hypothesis (H0) that proposes there is no relationship between the two data sets and the alternative hypothesis (H1) states that there is a linear relationship between both data sets. The best regression results are found for the automated procedure for the PCI calculation (20 distresses) for which the lowest value of unexplained variance is 5.76. For these reasons, the values of the F statistic (MS Regression/MS Residual) for all the tested automated procedures are higher than 4914 with a Significance F less than 2.94 × 10−91, that is, the observed data are inconsistent with the null hypothesis. So we can surely reject null hypothesis and state that there is a very good correlation between commercial software PAVERTM PCI and the SU PCI calculated using VBA language based on an automated procedure.
The comparison between the results of both analyses showed us that the standard errors calculated by the two regressions are very close. Certainly, the linear regression has a slope equal almost to 1 for all cases, near the theoretical line which indicates that the automated procedure calculation, and the PAVERTM PCI can be assumed to be the same, demonstrating the efficiency of the automated procedure calculation and the reliability of the constructed functions of deduct value curves.
4. Discussion
The proposed new distress identification catalogue can be used in the same scale of the standardized PCI with several advantages for the assessment of urban road surfaces. The advantages of the proposed method consist of the simplification of the pavement surveys (12 distresses instead of 20 distresses) and the identification of pavement distress very frequent in urban roads and others such tree roots and artificial elements (catch basins and manholes) not considered in the ASTM D6433 distress catalogue.
For example, these artificial elements, in the ASTM 6433 method, could be considered as 11. Patching and Utility Cut Patching, but this assumption is subjective to the inspector judgement and it has been found that often the inspectors completely neglected the inclusion of these distresses in the Pavement Condition Survey Data Sheet or included these as other not appropriate/unsuitable type of distress. This obviously caused a consequent reduction in the PCI value on the SU with an underestimation of the general conditions of the network.
Another example is the definition of the tree roots distress that is a very common distress in Italian Urban roads networks. The ASTM D6433 catalogue does not define this type of distress but it could be associated with the 18. Swell distress definition, but the deduct value curves associated with this distress are not defined for values of density <1 and severity level definitions are based only in the influence of the distress in ride quality. Moreover, the new distress identification catalogue includes in the definition of N_12. Tree roots distress the influence of the height of tree roots above road surface and the influence that this distress has on the traffic based on the position of the roots inside the roadway section; the associated deduct value curve is defined for all range of the density inside the sample units.
The possibility to define new types of distress allows the manager to define the most appropriate techniques to use for preventive and corrective maintenance in order to have, in the economic evaluation stage of the alternatives, the correct quantification of workings.
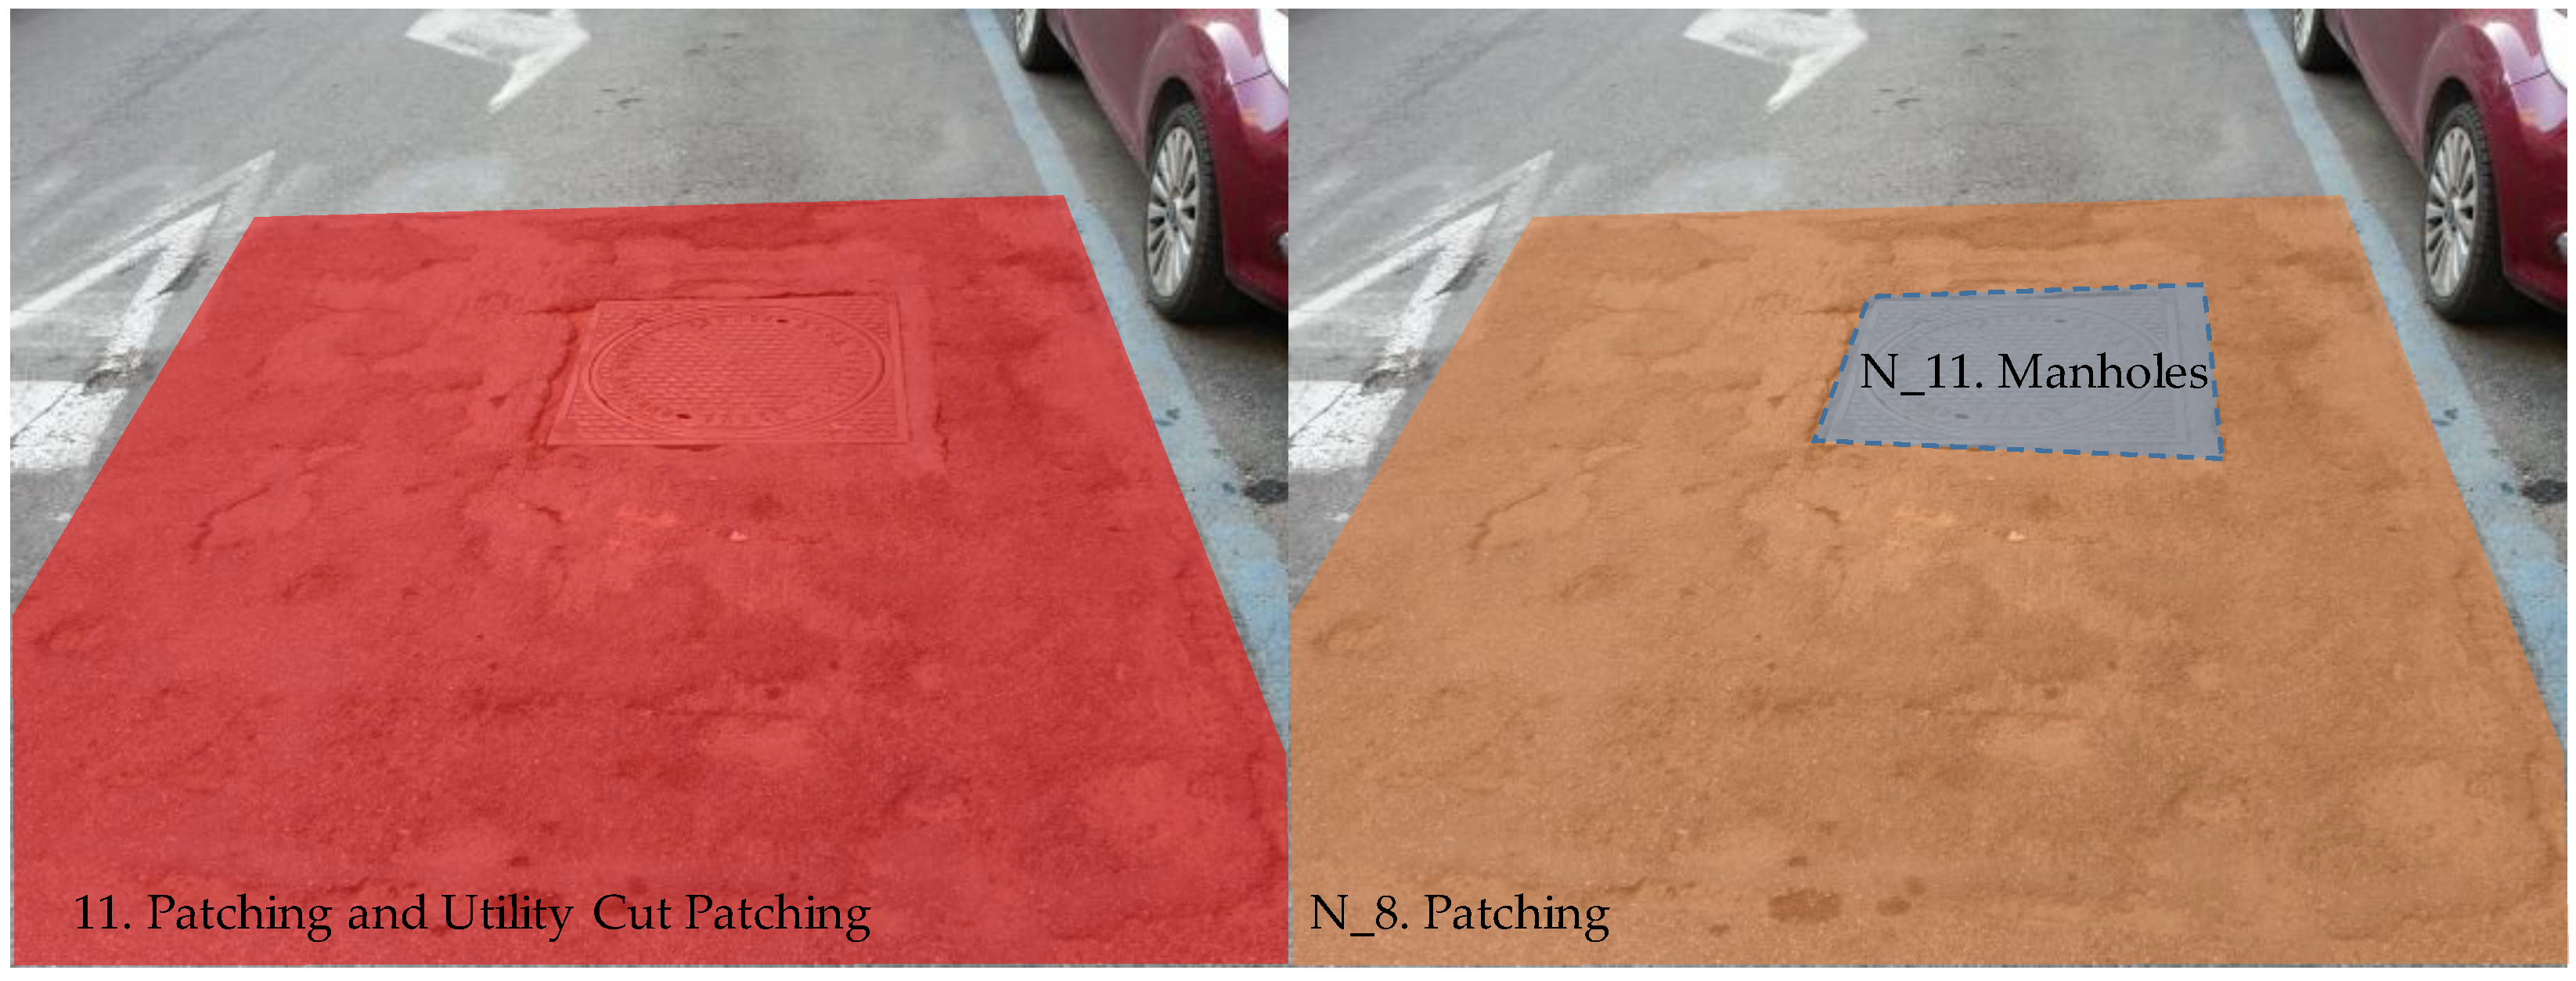
In fact, considering the case of Manholes, often for this distress type there is no need to provide any maintenance intervention unless the damage is propagated outside of the manufacturer (see Figure 8). In this case, it would be appropriate to consider separately the two distresses: the “artificial” due to the surface discontinuity of the pavement and the “natural” result on the pavement in consequence of previous distress.
To complement the explanation expressed above, a comparative analysis between both distress identification catalogue methodologies is included (see Table 8 and Table 9). This study compares the distress identification sheets of two SU of the studied road network.
On the one hand, Table 8 shows a SU with manholes which are considered according to the ASTM catalogue as 11. Patching and Utility Cut Patching medium severity. The new distress identification manual allows the inspector to consider the influence of those artificial elements in ride quality when these create a vertical discontinuity in the pavement so, the inspector should consider the presence of manholes in SU as a N_11 Manholes High Severity (See Appendix A). This is reflected in a higher calculated DV value, this leads to a lower value of overall SU PCI value which causes the rating of the SU to fail (poor condition).
On the other hand, Table 9 gives an example of a SU with tree roots. As stated above, the tree roots have to be considered as 18. Swell according the ASTM D6433 catalogue. The position of the root within the section or its traffic influence is not considered in distress identification. However, since it is located in the pathway of SU analyzed, the inspector should identify the distress as a N_12. Tree roots, High level severity according the new distress identification manual for urban roads catalogue. As a consequence, the associated DV for this type of distress in those sections is significantly higher, changing the PCI rating scale category from Fair to Poor (see Figure 2). Besides, the use of new distress identification manual for urban road pavements facilitates the inspection and makes it faster by grouping various distresses by their similar characteristics, as can be noted at Table 9.
Therefore, the use of the new distress identification manual for urban road pavement allows us to consider the traffic influence of these common distresses in urban areas, which is reflected in a correction of overall SU PCI, declining the PCI rating category of sections when any of these elements arise.
Another significant advantage of this methodology is the reduction of the number of distresses of the catalogue without causing a substantial change in the PCI value. In general, it can be noted that this reduction is only applicable in the case in which the contribution of these removed distresses slightly varies the PCI value. In the present study, this has been verified through the regressions reported before, but in the future, the applicability of the proposed catalogue should be verified by an extensive campaign of inspections in urban road that can confirm the results presented here.
This has been verified through the regressions reported before, but in the future, the applicability should be verified by an extensive campaign of inspections that can confirm the results presented here.
5. Conclusions
This work proposed a methodology based on the definition of new deduct value curves to complete the ASTM D6433 Distress Identification Catalogue to assess the urban road pavement surfaces. For this, the authors implemented a procedure for the determination of new distress deduct value curves to include new distress definitions—manholes and tree roots—which are defects that are very present in urban areas and have not been collected until now in the distress identification catalogue (Appendix A).
The algorithm used for the digitalization of existing distress deduct value curves and the automated procedure for the calculation of the PCI should be a useful tool for pavement engineers and managers by allowing the implementation and the automatization of pavement agency customized index for surfaces’ overall condition assessment eliminating time-consuming procedures.
A sample of 109 AC urban pavement surfaces was considered. By the statistical analysis of detected distresses included in this sample the most recurrent defects, those never encountered and those not defined with respect to the list collected in ASTM D6433 have been determined by statistical analysis.
The comparison of the PCI value using the new distress identification catalogue and the values obtained using the commercial software PAVERTM was performed. The results highlighted the suitability of the proposed automated distress procedure for the calculation of the PCI.
The method implemented using the new distress identification catalogue, therefore, determines PCI values close to those can be obtained applying the ASTM D6433. Conversely, the method could be very severe for the SU which presents many distresses like manhole covers and for tree roots. In fact, these distresses are not considered in ASTM D6433 and the inspectors often do not consider them or substitute them with another distress.
Moreover, the accuracy in distress identification and pavement condition assessment is always linked to a mandatory operator training for the correct distress identification in urban roads since the assessment is always subject to a subjective judgement.
Finally, from the analysis of the results it is possible to state that specific urban road distress can be acquired through the definition of new deduct value curve and the results provide strong correlations with the inspected survey data using the ASTM D6433 distress catalogue and provide to small and medium agencies of a valid tool for the assessment of their urban road network with reduced costs implementation. The authors want to clarify that this method is proposed for the assessment of urban road surfaces and it may not be suitable for the condition assessment of suburban pavement surfaces.
Acknowledgments
The author would like to acknowledge Melania Perrone for her assistance with the development of the VBA language based procedure used in this article as a part of her Master’s degree Thesis. The authors would like to thank David Rosati for the pavement data inspection data of an Italian Road Network as part of his Master’s degree Thesis. A special thanks to Paola Di Mascio for comments that improved the paper.
Author Contributions
Giuseppe Loprencipe had the original idea for the study and the development of a new distress identification catalogue for the assessment of urban road surfaces. Antonio Pantuso performed a statistical analysis of inspection data and elaborated distress definition and inspection guidelines for the new distress identification catalogue for urban road pavement. Antonio Pantuso wrote sections for the first draft of the manuscript. All authors contributed to further drafts and had full access to all of the data.
Conflicts of Interest
The authors declare no conflict of interest.
Abbreviations
The following abbreviations are used in this manuscript:
| AC | Asphalt Concrete |
| CDV | Corrected Deduct value |
| DV | Deduct value |
| Ld | Logarithm of density |
| PCI | Pavement Condition Index |
| PMS | Pavement Management System |
| SU | Sample Unit |
| VBA | Visual Basic for Application |
| VOC | Vehicle Operating Costs |
Appendix A. Distress identification catalogue for Urban Areas
This Appendix includes a list of the new distresses defined in the proposed Distress Identification Catalogue for urban road pavements. Besides, it includes guidelines for distress identification and severity level assessment and provide recommendations to conduct the pavement survey. The deduct value curves for new distress are included in this Appendix.
A.1. N_3. Linear and Isolated Cracking
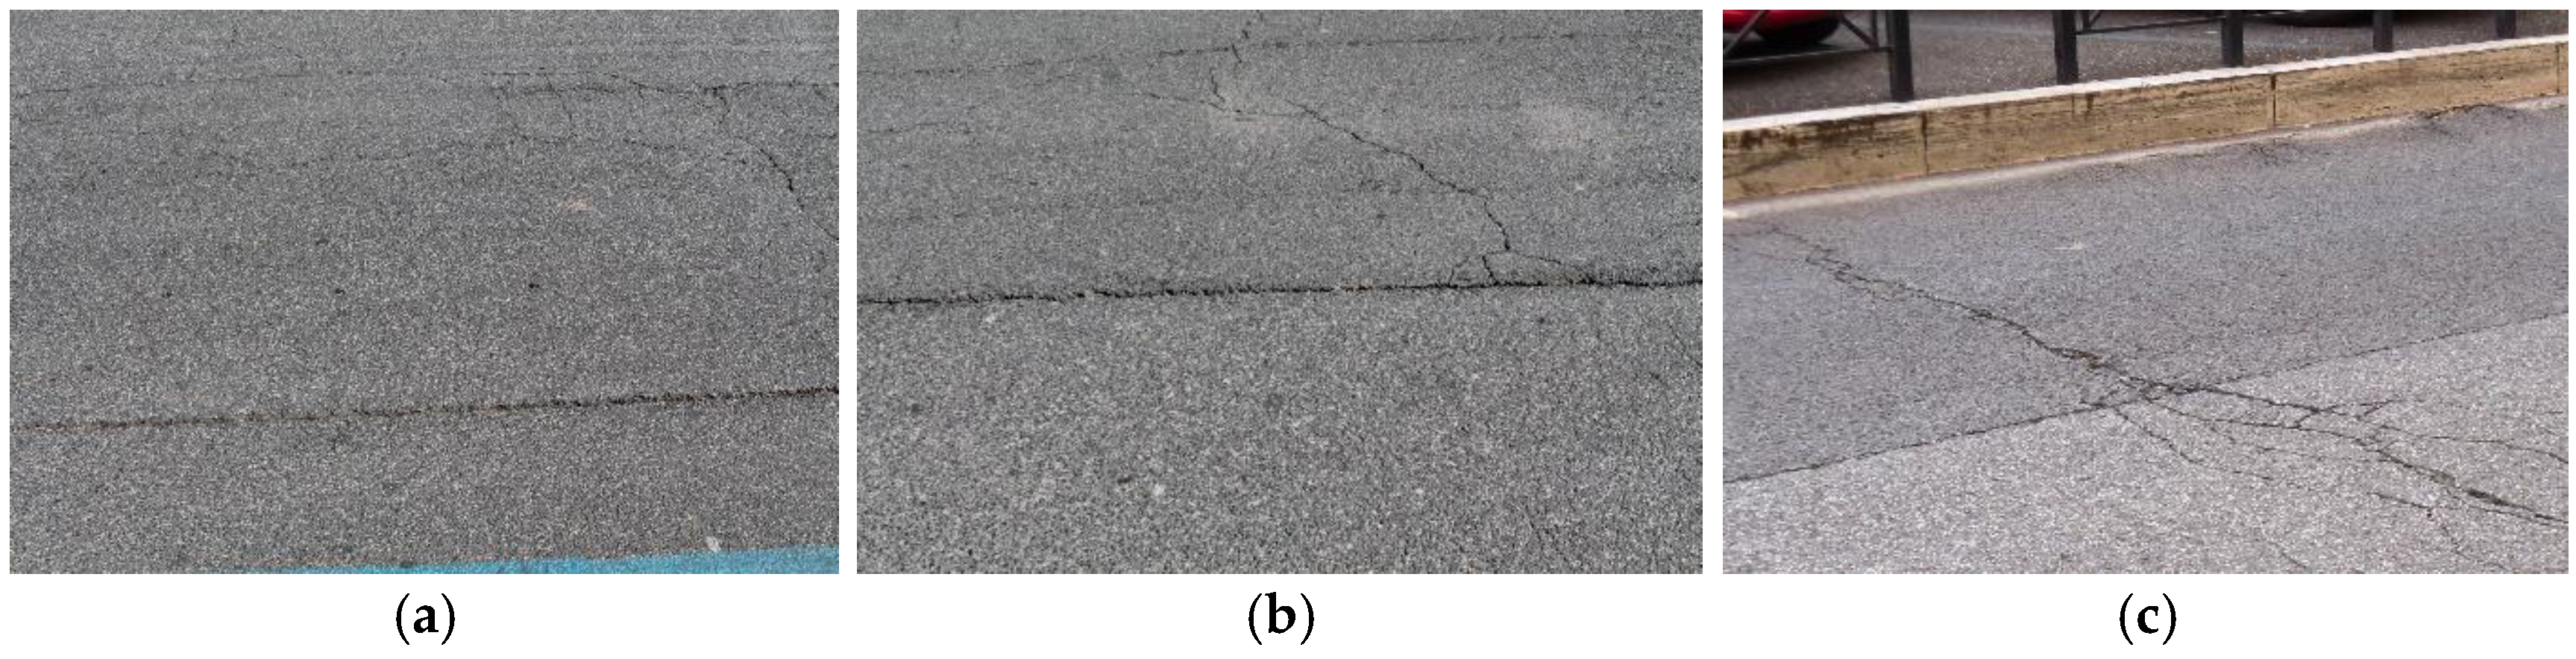
Description: Linear and isolated cracks are parallel to the pavement or perpendicular of laydown direction. They may be caused by a poorly constructed paving lane joint, shrinkage of the AC surface due to low temperature or hardening of the asphalt, or daily temperature cycling, or both. The distress is accelerated by traffic loading. Transverse cracks extend across the pavement at approximately right angles to the pavement centerline or direction of laydown. These types of cracks are not usually load associated.
Severity levels:
- L: mild cracking (if not sealed lower amplitude of 1 cm, if sealed of any amplitude), possibly due to the opening of a joint, without crumbling (Figure A1a).
- M: Average cracking (they can be unsealed amplitude between 1 and 7.5 cm, or not sealed amplitude <7.5 cm surrounded by cracking read, or still can be sealed of any width surrounded by light cracking), possibly due to the opening of a joint with little crumbling (Figure A1b).
- H: any slot, sealed or not, surrounded by medium or high cracking; slot unsealed >7.5 cm; cracking of any amplitude with about 10 cm of severely damaged surrounding paving. We are in this level even if there is a considerable crumbling; if there are any joints are completely open.
The linear and isolated cracking is measured in linear meters (Figure A1c).
Figure A1.
Linear and isolated cracking. (a) Low Severity; (b) Medium Severity; and (c) High Severity.
Figure A1.
Linear and isolated cracking. (a) Low Severity; (b) Medium Severity; and (c) High Severity.

A.2. N_4. Surface Deformations
Description: Swellings, depressions and spaced crests of the road surface that generally are developed parallel or orthogonal direction of traffic laydown direction. This type of distress can be caused by a surface or unstable pavement surface combined by tangential actions of the traffic, in other cases, it can be the results of a failure of the substrate. More generally, the main cause of this distress in urban areas should be the wrong construction of pavement.
The severity level of this distress is determined by the criterion of driving quality:
The surface deformations are measured in square meters.
Figure A2.
Surface deformations. (a) Low Severity; (b) Medium Severity; and (c) High Severity.
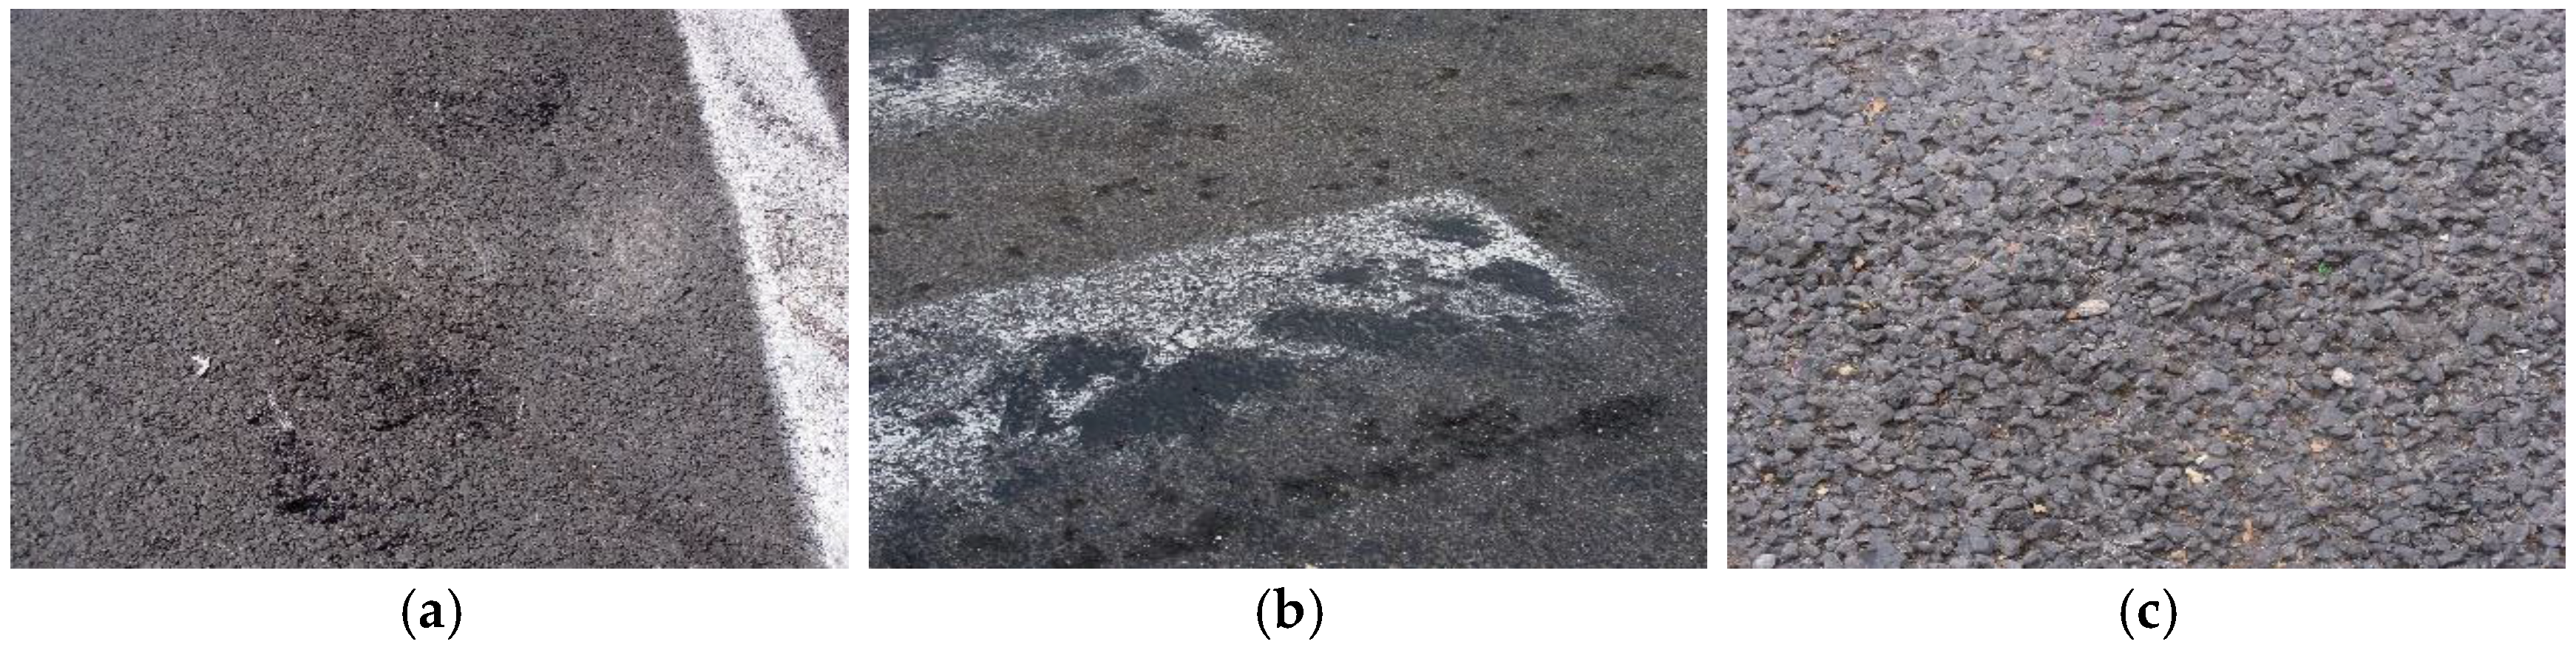
A.3. N_6. Failed Surface Grip
Description: This type of distress can cause alteration in the status of surface conditions with direct consequences on the supply of skid resistances. This distress includes the loose of coarse aggregate of pavement surface, in general, these losses are caused by repeated traffic cycles and the formation of a film of bituminous material on the pavement surface that creates a glossy, reflective and shiny surface. The causes of this distress are excess of bitumen, low percentage of voids, bad construction or insufficient connection between the upper layer and the one below that a poor-quality or poor compacted mixture is present.
Note. The ASTM D6433 distress; 20 Weathering represent the surface deterioration by effect of worn out of asphalt concrete surface, the deduct value of this distress are very low and they can be included on the new distress definition failed surface grip (206).
Severity level:
- Low severity. Sticky surface only a few days a year, significant sanding aggregates, aggregates and bitumen begin to be removed (Figure A3a).
- Medium severity. Sticky surface few weeks a year or erosion level such as to have a moderately wrinkled texture (Figure A3b).
- High severity. Sticky surface for at least a few weeks a year, or very rough texture (Figure A3c).
The failed surface grip distress is measured in square meters.
Figure A3.
Failed surface grip. (a) Low Severity; (b) Medium Severity; and (c) High Severity.

A.4. N_10. Slippage Cracking (Sliding Deformations)
Description: This type of distress is characterized by a permanent sliding in the longitudinal direction of a localized area of road surface, located in areas in which the mixture used is too fluid and unstable.
Severity levels:
- Low severity. Good ride quality and / or crack amplitude <1.0 cm (Figure A4a).
- Medium severity. Average ride quality and/or amplitude of 1.0 to 4.0 cm crack; the surrounding area is moderately crushed (Figure A4b).
- High severity. Low ride quality and/or crack amplitude >4 cm; the surrounding area is highly cracked into removable pieces (Figure A4c).
This type of distress is measured in square meters.
Figure A4.
Slippage cracking. (a) Low Severity; (b) Medium Severity; and (c) High Severity.
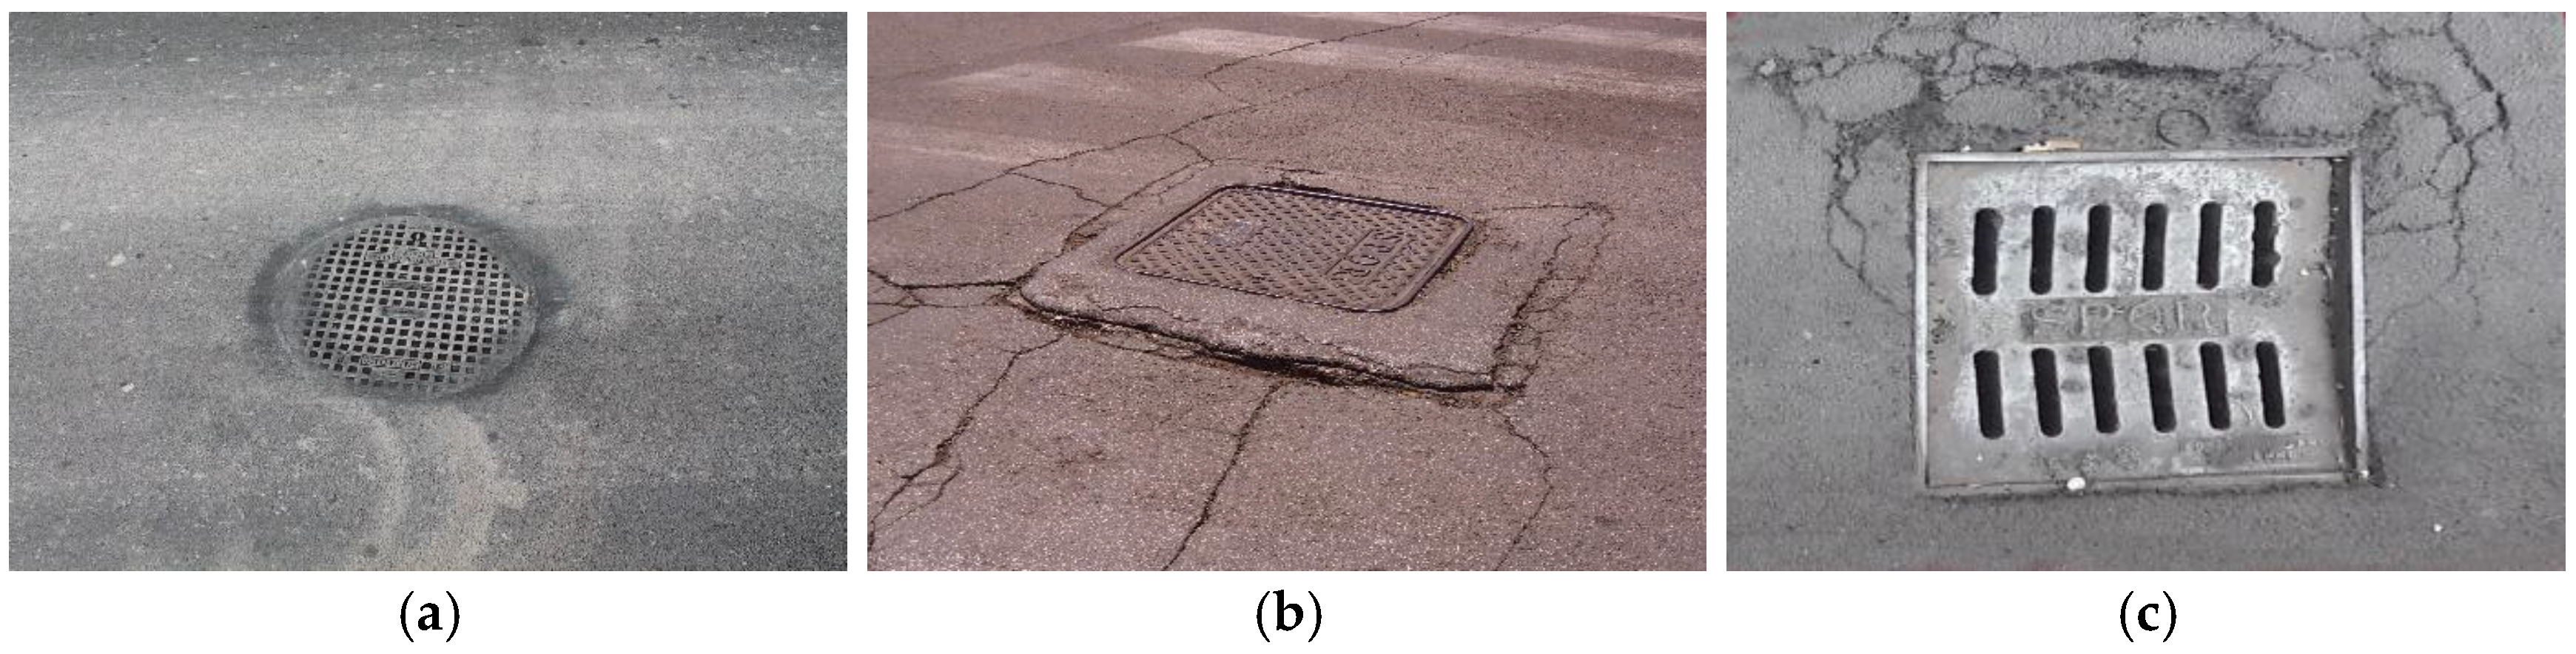
A.5. N_11. Manholes
Description: This distress definition includes all artificial elements that are on the urban pavement, designed to collect rain water, or allow access to the area below the roadway. These distress definition includes manholes and catch basins.
Severity levels:
- Low severity. Low influence on ride quality (Figure A5a).
- Medium severity. Medium influence have medium influence on ride quality with an elevation of the element less than 5 centimeters over the road level and the surrounding area is slightly cracked (Figure A5b).
- High severity. High influence in ride quality, the element creates a vertical discontinuity of the roadway, height over the roadway level ≥ 5 cm and the surrounding area is significantly cracked.
This type of distress is measured in square meters (Figure A5c).
Figure A5.
Manholes. (a) Low Severity; (b) Medium Severity; and (c) High Severity.

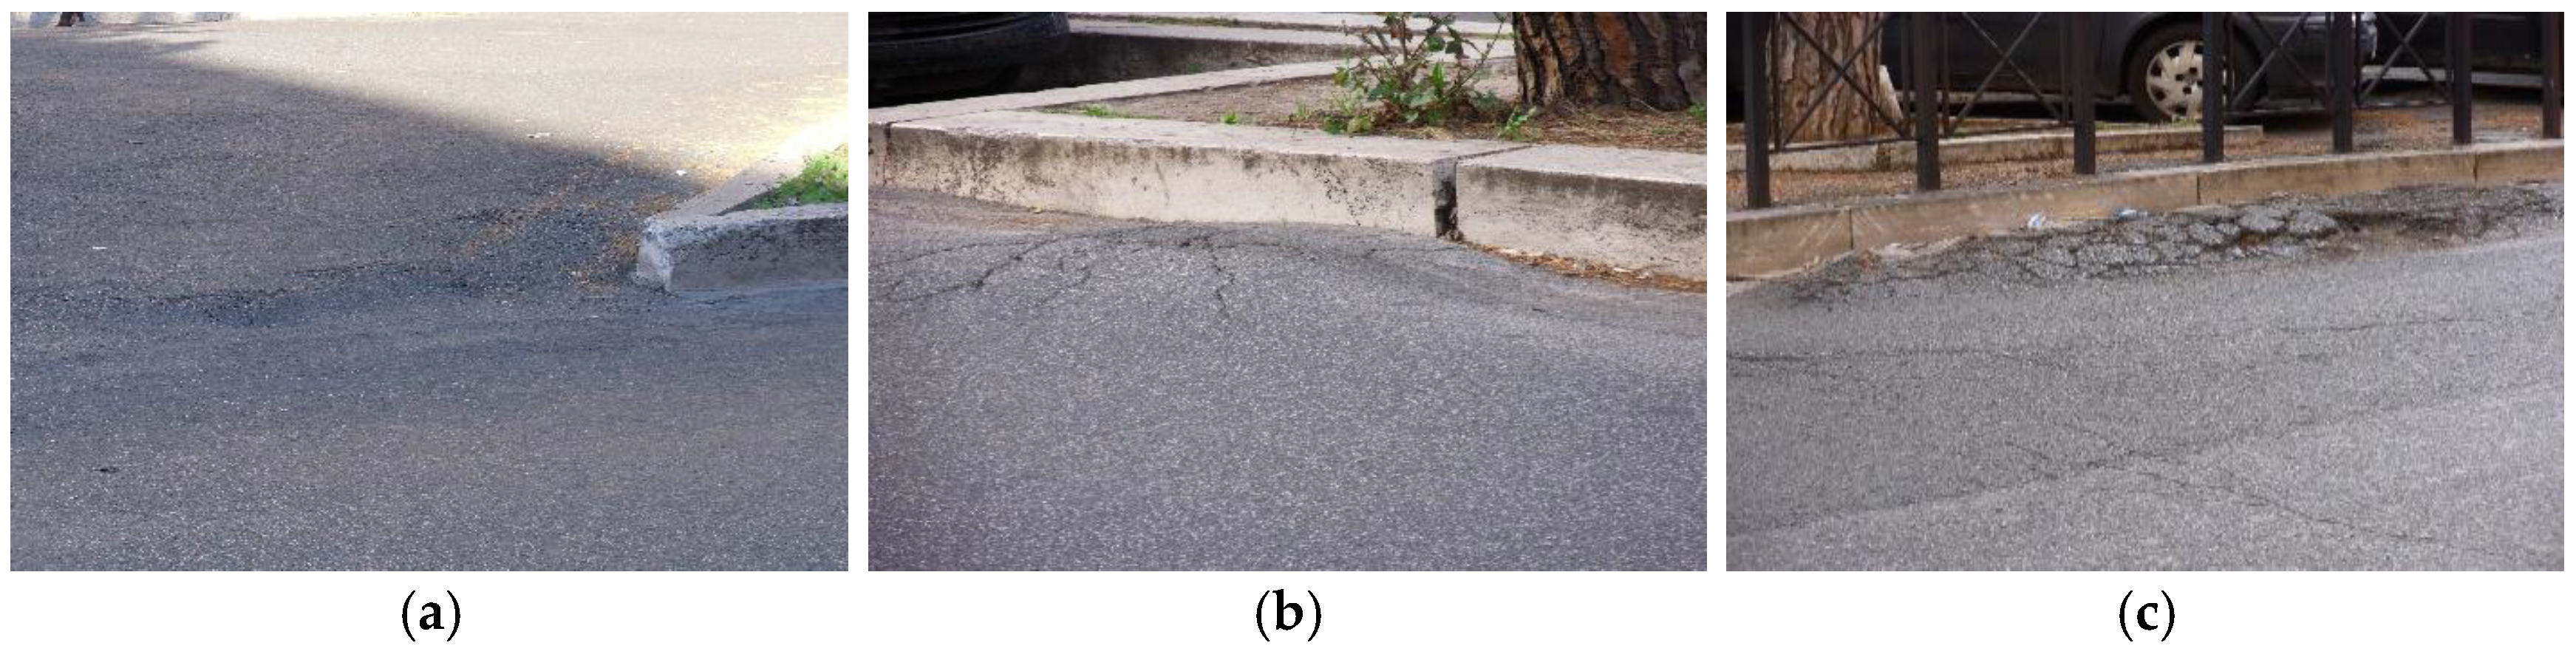
A.6. N_12. Tree Roots
Description: This distress is defined as a localized lifting of the road surface due to the present of large tree roots at the road side: this type of distress is very common in urban areas. They can quickly degenerate into cracks, which widen as a result of infiltration of rainwater and the growth of the roots below the road level. The density-deduct value curve associated with 12. Tree roots is calculated as the combination of ASTM D6433 11. Patching and Utility Patching and 18. Swell.
Severity levels. The severity level of this distress should be considered by the Table A1:

Table A1.
Tree roots severity levels.
| Height (cm) above Road Surface | Low Traffic Influence | Medium Traffic Influence | High Traffic Influence |
|---|---|---|---|
| 0–10 | Low Severity | Low Severity | Medium Severity |
| 10–20 | Low Severity | Medium Severity | High Severity |
| ≥20 cm | Medium Severity | Medium Severity | High Severity |
The severity level is defined with the table which relates the height difference between the tree root and the road level and the influence of roots have in the traffic. The definition of severity level is also based on the position of roots roadway section, to take into account if the roots are present where the vehicles pass transversally or if they are present on the roadside.
This type of distress is measured in square meters; other type of distress in surrounding area has not to be consider as tree roots.
Figure A6.
Tree roots. (a) Low Severity; (b) Medium Severity; and (c) High Severity.

Figure A7.
Distress deduct value curves for Urban Distress Identification Catalogue. (a) Linear and isolated cracking; (b) Surface deformations; (c) Failure surface grip; (d) Slippage cracking; (e) Manholes; and (f) Tree roots.
Figure A7.
Distress deduct value curves for Urban Distress Identification Catalogue. (a) Linear and isolated cracking; (b) Surface deformations; (c) Failure surface grip; (d) Slippage cracking; (e) Manholes; and (f) Tree roots.

References
- Uddin, W.; Hudson, W.; Haas, R. Framework for Infrastructure Asset Management. In Public Infrastructure Asset Management, 2nd ed.; McGraw-Hill Education: Columbus, OH, USA, 2013; pp. 154–196. [Google Scholar]
- Tavaloki, A.; Lapin, M.S.; Figueroa, J. PMSC: Pavement Management System for Small Communities. J. Transp Eng. ASCE 1992, 118, 270–280. [Google Scholar]
- D’Andrea, A.; Moretti, L.; Di Mascio, P. Environmental Impact Assessment of Road Asphalt Pavements. Mod. Appl. Sci. 2013, 11, 1–11. [Google Scholar]
- Moretti, L. Technical and Economic Sustainability of Concrete Pavements. Mod. Appl. Sci. 2014, 8, 1–9. [Google Scholar] [CrossRef]
- Moretti, L.; Cantisani, G.; Di Mascio, P. Management of road tunnels: Construction, maintenance and lighting costs. Tunn. Undergr. Sp. Technol. 2016, 51, 84–89. [Google Scholar] [CrossRef]
- Flintsch, G.W.; McGhee, K.K. Quality Management of Pavement Condition Data Collection; National Cooperative Research Program, National Academies Press: Washington, DC, USA, 2009; Volume Synthesis 401. [Google Scholar]
- Wolters, A.; Zimmerman, K.; Schattler, K.; Rietgraf, A. Implementing Pavement Management Systems for Local Agencies; Research Report ICT-11–094–1; Illinois Center for Transportation: Springfield, IL, USA, 2011. [Google Scholar]
- Annual Performance Progress Report 2006: Oregon Department of Transportation; Salem, Department of Transportation: Salem, OR, USA, 2006.
- Vavrik, W.R.; Evans, L.D.; Stefanski, J.A.; Sargand, S. PCR Evaluation–Considering Transition from Manual to Semi-Automated Pavement Distress Collection and Analysis; Ohio Department of Transportation: Colombus, OH, Ohio, USA, July 2013.
- Loprencipe, G.; Cantisani, G.; Di Mascio, P. Global assessment method of road distresses. In Proceedings of the 4th International Symposium on Life-Cycle Civil Engineering, Tokyo, Japan, 16 November 2014; CRC Press/Balkema: Leiden, The Netherlands, 2015; pp. 1113–1120. Available online: https://www.crcpress.com/Life-Cycle-of-Structural-Systems-Design-Assessment-Maintenance-and-Management/Furuta-Frangopol-Akiyama/p/book/9781138001206 (accessed on 2 January 2017).
- Cantisani, G.; Loprencipe, G. Road Roughness and Whole Body Vibration: Evaluation Tools and Comfort Limits. J. Transp. Eng. 2010, 136, 818–826. [Google Scholar] [CrossRef]
- Loprencipe, G.; Cantisani, G. Evaluation methods for improving surface geometry of concrete floors: A case study. Case Stud. Struct. Eng. 2015, 4, 14–25. [Google Scholar] [CrossRef]
- ISO 2631–1:1997—Mechanical Vibration and Shock—Evaluation of Human Exposure to Whole-Body Vibration-Part 1: General Requirements; ISO: Genève, Switzerland, Multiple, Distributed through American National Standards Institute (ANSI).
- Loprencipe, G.; Zoccali, P. Use of generated artificial road profiles in road roughness evaluation. P. J. Mod. Transp. 2017, 25, 24–33. [Google Scholar] [CrossRef]
- Shahin, M.Y. Pavement Condition Survey and Rating Procedure. In Pavement Management for Airports, Roads, and Parking Lots, 1st ed.; Chapman & Hall: New York, NY, USA, 1994; pp. 15–37. [Google Scholar]
- American Society of Testing and Materials (ASTM). D6433–16, Standard Practice for Roads and Parking Lots Pavement Condition Index Surveys; ASTM International: West Conshohocken, PA, USA, 2016; Available online: heep://www.astm.org (accessed on 20 January 2017).
- American Society of Testing and Materials (ASTM). D5340–12, Standard Test Method for Airport Pavement Condition Index Surveys; ASTM International: West Conshohocken, PA, USA, 2012; Available online: http://www.astm.org (accessed on 20 January 2017).
- User Manual—PAVERTM, version 7.0; US Army Corps of Engineers Engineer Research and Development Center (ERDC) Construction Engineering Research Laboratory (CERL): Champaign, IL, USA, 2014; Available online: http://www.paver.colostate.edu/User%20Guide.pdf (accessed on 2 April 2017).
- Mulry, B.; Jordan, M.; O’Brien, D.; Shekharan, R.; PMS Pavement Management Services Ltd.; Virginia Tech. Virginia Tech Transportation Institute. Automated Pavement Condition Assessment Using Laser Crack Measurement System (LCMS) on Airfield Pavements in Ireland. In 9th International Conference on Managing Pavement Assets; Virginia Tech Transportation Institute (VTTI): Alexandria, VA, USA, 2015; Available online: https://vtechworks.lib.vt.edu/bitstream/handle/10919/56414/ICMPA9–000246.PDF (accessed on 2 April January 2017).
- Coley, C. Inspections of Airfield Pavements—Practitioner Guide 06/11; UK Ministry of Defense: London, UK, 2011. Available online: https://www.gov.uk/government/uploads/system/uploads/attachment_data/file/33605/pg_0611.pdf (accessed on 2 April 2017).
- Drenth, K.P. Management of Dutch Airfield Pavements at Network Level. In Advancing Airfield Pavements; American Society of Civil Engineers (ASCE): Reston, VA, USA 20191–4400, 2001; pp. 357–374. [Google Scholar]
- Bertrand, P.L.; Boutonnet, M.; Cazeneuve, J.; Chabrol, J.; Dauzats, M.; Griselin, J.F.; Coquereau, A.; Poilane, J.P.; Robert, B.; Lepert, P.; et al. Catalogue des degradations de surface des chaussees-Version 1998. Available online: http://www.ifsttar.fr/fileadmin/user_upload/editions/lcpc/MethodeDEssai/MethodeDEssai-LCPC-ME52.pdf (accessed on 2 April 2017).
- Mulry, B.; Feighan, K.; McCarthy, J.; Williams, A.; Virginia Tech. Virginia Tech Transportation Institute; PMS Pavement Management Services Ltd.; Ireland. Department of Transport Tourism & Sport. Development and Implementation of a Simplified System for Assessing the Condition of Irish Regional and Local Roads. In 9th International Conference on Managing Pavement Assets; Virginia Tech Transportation Institute (VTTI): Alexandria, VA, USA, 2015. Available online: https://vtechworks.lib.vt.edu/bitstream/handle/10919/56413/ICMPA9–000213.PDF (accessed on 2 April 2017).
- Walker, D.; Entine, L.; Kummer, S. Pavement Surface Evaluation and Rating: Paser Manual; Revised 2013; Wisconsin Transportation Information Center: Madison, WI, USA, 2002; Available online: http://epdfiles.engr.wisc.edu/pdf_web_files/tic/manuals/Asphalt-PASER_02_rev13.pdf (accessed on 2 April 2017).
- Corazza, M.V.; Di Mascio, P.; Moretti, L. Managing sidewalk pavement maintenance: A case study to increase pedestrian safety. J. Traffic Transp. Eng. 2016, 3, 203–204. [Google Scholar] [CrossRef]
- Cottrell, W.D.; Bryan, S.; Chilukuri, B.R.; Kalyani, V. Transportation Infrastructure Maintenance Management: Case Study of a Small Urban City. J. Infrastruct. Syst. 2009, 15, 120–132. [Google Scholar] [CrossRef]
- Chamorro, A.; Tighe, S.; Li, N.; Kazmierowski, T. Development of distress guidelines and condition rating to improve network management in Ontario, Canada. Transp. Res. Rec. J. Transp. Res. Board 2009, 2093, 128–135. [Google Scholar] [CrossRef]
- Chamorro, A.; Tighe, S.; Li, N.; Kazmierowski, T. Validation and implementation of Ontario, Canada, network-level distress guidelines and condition rating. Transp. Res. Rec. J. Transp. Res. Board 2010, 2153, 49–57. [Google Scholar] [CrossRef]
- Osorio, A.; Chamorro, A.; Tighe, S.; Videla, C. Calibration and validation of condition indicator for managing urban pavement networks. Transp. Res. Rec. J. Transp. Res. Board 2014, 2455, 28–36. [Google Scholar] [CrossRef]
- Cantisani, G.; Fascinelli, G.; Loprencipe, G. Urban road noise: The contribution of pavement discontinuities. In ICSDEC 2012: Developing the Frontier of Sustainable Design, Engineering, and Construction, Proceedings of the 2012 International Conference on Sustainable Design and Construction, Fort Worth, TX, USA, 7–9 November 2012; American Society of Civil Engineers: Reston, VA, USA; pp. 327–334. Available online: http://dx.doi.org/10.1061/9780784412688 (accessed on 28 February 2017).
- McGhee, K. Development and Implementation of Pavement Condition Indices for The Virginia Department of Transportation, Phase I Flexible Pavements; Virginia Department of Transportation: Richmond, VA, USA, 2002. [Google Scholar]
- Shah, Y.U.; Jain, S.S.; Parida, M. Development of Overall Pavement Condition Index for Urban Road Network. Proceedings of 2nd Conference of Transportation Research Group of India (2nd CTRG), Agra, India, 2 December 2013; Procedia—Social and Behavioral Sciences: Amsterdam, The Netherlands, 2013; Volume 104, pp. 332–341. Available online: http://www.sciencedirect.com/science/article/pii/S1877042813045175 (accessed on 2 April 2017).
- Shah, Y.U.; Jain, S.S.; Parida, M. Evaluation of prioritization methods for effective pavement maintenance of urban roads. Int. J. Pavement Eng. 2014, 15, 238–250. [Google Scholar] [CrossRef]
- Adedimila, A.S.; Olutaiwo, A.O.; Kehinde, O. A simplified PCI-based Condition Rating System for a Developing Country. J. Eng. Appl. Sci. 2009, 5, 27–40. [Google Scholar]
- Bonin, G.; Folino, N.; Loprencipe, G.; Oliverio Rossi, C.; Polizzotti, S.; Teltayev, B. Development of a Road Asset Management System in Kazakhstan. In Proceedings of the TIS 2017 International Congress on Transport Infrastructure and Systems, Rome, Italy, 10–12 April 2017; CRC Press/Balkema: Leiden, The Netherlands, 2017. Available online: https://www.crcpress.com/Transport-Infrastructure-and-Systems-Proceedings-of-the-AIIT-International/DellAcqua-Wegman/p/book/9781138030091 (accessed on 28 February 2017).
- Rosati, D. Applicazione del metodo ASTM 6433 per la valutazione degli interventi di una rete stradale comunale. Master’s Thesis, University of Rome, Rome, Italy, 2016. (in Italian). [Google Scholar]
- Loprencipe, G.; Pantuso, A.; Di Mascio, P. Sustainable Pavement Management System in Urban Areas Considering the Vehicle Operating Costs. Sustainability 2017, 9, 453. [Google Scholar] [CrossRef]
Figure 1.
Framework of the specified procedure for distress identification and assessment for urban road surfaces based on PCI, Pavement Condition Index.
Figure 1.
Framework of the specified procedure for distress identification and assessment for urban road surfaces based on PCI, Pavement Condition Index.

Figure 2.
Standard and customized PCI rating scale.
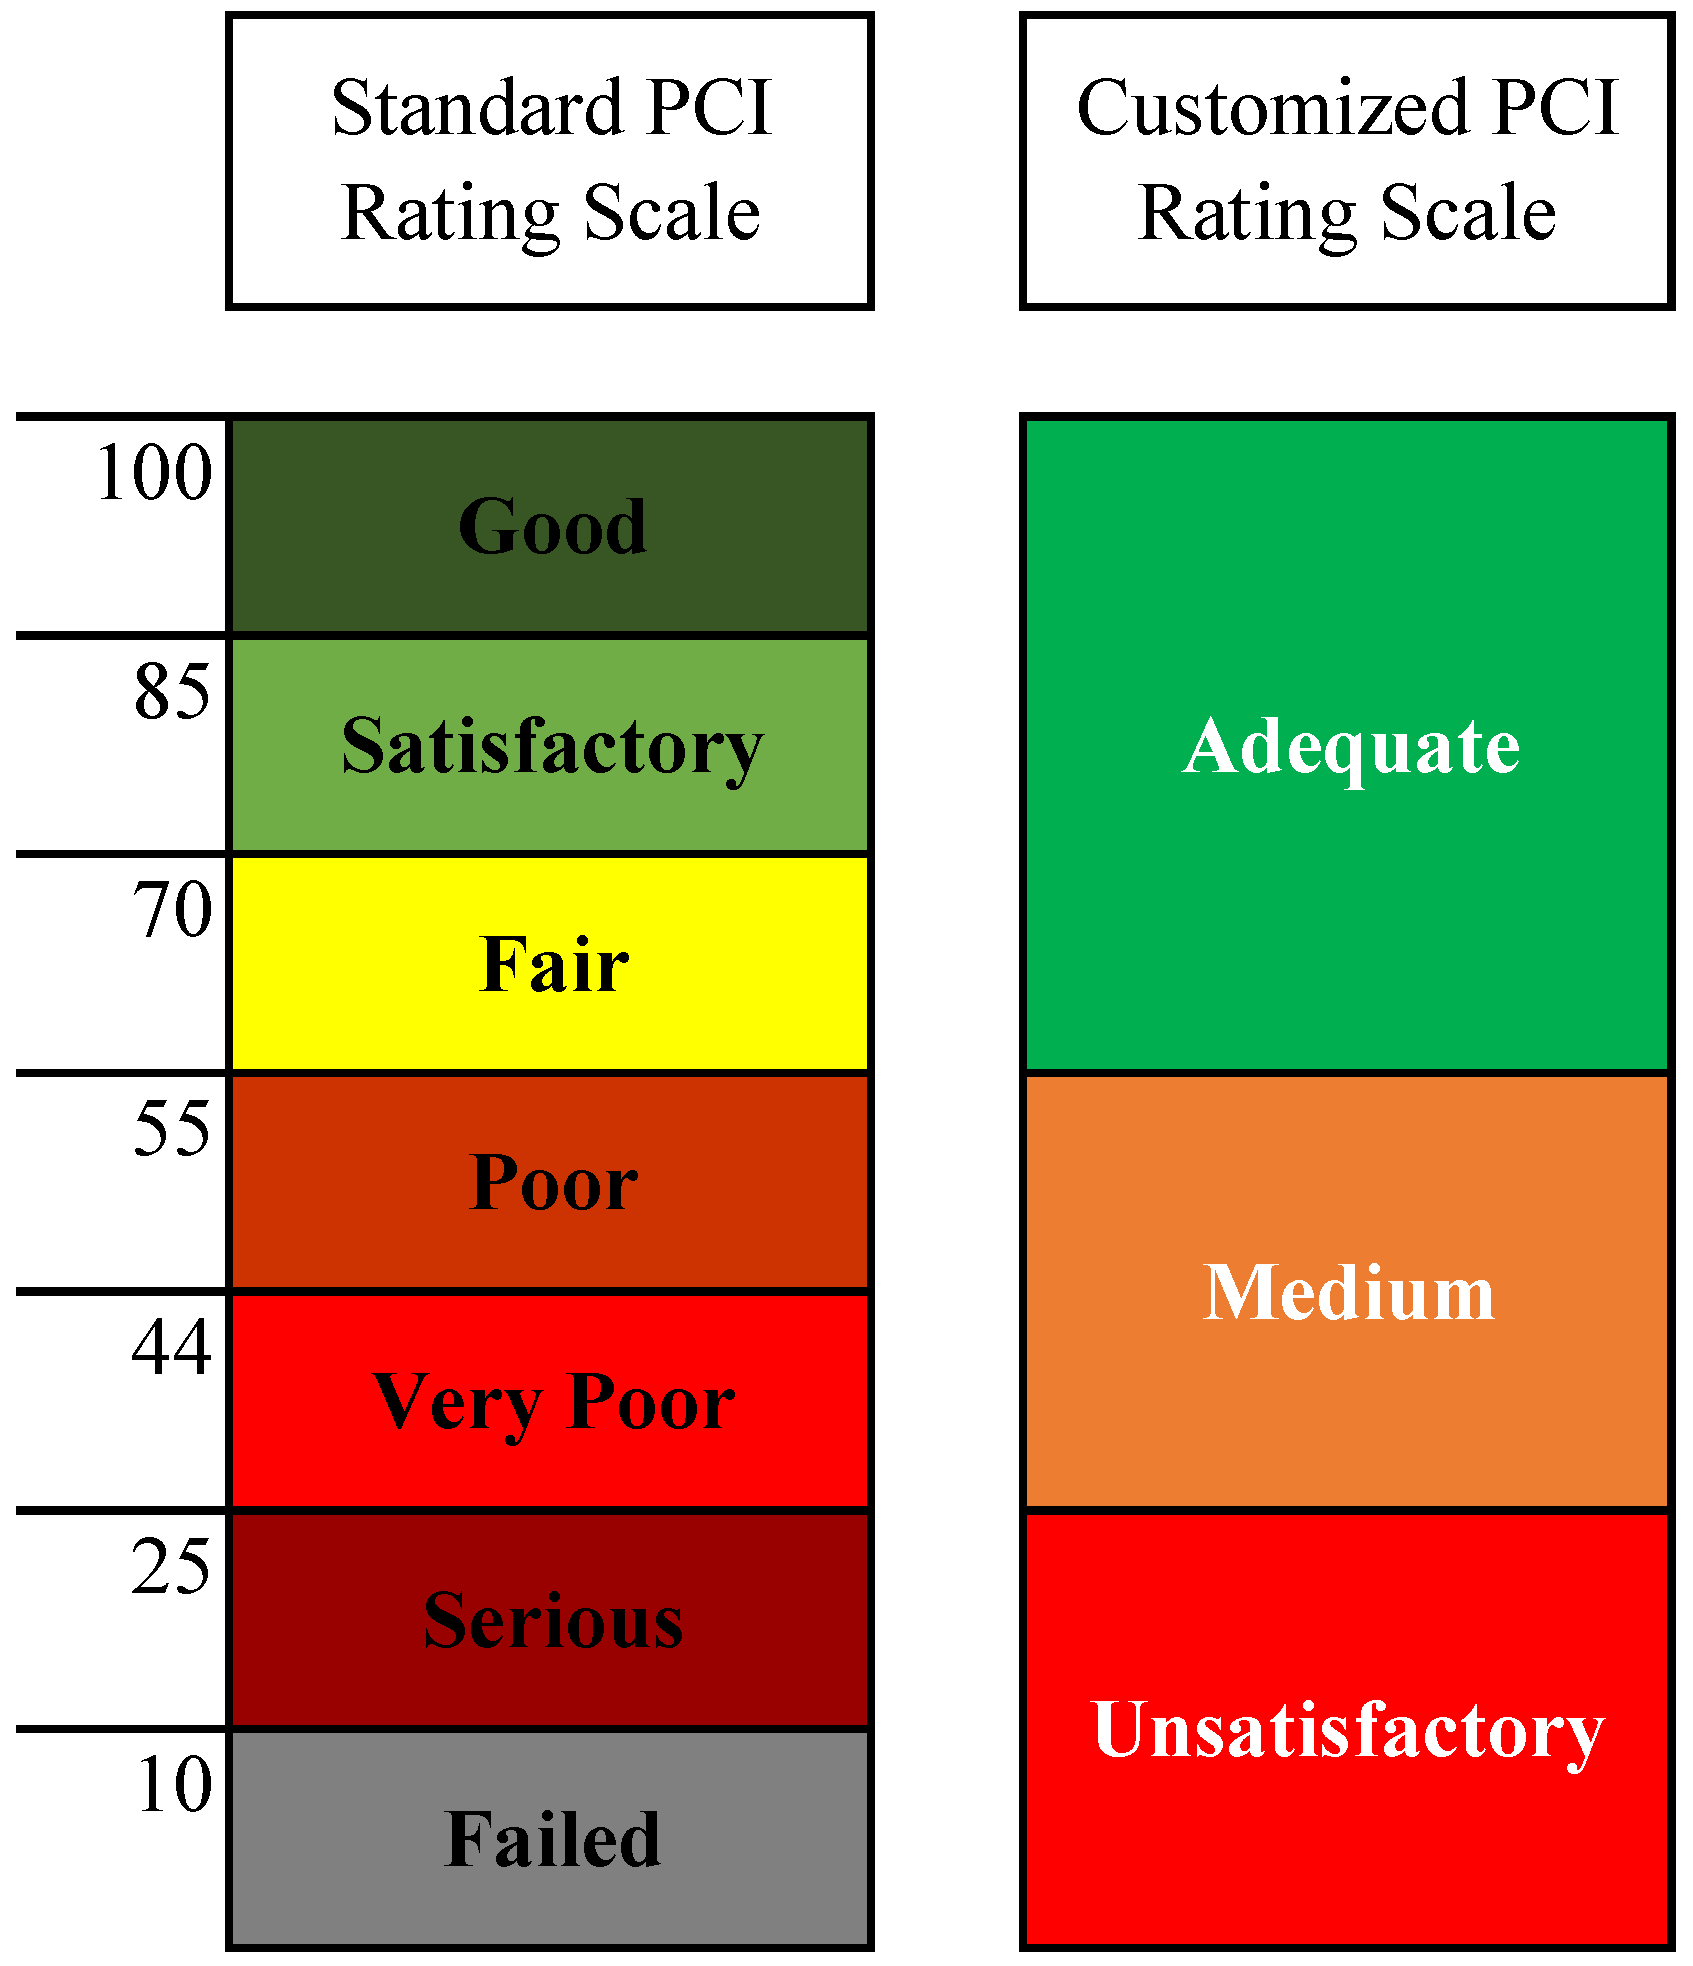
Figure 3.
Road pavement observed distresses distribution by Pavement Condition Index (PCI) condition in urban areas. Percentage of observed distress in: (a) Adequate PCI sections; (b) Medium PCI sections; (c) Unsatisfactory PCI sections.
Figure 3.
Road pavement observed distresses distribution by Pavement Condition Index (PCI) condition in urban areas. Percentage of observed distress in: (a) Adequate PCI sections; (b) Medium PCI sections; (c) Unsatisfactory PCI sections.
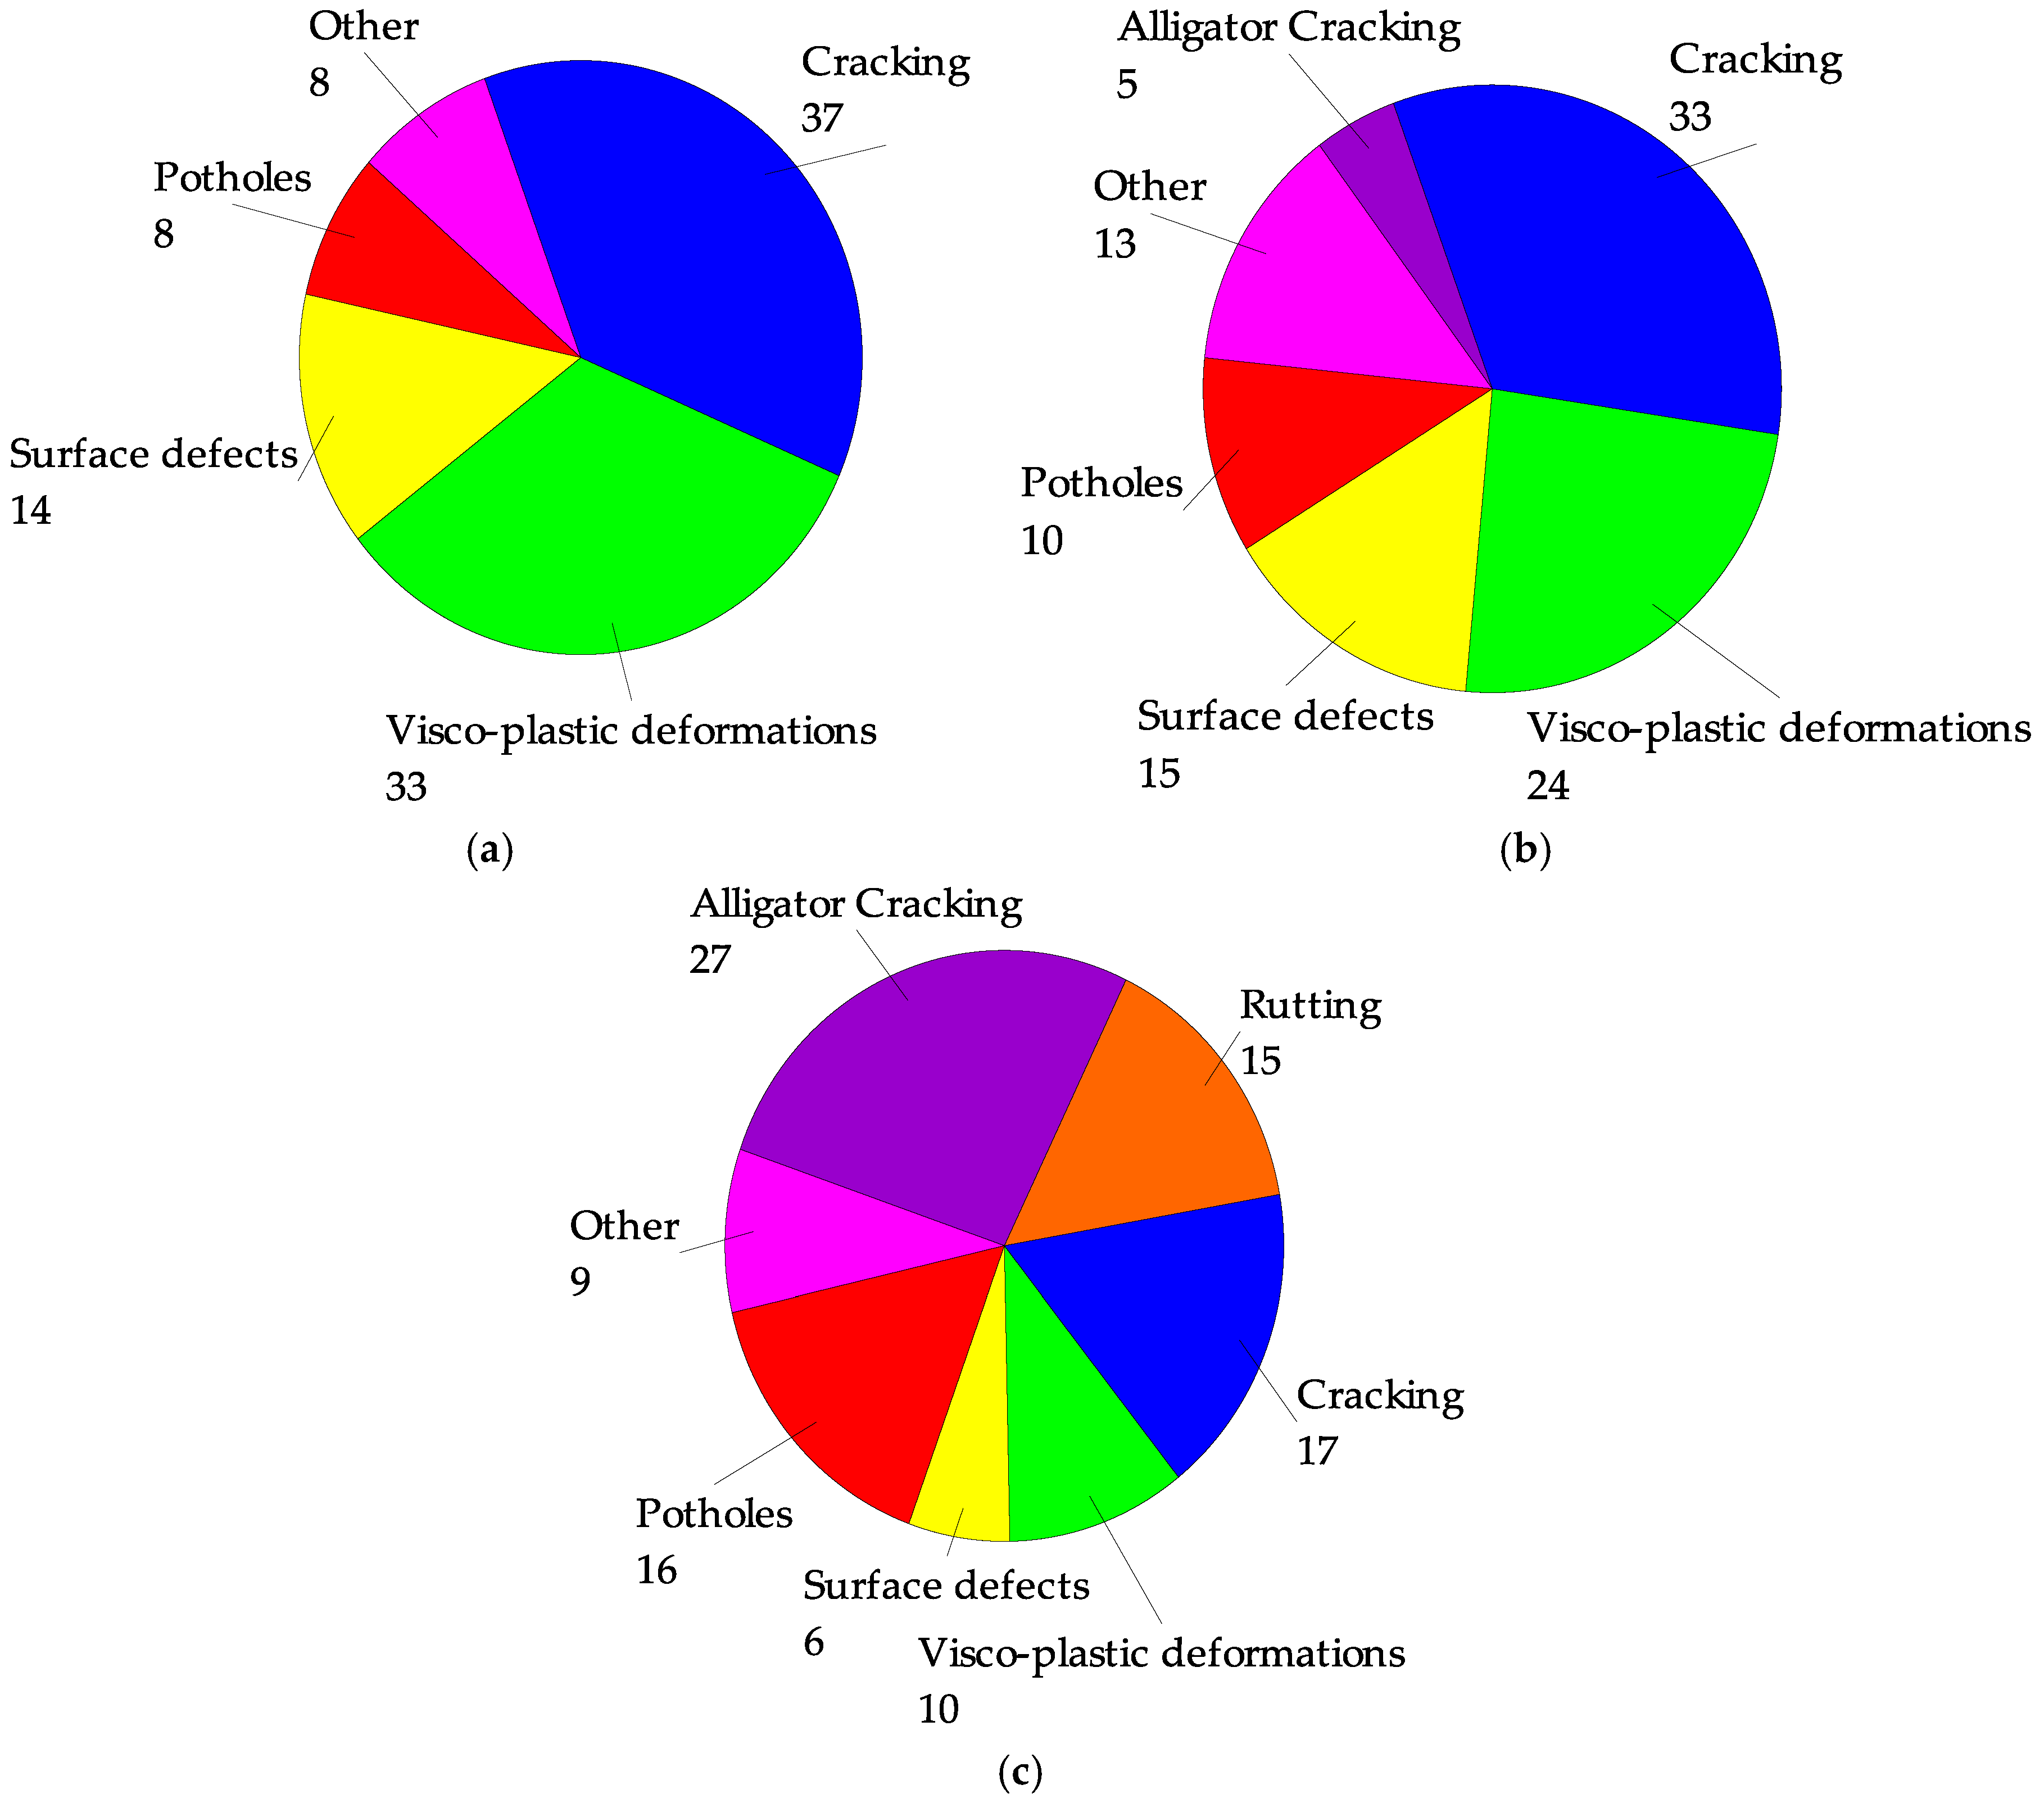
Figure 4.
Automated PCI calculation procedure Visual Basic for Application (VBA) program interface.

Figure 5.
Logarithm Density—Deduct value Polynomial Interpolating Curve Hermite procedure.
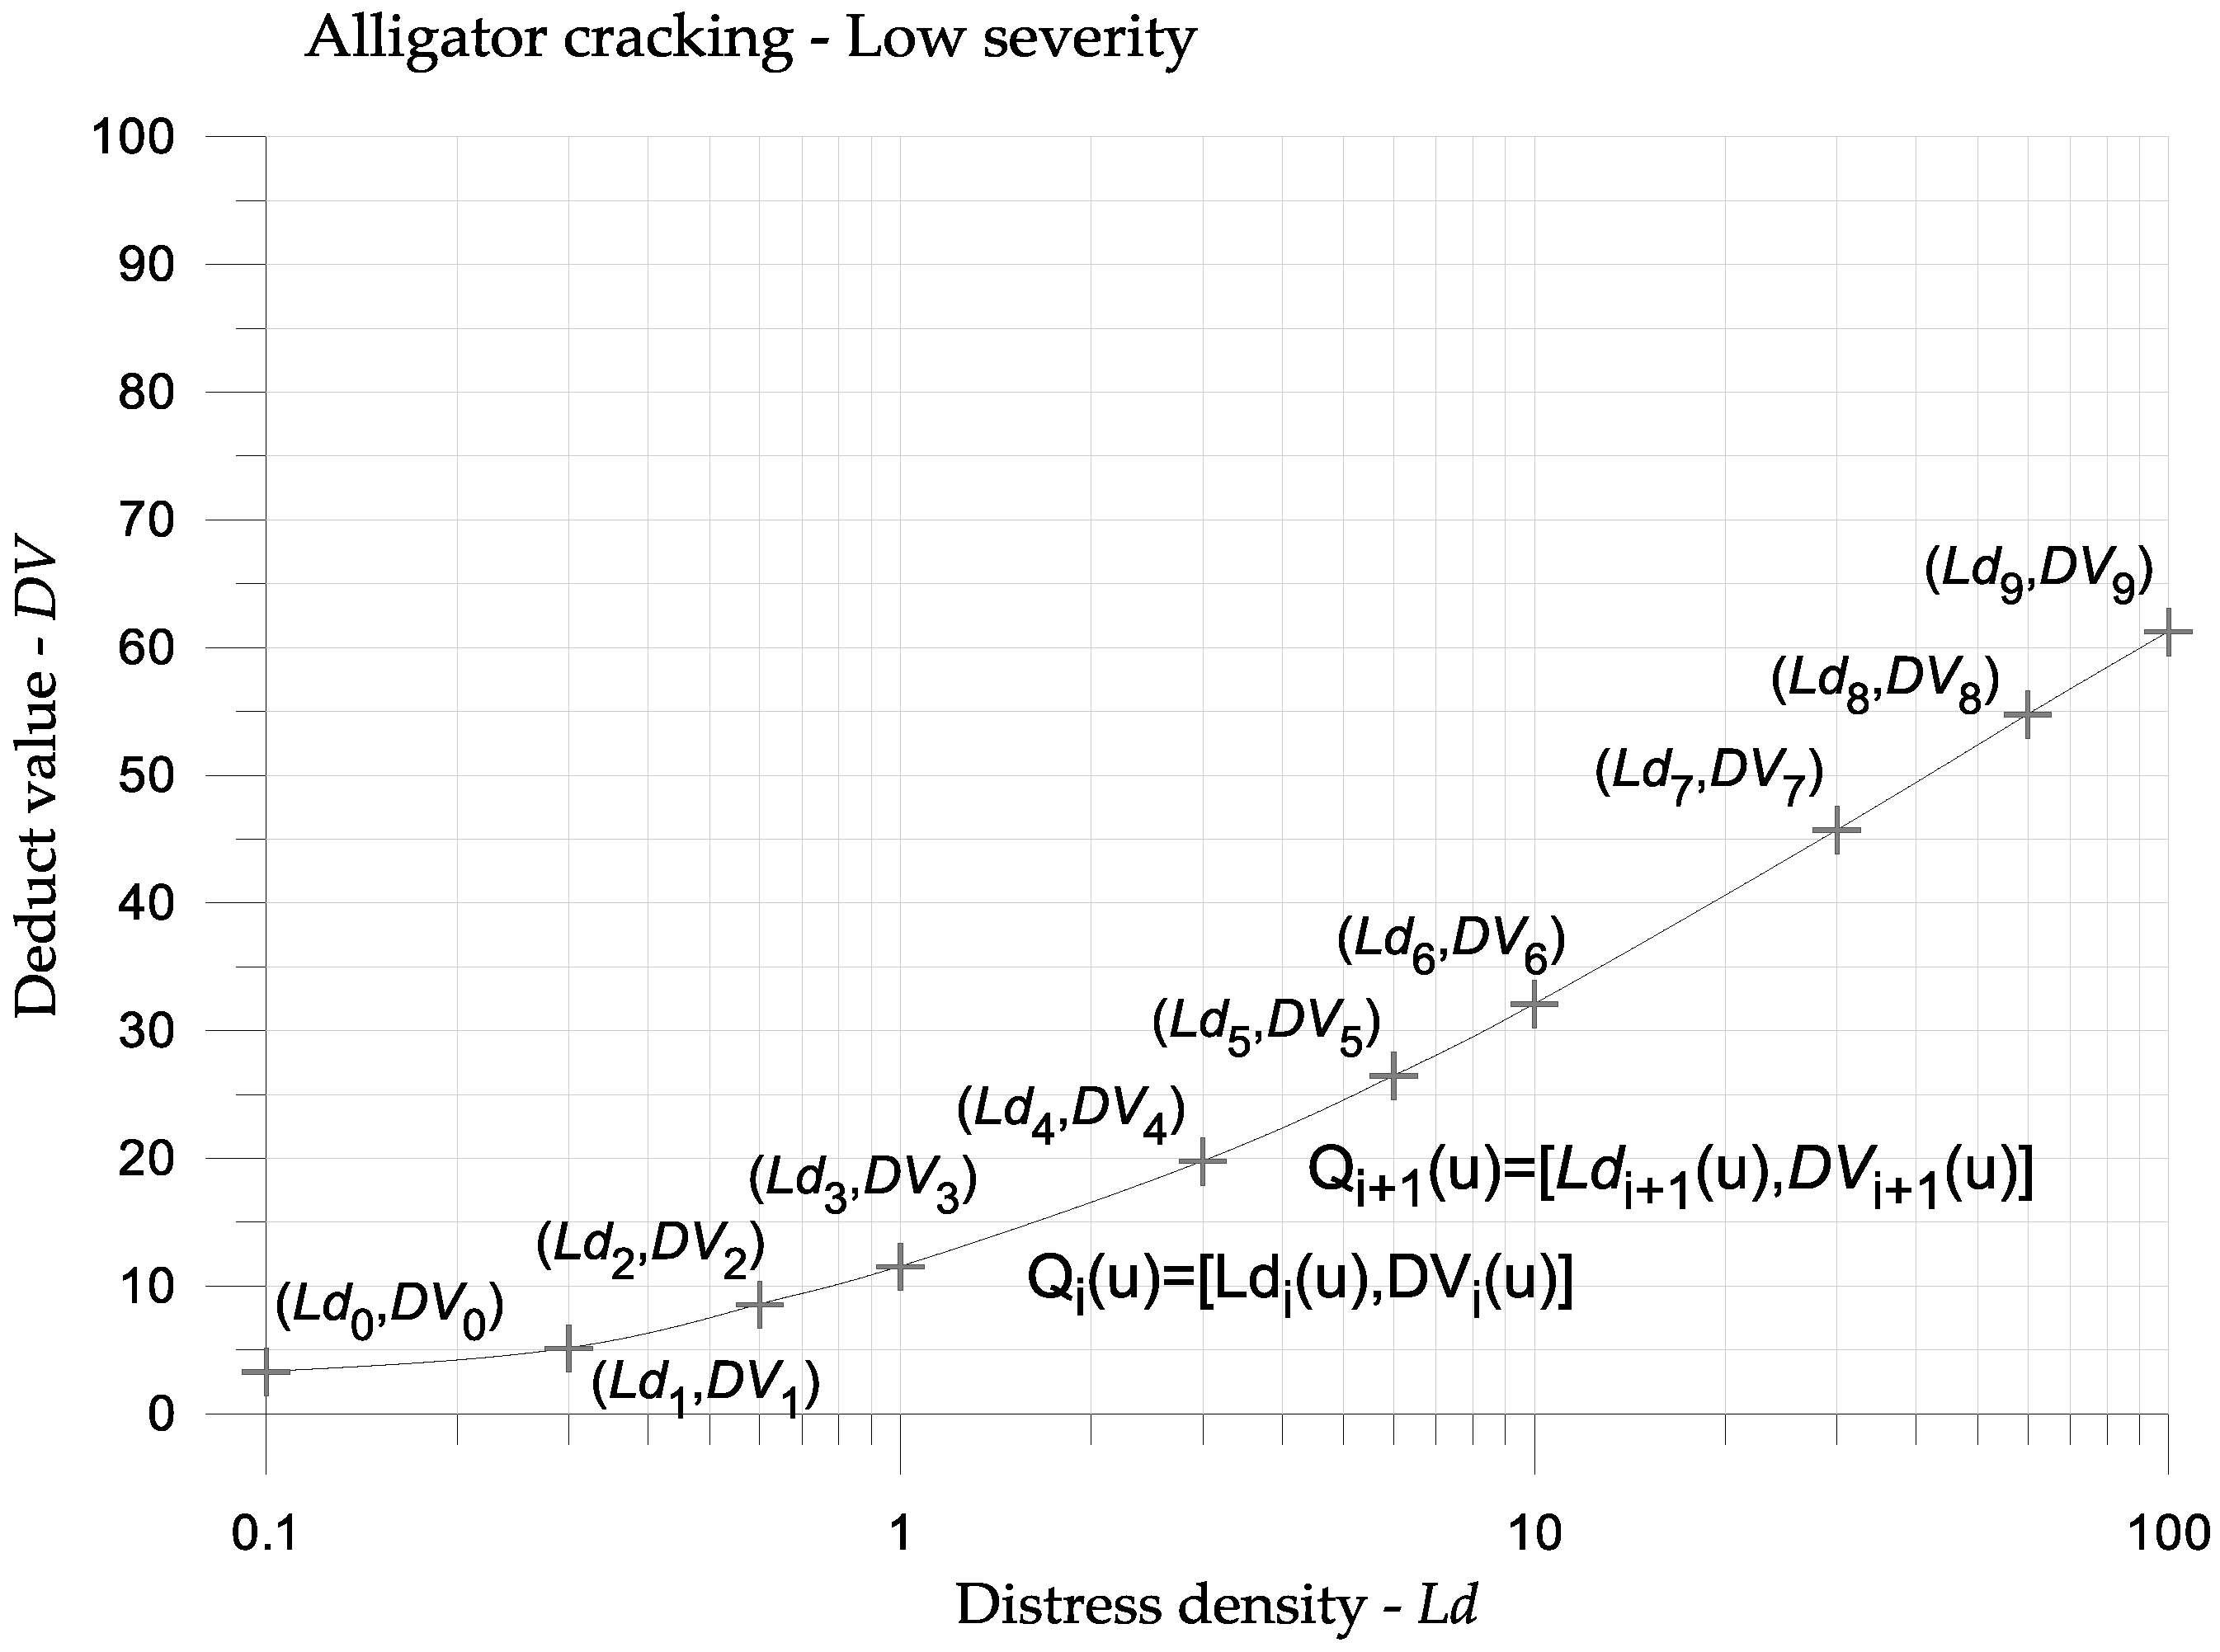
Figure 6.
Parametric plane (u, DV) Polynomial Interpolating Curve Hermite procedure.
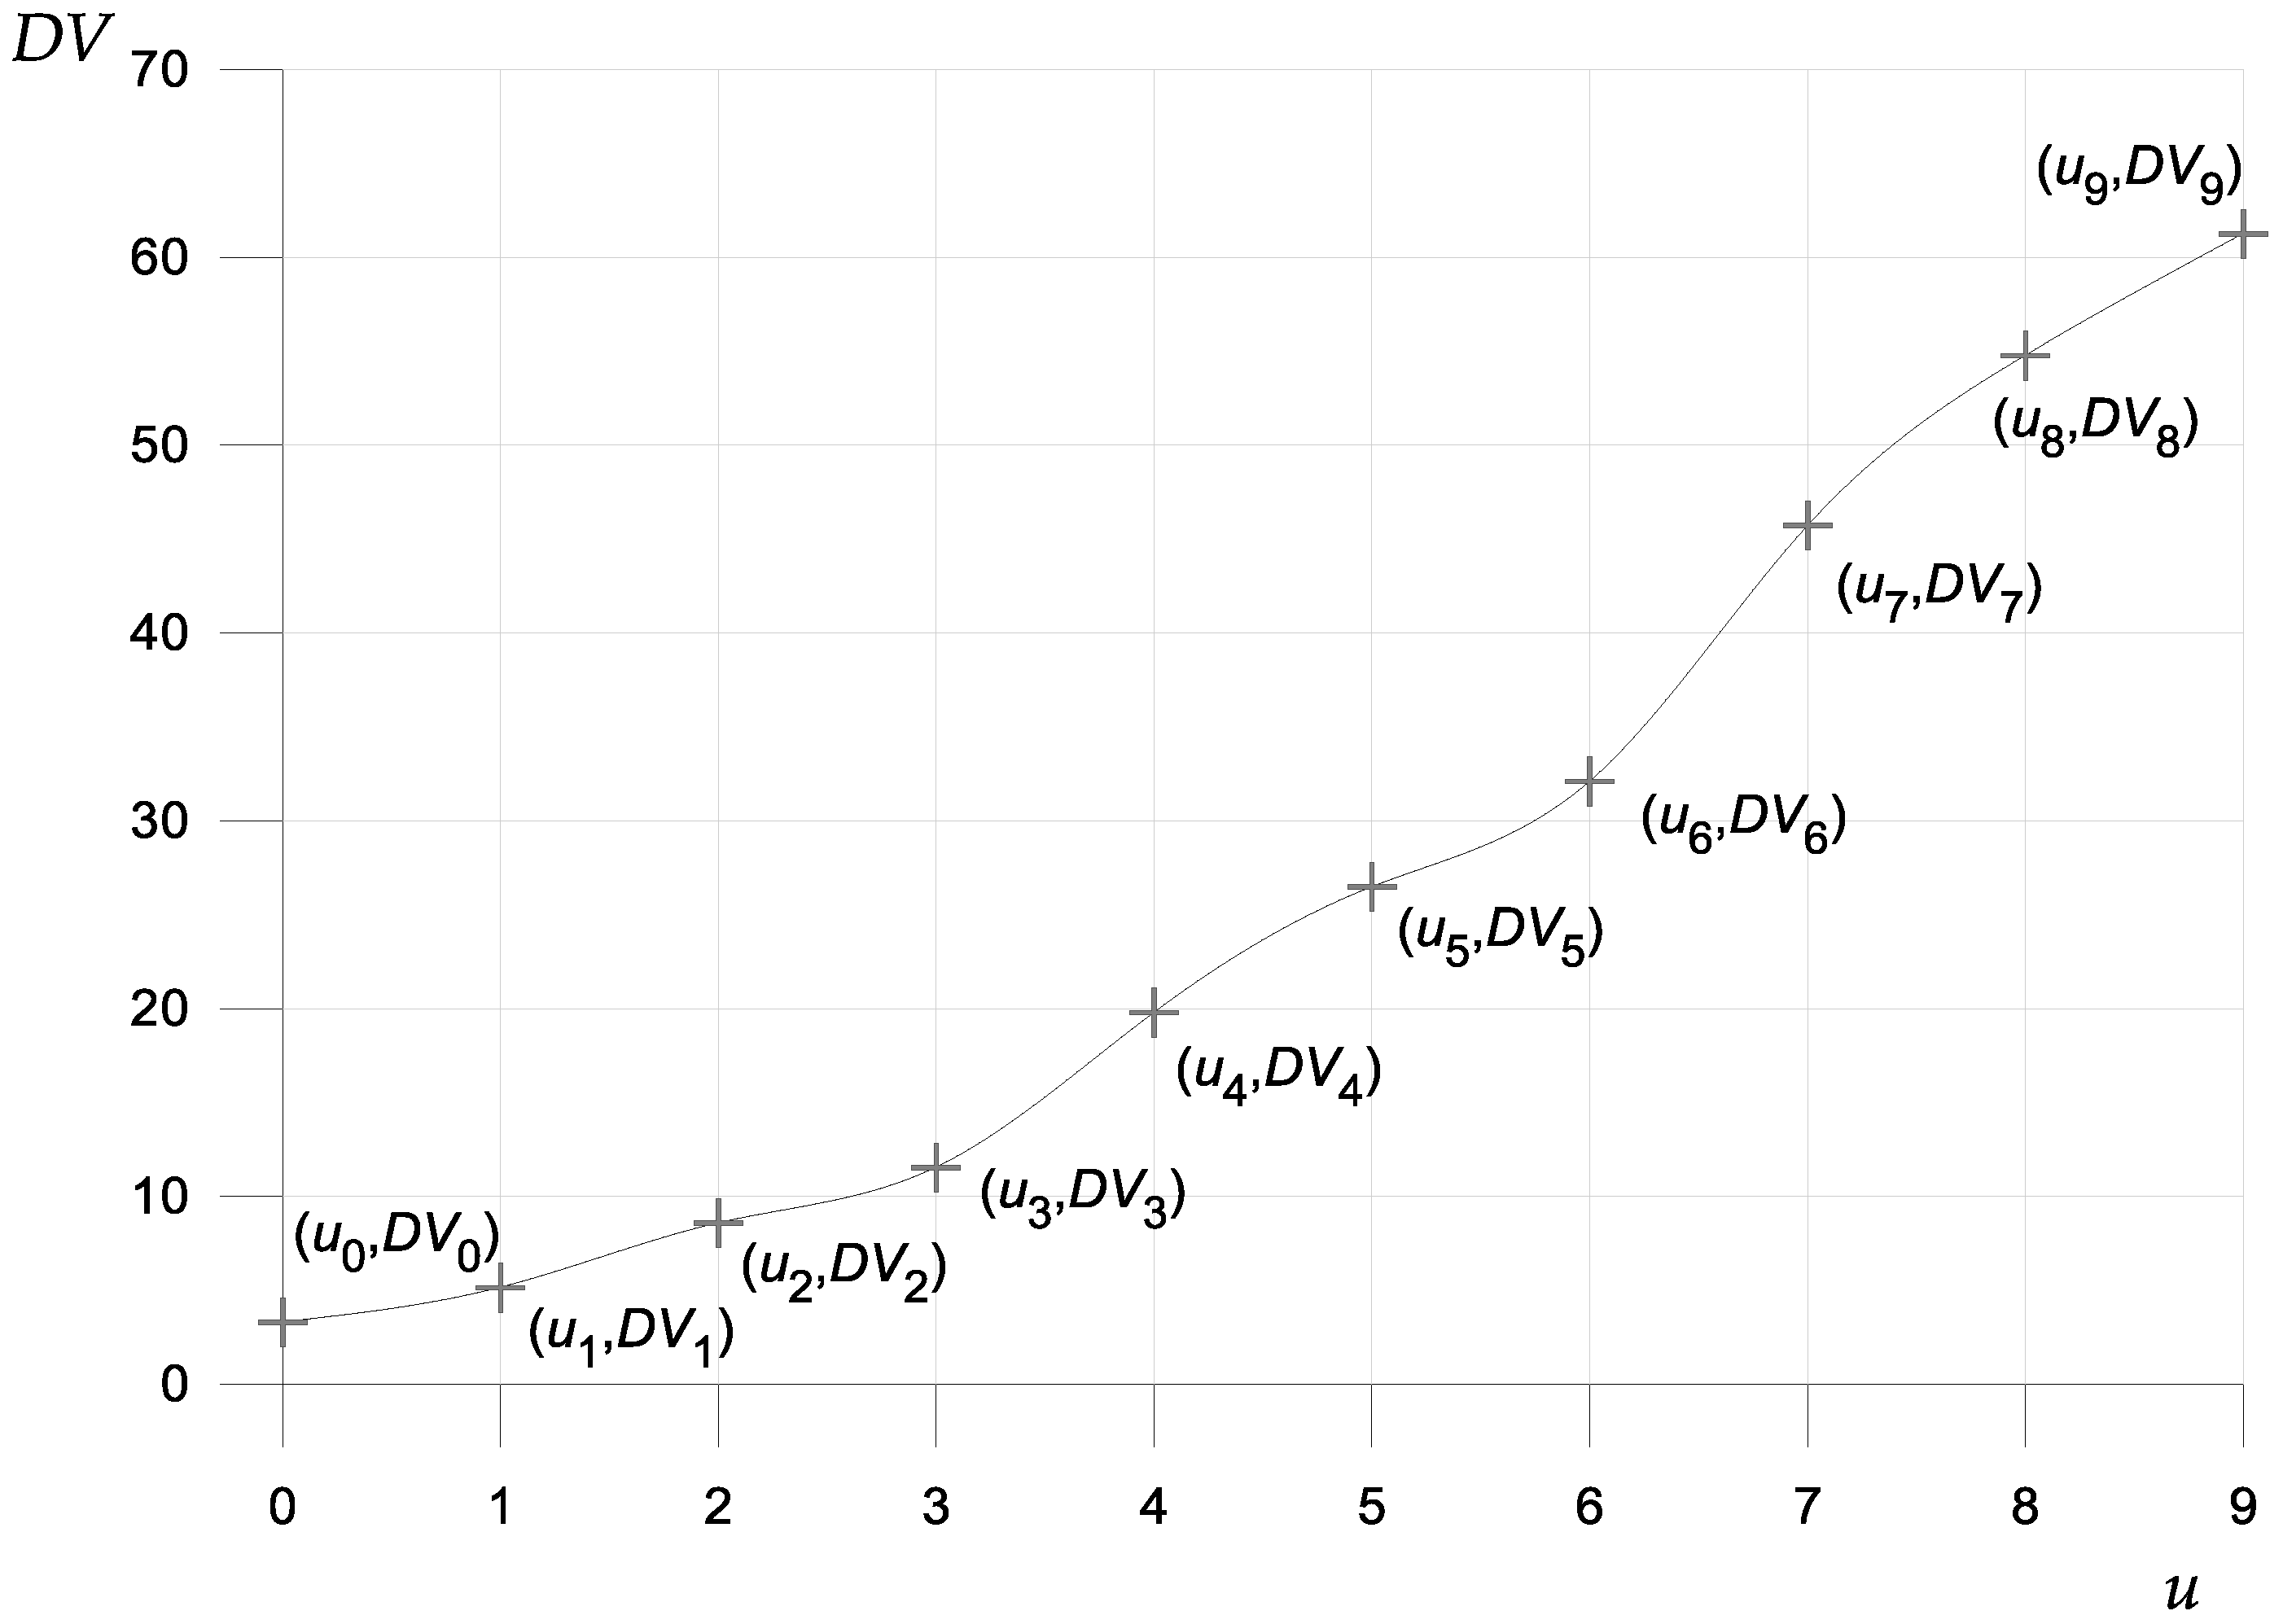
Figure 7.
Regressions on 109 SU between PAVERTM PCI and calculated PCI using VBA program. (a) ASTM D6433 (20 distresses); (b) New merged distress identification catalogue (10 distresses); (c) New distress identification catalogue including two new distress definitions (11. Manholes and 12. Tree roots).


Figure 8.
Example of manhole distress identification guidelines.

Table 1.
American Society for Testing and Materials (ASTM) D6433 distress identification catalogue asphalt concrete list of distresses.
Table 1.
American Society for Testing and Materials (ASTM) D6433 distress identification catalogue asphalt concrete list of distresses.
| Distress ID | Description | Unit of Measure | Group | Cause |
|---|---|---|---|---|
| 1 | Alligator cracking | Square meters | Cracking | Load |
| 2 | Bleeding | Square meters | Surface defects | Other |
| 3 | Block cracking | Square meters | Cracking | Load |
| 4 | Bumps and sags | Linear meters | Visco-plastic deformations | Load, climatic, other |
| 5 | Corrugation | Square meters | Visco-plastic deformations | Climatic, other |
| 6 | Depression | Square meters | Visco-plastic deformations | Other |
| 7 | Edge cracking | Linear meters | Cracking | Climatic |
| 8 | Joint reflection | Linear meters | Cracking | Climatic |
| 9 | Lane/shoulder drop-off | Linear meters | Visco-plastic deformations | Other |
| 10 | Longitudinal and transverse cracking | Linear meters | Cracking | Climatic |
| 11 | Patching and utility cut patching | Square meters | Others | Other |
| 12 | Polished aggregate | Square meters | Surface defects | Traffic |
| 13 | Potholes | Number | Potholes | Traffic, load |
| 14 | Railroad crossing | Square meters | Others | Other |
| 15 | Rutting | Square meters | Visco-plastic deformations | Load |
| 16 | Shoving | Square meters | Visco-plastic deformations | Other |
| 17 | Slippage cracking | Square meters | Cracking | Traffic |
| 18 | Swell | Square meters | Visco-plastic deformations | Climatic |
| 19 | Raveling | Square meters | Surface defects | Other |
| 20 | Weathering (surface wear) | Square meters | Surface defects | Other |
Table 2.
Distress frequency in an Italian road network.
| Distress Category | ASTM D6433 Distress Description | Total Density Frequency | Density (%) | Total Deduct value (DV) | Deduct value (DV) (%) |
|---|---|---|---|---|---|
| Low frequency distresses | 2. Bleeding; 12. Polished Aggregate; 14. Railroad crossing; 16. Shoving; 17. Slippage cracking; 18. Swell; 20. Weathering (surface wear) | 0.49 | 1 | 168 | 1 |
| Cracking | 7. Edge cracking; 8. Joint reflection; 9. Lane/shoulder drop-off; 10. Longitudinal and transverse cracking | 17.50 | 49 | 3805 | 27 |
| Surface deformations | 4. Bumps and sags; 5. Corrugation; 6. Depression | 5.08 | 14 | 1917 | 14 |
| Raveling | 19. Raveling | 2.80 | 8 | 2027 | 15 |
| Alligator cracking | 1. Alligator cracking | 3.77 | 10 | 958 | 7 |
| Block cracking | 3. Block cracking | 3.28 | 9 | 1467 | 11 |
| Rutting | 15. Rutting | 1.18 | 3 | 102 | 1 |
| Patching | 11. Patching and utility cut patching | 1.84 | 5 | 1492 | 11 |
| Potholes | 13. Potholes | 0.32 | 1 | 1786 | 13 |
| Total | 36.26 | 100 | 13,722 | 100 | |
Table 3.
Road pavement distress distribution by PCI condition in Urban Areas.
| Distress Category | ASTM D6433 Distress Description | Percentage of Observed Distress in Adequate Conditions | Percentage of Observed Distress in Medium Condition | Percentage of Observed Distress in Unsatisfactory Conditions |
|---|---|---|---|---|
| Cracking | 3. Block cracking, 7. Edge cracking, 8. Joint reflection, 9. Lane Shoulder Drop-off, 10 longitudinal and transverse cracking, 17. Slippage cracking | 37% | 33% | 17% |
| Visco-plastic deformations | 4. Bumps and sags, 5. Corrugation, 6. Depression, 16. Shoving, 18. Swell. | 33% | 24% | 10% |
| Surface defects | 2. Bleeding, 12. Polished Aggregate 19. Raveling, 20. Weathering | 14% | 15% | 6% |
| Potholes | 13. Potholes | 8% | 10% | 16% |
| Other | 11. Patching and utility cut patching, 14. Railroad crossing. | 8% | 13% | 9% |
| Alligator Cracking | 1. Alligator cracking) | 0% | 5% | 27% |
| Rutting | 15. Rutting | 0% | 0% | 15% |
Table 4.
New distress identification catalogue asphalt concrete pavement for urban areas.
| Distress ID | Distress Description | Unit of Measure | Group of Distress | Cause | Combination ASTM D6433 Distress |
|---|---|---|---|---|---|
| N_1 | Alligator cracking | Square meters | Cracking | Load | 1. Alligator Cracking |
| N_2 | Block cracking | Square meters | Cracking | Climatic | 3. Block cracking |
| N_3 | Linear and isolated cracking | Linear meters | Cracking | Climatic/Poor construction | 7. Edge cracking; 8. Joint reflection; 10. Longitudinal and transverse cracking, 9. Lane/Shoulder Drop-off |
| N_4 | Surface deformations | Square meters | Visco-plastic deformations | Subsidence/Poor construction | 4. Bumps and sags; 5. Corrugation, 6. Depression, 18. Swell |
| N_5 | Rutting | Square meters | Visco-plastic deformations | Load | 15. Rutting |
| N_6 | Failure surface grip | Square meters | Surface Defects | Bituminous mixture low quality | 2. Bleeding, 12. Polished Aggregate, 19. Raveling, 20. Weathering (Surface wear) |
| N_7 | Potholes | Number | Potholes | Traffic, Load | 13. Potholes |
| N_8 | Patching | Square meters | Others | Other | 11. Patching and Utility Cut |
| N_9 | Railroad crossing | Square meters | Others | Other | 14. Railroad crossing |
| N_10 | Slippage cracking | Square meters | Visco-plastic deformations | Bituminous mixture low quality | 16. Shoving, 17. Slippage cracking |
| N_11 | Manholes | Square meters | Others | Other | 6. Depression, 11. Patching and Utility Cut Patching |
| N_12 | Tree roots | Linear meters | Others | Other | 14. Railroad crossing, 11. Patching and Utility Cut Patching, 18. Swell |
Table 5.
Severity levels definitions for urban pavement distresses identification catalogue.
| No | Distress Type | Severity Level | Description | Unit of Measure |
|---|---|---|---|---|
| N_3 | Linear and isolated cracking | Low | Mild non-sealed cracks with a mean amplitude lower than 1 cm | Linear meters. |
| Medium | Average cracks with a mean amplitude between 1 and 7.5 cm | |||
| High | Cracks with a mean amplitude >7.5 cm | |||
| N_4 | Surface deformations | Low | Depth of pavement depressions between 1 and 2.5 cm, with associated high ride quality. | Square meters. |
| Medium | Depth of pavement depressions between 2.5 and 5 cm, with associated medium ride quality. | |||
| High | Depth of pavement depressions > 5 cm, with associated badly ride quality. | |||
| N_6 | Failure surface grip | Low | Sticky surface only a few days a year, aggregates and bitumen begin to be removed. | Square meters. |
| Medium | Sticky surface few weeks a year or erosion level such as to have moderately wrinkled texture. | |||
| High | Sticky surface for at least a few weeks a year, or very rough texture. | |||
| N_10 | Slippage cracking | Low | Good ride quality and/or crack amplitude <1.0 cm. | Square meters. |
| Medium | Average ride quality and/or crack amplitude between 1.0 and 4.0 cm with crack surrounding area moderately crushed. | |||
| High | Low ride quality and/or crack amplitude >4 cm; surrounding area highly cracked into removable pieces. | |||
| N_11 | Manholes | Low | Low influence on ride quality | Square meters. |
| Medium | Medium influence on ride quality with an elevation of manhole <5 cm; The surrounding area is slightly cracked. | |||
| High | High influence on ride quality; Elevation over the roadway level >5 cm; the surrounding area is significantly cracked. | |||
| N_12 | Tree Roots | Low | The height above road surface is less than 10 cm with medium traffic influence. | Square meters. |
| Medium | Height above road surface between 10 to 20 cm and low to medium traffic influence, or height <10 cm with high influence on traffic. | |||
| High | High influence on traffic with an height above road surface >10 cm. |
Table 6.
Statistical parameters of automated procedure PCI calculation (ANOVA F-test).
| Sum of Squares (SS) | Mean Square (MS) | MS Regression/MS Residual (F) | Significance F | ||
|---|---|---|---|---|---|
| ASTM D6433 PCI calculation (20 distresses) | Regression | 58578.94 | 58578.94 | 10171.10 | 6.70E-108 |
| Residual | 616.25 | 5.76 | – | – | |
| Total | 59195.19 | – | – | – | |
| New distress identification catalogue (10 distresses) | Regression | 58032.34 | 58032.34 | 5339.83 | 3.79E-93 |
| Residual | 1162.86 | 10.87 | – | – | |
| Total | 59195.19 | – | – | – | |
| New distress identification catalogue (12 distresses) | Regression | 57933.82 | 57933.82 | 4914.41 | 2.94E-91 |
| Residual | 1261.38 | 11.79 | – | – | |
| Total | 59195.19 | – | – | – | |
Table 7.
Regression coefficient of the automated procedure for PCI calculation.
| Regression Model | Coefficient of Correlation | Coefficient of Determination | Adjusted R2 | Standard Error |
|---|---|---|---|---|
| ASTM D6433 PCI calculation (20 distresses) | 0.995 | 0.989 | 0.989 | 2.40 |
| New distress identification catalogue (10 distresses) | 0.990 | 0.980 | 0.981 | 3.30 |
| New distress identification catalogue (12 distresses) | 0.989 | 0.979 | 0.979 | 3.43 |
Table 8.
Comparative analysis between ASTM D6433 and New Distress Identification Manual for Urban Pavements: N_11 Manholes.
Table 8.
Comparative analysis between ASTM D6433 and New Distress Identification Manual for Urban Pavements: N_11 Manholes.
| No | Distress Type | Severity Level | Distress Quantity | Distress Density | DV |
|---|---|---|---|---|---|
| 10 | Longitudinal and transverse cracking | L | 6.40 | 2.10 | 0.98 |
| 6 | Depression | L | 1.30 | 0.43 | 4.46 |
| 13 | Potholes | H | 1.00 | 0.33 | 33.81 |
| 4 | Bumps and sags | L | 1.39 | 0.45 | 1.36 |
| 11 | Patching and Utility Cut Patching | M | 5.00 | 1.64 | 12.78 |
| – | PCI | Fair | 58 | ||
| N_3 | Linear and isolated cracking | L | 6.40 | 2.10 | 1.70 |
| N_4 | Surface deformations | L | 1.30 | 0.43 | 2.70 |
| N_7 | Potholes | H | 1.00 | 0.33 | 33.81 |
| N_4 | Surface deformations | L | 1.39 | 0.45 | 2.71 |
| N_11 | Manholes | H | 5.00 | 1.64 | 23.15 |
| – | – | – | PCI | Poor | 54 |
Table 9.
Comparative analysis between ASTM D6433 and New Distress Identification Manual for Urban Pavements: N_12 Tree roots.
Table 9.
Comparative analysis between ASTM D6433 and New Distress Identification Manual for Urban Pavements: N_12 Tree roots.
| No | Distress Type | Severity Level | Distress Quantity | Distress Density | DV |
|---|---|---|---|---|---|
| 4 | Bumps and sags | M | 7.90 | 3.31 | 23.58 |
| 3 | Block cracking | M | 2.21 | 0.92 | 2.22 |
| 10 | Longitudinal and transverse cracking | L | 2.00 | 0.84 | 2.00 |
| 10 | Longitudinal and transverse cracking | M | 14.40 | 6.03 | 13.00 |
| 18 | Swell | M | 3.40 | 1.42 | 15.04 |
| 7 | Edge cracking | M | 2.10 | 0.88 | 4.89 |
| 3 | Block cracking | L | 17.09 | 7.15 | 6.21 |
| 7 | Edge cracking | L | 17.40 | 7.28 | 4.29 |
| 11 | Patching and Utility Cut Patching | M | 3.12 | 1.31 | 11.25 |
| 18 | Swell | L | 5.00 | 2.09 | 4.32 |
| – | – | – | PCI | Fair | 59 |
| N_4 | Surface deformations | M | 8.61 | 3.60 | 22.31 |
| N_2 | Block cracking | M | 2.21 | 0.92 | 2.22 |
| N_3 | Linear and isolated cracking | L | 19.40 | 8.12 | 5.27 |
| N_3 | Linear and isolated cracking | M | 16.50 | 6.90 | 12.88 |
| N_2 | Block cracking | L | 17.09 | 7.15 | 6.21 |
| N_8 | Patching | M | 3.12 | 1.31 | 11.25 |
| N_12 | Tree roots | H | 5.00 | 2.09 | 30.62 |
| – | – | – | PCI | Poor | 52 |
The N_4 Surface deformations quantity is not the sum of 4. Bumps and sags and 18 Swell because the 4. Bumps and sags distress is measured in linear meters instead of square meters.
© 2017 by the authors. Licensee MDPI, Basel, Switzerland. This article is an open access article distributed under the terms and conditions of the Creative Commons Attribution (CC BY) license (http://creativecommons.org/licenses/by/4.0/).
Share and Cite
MDPI and ACS Style
Loprencipe, G.; Pantuso, A. A Specified Procedure for Distress Identification and Assessment for Urban Road Surfaces Based on PCI. Coatings 2017, 7, 65. https://doi.org/10.3390/coatings7050065
AMA Style
Loprencipe G, Pantuso A. A Specified Procedure for Distress Identification and Assessment for Urban Road Surfaces Based on PCI. Coatings. 2017; 7(5):65. https://doi.org/10.3390/coatings7050065
Chicago/Turabian StyleLoprencipe, Giuseppe, and Antonio Pantuso. 2017. "A Specified Procedure for Distress Identification and Assessment for Urban Road Surfaces Based on PCI" Coatings 7, no. 5: 65. https://doi.org/10.3390/coatings7050065
Note that from the first issue of 2016, this journal uses article numbers instead of page numbers. See further details here.