Particle Velocities near and along the Electrode during Electrophoretic Deposition: Influence of Surfactant Counter-Ions

Institut UTINAM, UMR-CNRS 6213, Université de Bourgogne—Franche-Comté, 16 Route de Gray, CEDEX 25030 Besançon, France
*
Author to whom correspondence should be addressed.
Coatings 2017, 7(9), 147; https://doi.org/10.3390/coatings7090147
Submission received: 11 July 2017
/
Revised: 4 September 2017
/
Accepted: 11 September 2017
/
Published: 14 September 2017
(This article belongs to the Special Issue Electrophoretic Deposition)
Abstract
:Research into the micro-nanostructured coatings process has made a variety of new applications available. Electrophoretic deposition (EPD) is an efficient and attractive technique to produce coated materials. Therefore the understanding of the formation and growth mechanism of the coating process continues to be investigated. In this study, a home-made EPD laminar flow cell was used for in-situ investigation of the particle velocity and deposition of micronic particles on a cathode. Monodisperse polystyrene latex particles were functionalized with cationic surfactants: cetyltrimethyl ammonium bromide (CTAB) or cetyltrimethyl ammonium chloride (CTAC). The tangential velocity of the particles when they migrated to the electrode, the approach angle and the tangential velocity along the electrode were measured under a DC electric field. From the values of the velocities, the particle-electrode distance was evaluated in CTAB and CTAC solutions. The electrophoretic velocity was calculated from the electrophoretic mobility of the particles and the electric field applied to the particles. All these parameters depend on the type of surfactant counter-ions and influence the growth of the coating. Dense structures were obtained in CTAB solution while open structures were observed in CTAC solution.
1. Introduction
An expanding area in materials processing is the controlled assembly of colloidal particles on a substrate. The production of these materials is of interest in a large range of applications, such as composite coatings, adhesion of paints, optical devices, optoelectronic materials, biological and chemical sensors. Of the different techniques to produce thick or thin particle films, electrophoretic deposition (EPD) is often used because of its low cost and high versatility. Organic, inorganic and hybrid particles can be deposited on different types and shapes of substrates [1]. Many studies have been performed on EPD and its applications, showing the influence of the process parameters on the final materials [2,3,4,5,6,7]. Efforts were made to understand the mechanism of formation and growth of the coating such as the effect of the distortion and thinning of the double layer [8], the kinetics [7], the initial pH value of the solution and the local pH increase near the cathode [9,10]. Long-range interactions between particles near an electrode have also been observed and explained by local electro-osmotic and electro-hydrodynamic fluid flow around a deposited particle [11,12,13,14,15]. Using a specific home-made apparatus, we observed this effect on the growth of particle aggregates near a cathode and we used it to obtain a high surface coverage in a laminar flow cell [16]. Recently, Giera et al. [17] developed a model to investigate the effects of empirical parameters, such as electric field strength and intercolloidal interactions on the degree of colloidal ordering during EPD. However, a complete understanding of the mechanism of particle deposition and assembly has not yet been established. The particle velocity near an electrode wall is also a parameter which influences the growth and the morphology of the coating. It has been measured in an electric field without fluid flow [18,19], in a laminar flow without an electric field [20] or in a microchannel with an electric field applied parallel to the wall [21]. But, to our knowledge, the velocity of functionalized particles near an electrode in a laminar flow and with an electric field perpendicular to the flow (i.e., in the EPD conditions) has not yet been investigated. In the present study, we determined particle velocity during migration to the electrode as well as when particles move along the cathode. Monodisperse polystyrene (PS) latex particles were used as model particles. They were functionalized with two cetyltrimethyl ammonium-based cationic surfactants. We showed that the type of surfactant counter-ion (chloride or bromide) has an influence on particle velocity near the electrode and therefore on the growth and morphology of aggregates on the electrode. Using hydrodynamic and Derjaguin, Landau, Verwey and Overbeek (DLVO) models, the particle-electrode distance during the particle motion along the electrode has been estimated.
2. Materials and Methods
Monodisperse polystyrene (PS) latex particles having a density of 1.05 g cm−3 and an average diameter of 1.2 μm were synthesized at the Institute of Catalysis and Surface Chemistry (Krakow, Poland). They were washed by successive centrifugation and dispersion in ultrapure water. Zeta potential measurements show that they were negatively charged (−35 mV, in water pH 4, NaCl 10−3 M). Two cationic cetyltrimethyl ammonium surfactants with different anions, bromide (CTAB, >99% pure, Merck, Fontenay sous Bois, France), chloride (CTAC, >98% pure, Fluka, Saint Quentin Fallavier, France) were used as received without further purification. The critical micelle concentration (cmc) value for CTAB and CTAC are 9.4 × 10⁻⁴ M [22] and 1.3 × 10⁻⁴–1.6 × 10⁻⁴ M respectively [23]. The particle suspensions were prepared by adding the dispersion of particles into 250 mL of a surfactant solution (5 × 10⁻⁴ M) to obtain a final concentration of 1.25 × 10⁷ particles·cm−3. This low particle concentration was chosen in order not to perturb the hydrodynamic flow. Indeed, Warszinski et al. [24] demonstrate that the influence of particles on the colloid flow can be neglected if the volume fraction is below 5% (1012 particles·cm−3). All dispersions were adjusted to pH 4 with HCl and stirred for 12 h before experiments. The electrophoretic mobilities of the PS particles in water and in CTAB and CTAC solutions were measured with a microelectrophoresis cell (Mark II, Rank Brothers, Bottisham, UK) and the corresponding zeta potentials were then calculated using the Smoluchowski equation. The values of zeta potentials of PS particles dispersed in CTAB or CTAC solutions were equal to +33 mV and +54 mV, respectively. The electrodes were nickel disks of 12 mm diameter (99.0% pure, Goodfellow, Lille, France) that were mechanically polished with SiC emery paper and diamond powder down to 1 μm and cleaned by ultrasonication in ethanol. It has already been determined by electrochemical investigations that deposition takes place on nickel and not on a nickel oxide layer [16]. The working electrode potential versus the reference electrode (Ag/AgCl) was monitored by means of a potentiostat (Voltalab PGP 201, Radiometer Analytical, Lyon, France).
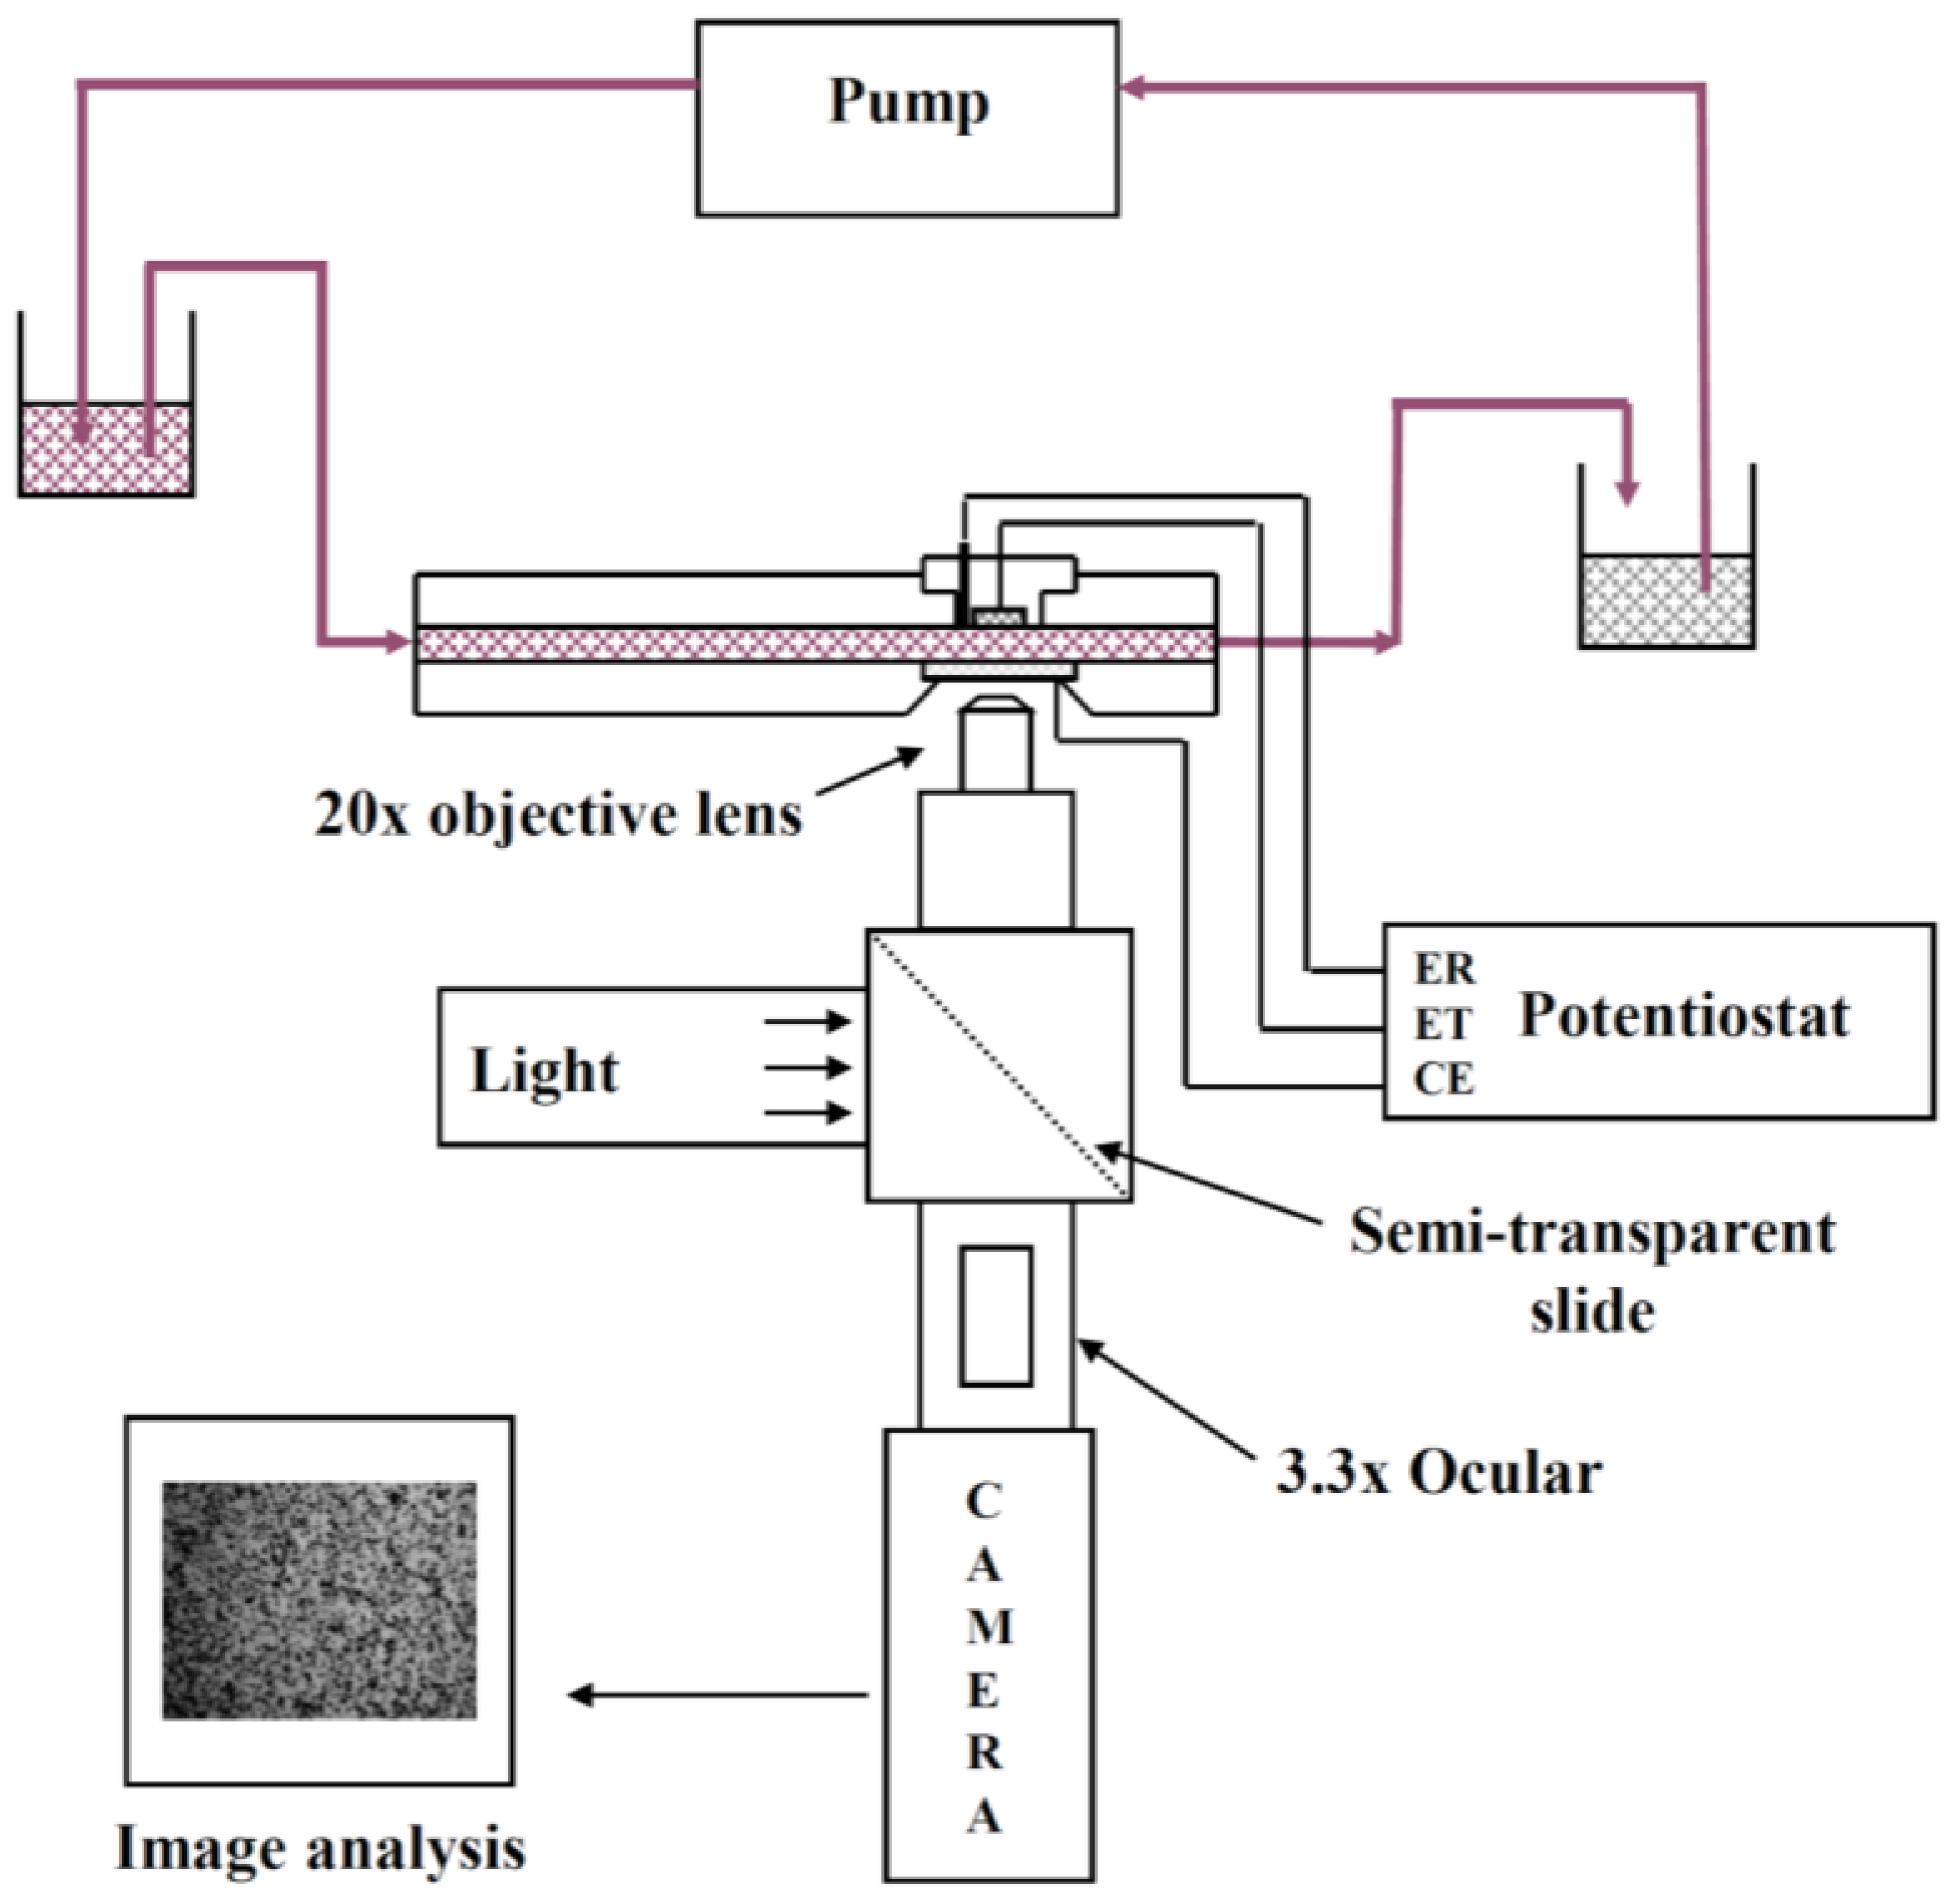
An EPD laminar flow cell was specifically designed for in situ investigation of electrophoretic deposition of micronic particles (of 0.8–100 μm) on a metallic substrate. The apparatus has been described previously [16,25]. Briefly, it contains a laminar flow cell combined with an optical set-up and an image analysis system (Figure 1). This type of cell is of practical significance since it constitutes one of the technological geometries used for electrodeposition of materials and it allows the in-situ observation of the migration and deposition of a particle on an electrode. Moreover it allows continuous circulation of the suspension with constant particle concentration. A decrease in the number of particles due to particle deposition on the cathode is negligible under the experimental conditions of this study (<0.2%).
The suspension flows in a rectangular channel between two parallel plates made of poly(methyl methacrylate) (PMMA). In one plate acting as the cathode a removable plug comprising the circular metallic electrode (about 1 cm in diameter) is inserted. The other plate contains a conductive glass slide, coated with a tin oxide film, acting both as window and counter electrode. The distance between the two facing electrodes is 2 mm. A silver wire treated with hydrochloric acid (1 M) and saturated KCl solutions is inserted through the plug to act as the Ag/AgCl reference electrode. For all experiments the cathode and the glass window were placed vertically in front of the objective and the particles flowed tangentially to these electrodes. Steady flow in the channel is maintained by gravity. A peristaltic pump allowed recycling in order to maintain constant liquid levels between two vessels before and after the laminar flow cell. The conductivity of the suspension during deposition was measured in the vessel at the output of the cell with a conductivity meter (Mettler Seven Easy, Viroflay, France). The values were 190 and 102 μS cm−1 for CTAB and CTAC solutions, respectively. An electrophoretic force ensures the particle flux to the electrode in this cell. A constant potential of −1.5 V (versus Ag/AgCl) was applied between the nickel and the tin oxide electrodes using a power supply (EG & G Princeton Applied Research, Elancourt, France). The electric potential and current across the cell were measured using a Generis digital multimeter (ESAO 4, Jeulin, Evreux, France). All experiments were performed at pH 4, at room temperature and at a constant flow rate of 3 mL min−1 and repeated at least twice. These experimental conditions were chosen to compare the results with previous experiments [26]. The optical set-up used to observe particle behavior was composed of a microscope (Olympus BH2-UMA, Olympus, Rungis, France) equipped with a long working distance objective (mag. 20×), a 3.3× intermediate lens, a cold light lamp, a camera, a video recorder and an image analysis system. The magnification power (mag. 1000×) was high enough to observe the movement of micrometric particles near the working electrode through the window (i.e., the counter electrode) and through the suspension. The camera focused on the center of the electrode to avoid any edge effects.
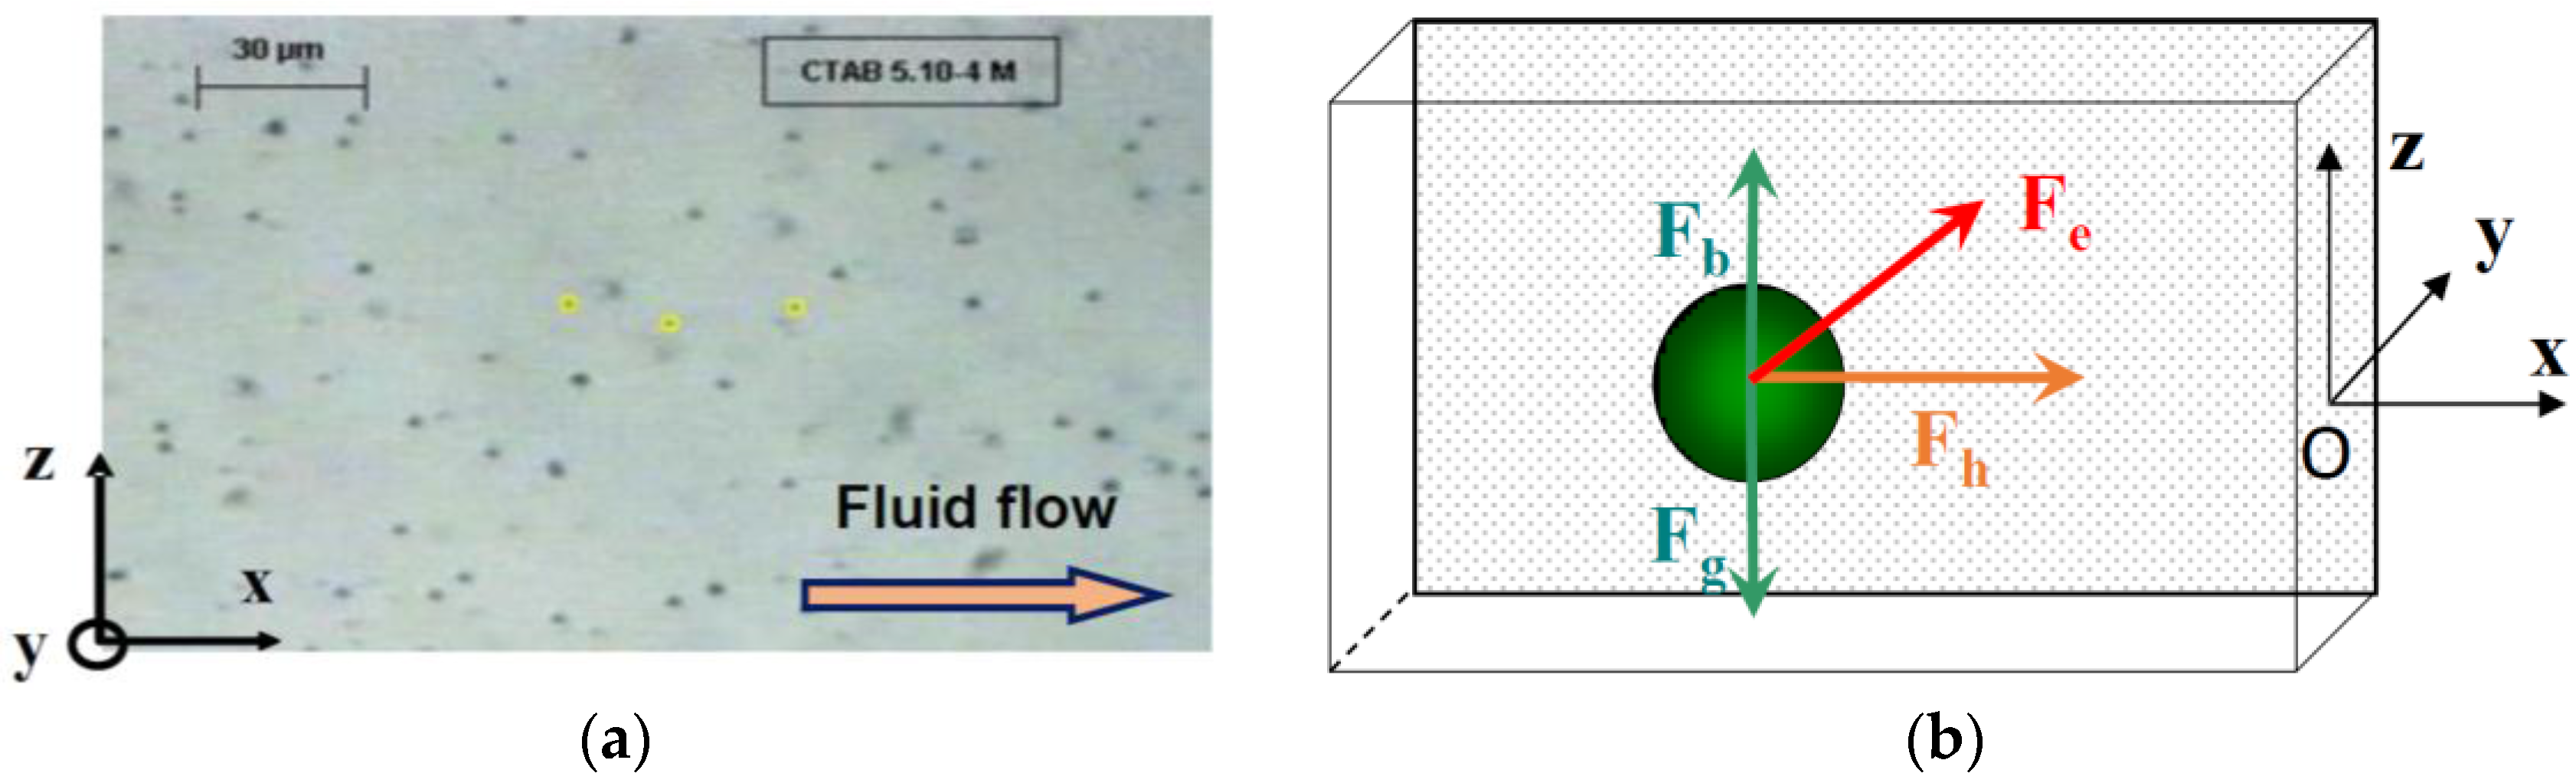
The measurements of particle velocity near the electrode were performed using Replay and Ellix softwares (MICROVISION Instruments, Evry, France). Replay software (Version 4.0) was used to capture an image from the video film every second. The particle position along the x- and z-axes were measured on each image using Ellix software (Version 5.0) (Figure 2a). The measurements were done at different distances from the electrode along the y-axis starting when particles were visible. For each y distance, the x-positions of about 15 particles were determined. We stopped the measurements when the particles stopped on the electrode or formed aggregates with other deposited particles or left the observed area.
In this cell, the particles are subjected to three external forces (Figure 2b) perpendicular to each other: the resultant of gravity and buoyancy forces (along the vertical z-axis), the hydrodynamic force parallel to the electrode (along the longitudinal x-axis) and the electrophoretic force directed toward the electrode (along the y-axis). The migration to the cathode is the result of the sum of these external forces.
The resultant of the gravity and buoyancy forces is a function of the size a and of the difference between the particle ρp and liquid ρf densities:
To determine the hydrodynamic force, we first checked that the fluid flow was laminar in this cell. The fluid velocity can be derived from the Navier-Stokes equation [27] for an incompressible fluid and a stationary flow along one direction (x-axis) which is the case for our experimental conditions. The fluid velocity profile between the two facing electrodes is then parabolic if the flow is laminar. We checked it by measuring the velocity of PS particles (4 μm in diameter) in the absence of an applied electric field and for different fluid flows up to 0.07 cm3 s−1 [25]. This last value corresponds to a Reynolds number of about one. In this case, the hydrodynamic force exerted by the fluid on a particle can be calculated from the Stokes drag law. It is proportional to the particle size a, the dynamic viscosity of the fluid η and to the particle velocity Vx [27]:
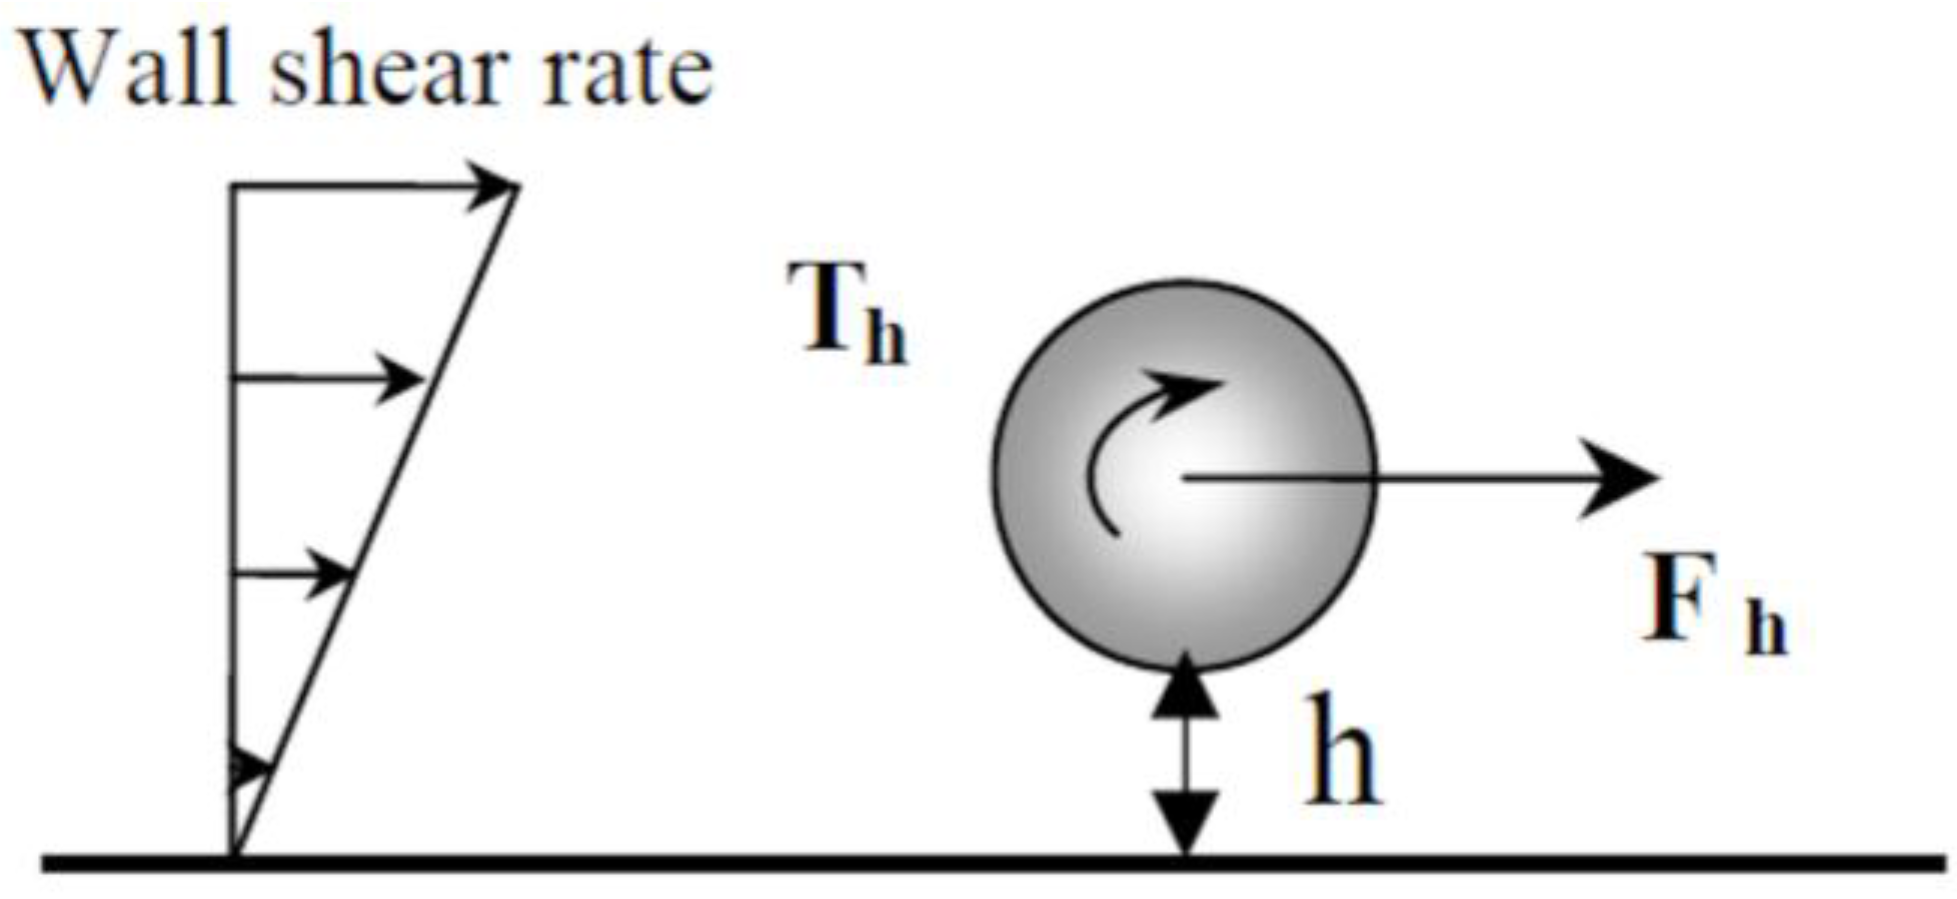
Due to the velocity gradient in the laminar flow cell, particles are also subjected to torque (Figure 3). Recently, weakly adhesive nanoscale features were used to facilitate rolling of microparticles in shear flow [20]. Using the EPD laminar flow cell, we observed the rotation of large particles (≈10 μm) but rolling was not visible for micronic particles.
The hydrodynamic force is modified near the wall [27,28] and becomes:
where H is the dimensionless distance (particle-substrate distance h/particle radius a). In a laminar flow, the tangential velocity of the particles near the wall VTx depends on the wall shear rate G (s−1) and is given as follows:
where f(H) is the correlation function determined by [28]
For particles having a radius of 600 nm, we consider that the condition (H << 1) is verified for a distance below 50 nm. In the laminar flow cell, the wall shear rate G is defined as G = 6Q/(L·l²) where L is the cell width (2 cm) and l is the cell thickness (2 mm). For a fluid flow equal to 3 mL min−1, the wall shear rate is equal to 3.7 s−1.
Close to the electrode, particles are also submitted to a lifting force [29]. First-order equation was considered to evaluate its value:
Under our experimental conditions (ρf ≈ 1000 kg m−3, ηf ≈ 1 mPa·s, a = 600 nm) the hydrodynamic and lifting forces were calculated for different particle velocities Vx (1–100 μm s−1) using Equations (2) and (7). In the case of the highest value of the velocity, the lifting force is about one thousand times lower than the hydrodynamic force, therefore it is not considered significant.
The transport of particles in a solution is controlled by the hydrodynamic effects (convection) but also by the thermic effect (diffusion). The Peclet number (ratio of convection to diffusion rates) defined for wall shear flow as Pe// = G·a2/D is 3.3 where G = 3.7 s−1, a = 600 nm and D is the particle coefficient diffusion equal to 3.6 × 10⁻¹³ m2. Therefore, the transport by diffusion is considered negligible for our study.
The electrophoretic force depends on the applied electric field and on the size and zeta potential of the particles, so it will act on charged particles in low ionic strength solution. In an infinite liquid media and for a Debye layer having a thickness much lower than the particle size, the electrophoretic force derived from the Smoluchovski equation [27] is:
where ε is the dielectric permittivity, ζ is the zeta potential of the particle and E is the electric field applied to the particles.
When the particles approach the electrode, the electrophoretic force is also modified. Fransaer [30] modelized this force and showed that for H < 1 (i.e., for the distance below the particle radius), it is about 2–5 times higher than the electrophoretic force in the bulk suspension.
Calculations of the trajectory of a particle near the wall will also depend on the sum of the colloidal forces acting on it. Short range interactions (van der Waals, double layer, specific interactions) between particle and electrode take place near the cathode. The particle-electrode interaction potential was then calculated within the DLVO model considering the attractive (VvdW) and repulsive (VEDL) effects [31].
The Czanercki equation [32] was used for the retarded van der Waals contribution (VvdW):
where A123 is the Hamaker constant for the polystyrene particle-water-metal system (0.3 × 10⁻²¹ J) and λ is the wavelength (100 nm).
The electrostatic double layer contribution (VEDL) was calculated from the equation proposed by Ruckenstein and Prieve [33] for an electrolyte 1:1.
3. Results
Upon application of the potential, single particles were seen to migrate to the electrode. Most of them did not attach to the electrode but moved along the electrode. From the image analysis, the particle velocities along the x- and z- axes were determined. Figure 4 represents the z-position of different particles moving along the cathode (placed vertically) as a function of time for particles dispersed in CTAB solution. The z value is quite constant, which means that no sedimentation or flotation took place. The same trend was observed for particles in the CTAC solution. The particle density is close to the liquid density, therefore the result of the buoyancy and gravity forces is around zero (Equation (1)).
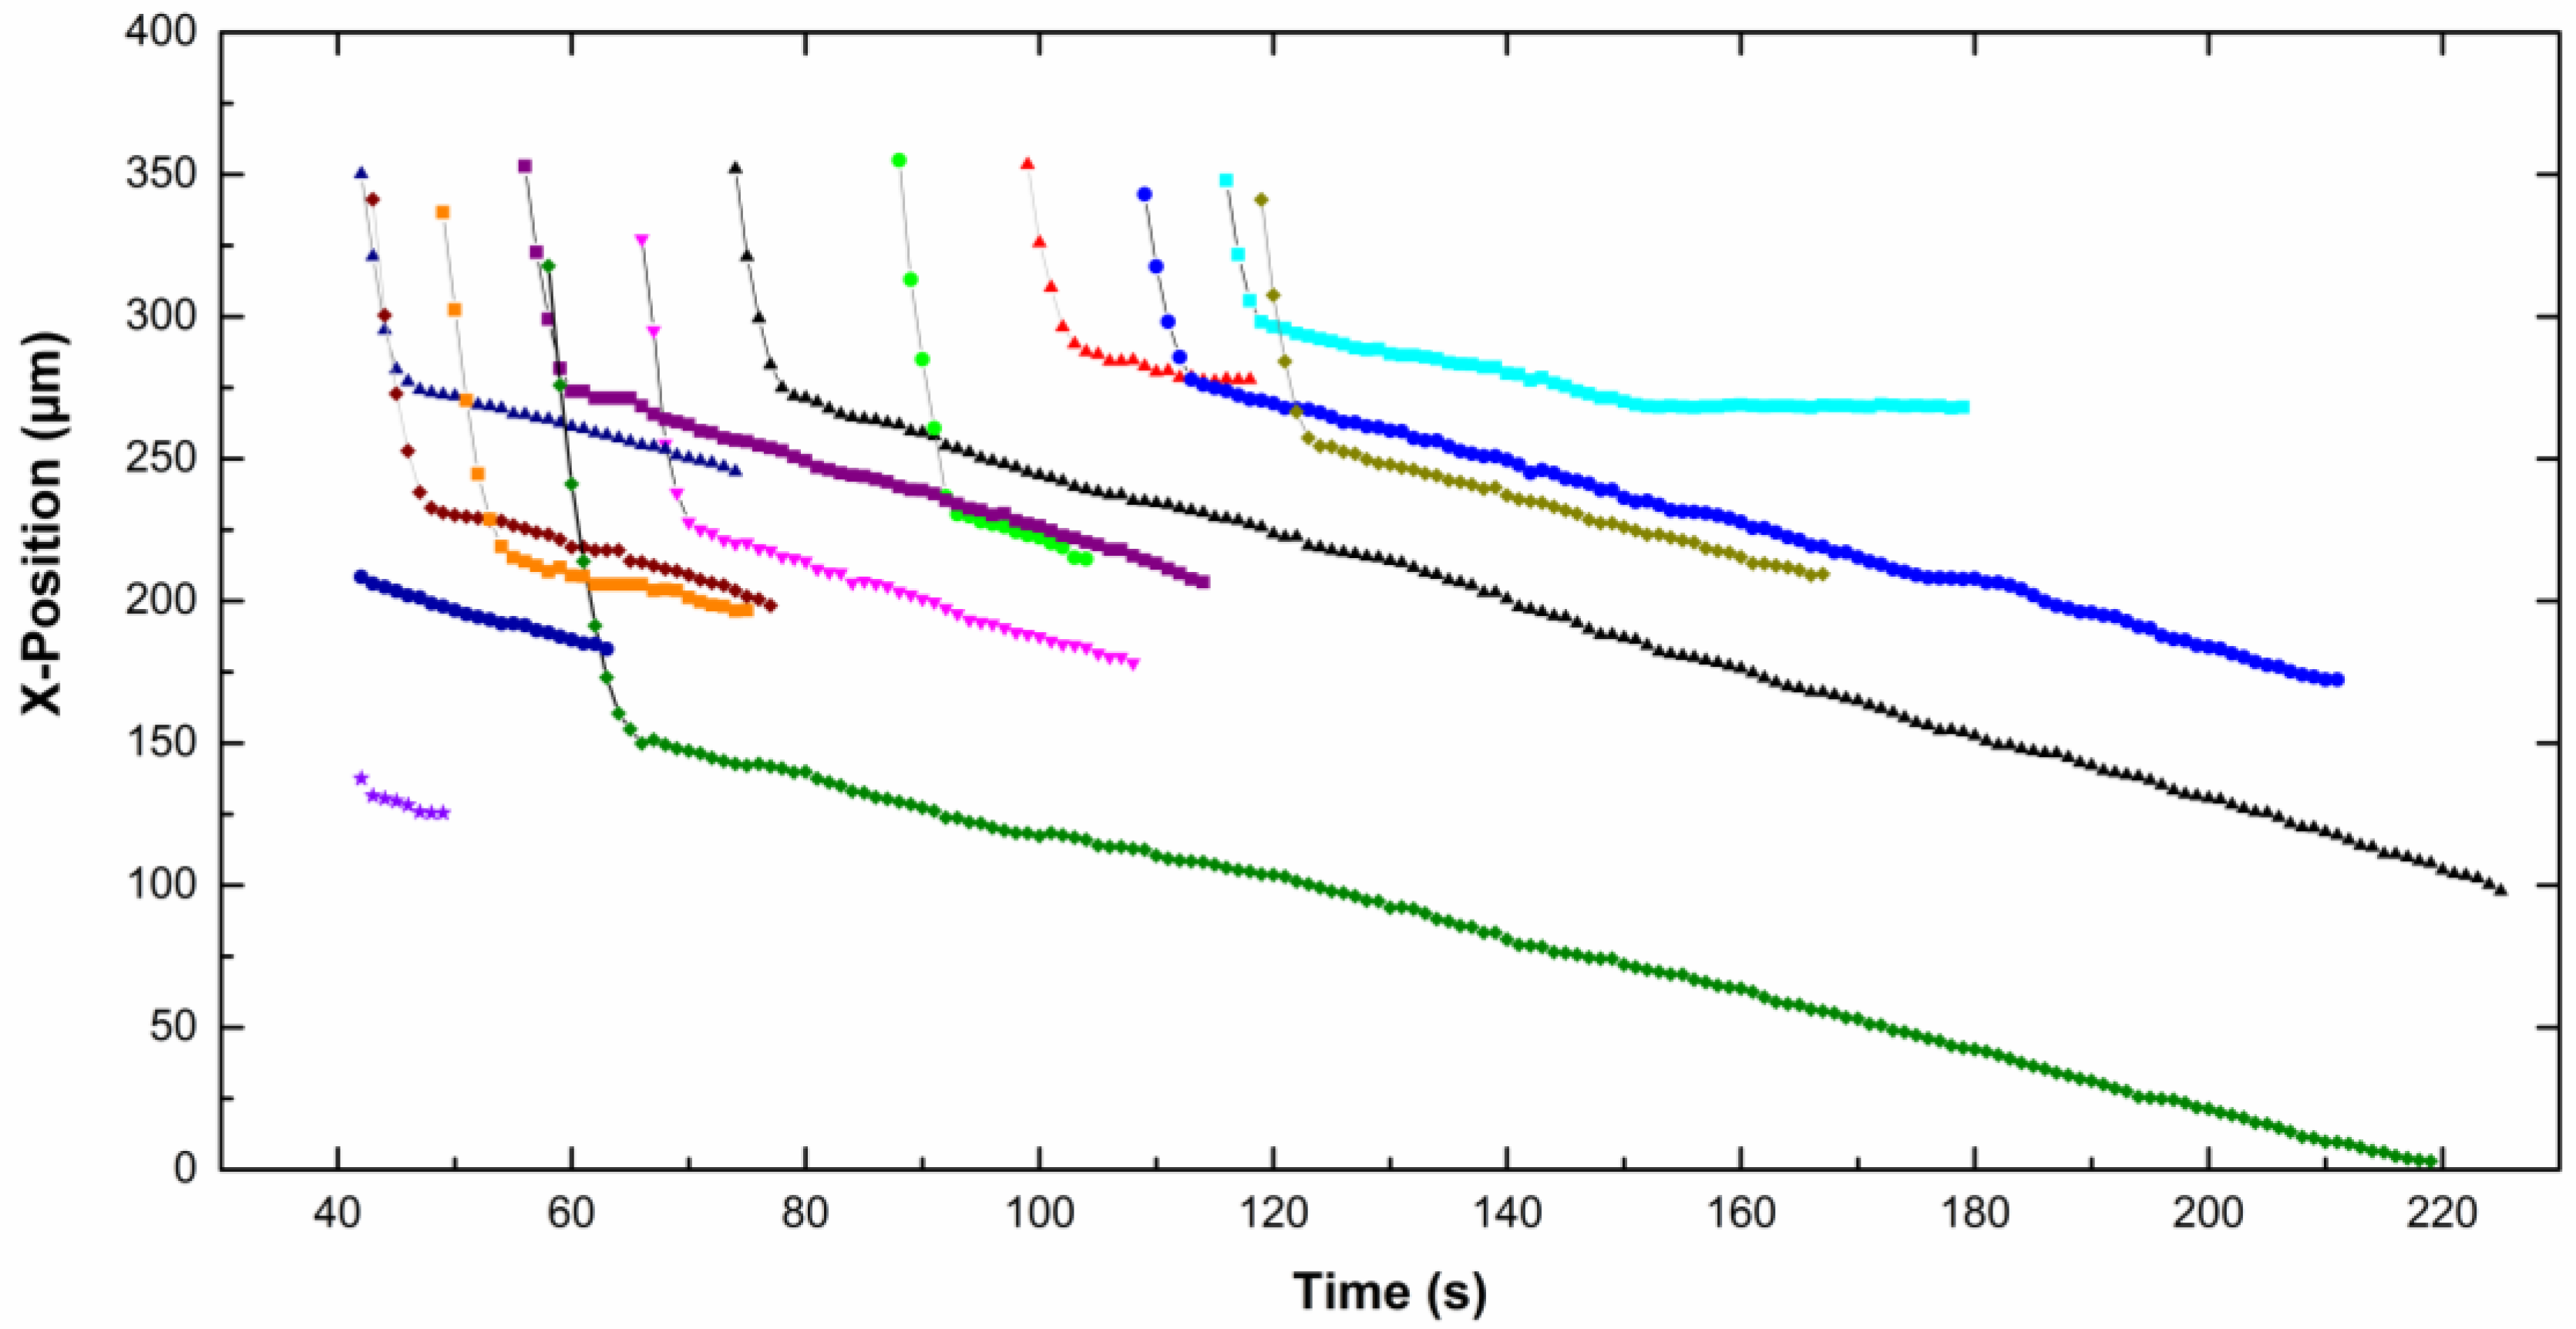
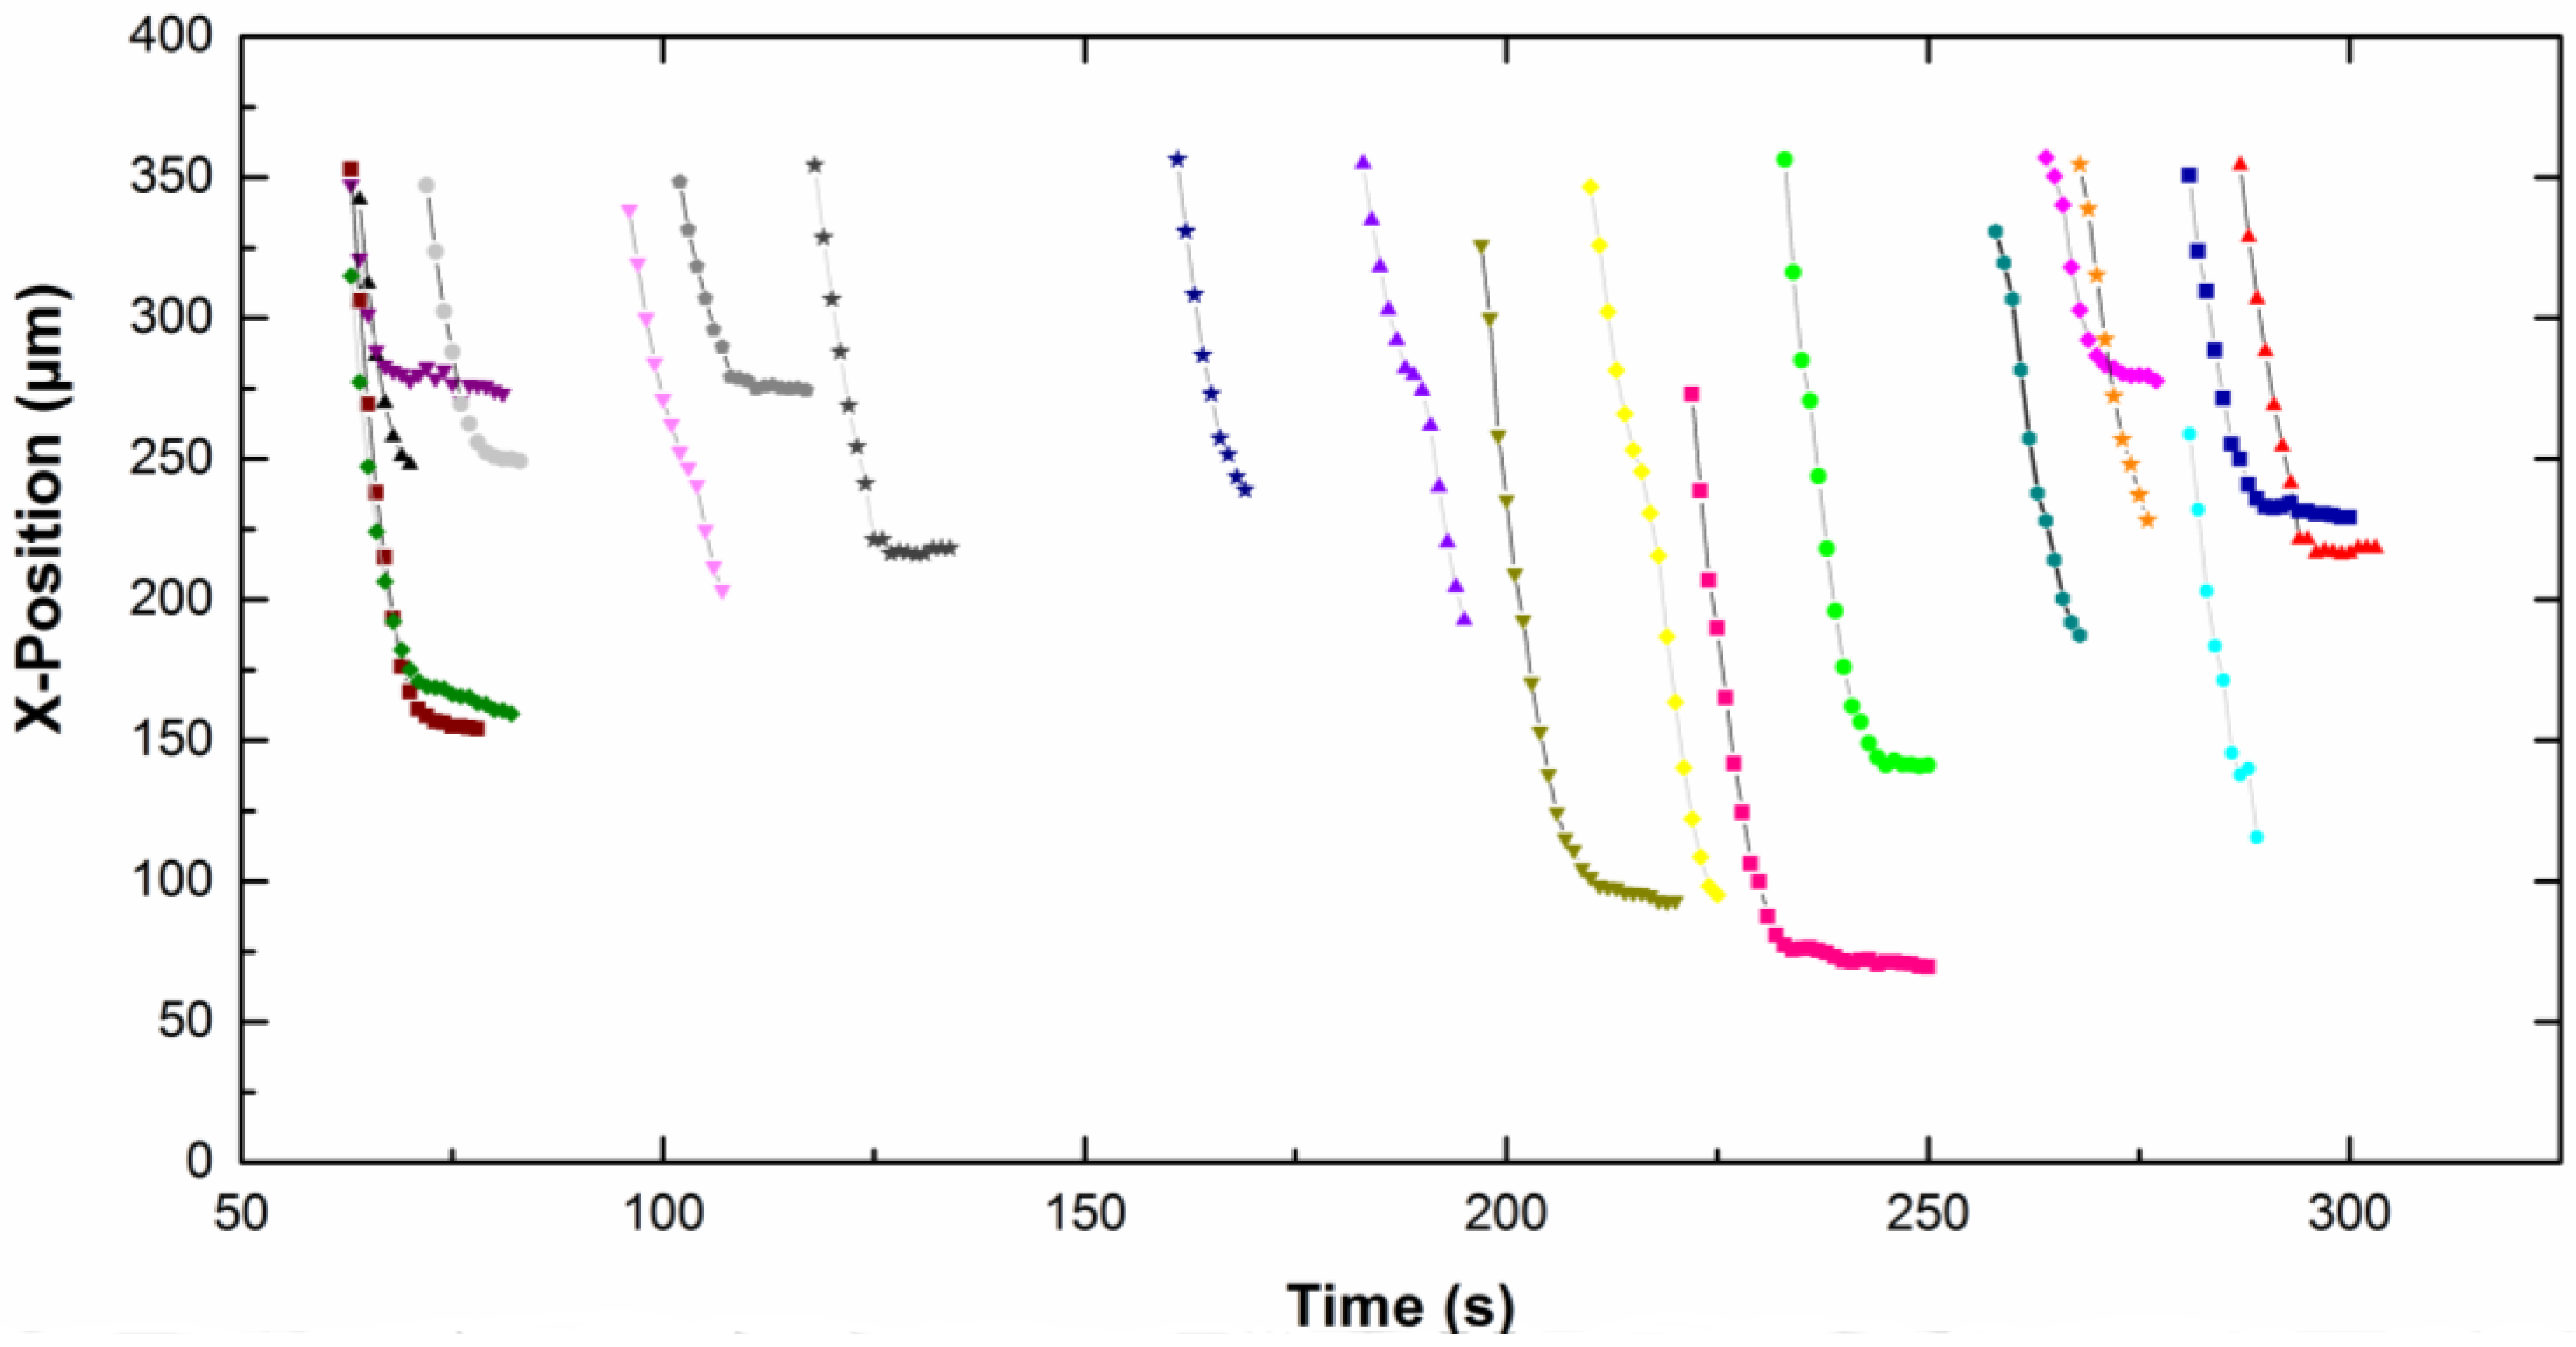
The x-position of each particle, in focus on the screen, is given as a function of time on Figure 5 for CTAB solution and Figure 6 for CTAC solution. Note that the origin of the x-axis was on the right part of the screen for particles moving from the left to the right, therefore the x-position decreases with time. The upper part of the curves corresponds to particles approaching the electrode. Then the particles slow down and move slowly along the electrode (lower part of the curves). A net change of the slope is observed for all particles, which means a fall of the particle velocity. Depending on the type of surfactant counterion, particles exhibit different behavior near the electrode. In CTAC solution, particles stopped very quickly. Indeed they moved along the electrode for a few seconds, however in the presence of CTAB particles moved for up to 100 s.
From the curves (Figure 5 and Figure 6), we calculated the x-component of the approach velocity VAx and of the tangential velocity VTx along the electrode (see Figure 7). Results are given in Table 1. The VAx approach velocity of particles migrating toward the electrode is about 20 μm s−1. The velocity decreases in a few seconds to about 1 μm s−1. We observed that both the approach velocity and the tangential velocity near the wall are a little bit lower for particles dispersed in CTAC solution compared to these ones in CTAB solution.
From the values of the tangential velocity VTx near the wall and using Equations (4) and (6), the distance between the particles and the electrode was found to be 18 nm and 0.5 nm for CTAB and CTAC, respectively. These calculations were done without considering external forces. Note that when the applied voltage was switched off, the particles in movement moved away from the cathode surface.
The VAy component of the approach velocity can not be measured, therefore we calculated its value from the following equation:
where μ is the electrophoretic mobility and E the electric field applied to the particle.
The electrophoretic mobility in CTAB and CTAC solutions was equal to 2.337 × 10⁻⁸ m2 V−1 s−1 and 3.824 × 10⁻⁸ m2 V−1 s−1, respectively. The electric field in the suspension can be calculated considering the conductivity Λ of the suspension, the current I and the electrode surface area Ae [34].
The current after 3 min of deposition was equal to 0.46 and 0.33 mA in CTAB and CTAC suspensions, respectively. The surface area of the cathode was equal to 1.14 cm2. In CTAB solution the value of the electric field was found to be 211 V m−1 and 286 V m−1 in CTAC solution. The calculated VAy values of electrophoretic velocities are given in Table 1. The electrophoretic mobility of particles and the electric field in CTAB solution are lower than for particles in CTAC solution, so the electrophoretic velocity is lower.
Finally, the distance at which the electrophoretic force is equal to the hydrodynamic force was determined from Equations (2) and (8). The hydrodynamic force is higher than the electrophoretic force for most of the channel width. It reverses when particles are a short distance from the electrode, that is, about 50 μm for CTAB-coated particles and 125 μm for CTAC-coated particles. Under these experimental conditions most of the particles flow through the channel however more particles move toward the electrode in the CTAC solution than in the CTAB solution.
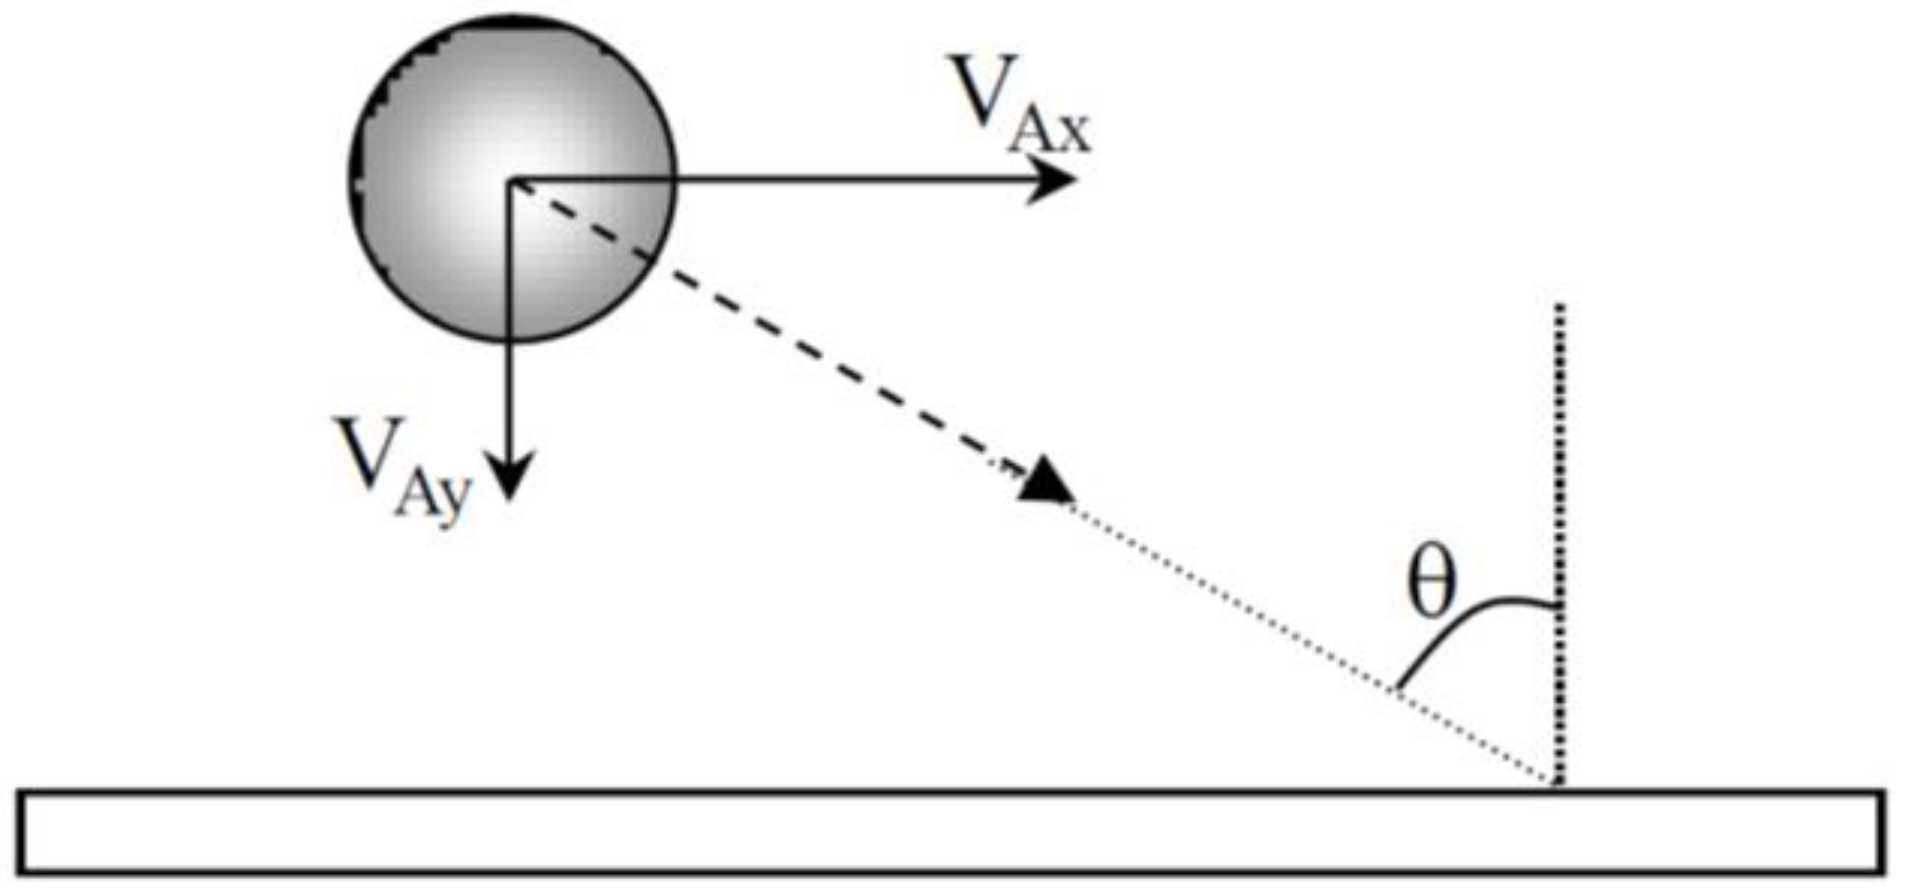
The approach angle of the particles may have an influence on the morphology of aggregates. When particles arrive near the cathode, the approach angle (Figure 8) was then calculated from the ratio VAx/VAy of the experimental values given in Table 1 and is about 80° for CTAB and 60° for CTAC.
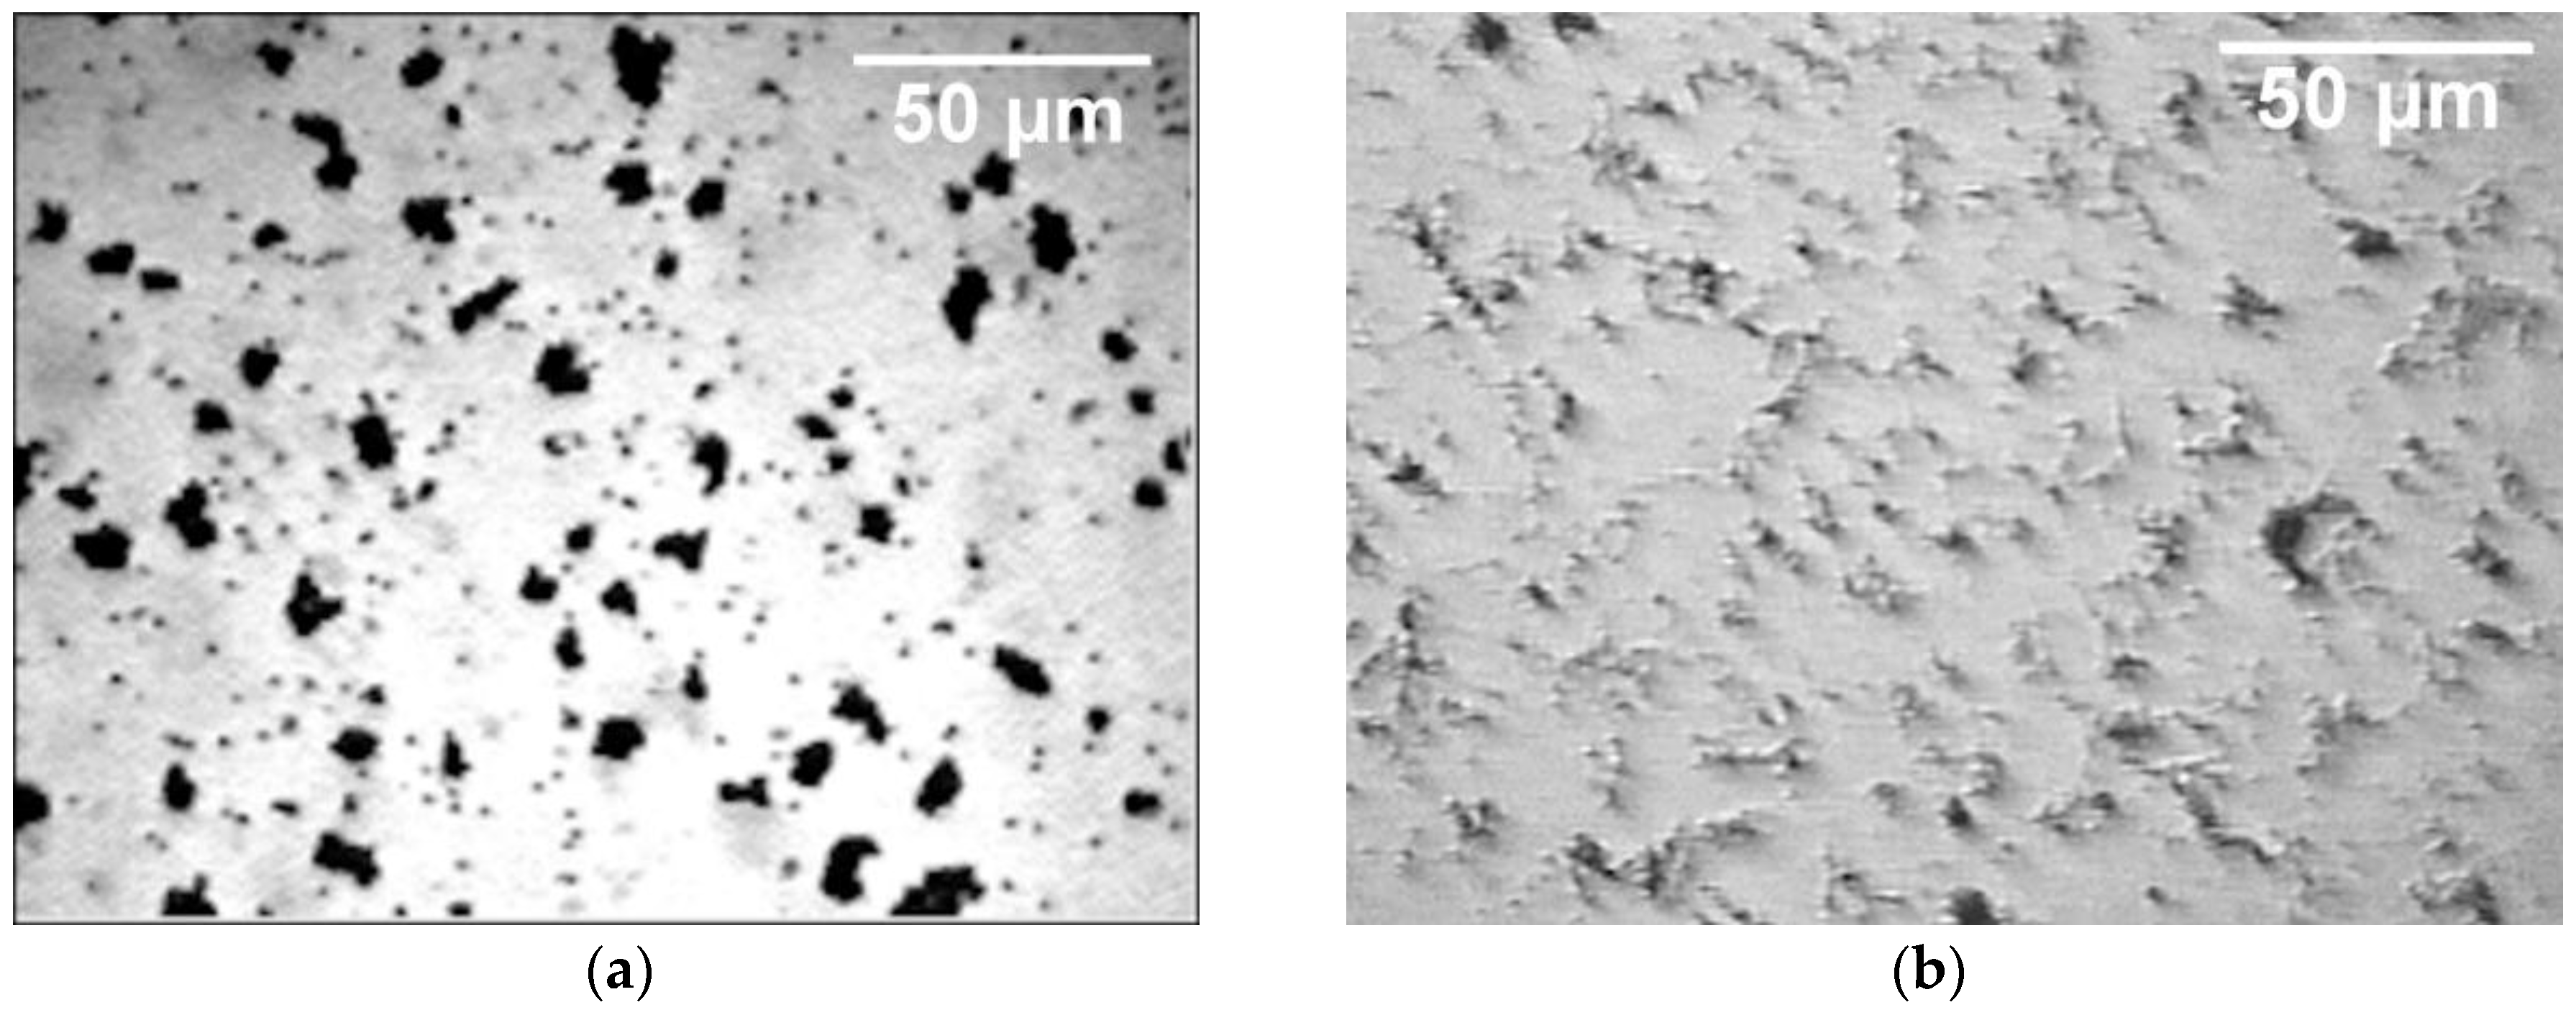
Figure 9 shows the morphology of the aggregates after 10 min of deposition. Images were taken from the video film. When electrophoretic deposition of PS particles was done in the CTAB solution, dense structures were observed (Figure 9a) while more open structures were visible in the CTAC solution (Figure 9b).
4. Discussion
Using the EPD laminar flow cell, the migration of particles to the cathode as well as their movement along the electrode were observed. The components of particle velocity of functionalized micronic PS particles were measured in cationic CTAB or CTAC surfactant solutions in a constant applied voltage. The surfactant concentration (5 × 10⁻⁴ M) was chosen close to the cmc. Surfactant molecules adsorb on surfaces and form aggregates above a surfactant concentration known as critical surface aggregation concentration (csac). The csac value is a little lower than the cmc above which micelles form in solution. For example, it is about 0.4× cmc for polymer substrates (polystyrene) [35]. Under these conditions CTA+ molecules present in the solution adsorb both onto the particles and the cathode forming two-layer aggregate structures (i.e., cylinders, surface micelles or bilayers) with positive head groups of the second layer pointing into the solution [36]. Indeed zeta potentials of polystyrene particles and of mica sheets become positive at this surfactant concentration [37]. An electrostatic repulsion arises between the positive particles and the surfactant bilayers adsorbed on the electrode. Moreover, functionalized particles and the electrode are hydrophilic. Both electrostatic and hydrophilic repulsions limit particle adhesion on the cathode. Moreover the surfactant adsorption depends on the type of counter-ions. On the one hand, the zeta potential of PS particles is more positive in CTAC solution (+54 mV) compared to the values in CTAB solution (+33 mV). Bromide ions have a larger radius than chloride ions and are less hydrated [38]. So, they bind more closely to the CTA+ head groups, leading to an efficient screening of the surfactant charge. On the other hand, counterions also influence the surfactant adsorption onto electrodes. The cathode is hydrophilic and becomes more or less positive at this surfactant concentration. Indeed, the open circuit potential of nickel electrodes was previously measured as a function of time in both the absence and presence of surfactant [37]. The shift of the open circuit potential toward more positive values as compared to the case of water without a surfactant was higher for CTAB-coated electrode than for CTAC-coated electrode [16]. This demonstrated the ability of the surfactant to form a protective layer on the nickel surface which seems more effective in the case of CTAB. An important increase of CTA+ affinity for the electrode with the expected trend Cl− < Br− was also shown by electrocapillarity measurements on a mercury electrode [39,40]. The authors attributed the difference of adsorption to the formation of ion pairs between the surfactant molecule and its counterion, which forms only at the electrode surface or in its immediate vicinity and not in solution.
From the value of the x-component of the tangential velocity near the wall the particle-electrode distance was calculated. We found a distance below 1 nm in the 5 × 10⁻⁴ M CTAC solution and of about 20 nm in the 5 × 10⁻⁴ M CTAB solution. These calculations were done taking only into account the hydrodynamic force acting on a particle moving freely along a smooth wall. Note that the origin of these distances is the distance from the shear wall (Figure 3). Taking into account the thickness of the adsorbed surfactant bilayer, it should be localized at about 2 nm from the metallic surface. Moreover, particles are maintained near the electrode by the electrophoretic force and the electrode has a certain roughness (below 45 nm [16]). Nevertheless, we can consider that these results indicate that the type of surfactant counter-ions influences the particle-electrode distance and that the particle-electrode distance is shorter in presence of CTAC than in presence of CTAB. In CTAC solution, the short particle-electrode distance and the rapid particle adhesion (in a few seconds) on the electrode indicate that particle-electrode interactions are attractive. Adsorption of CTAC molecules on the electrode is not sufficient to form a homogenous bilayer and to reverse the charge of the electrode, so attractive interactions should take place through van der Waals and electrostatic double layer interactions. The higher particle-electrode distance in CTAB solution and the longer time (about 100 s) for the particle to move along the electrode suggest repulsive interactions between the particles and the electrode. The interaction energy was then calculated using Equations (9) and (10) with a positive value for the zeta potential of the electrode. An electrode zeta potential of +5 mV was sufficient to obtain an energy barrier of about 3 kT at a distance of 15 nm and a secondary minimum at a distance of about 40–50 nm. So for a particle dragged along the electrode by the laminar flow and with a DC electric field, the electrode-particle distance ranges from a few nanometers to a few dozen nanometers depending on the type of surfactant.
Surfactant counter-ions also influence the distance at which the electrophoretic force predominates the hydrodynamic force and the approach angle of the particles near the cathode. The angle between the trajectory of the particle and the normal to the surface (Figure 8) is lower in CTAC solution (≈60°) than in CTAB solution (≈80°). The approach angle, the time it takes for a particle to move along the electrode and the particle-electrode distance have an effect on the particle deposition and the growth of aggregates. In the presence of CTAB, particles have time during their tangential motion along the electrode to attach to each other to form aggregates. Other particles coming from the bulk suspension migrate to the immobilized aggregates due to the local electro-osmotic and electro-hydrodynamic flow. Moreover, the repulsive electrostatic interactions between particles are lower and so the particle-particle distance is also lower. Finally, dense aggregates were observed. In the presence of CTAC, the time it takes for a particle to move along the electrode is very short, particle aggregation due to the local flow around a deposited particle is limited and small aggregates are formed. But the distance from the electrode (y-distance) at which the electrophoretic force predominates the hydrodynamic force is higher than for CTAB-coated particles, so more CTAC-coated particles migrate to the surface. Therefore smaller and more numerous aggregates were observed [37]. Then they coalesce with each other leading to open structures.
5. Conclusions
A home-made EPD set-up was used to measure the velocity of micronic particles near and along an electrode in a laminar stationary flow and with a constant DC electric field. Anionic PS particles were turned positive by adsorption of CTAB or CTAC surfactant. We showed the influence of surfactant counter-ions on the zeta potential of particles but also on the particle velocity near and along the electrode, on the approach angle and on the particle-electrode distance. Indeed, bromide ions being less hydrated than chloride ions, the screening of the positive CTA+ charge is less effective which influences the adsorption of surfactant molecules on both the particles and the electrode. Both the particle-electrode and particle-particle interactions near the electrode are then modified. By choosing the appropriate surfactant, open or dense structures of coatings can be obtained. Particles coated with a polyelectrolyte monolayer [41,42] or multilayer [9] have recently been used in electrophoretic deposition. The velocity of particles functionalized with polyelectrolytes (monolayer or multilayers) in a laminar flow and with an electric field are under investigation.
Acknowledgments
We thank Maria Zembala from the Institute of Catalysis and Surface Chemistry, Polish Academy of Sciences, Cracow, Poland, for the synthesis of polystyrene particles and Jean-Claude Filiâtre for his help in the image analysis. We thank the “Conseil regional of Franche-Comté” for financial support (Ph.D. grant).
Author Contributions
Claudine Filiâtre conceived and designed the apparatus; Céline Pignolet performed the experiments; Claudine Filiâtre, Céline Pignolet and Cédric C. Buron analyzed the data; Claudine Filiâtre and Cédric C. Buron wrote the paper.
Conflicts of Interest
The authors declare no conflict of interest.
References
- Kanamura, K.; Hamagami, J.-I. Innovation of novel functional material processing technique by using electrophoretic deposition process. Solid State Ion. 2004, 172, 303–308. [Google Scholar] [CrossRef]
- Dickerson, J.H.; Boccaccini, A.R. Electrophoretic Deposition of Nanomaterials; Springer: New York, NY, USA, 2012. [Google Scholar]
- Boccaccini, A.R.; Dickerson, J.H.; Ferrari, B.; van der Biest, O.; Uchikoshi, T. Electrophoretic Deposition: Fundamentals and Applications V; Trans Tech Publications Ltd.: Stafa-Zurich, Switzerland, 2015; Volume 654. [Google Scholar]
- Ammam, M. Electrophoretic deposition under modulated electric fields: A review. RSC Adv. 2012, 2, 7633–7646. [Google Scholar] [CrossRef]
- Besra, L.; Liu, M. A review on fundamentals and applications of electrophoretic deposition (EPD). Prog. Mater. Sci. 2007, 52, 1–61. [Google Scholar] [CrossRef]
- Corni, I.; Ryan, M.P.; Boccaccini, A.R. Electrophoretic deposition: From traditional ceramics to nanotechnology. J. Eur. Ceram. Soc. 2008, 28, 1353–1367. [Google Scholar] [CrossRef]
- Ferrari, B.; Moreno, R. EPD kinetics: A review. J. Eur. Ceram. Soc. 2010, 30, 1069–1078. [Google Scholar] [CrossRef]
- Sarkar, P.; Nicholson, P.S. Electrophoretic deposition (EPD): Mechanisms, kinetics, and application to ceramics. J. Am. Ceram. Soc. 1996, 79, 1987–2002. [Google Scholar] [CrossRef]
- Dange-Delbaere, C.; Buron, C.C.; Euvrard, M.; Filiâtre, C. Stability and cathodic electrophoretic deposition of polystyrene particles pre-coated with chitosan–alginate multilayer. Colloids Surf. A 2016, 493, 1–8. [Google Scholar] [CrossRef]
- Mishra, M.; Bhattacharjee, S.; Besra, L.; Sharma, H.S.; Uchikoshi, T.; Sakka, Y. Effect of ph localization on microstructure evolution of deposits during aqueous electrophoretic deposition (EPD). J. Eur. Ceram. Soc. 2010, 30, 2467–2473. [Google Scholar] [CrossRef]
- Ristenpart, W.D.; Aksay, I.A.; Saville, D.A. Electrohydrodynamic flow around a colloidal particle near an electrode with an oscillating potential. J. Fluid Mech. 2007, 575, 83–109. [Google Scholar] [CrossRef]
- Sides, P.J. Electrohydrodynamic particle aggregation on an electrode driven by an alternating electric field normal to it. Langmuir 2001, 17, 5791–5800. [Google Scholar] [CrossRef]
- Solomentsev, Y.; Böhmer, M.; Anderson, J.L. Particle clustering and pattern formation during electrophoretic deposition: A hydrodynamic model. Langmuir 1997, 13, 6058–6068. [Google Scholar] [CrossRef]
- Trau, M.; Saville, D.A.; Aksay, I.A. Field-induced layering of colloidal crystals. Science 1996, 272, 706–709. [Google Scholar] [CrossRef] [PubMed]
- Yeh, S.-R.; Seul, M.; Shraiman, B.I. Assembly of ordered colloidal aggregrates by electric-field-induced fluid flow. Nature 1997, 386, 57–59. [Google Scholar] [CrossRef]
- Pignolet, C.; Filiâtre, C.; Foissy, A. Influence of surfactant counterions during electrophoretic particle deposition. Langmuir 2008, 24, 10181–10186. [Google Scholar] [CrossRef] [PubMed]
- Giera, B.; Zepeda-Ruiz, L.A.; Pascall, A.J.; Weisgraber, T.H. Mesoscale particle-based model of electrophoretic deposition. Langmuir 2017, 33, 652–661. [Google Scholar] [CrossRef] [PubMed]
- Guelcher, S.A. Investigating the Mechanism of Aggregation of Colloidal Particles during Electrophoretic Deposition; Carnegie Mellon University: Pittsburgh, PA, USA, 1999. [Google Scholar]
- Guelcher, S.A.; Solomentsev, Y.; Anderson, J.L. Aggregation of pairs of particles on electrodes during electrophoretic deposition. Powder Technol. 2000, 110, 90–97. [Google Scholar] [CrossRef]
- Kalasin, S.; Santore, M.M. Engineering nanoscale surface features to sustain microparticle rolling in flow. ACS Nano 2015, 9, 4706–4716. [Google Scholar] [CrossRef] [PubMed]
- Liang, Q.; Zhao, C.; Yang, C. Enhancement of electrophoretic mobility of microparticles near a solid wall—Experimental verification. Electrophoresis 2015, 36, 731–736. [Google Scholar] [CrossRef] [PubMed]
- McDermott, D.C.; McCarney, J.; Thomas, R.K.; Rennie, A.R. Study of an adsorbed layer of hexadecyltrimethylammonium bromide using the technique of neutron reflection. J. Colloid Interface Sci. 1994, 162, 304–310. [Google Scholar] [CrossRef]
- Mata, J.; Varade, D.; Bahadur, P. Aggregation behavior of quaternary salt based cationic surfactants. Thermochim. Acta 2005, 428, 147–155. [Google Scholar] [CrossRef]
- Warszyński, P. Coupling of hydrodynamic and electric interactions in adsorption of colloidal particles. Adv. Colloid Interface Sci. 2000, 84, 47–142. [Google Scholar] [CrossRef]
- Filiatre, C.; Towarnicki, L.; Mange, F.; Foissy, A. A parallel plate flow cell for the investigation of the role of surfactants in the codeposition of polymer particles in nickel electroplating. J. Appl. Electrochem. 1999, 29, 1393–1400. [Google Scholar] [CrossRef]
- Filiâtre, C.; Pignolet, C.; Foissy, A.; Zembala, M.; Warszyński, P. Electrodeposition of particles at nickel electrode surface in a laminar flow cell. Colloids Surf. A 2003, 222, 55–63. [Google Scholar] [CrossRef]
- Adamczyk, Z. Particles at Interfaces: Interactions, Deposition, Structure; Academic Press: Amsterdam, The Netherlands, 2006; Volume 9. [Google Scholar]
- Goldman, A.J.; Cox, R.G.; Brenner, H. Slow viscous motion of a sphere parallel to a plane wall—II couette flow. Chem. Eng. Sci. 1967, 22, 653–660. [Google Scholar] [CrossRef]
- Cherukat, P.; McLaughlin, J.B. The inertial lift on a rigid sphere in a linear shear flow field near a flat wall. J. Fluid Mech. 1994, 263, 1–18. [Google Scholar] [CrossRef]
- Fransaer, J. Study of the Behaviour of Particles in the Vicinity of Electrodes; Catholic University of Leuven: Louvain-la-Neuve, Belgium, 1994. [Google Scholar]
- Jia, X.; Williams, R.A. Particle deposition at a charged solid/liquid interface. Chem. Eng. Commun. 1990, 91, 127–198. [Google Scholar] [CrossRef]
- Czarnecki, J. Van der waals attraction energy between sphere and half-space. J. Colloid Interface Sci. 1979, 72, 361–362. [Google Scholar] [CrossRef]
- Ruckenstein, E.; Prieve, D.C. Adsorption and desorption of particles and their chromatographic separation. AlChE J. 1976, 22, 276–283. [Google Scholar] [CrossRef]
- Anné, G.; Vanmeensel, K.; Vleugels, J.; Van der Biest, O. Influence of the suspension composition on the electric field and deposition rate during electrophoretic deposition. Colloids Surf. A 2004, 245, 35–39. [Google Scholar] [CrossRef]
- Howse, J.R.; Steitz, R.; Pannek, M.; Simon, P.; Schubert, D.W.; Findenegg, G.H. Adsorbed surfactant layers at polymer/liquid interfaces. A neutron reflectivity study. Phys. Chem. Chem. Phys. 2001, 3, 4044–4051. [Google Scholar] [CrossRef]
- Tiberg, F.; Brinck, J.; Grant, L. Adsorption and surface-induced self-assembly of surfactants at the solid–aqueous interface. Curr. Opin. Colloid Interface Sci. 1999, 4, 411–419. [Google Scholar] [CrossRef]
- Pignolet, C.; Euvrard, M.; Foissy, A.; Filiâtre, C. Electrodeposition of latex particles in the presence of surfactant: Investigation of deposit morphology. J. Colloid Interface Sci. 2010, 349, 41–48. [Google Scholar] [CrossRef] [PubMed]
- Burgess, J. Ions in Solution, 2nd ed.; Woodhead Publishing: Chichester, UK, 1999. [Google Scholar]
- Hamdi, M.; Bennes, R.; Schuhmann, D.; Vanel, P. A study of superficial associations at a mercury electrode in the case of tetrabutylammonium halide solutions. J. Electroanal. Chem. 1980, 108, 255–270. [Google Scholar] [CrossRef]
- Naficy, G.; Vanel, P.; Schuhmann, D.; Bennes, R.; Tronel-Peyroz, E. Adsorption on electrodes and micellization of some alkyl sulfates. J. Phys. Chem. 1981, 85, 1037–1042. [Google Scholar] [CrossRef]
- Cordero-Arias, L.; Cabanas-Polo, S.; Goudouri, O.M.; Misra, S.K.; Gilabert, J.; Valsami-Jones, E.; Sanchez, E.; Virtanen, S.; Boccaccini, A.R. Electrophoretic deposition of ZnO/alginate and ZnO-bioactive glass/alginate composite coatings for antimicrobial applications. Mater. Sci. Eng. C. 2015, 55, 137–144. [Google Scholar] [CrossRef] [PubMed]
- Gonzalez, Z.; Ferrari, B.; Sanchez-Herencia, A.J.; Caballero, A.; Morales, J. Use of polyelectrolytes for the fabrication of porous nio films by electrophoretic deposition for supercapacitor electrodes. Electrochim. Acta 2016, 211, 110–118. [Google Scholar] [CrossRef]
Figure 1.
Electrophoretic deposition (EPD) laminar flow cell with the optical and image analysis set-up.
Figure 1.
Electrophoretic deposition (EPD) laminar flow cell with the optical and image analysis set-up.

Figure 2.
(a) Front view of the cathode, dark points are particles near the electrode; (b) External forces acting on a particle in the EPD laminar flow cell.
Figure 2.
(a) Front view of the cathode, dark points are particles near the electrode; (b) External forces acting on a particle in the EPD laminar flow cell.

Figure 3.
Particles are subjected to torque and to a translational movement near the wall (top view).
Figure 3.
Particles are subjected to torque and to a translational movement near the wall (top view).

Figure 4.
Particle position along the z-axis as a function of time (cetyltrimethyl ammonium bromide (CTAB) solution).
Figure 4.
Particle position along the z-axis as a function of time (cetyltrimethyl ammonium bromide (CTAB) solution).
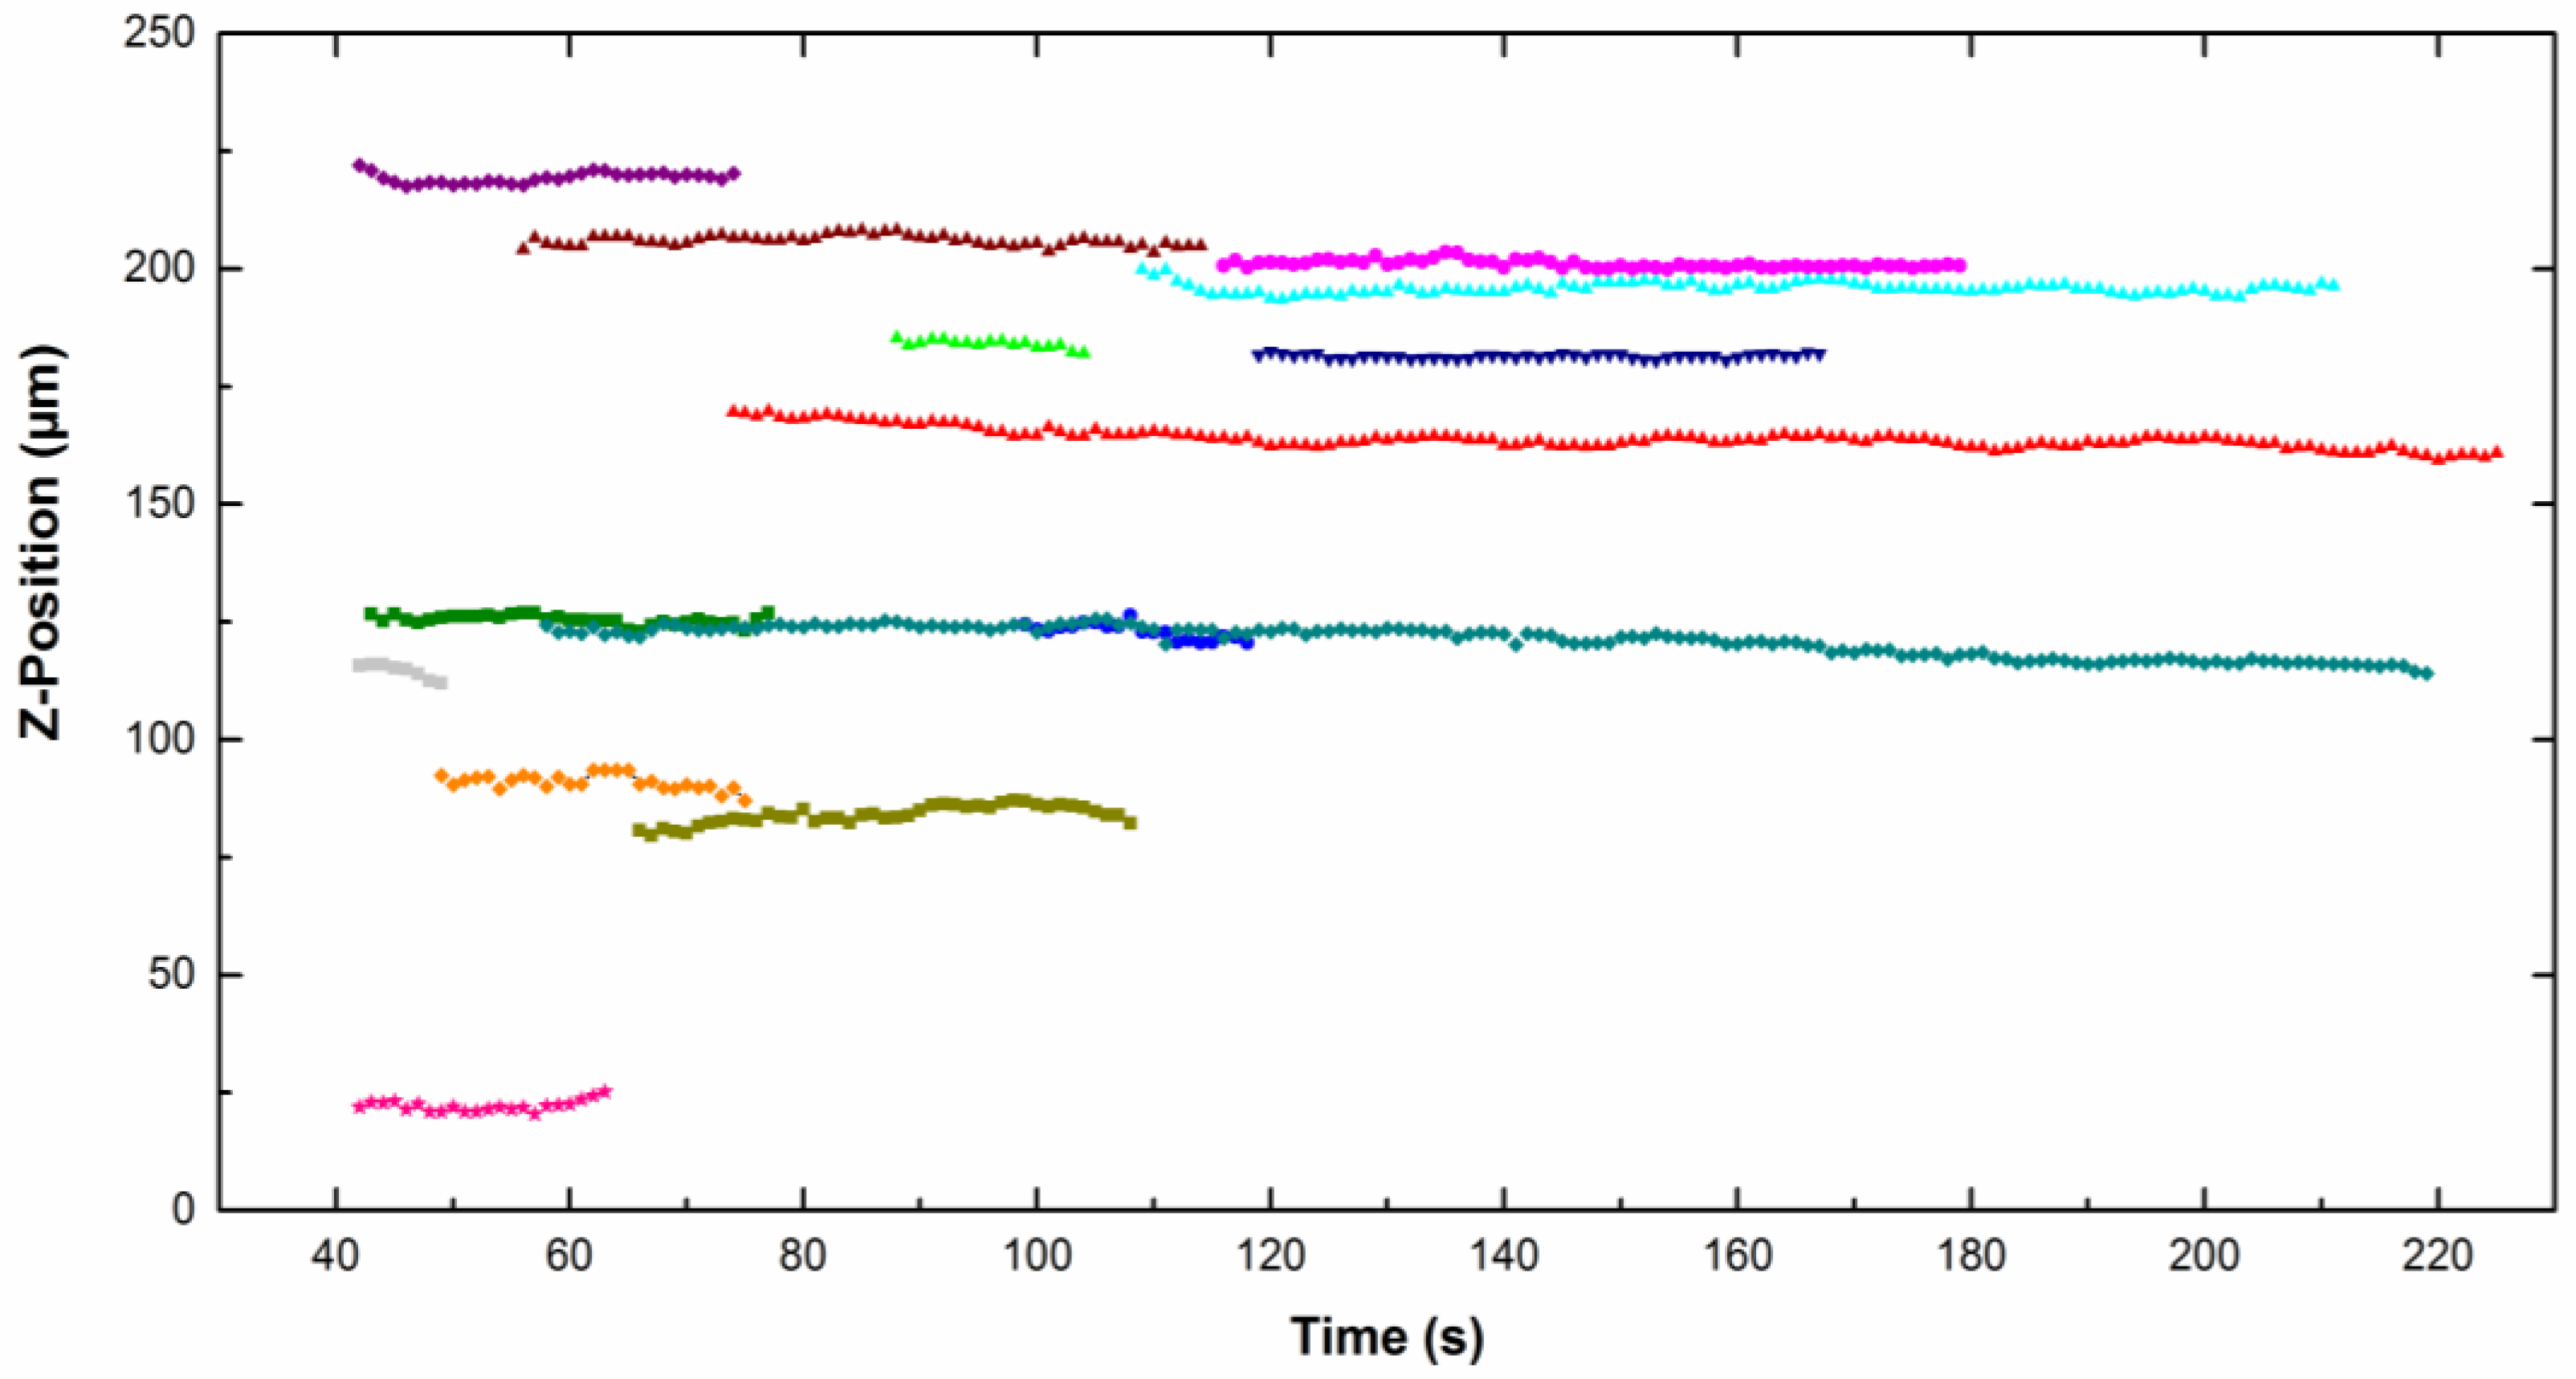
Figure 5.
Particle position along the x-axis as a function of time. Particles were dispersed in 5 × 10⁻⁴ M CTAB solution. Each point corresponds to a measurement at a y-distance from the electrode.
Figure 5.
Particle position along the x-axis as a function of time. Particles were dispersed in 5 × 10⁻⁴ M CTAB solution. Each point corresponds to a measurement at a y-distance from the electrode.

Figure 6.
Particle position along the x-axis as a function of time. Particles were dispersed in 5 × 10⁻⁴ M CTAC solution. Each point corresponds to a measurement at a y-distance from the electrode.
Figure 6.
Particle position along the x-axis as a function of time. Particles were dispersed in 5 × 10⁻⁴ M CTAC solution. Each point corresponds to a measurement at a y-distance from the electrode.

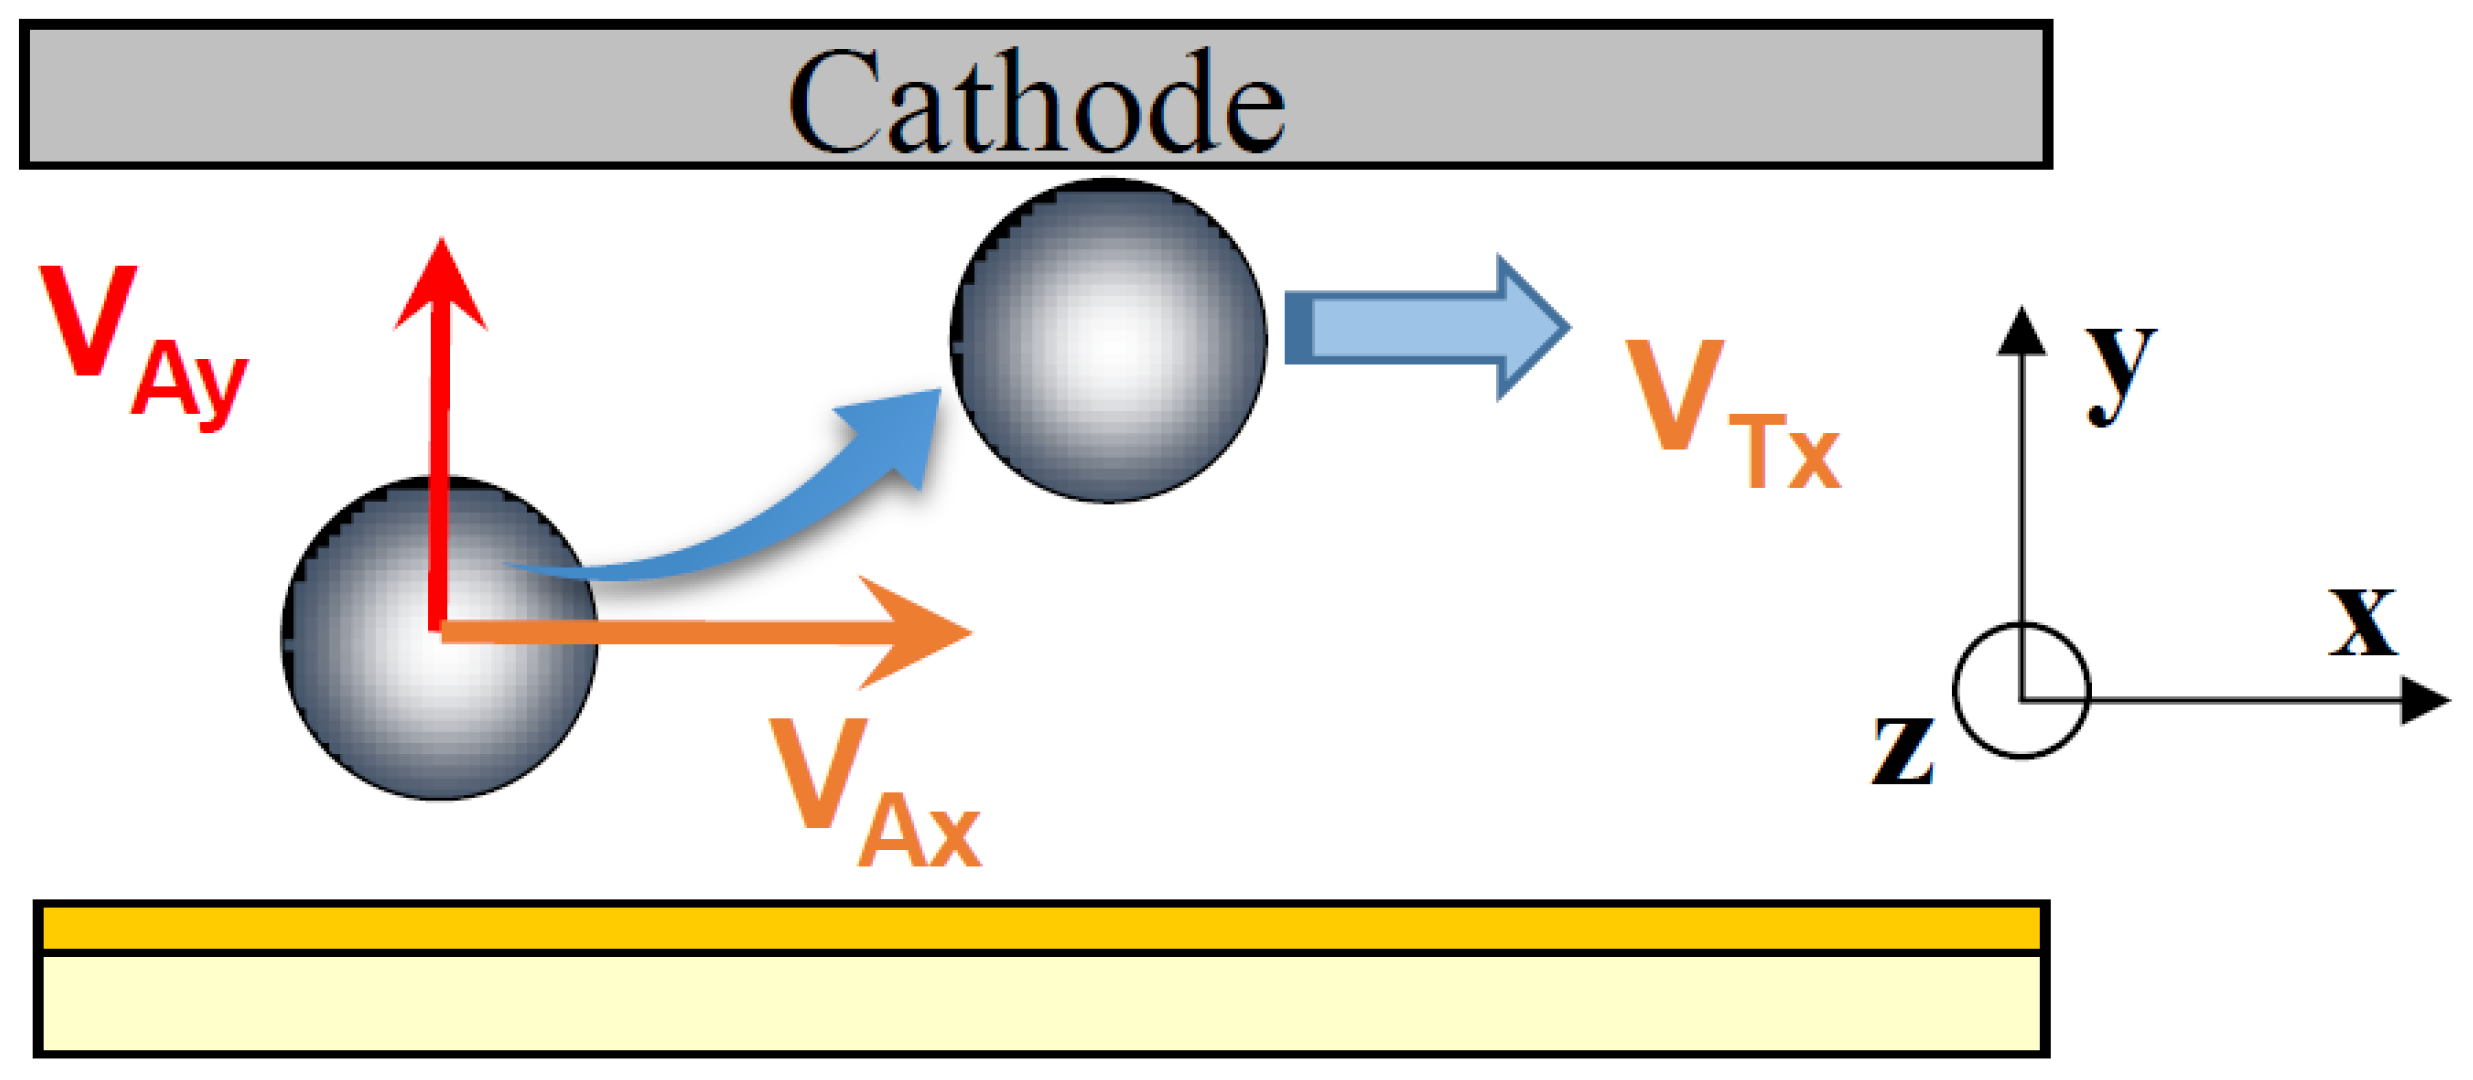
Figure 7.
Velocity components of a particle near an electrode in a laminar flow cell.

Figure 8.
Approach angle of a particle near the electrode.

Figure 9.
Images of the PS particle aggregates on the nickel substrate after 10 min of deposition in (a) CTAB and (b) CTAC solution.
Figure 9.
Images of the PS particle aggregates on the nickel substrate after 10 min of deposition in (a) CTAB and (b) CTAC solution.


Table 1.
Components of particle velocities near the electrode in CTAB or CTAC solution.
| Type of Surfactant | Approach Velocity VAx (μm s−1) | Tangential Velocity VTx (μm s−1) | Electrophoretic Velocity VAy (μm s−1) |
|---|---|---|---|
| CTAB solution | 24.0 ± 4.1 | 1.2 ± 0.1 | 4.9 |
| CTAC solution | 18.1 ± 4.1 | 0.7 ± 0.3 | 10.9 |
© 2017 by the authors. Licensee MDPI, Basel, Switzerland. This article is an open access article distributed under the terms and conditions of the Creative Commons Attribution (CC BY) license (http://creativecommons.org/licenses/by/4.0/).
Share and Cite
MDPI and ACS Style
Filiâtre, C.; Pignolet, C.; Buron, C.C. Particle Velocities near and along the Electrode during Electrophoretic Deposition: Influence of Surfactant Counter-Ions. Coatings 2017, 7, 147. https://doi.org/10.3390/coatings7090147
AMA Style
Filiâtre C, Pignolet C, Buron CC. Particle Velocities near and along the Electrode during Electrophoretic Deposition: Influence of Surfactant Counter-Ions. Coatings. 2017; 7(9):147. https://doi.org/10.3390/coatings7090147
Chicago/Turabian StyleFiliâtre, Claudine, Céline Pignolet, and Cédric C. Buron. 2017. "Particle Velocities near and along the Electrode during Electrophoretic Deposition: Influence of Surfactant Counter-Ions" Coatings 7, no. 9: 147. https://doi.org/10.3390/coatings7090147
Note that from the first issue of 2016, this journal uses article numbers instead of page numbers. See further details here.