Article

Valorization of Potential Post-Consumer Polyethylene (PE) Plastics Waste and Ethiopian Indigenous Highland Bamboo (EHB) for Wood Plastic Composite (WPC): Experimental Evaluation and Characterization

1
Process Engineering Stream, School of Chemical and Bio Engineering, Addis Ababa Institute of Technology, Addis Ababa University, King George VI St., Addis Ababa 1000, Ethiopia
2
Wood Composite and Processing Technology, Thünen Institute of Wood Science, Hamburg University, Leuschnerstraße 91c, 21031 Hamburg, Germany
*
Author to whom correspondence should be addressed.
Fibers 2022, 10(10), 85; https://doi.org/10.3390/fib10100085
Submission received: 11 August 2022 / Revised: 22 September 2022 / Accepted: 26 September 2022 / Published: 8 October 2022
(This article belongs to the Special Issue Recent Trends in Natural Fibers and Composites)

Abstract

:
The best approaches to minimizing resource scarcity, removing valuable waste streams, and re-establishing a circular economic chain of recycled thermoplastics are to cascade them into product life cycles and their valorization combined with sustainable raw materials. As one part of this goal, WPC was formulated from three recycled PE plastic wastes: linear low-density polyethylene (LLDPE), medium-density polyethylene (MDPE), high-density polyethylene (HDPE), and underutilized EHB. The chemical composition of EHD, chemical structure, crystallinity, melting and crystallization points, residual metal additives, and polycyclic aromatic hydrocarbons (PAHs) of recycled PE were investigated using standard chromatographic and spectroscopic methods such as HPAEC-UV/VIS, FTIR, DSC, GC/MSD, and XPS. The properties of WPC formulations from different compositions of bamboo particles (BP) as dispersed phase, individual recycled PE plastics, and equal melt blend (EM) as polymer matrix were investigated extensively and measured with a known standard. These comprised tensile strength (TS), modulus of elasticity (TM), flexural strength (FS), modulus of rupture (FM), and unnotched impact strength (UIS). It also included the effect of various alkaline surface treatment ranges on the interface surface interaction. The results show improved mechanical properties for all blending ratios of surface-treated BP, which resulted from better encapsulation in the polymer matrix. Despite its inherent immiscibility, WPC formulation from equal melt blending revealed unusual properties compared to separate phase blends, which is attributed to thermally induced cross-linking. This implies that melt blending of the weakest and cheapest recycled LLDPE with relatively cheap recycled MDPE and HDPE improves the properties of the blend, particularly toughness, while simultaneously retaining some of their properties.

1. Introduction

It was a long time ago that thermoplastic polyolefins were the best raw materials for industrial production due to properties such as corrosion resistance, low density, fairly high strength, user-friendly design, and low cost of production [1,2]. In today’s world, they have become a major commodity on a global scale and have infiltrated almost every aspect of human life [3]. However, these valuable fossil fuel-based materials have increased 200-fold since 1950 and their big volumes are discarded as waste [4,5]. Nowadays, plastic production reaches around 8 billion tons, of which 55% is discarded or land filled, 25% is incinerated, and only 20% is recycled. Therefore, plastic waste dominates a large fraction of solid waste with 50%–70% of packaging plastics like LLDPE, LDPE, MDPE, and HDPE as primary constituents [6]. This indicates that rapid plastic pollution in the environment is coming from PE plastics and their impact on ecosystems demands attention [7]. This necessitates the adoption of integrated waste management (IWM) practices like source reduction, reuse, recycling, landfill, and waste-to-energy. The recycling method is usually focused from IWM [8] since thermo-mechanical recycling almost retains both physical and mechanical properties of recycled thermoplastics [9]. Other practices, such as incineration, produce toxic and flue gases as well as heavy metal residue ash, and are known for their low efficiency; landfills result in leakages into the natural environment [7], and chemical recycling, such as glycolysis, pyrolysis, ammonolysis, hydrogenation, hydrolysis, gasification, methanolysis, and cracking, requires significant investment [8]. As a result, incorporating recycled plastics back into the product life cycle enables a reduction in the use of virgin raw material-based fossil fuels. Besides, cascading use of recycled thermoplastic with bio-based resources for WPC formulation prior to energy recovery is one way to ensure sustainable resource supply and a circular economy [9,10,11]. A WPC is a composite material made up of a thermopolymer matrix whose dispersed phase comes from lignocellulosic biomass. Such bio-based materials have the advantages of renewability, low cost, low energy consumption, being environmentally friendly, and less wear on machinery compared to inorganic fillers [12]. Technically, significant advantages include greater durability, lower humidity absorption than other wood composites, less maintenance, and greater resistance to fungi activity when exposed to a humid environment [13,14]. As a result, WPC from waste fraction and such a dispersed phase has a low carbon footprint [15] and high carbon dioxide sequestration [10,16]. It is also used as an intermediate cascade chain of underutilized lignocellulosic biomass [17]. Besides, the same thermoplastic processing methods (extrusion, injection, and compression molding) are used for WPC production [18]. WPC can solve problems of housing materials related to uninterrupted population growth and urbanization that intensify pressure on the earth’s non-renewable resources due to the fossil resource dependency of existing construction materials and their energy intensiveness. For example, the production of one ton of cement requires a large input of energy and emits around one ton of CO2 [19]. Secondly, industrial CO2 emissions of iron and steel account for 4% and 7%, respectively [20]. Third, developing countries import these materials with trade deficits. Although it is impossible to fully replace such construction materials, WPC with good mechanical properties could substitute in wide areas. These could be internal applications like modular kitchens, back paneling, kitchen cabinets, bathroom doors, decorative wall tiles, curved components, office and household furniture, and partitioning systems. Externally, it is also largely used for decking applications like flooring, wall cladding, railing, architectural fencing, and corridor floor tiles, etc. [18].
Bamboo belongs to the grass family of Graminae, which has diversified into over 1500 species and covers over 31.5 million hectares of land across 21 countries [5]. It is the fastest growing (3–5 years) among the woody species. Ethiopia is endowed with an untapped potential bamboo resource of 67% share in Africa and 7% world share [21]. Two main indigenous species, Yushania alpina (highland bamboo) and Oxytenanthera abyssinica (lowland bamboo), alone cover one million hectares. The bamboo trade generates a USD 5–7 billion annual trade, which is comparable to the USD 8 billion return from the tropical timber trade [22]. However, its contribution to Ethiopia’s GDP is negligible (USD 4 million) even though over USD 1.2 billion can be earned [23]. The authors believe that one aspect of adding more value to the market chain of Ethiopian bamboo resources is using it along with potential recycled PE wastes like recycled LLDPE, MDPE, and HDPE to develop low-cost WPC material. This simultaneously reduces the valuable thermoplastic waste stream and valorizes it as an alternative and affordable building material in rural areas of Ethiopia.
Lignocellulose biomass consists of large molecules like cellulose, lignin, hemicellulose, pectin, and extractives rich in polar hydroxyl and carbonyl groups. The inherent hydrophilicity of these complex molecules and hydrophobicity of thermopolymers result in weak interphase bonds, which have a significant impact on both the properties and performance of WPC. Previously, efforts like surface treatment by chemical, physical, physiochemical, and nanotechnological methods [24] have been applied to improve this drawback and promising results were found. Some of them are alkaline treatment [25], coupling agent (MA-g-PP) [26,27,28], silanization [29,30], and grafting polymerization [31,32]. Recently, different studies have investigated the use of fully recycled plastics with different BP and/or fibers for WPC design. PE types like LLDPE [33] and HDPE [34,35] were focused including PP [36,37,38,39], ABS [17], PVC [5,40], and PLA [41,42,43]. These studies focused on the effects of particle size, reinforcing nano particles, composition, compounding procedures, surface treatment, different coupling agents on mechanical properties and performance, thermal stability, water absorption, and durability. However, there is no previous work focused on the mechanical properties of WPC formulation and the blended performance of indigenous EHB and recycled LLDPE, MDPE, and HDPE which includes their melt blend without coupling agent and any additives.
Therefore, the aim of this study is based on the use of recycled PE plastics as the core matrix and BP from EHB as the dispersed phase for WPC formulation. We used fibrous BP since a current study shows polymer composites from extracted bamboo fibers and nano reinforcement are energy-consuming, leaving almost no carbon footprint behind [44]. It also includes surface modification of BP with different strengths of alkaline solution; characterization of the EHB, investigation of thermal properties and characteristic structural differences of LLDPE, MDPE, and HDPE using DSC and FTIR; determination of residual metals and PHAs. We focused on these investigations since they were not covered extensively in the previous study, with priority preferences on the performance of WPC, particularly its mechanical properties.

2. Materials and Methods

2.1. The General Framework of the Experiment

The general experimental framework used was illustrated as shown in the following Figure 1. It consists of raw material preparation phase and WPC formulation design.

2.2. Raw Material Preparation and Characterization

2.2.1. Post-Consumer Thermoplastic Preparation

Post-consumer PE plastic wastes (LLDPE, MDPE, HDPE) collected from Addis Ababa city were washed, dried, fed by conveyor belt, melted, and pelletized by POLY STAR two stage extruder of model type Repro-Print at NANODAS recycling unit factory (Addis Ababa, Ethiopia). The densities of the recycled LLDPE, MDPE, and HDPE were 0.9195 g/cm3, 0.931 g/cm3, and 0.96 g/cm3, respectively. Based on these densities, their respective virgin plastics were offered by EXCEL PLASTICS PLC (Addis Ababa, Ethiopia) and used for the comparison.

2.2.2. Bamboo Collection and Preparation and Bamboo Surface Treatment

Matured EHB culms of five years of age were collected from the Hula district (Sidama, Ethiopia). Equal internode sections of each culm were divided into three sections after removing the topmost part. Next, the rest was cut into small strips, air dried, and reduced in size in a Cross Beater Mill (Retsch). Then, BP was sieved via sieve fractionation of target size 200–600 µm to eliminate particles in the powder form and large size. Then, BP was subsequently immersed in NAOH solution of 2%, 3%, 5%, and 10% (m/v) and agitated for 3 h at room temperature. The concentrations were refined based on the previous work that lacked consistency [12]. Next, BP was separated, washed using fresh tap water until it reached a neutral PH solution. Finally, it was dried in a vacuum oven at 80 °C until the moisture content fell below 2%, and used as is for the subsequent WPC formulation without new surface creation (Figure 2).

2.2.3. Free Sugar Content, Cellulose, Hemicellulose, and Lignin Analysis of EHB

The chemical characterization of the EHB was investigated according to the method developed by Dominic Lorenz et al. 2016 [45] with two-stage acid hydrolysis (AH) and high-performance anion exchange chromatography coupled-ultraviolet-visible spectrophotometry (HPAEC-UV/VIS) analysis. The milled and dried biomass was hydrolyzed by taking 100 mg of each sample with 1 mL of 72% H2SO4 (Honeywell, Seelze, Germany). The suspensions were conditioned to 30 °C for exactly 60 min before being hydrolyzed. After further dilution to 2.5% H2SO4, the samples were treated in an autoclave (Systex VX-75 from System GmbH, Linden, Germany) for 30 min at 120 °C. The hydrolysis residues were filtrated, washed, dried, and weighed. The filtrated solutions were analyzed using chromatographic methods of the borate-HPAEC analysis method. In this method, Dionex Ultimate 3000 and anion exchange resin MCL GelCA08F (Mitsubishi Chemical) and a column with dimensions of 5 × 120 mm (Omnifit) packed at 65 °C were used for chromatographic separation. The mobile phase of two potassium tetraborate/boric acid-buffers in water: 0.3 M of pH 8.6 (C); and 0.9 M of pH 9.5 (D) were used and separation was performed at 65 °C with a flow rate of 0.7 mL/min. The elution program was started with 90% C and 10% D and changed to 10% C and 90% D within 35 min. This rate was kept constant for 8 min and changed back to 90% C and 10% D within 7 min. Prior to detection, post-column derivatization by Cu-bicinchoninate (0.35 mL/min) was applied at 105 °C in a Teflon® coil of 30 m length and 0.3 mm in diameter. The results were detected at 560 nm via UV-Vis detection. Finally, characterization was done as follows: Cellulose is the same as a fraction of glucose; hemicellulose is the total sum of xylose, mannose, galactose, arabinose, and rhamnose; and lignin is the total sum of hydrolysis residue and acid-soluble lignin.

2.2.4. Fourier Transform Infrared Spectroscopy (FTIR)

AFTIR is used to identify functional groups and chemical bonding using two modes of molecular vibration stretching and bending. Vibrational stretching can be symmetrical and antisymmetric, whereas vibration bending includes scissoring, rocking, wagging, and twisting, which result from absorption of specific wavelengths of infrared region [46,47]. Based on these principles, the spectra of recycled LLDPE, MDPE, HDPE, reference (ref-) LDPE, and PP were investigated by recording their IR analysis in absorption mode within the range of 4000–400 cm−1. Optical resolution of 4 cm−1 was used for a 24-repetition scans where a distinct background spectrum was subtracted from each group.

2.2.5. Differential Scanning Calorimetry (DSC) Analysis

Thermal degradation and crystallinity properties were done with DSC (Netzsch DSC-214, Germany). About 4.1 mg of samples were measured, placed in crucibles, secured in high-purity nitrogen, and heating and cooling rate were done at 20 °C/min. Heating rate was first done by heating the sample from 25 °C to 350 °C to completely melt and eliminate the thermal history and cooled to 25 °C to obtain the crystallization process curve. Reheating was continued from 25 °C to 350 °C to obtain a melting curve. Then, crystallization temperature (TC), melting temperature (Tm), enthalpy of recrystallization (ΔHc), and melting enthalpy (∆Hm) were determined. Finally, the fraction of crystallinity (XC) was evaluated from the ratio of enthalpy absorbed during the heating process (∆Hm) to the total enthalpy of highly crystallized PE which ranged from 288–293 J/g [48] and 293 J/g was used.

2.2.6. Polycyclic Aromatic Hydrocarbons (PAHs) Analysis

The PAHs were determined according to the German Federal Institute for Occupational Safety and Health [49]. Samples of LLDPE, MDPE, and HDPE were taken and cut to the size of 2–3 mm. Then, 500 mg of the sample was weighed and extracted with 20 mL of toluene for 1 h at 60 °C in an ultrasonic bath. An aliquot was taken from the extract once it was cooled down to room temperature and additional purification steps were carried out using column chromatography. Quantification was performed on a gas chromatograph with a mass-selective detector (GC/MSD) using the selective ion monitoring (SIM) method. The injected volume of 1µL with pulsed splitless, column type of HT8 25 m long with 0.22 mm internal diameter, film thickness of 0.25µm, injector temperature of 280 °C with transfer-line temperature of 260 °C, initial and final temperatures of 50 °C and 320 °C, and initial and final times of 2 min and 8 min were taken at a heating rate of 11 °C/min.

2.2.7. Metal Additives and Halogens Analysis in Recycled Polymers

The utilization of post-consumer thermoplastic waste needs to meet its threshold values of metal additives that affect the safety of end users. Besides, residual excess metal ions catalyze thermo-and/or photo-oxidation of plastic, initiating unwanted polymerization resulting in volatile organic compounds. This leads to uncontrolled porosity in WPC material for oxygen and moisture penetration during processing that affects service durability [18]. As a result, metal additives and other elemental analyses in the recycled LLDPE, MDPE, and HDPE were evaluated according to the methods of the European Union directives on Waste Electrical and Electronic Equipment and the Reduction of Hazardous Heavy Metals method in PE using a Thermo Scientific Epsilon 5 XRF spectrometer. The analytical parameters used certified standards of TOXEL developed by both DSM Resolve and PANalytical in which each TOXEL set comprises standards of regulated elements Cr, Cd, Hg, Pb, As, Ni, Cu, Zn, Ba, and Br [50,51].

2.3. Formulation and Forming Process of Wood Polymer Composites

WPC preparation involves composition determination, compounding, and consolidation processes as indicated in Figure 3. Low composition (30%) (LC) and high composition (70%) (HC) of both BP untreated (BPU) and treated (BPT) with 3% aqueous NAOH solution and recycled PE varieties, like linear low-density polyethylene (LLD), medium density polyethylene (MD), high-density polyethylene (HD), and equal melt mixed blend (EM) as polymeric matrix were used. Accordingly, 16 formulations were prepared as shown in Table 1, including compounding and consolidation conditions.
Before compounding, the moisture content of BP was dried in a vacuum dryer (Heraeus, Hanau, Germany) at 90 °C to 2% maximum in moisture analyzer (Sartorius MA 35, Sartorius AG, Gottingen, Germany). According to Table 1, compounding was performed in the pre-heated mixing chamber (HAAKE Reomix 3000 OS, Thermo Scientific, Waltham, MA, USA) of a tangential co-rotating twin-screw extruder started with plastic polymers. After 5 min, BP was added and continued for 15 min. Then, the compounded WPC granules were dried and stored in plastic bags, and then reduced with a cutting mill (SM 2000, Retsch, Haan, Germany) of 8 mm mesh size. Next, WPC was formed in a computer-controlled lab-scale compression molding (Siempelkamp, Krefeld, Germany) using a metal frame of 180 × 200 × 4 mm including unfilled polymeric matrix. Compression molding involves the following cycles: low pressure melting for 1 min; pressing at 20 bar for 8 min; at 60 bar for another one minute; and with increased pressure up to 100 bar for one additional minute. Next, the pressure was held constant, and pressing continued, followed by slow cooling until the temperature fell below 80 °C. Finally, press plates were opened and WPC boards were removed from the metal frame.

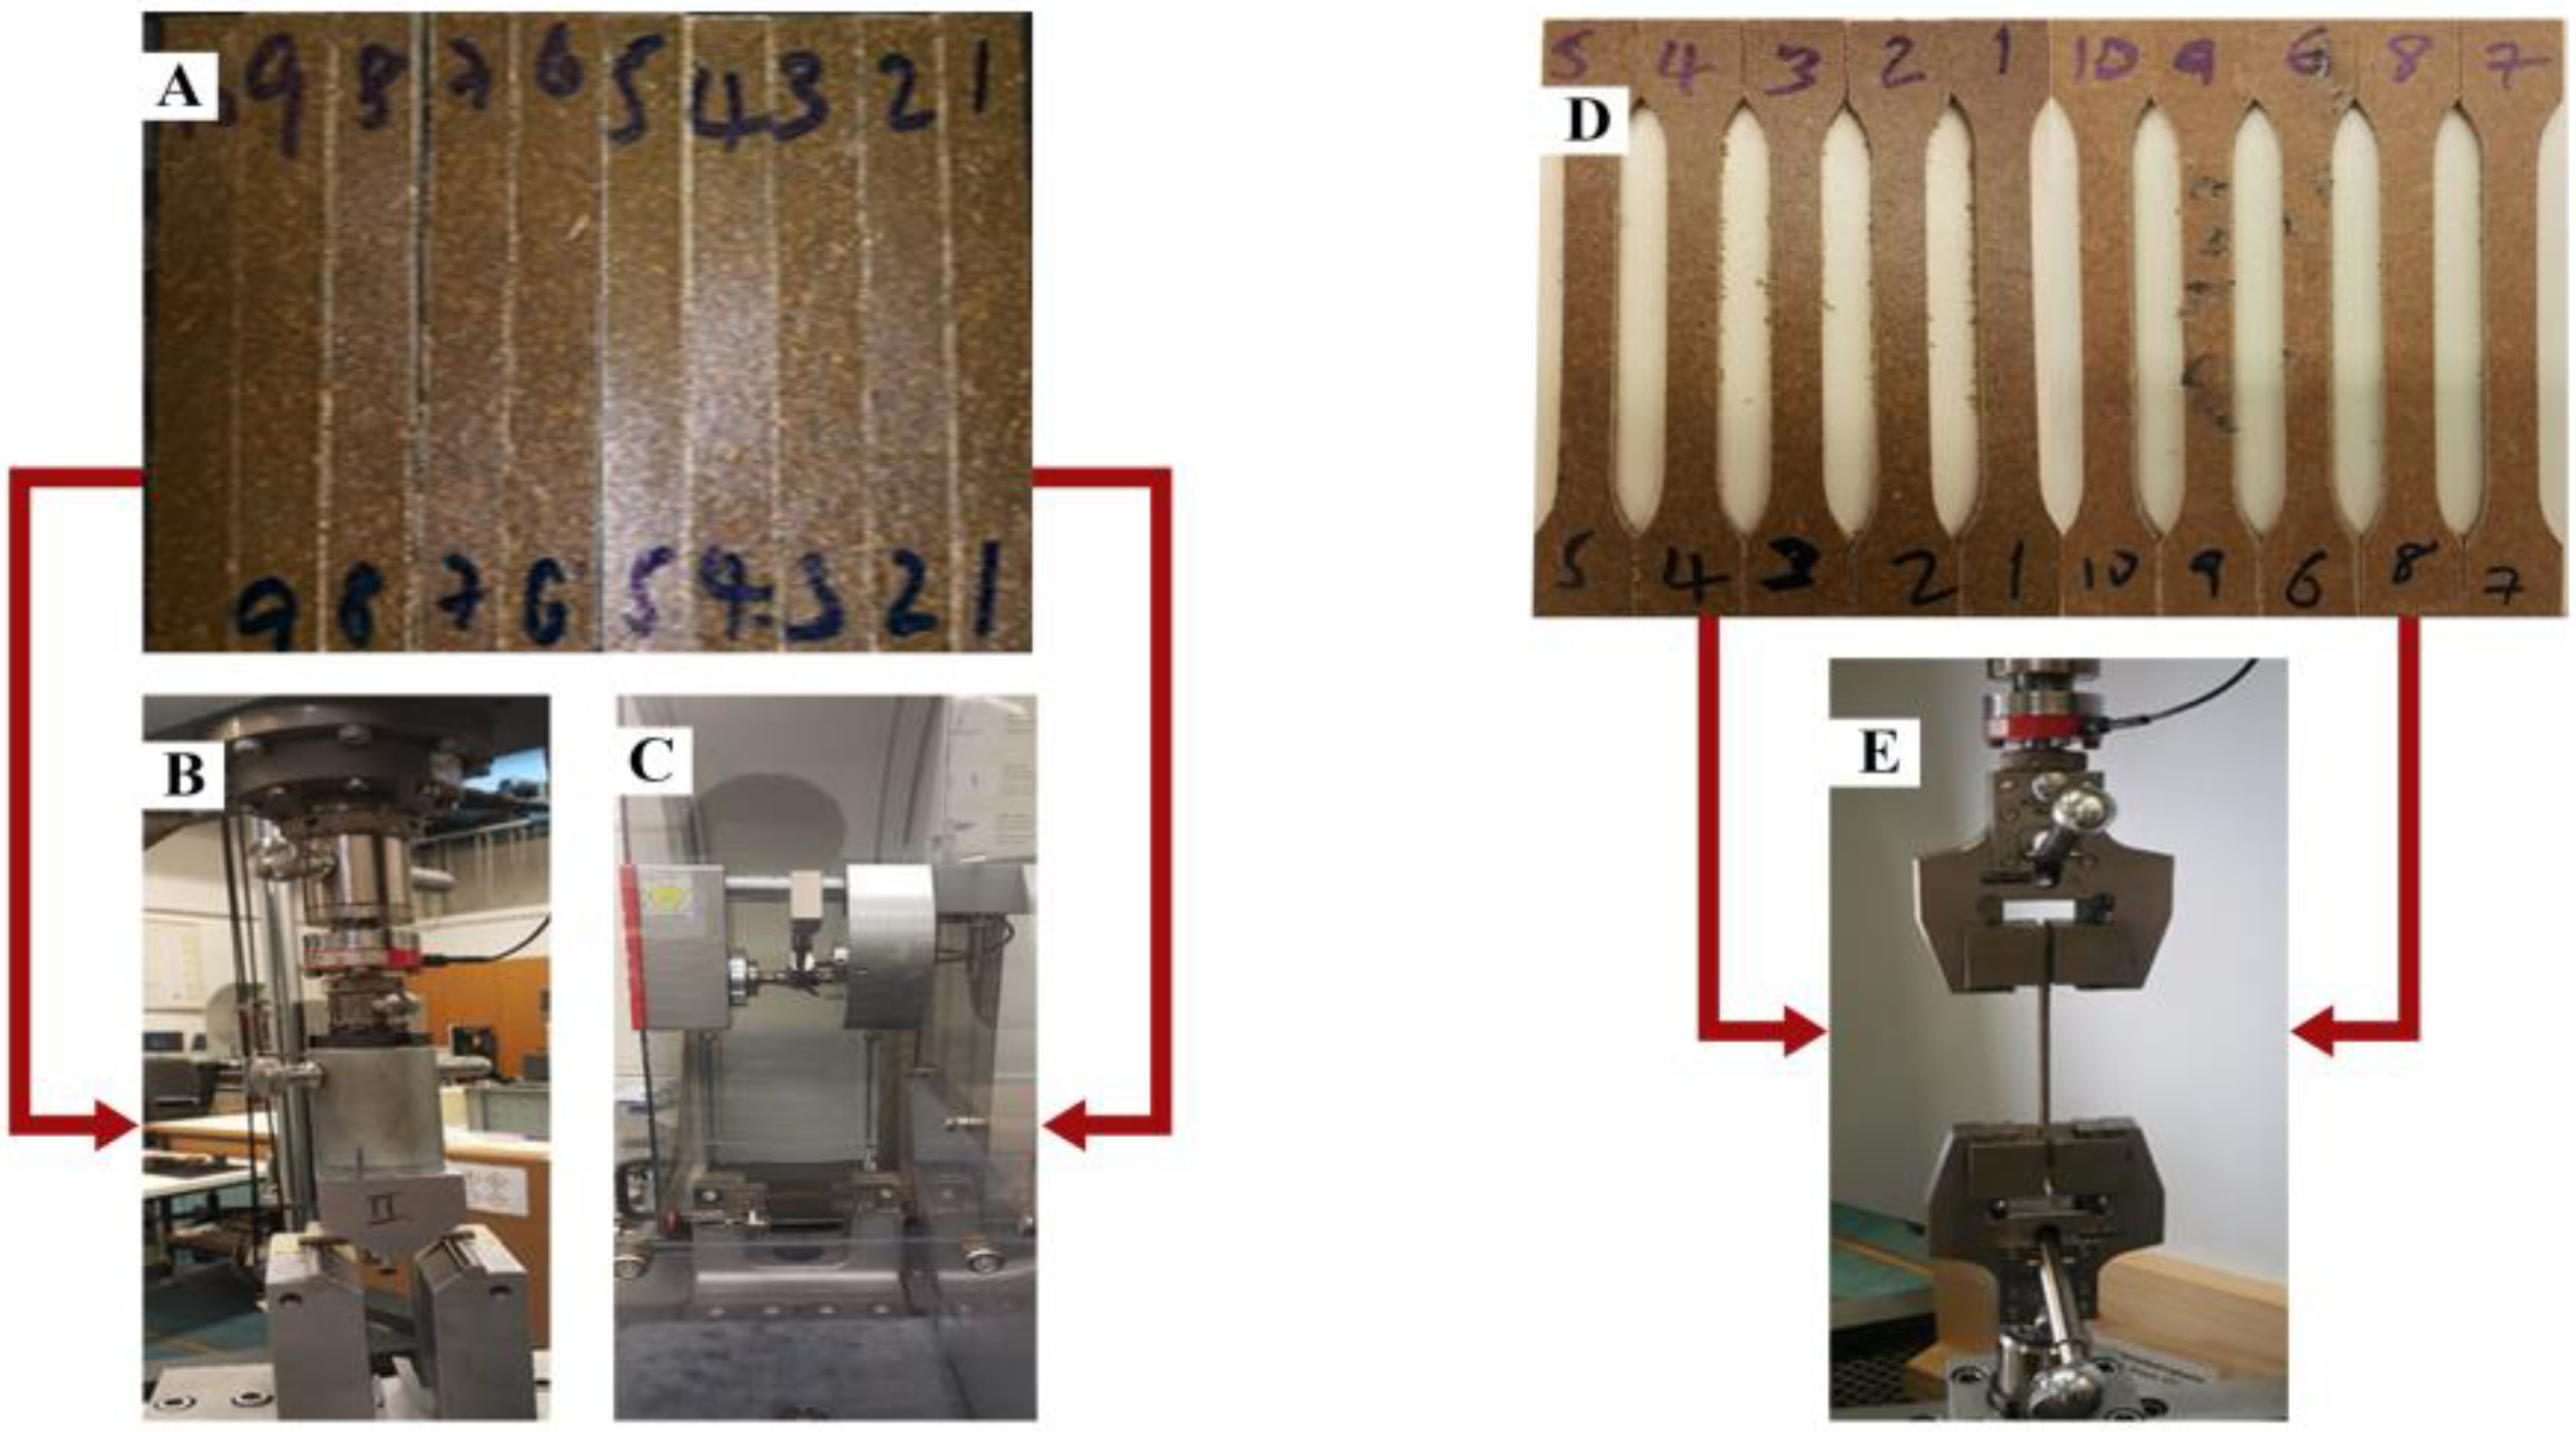
2.4. Sample Preparation and Mechanical Tests

TM and TS were tested using a 10 dumbbell-shaped sample of dimensions 170 × 10 × 4 mm according to EN ISO 527-1:2017 in 20 °C and 65% relative humidity. Universal Testing Machine (ZWICK videoXtens, Germany) of 5 kN load cell, crosshead speed of 1 mm/min, and a video extensometer was used. TM was determined in between 0.05–0.25% rate of strain. The same equipment and sample size were used for the FS and FM tests. Different dimensions of 80 × 10 × 4 mm were prepared by precision cut-off saw (Mutronic Diadisc 4200, Germany) as DIN EN ISO 179-1. UIS was determined using the Charpy impact test (Zwick-Roell HIT5.5P, Germany) using 12 samples from the two replicates similar in dimensions to FS (Figure 4).

2.5. Statistics Analysis

The statistical variations among the measurements were evaluated using standard deviation (SD). The measured quantities were reported as the mean average of the replicates with SD in brackets.

3. Results and Discussion

3.1. Chemical Characterization of EHB

Table 2 shows the free sugar content and chemical characterization of indigenous EHB. The result shows a slight difference in free sugar analysis and their corresponding polysaccharides. The results of untreated EHB characterization show free sugar contents like xylose, glucose, mannose, galactose, arabinose, rhamnose of 16.83%, 45.86%, 0.4%, 0.46%, 0.91%, and 0.09%, respectively, and cellulose, lignin, and hemicellulose content of 45.86%, 18.77%, and 32.08%, respectively. The 10% and 5% treatments are not significantly different from those of 3% NaOH. For example, the difference in free sugar content, particularly glucose, that is used to determine the amount of cellulose as a dominant share, of 3% treatment with 5% and 10%, is only 1.03% and 4.55%, respectively. As a result, the 3% NaOH concentration was selected for the BP surface treatment needed for subsequent WPC formulation.

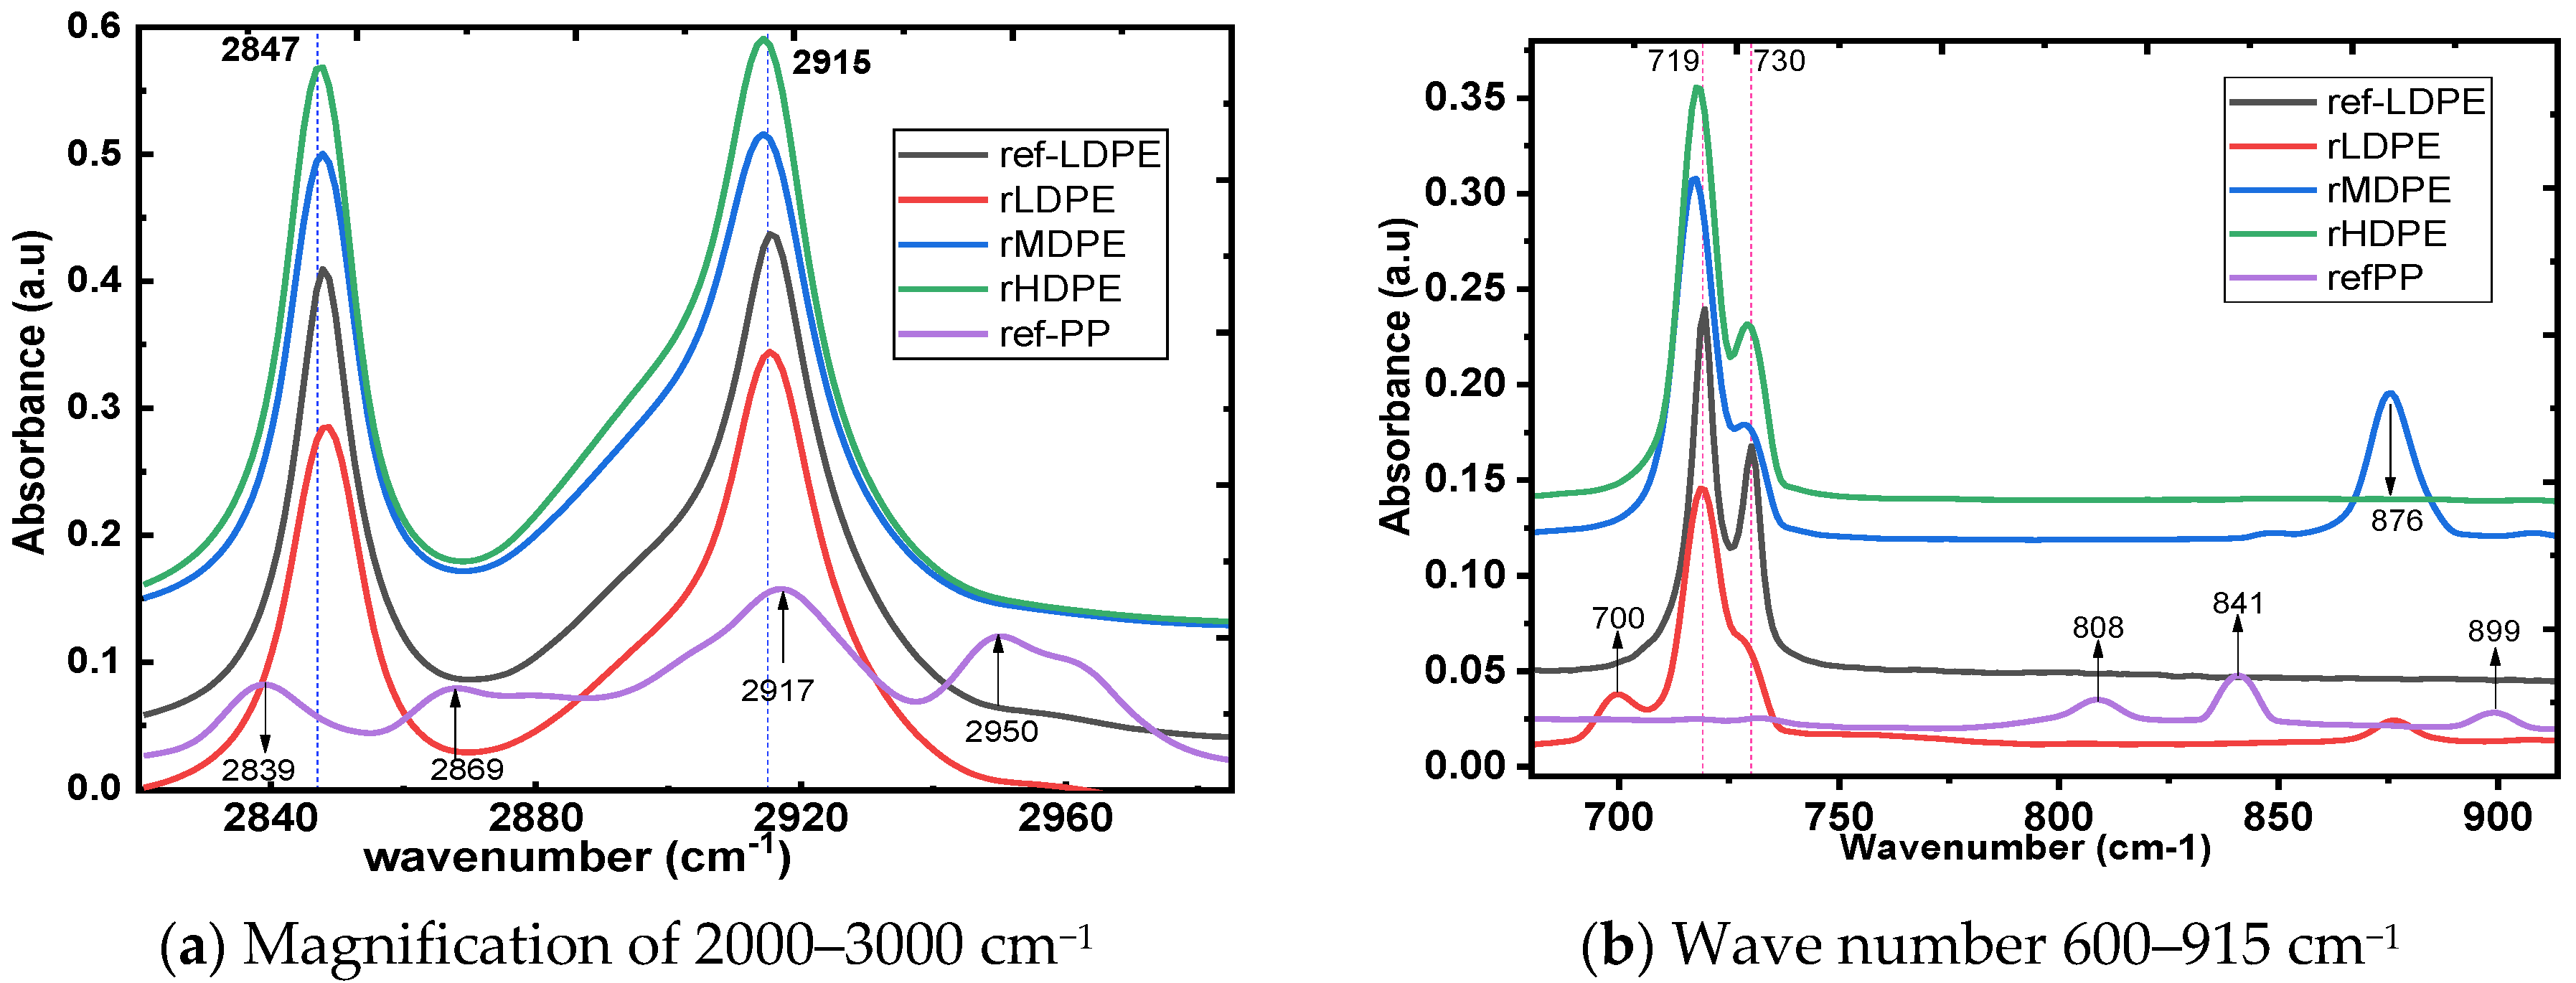
3.2. FTIR Analysis of the Recycled Plastics

As shown in Figure 5, special band regions were enlarged and separated into parts ‘a–d’. The virgin PP was included to identify the constituents of recycled PE plastics as PP is usually present in the same waste streams [46]. As presented in Figure 5 and Table 3, absorption in the region of 2845–2865 cm−1 (a), 1485–1445 cm−1 (c), and 750–720 cm−1 (b) are due to C-H asymmetrical and symmetrical stretching frequencies, bending or scissoring of C-H, and rocking of -CH2- respectively [52]. As shown in Figure 5a, all PE recycled plastics have similar methylene strong C-H asymmetric and symmetric stretching at 2915 and 2847 cm−1, respectively, like ref-LDPE but differ in absorption intensity decreased top to down. In contrast, ref-PP has these weak band peak positions along with two other spectral zones at 2950 cm−1 and 2869 cm−1 of methyl C-H asymmetric and symmetric stretching. This shows that there is no PP polymeric contaminant. Except for rLLDPE, rHDPE and rMDPE have very similar FTIR signatures around 730–710 cm−1 and 1485–1445 cm−1 as ref-LDPE, as shown in Figure 5b,c. These peaks correspond to the methylene (CH2)n rocking and methylene C-H bending (rocking) deformation, respectively [47]. The CH2-in-plane rocking peak in rHDPE separated faster near its shoulder into 719 and 730 cm−1 (Figure 5d) than in rMDPE, but not in rLLDPE, which had a single broad peak at 719 cm−1. This results from a collision when a CH2 rock out-of-phase changes the force constant of the vibration from the in-phase, resulting in different rocking peak positions, indicating semi-crystallinity of PE plastics. Besides, ref-LDPE and rLLDPE have small CH3 umbrella mode at 1377 cm−1 from side chains unlike rHDPE. Medium band region around 700 cm−1 of rLLDPE is assigned to cis-C-H out-of-plane bend in olefins copolymerized with 1-hexene [47]. We observed that crystallinity ranges are related to higher splitting, maximum absorption, and larger peak areas. This is used to differentiate rLLDPE from the most crystalline PE polymers (rHDPE and rMDPE) using FTIR, showing the claimed recycled plastics are sorted properly.
The unusual band region of rHDPE at 880 cm−1 is C-H out of plane bending vibrations for aromatics 1,3-disubstitution which could be related to the residual aromatic bearing of colorant molecules in the prehistory of rHDPE material. The difference in spectrum splitting compared with ref-LDPE could have resulted from repetitive thermal processing that leads to decreased linear character of the polymeric chains and decreased crystallinity.

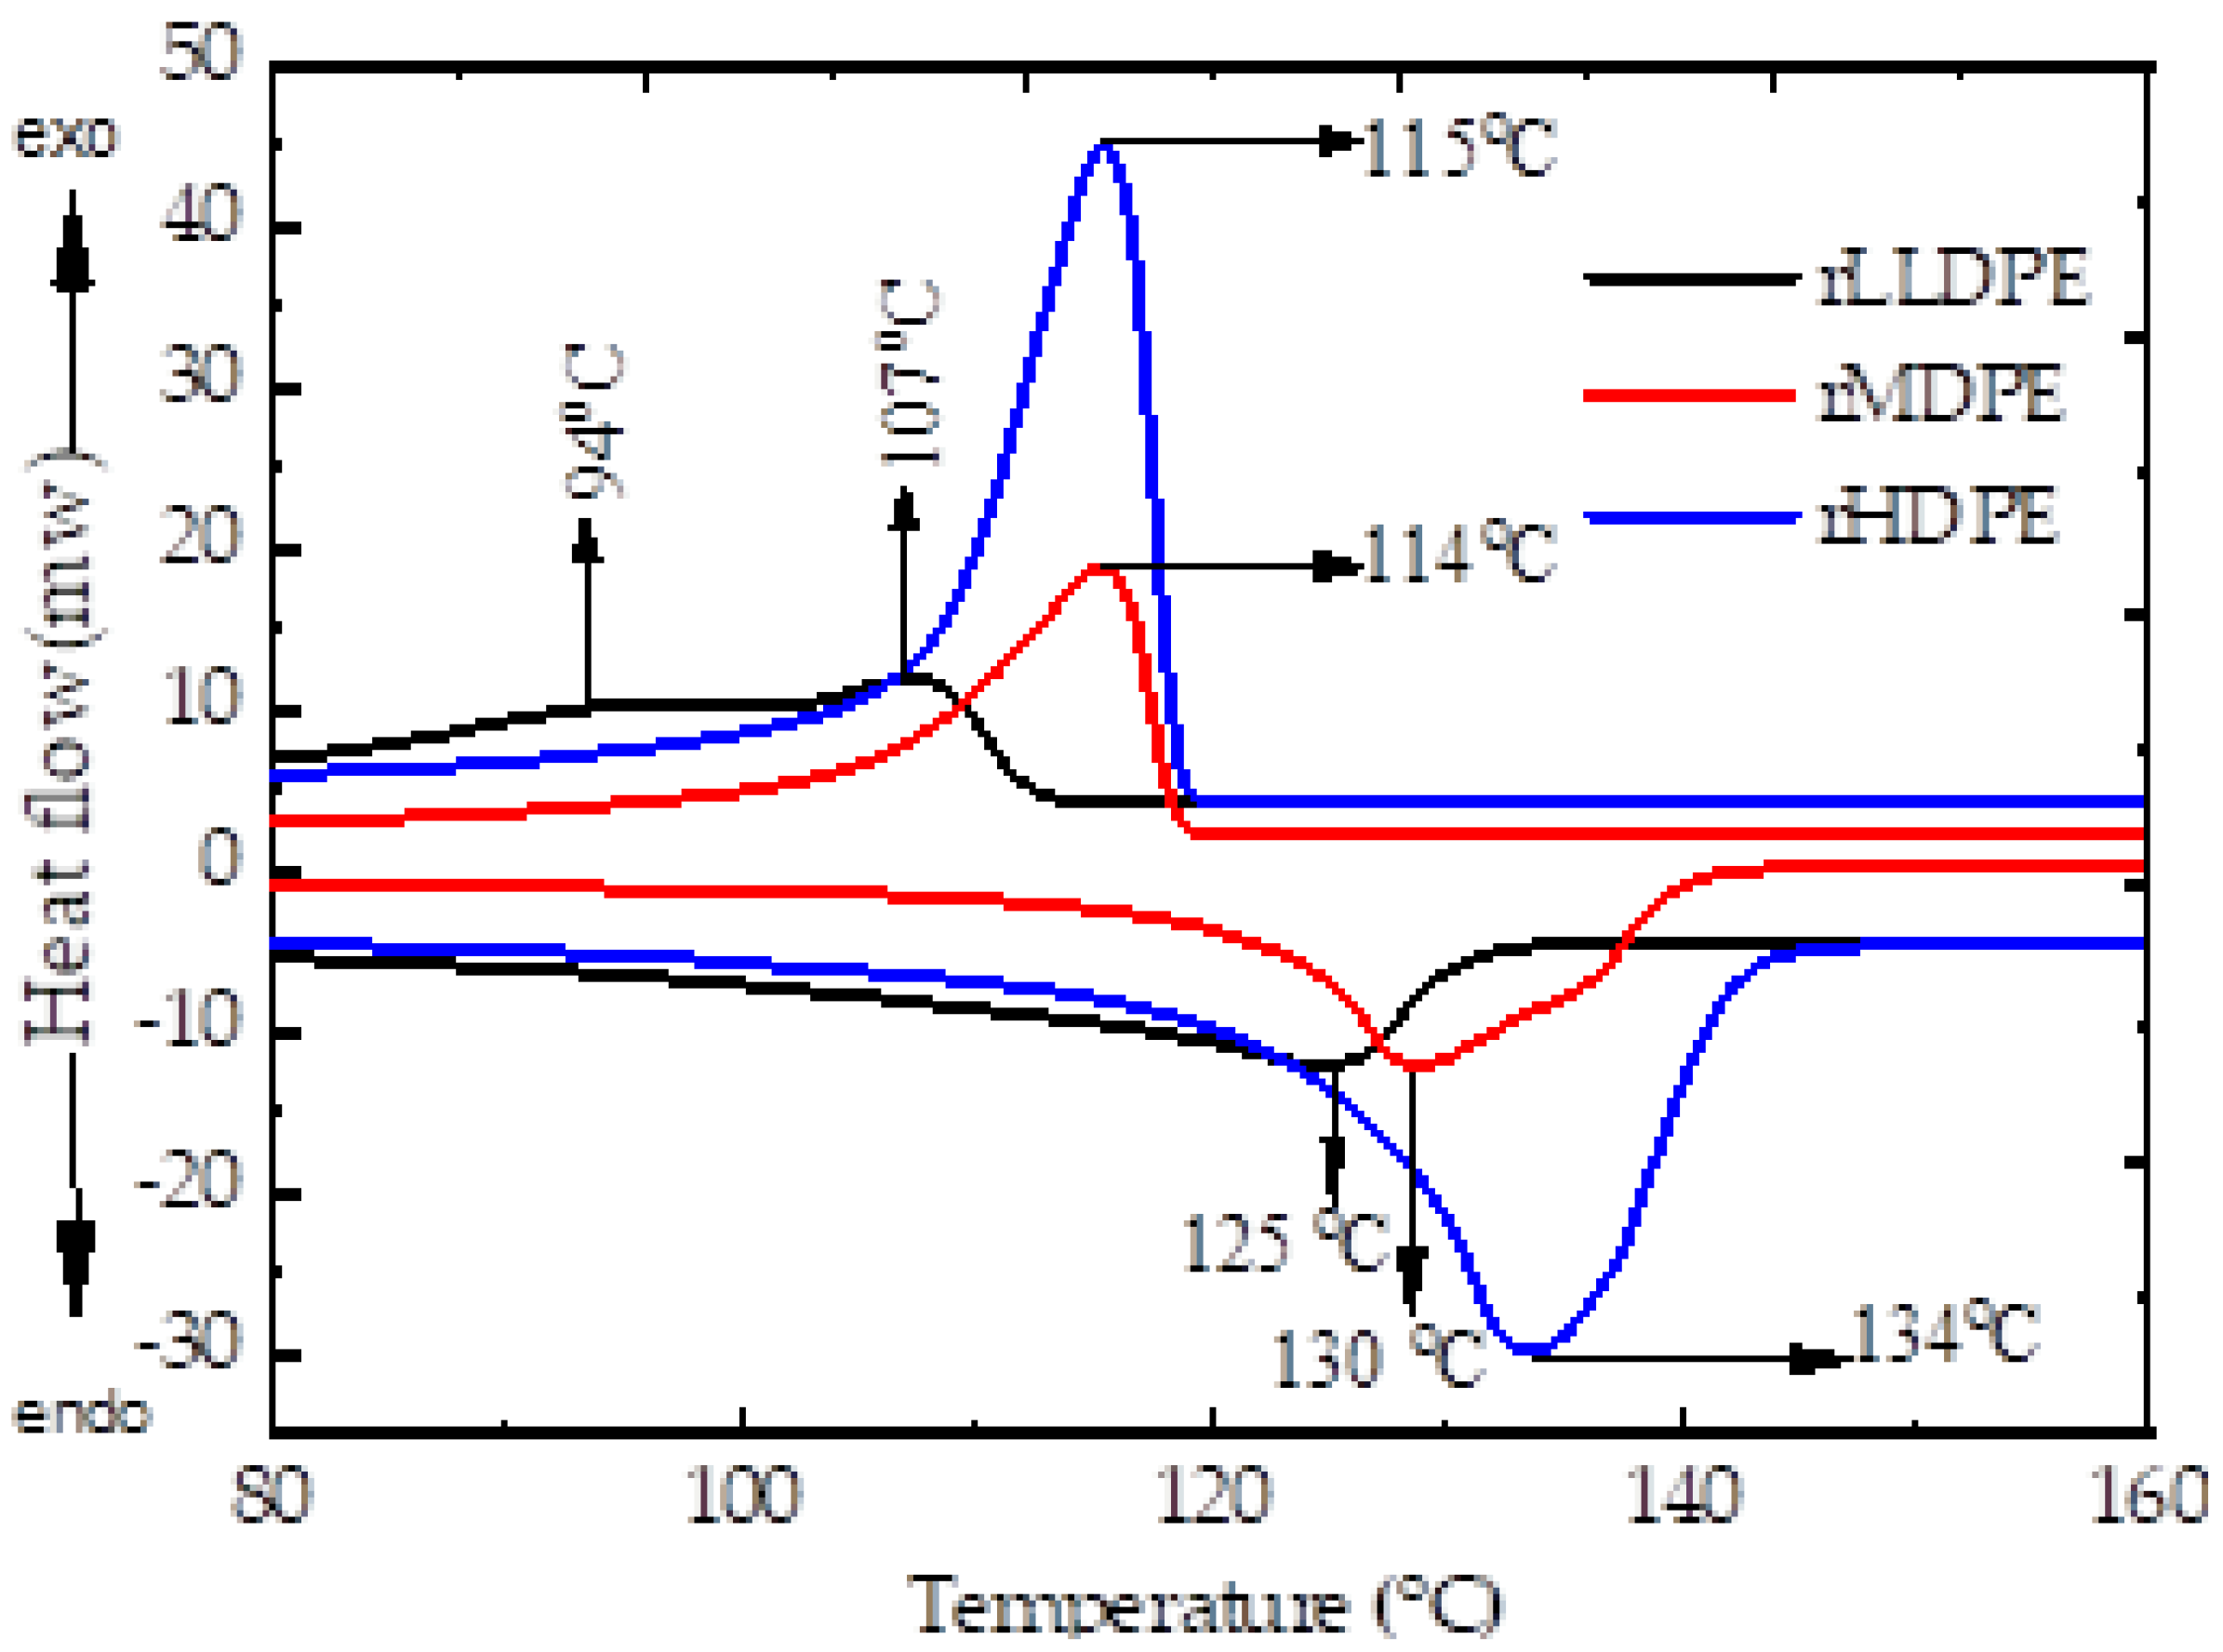
3.3. The Differential Scanning Calorimetry (DSC) Analysis

As shown in Figure 6, the orientation with exo up is an exothermic process of higher heat flow values and an endothermic process is of lower heat flows. The bottom curve shows the heating cycle used to remove thermal and stress history. It gives information on processing and environmental conditions that alter the material. As a result, it gives information like Tm, XC, and ΔHm whereas the other curve provides information about how the sample solidifies, erases thermal history, and allows the molecules to reach the optimum molecular orientation. It is used to find information about TC and ΔHc [54].
As can be seen from Table 4, recycled PE polymers show different Tm peaks and XC. The Tm of rLLDPE is the lowest with a wide and less sharp melting peak. This could be molecular disorder during thermal processing and prehistoric high amorphous content. However, rHDPE has the highest melting peak and XC followed by rMDPE, as shown by more concave sides and longer tails. There is a significant difference in XC as well in which rHDPE is the highest, followed by rMDPE. This is mainly attributed to the density difference resulting from high molecular order and less branches in rHDPE. These results agree with those reported in the previous study with few variations. For example, Prasad (1998) found the first broad low TC peak around 95 °C, the second sharp TC of 109 °C, and a sharp Tm of 123 °C [55]. The same author found ΔHm of 209.7 J/g and 144.3 J/g for virgin HDPE and MDPE, respectively. Li et al. (2019) investigated DSC analysis of four different virgin PE (LDPE, LLDPE, MDPE, and HDPE) and discovered XC values of 38.73%, 39.45%, 48.36%, and 51.17% [54]. The value of XC reported for rHDPE in this study was higher, which could be an impurity that increases the crystallinity and acts as a nucleation site for the crystallization of the polymer [56].

3.4. Metal Additives Analysis Result in the Recycled Plastics

As shown in Table 5, the highest content of Ti, Ba, Cl, Zn, and Fe were 296.9, 1227.54, 736, 82.4, and 627 in ppm, respectively in rLLDPE; and 806, 226, 304.9, 281.4, and 316.9 in ppm, respectively in rHDPE. These could come from admixtures and residual catalysts used for special properties like inorganic pigments (TiO2, ZnO, and Fe2O3), flame retardants (Sb2O3 and brominated organics), and stabilizer compounds of Ba, Sn, and Zn. Others are related to residual catalysts such as Neiglar Natta and Metallocene catalysts, which were used in the prehistoric production of HDPE and LLDPE virgins [16,57]. However, rMDPE is relatively less contaminated. Heavy metal content for Cd is less than 100 ppm (mg/Kg) and 1000 ppm (mg/Kg) for Pd, Hg, and Cr (VI) [17], implying that recovered PE can be used as secondary resources for WPC formulation when properly sorted from waste fractions. Nevertheless, better sorting and representative allocation of continuous sampling of a large enough sample size need to be applied over a long period.

3.5. Polycyclic Aromatic Hydrocarbons (PAHs) Analysis

PAHS, which are hydrocarbons of multiple aromatic rings, are known to be toxic, carcinogenic, and mutagenic, and their investigations are imperatively needed. As shown in Table 6, the threshold sum quantity PAHs naphthalene (C10H8), acenaphthylene (C12H8), acenaphthene (C12H10), and fluorene (C13H10) [58] should be less than 10 mg/kg. Whereas the total sum of phenanthrene (C16H10), anthracene (C14H10), fluoranthene (C20H12), and pyrene (C16H10) needs to be less than 50 mg/kg as a threshold limit. PAHS like benzo(a)anthracene (C18H12), chrysene (C18H12), benzo(b)fluoranthene (C20H12), benzo(k)fluoranthene (C20H12), benzo(a)pyrene (C22H12), indeno(123cd)perylene (C22H12), dibenzo(a.h)anthracene (C22H14), and benzo(ghi)perylene (C22H12) should have threshold amount of less than 1 mg/kg [49]. Surprisingly, the PAHs content of rLLDPE, rMDPPE, and rHDPE meets the criteria for reutilization as secondary resources.

3.6. Mechanical Properties

The mechanical properties TS, TM, FS, FM, and UIS of recycled (r) PE (LLD, MD, HD, and EM) at LC and HC and their corresponding virgin (v) are given in Table 7. Their corresponding 16 WPC formulations from the recycled ones are shown in Table 8.
As shown in Table 7, TS, TM, FS, FM, and UIS of rLLD, rMD, and rHD are differing from their respective virgins including WPC formulations. Mechanical properties were reduced when compared to virgin, but UIS of rEM increased by 43.84% and 34.55%, respectively, when compared to rMD and rHD. Similar patterns were observed in their respective virgin polymers. Because of changes in the molecular weight, crystallinity, and degradation due to chain scission, contaminants, and solid particles of residual catalysts or mineral filler, recycled plastics are anticipated to have lower mechanical properties compared with virgin raw materials [58]. However, without any coupling agent or crosslinking agent, mechanical properties like TS, TM, FS, FM, of rLLD were enhanced when it was equally melt blended with rMD and rHD (EM) by 44.02%, 81.01%, 49.39%, and 56.56%, respectively, except for UIS, that shows 37% reduction. This shows that there is some interaction of molecular entanglement among PE (LLD, MD, and HD) plastic since EM was not mechanically failed at the lowest point expected from rLLD. This implies the weakest and most pollutant form of PE (rLLD) can be blended with rMD and rHD as more value addition.

3.6.1. Tensile Strength and Modulus of Elasticity

TS evaluates the response of material to slowly-applied uniaxial force and measures the magnitude of internal bond strength of composite material. As shown in Table 8, out of 16 formulations of four sets, compositions with HC of recycled PE matrix show better TS compared with LC since motions of polymer chains are unhindered and stress distribution in the matrix phase is enhanced. Meanwhile, HC of BP reduces TS due to difficulties in homogenous distribution of BP into the polymer matrix. This is attributed to the rigidity of WPC at HC of BP rarely accessed by polymer chains and weak interfacial adhesion [10,59]. On the contrary, the TM of all WPC formulations was increased dramatically compared with their core polymers like in previous works [60]. For example, TM of LLD, MD, HD, and EM were increased in 520.42%, 322.8%, 129.27%, and 127.28%, respectively, at LC of BPU and even in a higher percentage with HC of BP for both untreated and treated. Similarly, the TS and TM of HCEM-BPU, HCEM-BPU, LCEM-BPU, and LCEM-BPU formulations increased by 69.17%, 40.07%, 72.65%, and 76.95%, respectively, compared to LLD formulations: HCLLD-BPU, HCLLD-BPT, LCLLD-BPU, and LCLLD-BPT. These percentage increases in TS and TM of EM composite are greater than the amount by which TS and TM of corresponding MD and HD formulation are reduced compared with the respective formulations of LLD. These show the advantages of melt blending of the weakest PE plastics LLD with MD and HDPE as it provides a material with properties that differ from the unique polymers involved. This implies that although miscibility is uncommon in plastic blends, mechanical properties have the benefit of the blends over separate phase. Compared with their polymer matrix, low TS of WPC is expected without any coupling agent. However, such stiffer WPCs are better in structures that need high stiffness, rigidity, and low resistance to tensile loading, like decking [61], and meet the requirements of some applications [7]. These trends are similar to those outlined in previous works where both FM and TM increased with particle content while TS, impact strength, and elongation at break decreased regardless of whether they were virgin or recycled plastics [62]. The influence of 3% alkali treatments in all WPC formulations show a slight increase in the TS, TM, FS, and FM up to 20% compared with BPU. This implies that the alkali solution removed fat and wax, resulting in a rougher effective surface area of BP available at interphase, enhancing some mechanical interlocking while reducing impact strength [52].

3.6.2. Flexural Strength and Modulus of Rupture

Flexural strength measures the ability of material to resist deformation under applied load and is used to evaluate its rigidity. FS and FM are significant requirements of WPCs for various applications. In this study, the flexural properties of all 16 WPCs are shown in Table 8. We observed that high HC of PE plastic content exhibits better FS as full encapsulation of BP by the plastic matrix easily occurs. This helps disperse BP into the plastic matrix, which improves the stress distribution, but like TS, the FS of WPC decreases slightly with BP additions for the identical reason discussed above. However, FS of LC of WPC of polymeric matrix LLD, MD, HD, and EM were increased by 520.42%, 228%, 224.64%, and 227.19%, respectively, for both UBP and by a higher percentage with HC of BP, both untreated and treated. Specifically, the TS of LLD decreased more than the others because of its high flexibility and extremely low-stress resistance. However, the FS and FM of HCEM-BPU, HCEM-BPU, LCEM-BPU, and LCEM-BPU composites increased by 59.52%, 66.19%, 42.86%, and 48.16%, respectively, when compared to the respective LLD formulations: HCLLD-BPU, HCLLD-BPT, LCLLD-BPU, and LCLLD-BPT. These percentage increases in FS and FM of EM composite exceeds the amount by which FS and FM of corresponding MD and HD composites are reduced compared with the respective LLD composites.

3.6.3. Impact Strength

Impact strength is measured using two standard techniques: Charpy and Izod impact testing. It is used to calculate the amount of energy a material has stored to resist fracture under high-speed stress. As seen from Table 8, BP addition decreases UIS because of the weak interphase bond [63]. However, improvement in UIS of both MD and HD was observed when they were melt blended with LLD because of its inherent high ductility and flexibility. When compared to the unfilled respective PE matrix, all WPC of HC of plastic have less variation of UIS, whereas LC of plastic or HC of BP loading increases stiffness at the expense of composite toughness. Generally, the best results of UIS were for 30 wt% of BP and 70 wt% of PE plastics. Similarly, like other mechanical properties, which basically depend on the crystalline content of the polymer, the UIS of WPC is affected by the BP proportion in the matrix.

4. Significance of the Study

Many African countries have large quantities of lignocellulosic biomass and post-thermoplastic PE that can be converted into higher-value products. For example, using readily available bamboo biomass and secondary resources (recycled) of plastic materials in WPC design can provide low-cost, affordable housing materials. New market chains in microbusinesses, on the other hand, will emerge, and income will be generated from underutilized potential secondary resources that would otherwise result in environmental plastic pollution. In the long run, this work is likely to increase the potential for innovation and market penetration by establishing an international network of developed countries with WPC processing experience. Furthermore, the trade deficit in building materials will be reduced, and this work will have an overall positive impact as bamboo resources have high potential with a low risk of conflicting with the food chain.

5. Conclusions

WPC is successfully formulated from the untapped potential of EHB and low-cost post-consumer PE varieties such as LLDPE, MDPE, HDPE, and EM as polymeric matrixes. Experimental work focused on how to utilize these waste fractions and underutilized EHB into the product lifecycle intended for building materials. Like conventional wood fiber fillers, EHB contains comparative cellulose, lignin, and hemicellulose, showing that it can be utilized as a substitute for WPC formulations. Post-consumer plastics characterization contains residual elements of Ti, Ba, Cl, Zn, Pd, Hg, and Cr (VI) that fall below their threshold limits. Furthermore, FTIR analysis, the fraction of crystallinity, and melting temperature of the recovered PE plastics show similar properties to their virgin counterparts and can be used as secondary resources for reutilization.
The investigated polymer types and compositions were found to significantly affect the WPC mechanical properties. WPC composites containing rHDPE exhibit superior mechanical properties, while recycled LLDPE exhibits the poorest mechanical properties. WPC made with a 30% composition of BP showed better mechanical properties in both tensile and flexural strength due to improved melt-flow that recrystallized the polymer matrix on the surface of BP, leading to better encapsulation of the plastic matrix. On the other hand, compared with their respective matrix, there is a trend of increasing in TM and MR with BP with the sacrifice of TS, FS, and UES. EM of recycled LLDPE, MDPE, and HDPE matrix WPC formulations shows an increase of TS, FS, UIS, ME, and MR by more than 60% compared with LLDPE. These show the advantages of mixing the weakest PE plastics, LLDPE, with MDPE and HDPE, as it provides a material with properties that differ from the unique polymers involved. In such an approach, a fraction of virgin synthetic PE plastics and limited wood fibrous particles can be used to a much lesser extent in the production line of WPC. Furthermore, because it has mechanical properties comparable to commercial products, such products can be used in areas of interior applications like insulation, wall cladding, and ceiling boards with a low risk of biodegradation and deformation.
To improve both the physical and mechanical properties of WPC, coupling and cross-linking agents that form a strong interface surface, such as LDPE-g-MA or PP-g-MA, should be added. This improves stress transferability within the composite, resulting in increased impact and flexural strength for high-quality decking applications. Other waste from devulcanized rubber products, like ground waste tires, can also improve the composite’s impact properties and should be addressed and investigated in future studies.

Author Contributions

Conceptualization: K.D.A., M.D.A., A.K. and G.S.; methodology: K.D.A.; validation: K.D.A. and M.D.A.; formal analysis: K.D.A.; investigation: K.D.A.; resources: G.S. and A.K.; writing—original draft preparation: K.D.A.; supervision G.S., A.Y.A. and A.K. All authors have read and agreed to the published version of the manuscript.

Funding

This research received no external funding.

Data Availability Statement

All data is available upon request.

Acknowledgments

The authors acknowledge both NANODAS and the EXCEL PLASTICS PLC factory (Ethiopia) for providing recycled and virgin PE plastics (LLDPE, MDPE, and HDPE). We also thank the Laboratory of Wood Chemistry at the University of Hamburg (Germany), Thünen Institute of Wood Research (Germany) and Addis Ababa Institute of Technology (Ethiopia) for providing laboratory facilities. Finally, the corresponding author is very grateful for the three-month research stay offered by the German Federal Ministry of Education and Research and German Academic Exchange Service-DAAD.

Conflicts of Interest

The authors state that there are no opposing financial issues or anything that could influence the result reported in this document.

References

  1. Formela, K.; Kurańska, M.; Barczewski, M. Recent Advances in Development of Waste-Based Polymer Materials: A Review. Polymers 2022, 14, 1050. [Google Scholar] [CrossRef]
  2. Zhang, Q.; Zhang, D.; Xu, H.; Lu, W.; Ren, X.; Cai, H.; Lei, H.; Huo, E.; Zhao, Y.; Qian, M.; et al. Biochar filled high-density polyethylene composites with excellent properties: Towards maximizing the utilization of agricultural wastes. Ind. Crops Prod. 2020, 146, 112185. [Google Scholar] [CrossRef]
  3. Miao, Y.; von Jouanne, A.; Yokochi, A. Current technologies in depolymerization process and the road ahead. Polymers 2021, 13, 449. [Google Scholar] [CrossRef] [PubMed]
  4. Geyer, R.; Jambeck, J.R.; Law, K.L. Production, use, and fate of all plastics ever made. Sci. Adv. 2017, 3, 25–29. [Google Scholar] [CrossRef] [Green Version]
  5. Bahari, S.A.; Krause, A. Utilizing Malaysian bamboo for use in thermoplastic composites. J. Clean. Prod. 2016, 110, 16–24. [Google Scholar] [CrossRef]
  6. Najafi, S.K. Use of recycled plastics in wood plastic composites—A review. Waste Manag. 2013, 33, 1898–1905. [Google Scholar] [CrossRef] [PubMed]
  7. Mohammed, A.S.; Meincken, M. Properties of low-cost WPCs made from alien invasive trees and rLDPE for interior use in social housing. Polymers 2021, 13, 2436. [Google Scholar] [CrossRef]
  8. Subramanian, P.M. Plastics recycling and waste management in the US. Resour. Conserv. Recycl. 2000, 28, 253–263. [Google Scholar] [CrossRef]
  9. Thunman, H.; Vilches, T.B.; Seemann, M.; Maric, J.; Vela, I.C.; Pissot, S.; Nguyen, H.N. Circular use of plastics-transformation of existing petrochemical clusters into thermochemical recycling plants with 100% plastics recovery. Sustain. Mater. Technol. 2019, 22, e00124. [Google Scholar] [CrossRef]
  10. Sommerhuber, P.F.; Welling, J.; Krause, A. Substitution potentials of recycled HDPE and wood particles from post-consumer packaging waste in Wood-Plastic Composites. Waste Manag. 2015, 46, 76–85. [Google Scholar] [CrossRef] [PubMed]
  11. Teuber, L.; Osburg, V.S.; Toporowski, W.; Militz, H.; Krause, A. Wood polymer composites and their contribution to cascading utilisation. J. Clean. Prod. 2016, 110, 9–15. [Google Scholar] [CrossRef]
  12. Kumar, T.V. (Ed.) Lignocellulosic Polymer Composites Processing, Characterization, and Properties; Scrivener Publishing and John Wiley & Sons, Inc.: Hoboken, NJ, USA, 2015. [Google Scholar]
  13. Pizzi, A.; Papadopoulos, A.N.; Policardi, F. Wood composites and their polymer binders. Polymers 2020, 12, 1115. [Google Scholar] [CrossRef]
  14. Elgharbawy, A.S.; Ali, R.M. A comprehensive review of the polyole fi n composites and their properties. Heliyon 2022, 8, e09932. [Google Scholar] [CrossRef]
  15. Correa, J.P.; Montalvo-Navarrete, J.M.; Hidalgo-Salazar, M.A. Carbon footprint considerations for biocomposite materials for sustainable products: A review. J. Clean. Prod. 2019, 208, 785–794. [Google Scholar] [CrossRef]
  16. Sormunen, P.; Deviatkin, I.; Horttanainen, M.; Kärki, T. An evaluation of thermoplastic composite fillers derived from construction and demolition waste based on economic and environmental characteristics. J. Clean. Prod. 2021, 280, 125198. [Google Scholar] [CrossRef]
  17. Sommerhuber, P.F.; Wang, T.; Krause, A. Wood-plastic composites as potential applications of recycled plastics of electronic waste and recycled particleboard. J. Clean. Prod. 2016, 121, 176–185. [Google Scholar] [CrossRef]
  18. Limited, W.P. Wood Polymer Composites (WPCs); Woodhead Publishing Limited: Sawston, UK, 2008. [Google Scholar]
  19. Alsarhan, L.M.; Alayyar, A.S.; Alqahtani, N.B.; Khdary, N.H. Circular carbon economy (Cce): A way to invest co2 and protect the environment, a review. Sustainability 2021, 13, 11625. [Google Scholar] [CrossRef]
  20. Devasahayam, S.; Raju, G.B.; Hussain, C.M. Utilization and recycling of end of life plastics for sustainable and clean industrial processes including the iron and steel industry. Mater. Sci. Energy Technol. 2019, 2, 634–646. [Google Scholar] [CrossRef]
  21. Bahru, T.; Ding, Y. A Review on Bamboo Resource in the African Region: A Call for Special Focus and Action. Int. J. For. Res. 2021, 2021, 10–12. [Google Scholar] [CrossRef]
  22. Junqi, C.K.W. Bamboo and Rattan Commodieties in International Market; INBAR: Beijing, China, 2019. [Google Scholar]
  23. Bakala, F.; Bekele, T.; Woldeamanuel, T.; Auch, E. Value Chain Analysis of Lowland Bamboo Products: The Case of Homosha District, Northwestern Ethiopia. Ind. Eng. Lett. 2016, 6, 1–15. [Google Scholar]
  24. Effah, B.; van Reenen, A.; Meincken, M. Characterisation of the Interfacial Adhesion of the Different Components in Wood–Plastic Composites with AFM. Springer Sci. Rev. 2015, 3, 97–111. [Google Scholar] [CrossRef]
  25. Torun, S.B.; Pesman, E.; Cavdar, A.D. Effect of alkali treatment on composites made from recycled polyethylene and chestnut cupula. Polym. Compos. 2019, 40, 4442–4451. [Google Scholar] [CrossRef]
  26. Sobczak, L.; Welser, R.; Brüggemann, O.; Haider, A. Polypropylene (PP)-based wood polymer composites: Performance of five commercial maleic anhydride grafted PP coupling agents. J. Thermoplast. Compos. Mater. 2014, 27, 439–463. [Google Scholar] [CrossRef]
  27. Dikobe, D.G.; Luyt, A.S. Investigation of the morphology and properties of the polypropylene/low-density polyethylene/wood powder and the maleic anhydride grafted polypropylene/low-density polyethylene/wood powder polymer blend composites. J. Compos. Mater. 2017, 51, 2045–2059. [Google Scholar] [CrossRef]
  28. Zhang, W.P.; Lu, Y.H.; Khanal, S.; Xu, S.A. Effects of compatibilizers on selected properties of hdpe composites highly filled with bamboo flour. Wood Fiber Sci. 2018, 50, 254–264. [Google Scholar] [CrossRef] [Green Version]
  29. Ghorbani, M.; Poorzahed, N.; Amininasab, S.M. Morphological, physical, and mechanical properties of silanized wood-polymer composite. J. Compos. Mater. 2020, 54, 1403–1412. [Google Scholar] [CrossRef]
  30. Xie, Y.; Hill, C.A.S.; Xiao, Z.; Militz, H.; Mai, C. Silane coupling agents used for natural fiber/polymer composites: A review. Compos. Part A Appl. Sci. Manuf. 2010, 41, 806–819. [Google Scholar] [CrossRef]
  31. Chauhan, S.; Aggarwal, P.; Karmarkar, A. The effectiveness of m-TMI-grafted-PP as a coupling agent for wood polymer composites. J. Compos. Mater. 2016, 50, 3515–3524. [Google Scholar] [CrossRef]
  32. Shavandi, A.; Ali, M.A. Graft polymerization onto wool fibre for improved functionality. Prog. Org. Coat. 2019, 130, 182–199. [Google Scholar] [CrossRef] [Green Version]
  33. Dun, M.; Fu, H.; Hao, J.; Shan, W.; Wang, W. Tailoring flexible interphases in bamboo fiber-reinforced linear low-density polyethylene composites. Compos. Part A Appl. Sci. Manuf. 2021, 150, 106606. [Google Scholar] [CrossRef]
  34. Du, L.; Li, Y.; Lee, S.; Wu, Q. Water absorption properties of heat-treated bamboo fiber and high density polyethylene composites. BioResources 2014, 9, 1189–1200. [Google Scholar] [CrossRef]
  35. Lopez, Y.M.; Paes, J.B.; Gustave, D.; Gonçalves, F.G.; Méndez, F.C.; Nantet, A.C.T. Production of wood-plastic composites using cedrela odorata sawdust waste and recycled thermoplastics mixture from post-consumer products—A sustainable approach for cleaner production in Cuba. J. Clean. Prod. 2020, 244, 118723. [Google Scholar] [CrossRef]
  36. Abhilash, R.M.; Venkatesh, G.S.; Chauhan, S.S. Development of bamboo polymer composites with improved impact resistance. Polym. Polym. Compos. 2021, 29 (Suppl. S9), S464–S474. [Google Scholar] [CrossRef]
  37. Wang, Y.; Zou, M.; Gao, K.; Guo, W.; Wang, G.; Tang, Q. Effects of surface modification on the physical, mechanical, and thermal properties of bamboo-polypropylene composites. BioResources 2020, 15, 6230–6243. [Google Scholar] [CrossRef]
  38. Echeverria, C.A.; Pahlevani, F.; Sahajwalla, V. Valorisation of discarded nonwoven polypropylene as potential matrix-phase for thermoplastic-lignocellulose hybrid material engineered for building applications. J. Clean. Prod. 2020, 258, 120730. [Google Scholar] [CrossRef]
  39. Wang, C.; Mei, J.; Zhang, L. High-added-value biomass-derived composites by chemically coupling post-consumer plastics with agricultural and forestry wastes. J. Clean. Prod. 2021, 284, 124768. [Google Scholar] [CrossRef]
  40. Bahari, S.A.; Grigsby, W.; Krause, A. Thermal stability of processed PVC/bamboo blends: Effect of compounding procedures. Eur. J. Wood Wood Prod. 2017, 75, 147–159. [Google Scholar] [CrossRef] [Green Version]
  41. Tian, J.; Cao, Z.; Qian, S.; Xia, Y.; Zhang, J.; Kong, Y.; Sheng, K.; Zhang, Y.; Wan, Y.; Takahashi, J. Improving tensile strength and impact toughness of plasticized poly(lactic acid) biocomposites by incorporating nanofibrillated cellulose. Nanotechnol. Rev. 2022, 11, 2469–2482. [Google Scholar] [CrossRef]
  42. Sheng, K.; Zhang, S.; Qian, S.; Lopez, C.A.F. High-toughness PLA/Bamboo cellulose nanowhiskers bionanocomposite strengthened with silylated ultrafine bamboo-char. Compos. Part B Eng. 2018, 165, 174–182. [Google Scholar] [CrossRef]
  43. Xu, L.; Zhao, J.; Qian, S.; Zhu, X.; Takahashi, J. Green-plasticized poly(lactic acid)/nanofibrillated cellulose biocomposites with high strength, good toughness and excellent heat resistance. Compos. Sci. Technol. 2021, 203, 108613. [Google Scholar] [CrossRef]
  44. Mousavi, S.R.; Zamani, M.H.; Estaji, S.; Tayouri, M.I.; Arjman, M.; Jafari, S.H.; Nouranian, S.; Khonakdar, H.A. Mechanical properties of bamboo fiber-reinforced polymer composites: A review of recent case studiesTitle. J. Mater. Sci. 2022, 57, 3143–3167. [Google Scholar] [CrossRef]
  45. Lorenz, D.; Erasmy, N.; Akil, Y.; Saake, B. A new method for the quantification of monosaccharides, uronic acids and oligosaccharides in partially hydrolyzed xylans by HPAEC-UV/VIS. Carbohydr. Polym. 2016, 140, 181–187. [Google Scholar] [CrossRef] [PubMed]
  46. Curtzwiler, G.W.; Schweitzer, M.; Li, Y.; Jiang, S.; Vorst, K.L. Mixed post-consumer recycled polyolefins as a property tuning material for virgin polypropylene. J. Clean. Prod. 2019, 239, 117978. [Google Scholar] [CrossRef]
  47. Coates, J. Interpretation of Infrared Spectra, A Practical Approach. Encycl. Anal. Chem. 2006, 1–23. [Google Scholar] [CrossRef]
  48. Wang, M.; Li, R.; Chen, G.; Zhou, S.; Feng, X.; Chen, Y.; He, M.; Liu, D.; Song, T.; Qi, H. Highly Stretchable, Transparent, and Conductive Wood Fabricated by in Situ Photopolymerization with Polymerizable Deep Eutectic Solvents. ACS Appl. Mater. Interfaces 2019, 11, 14313–14321. [Google Scholar] [CrossRef] [PubMed]
  49. BAuA. Product Safety Commission (AfPS) GS Specification Testing and Assessment of Polycyclic Aromatic Hydrocarbons (PAHs) in the Course of Awarding the GS Mark; Specification Pursuant to Article 21 (1) no. 3 of the Product Safety Act (ProdSG)—Manage; Federal Institute for Occupational Safety and Health: Dortmund, Germany, 2014; pp. 1–12. [Google Scholar]
  50. Wolksa, J. Safeguarding the environment—XRF analysis of heavy metals in polyethylene. Plast. Addit. Compd. 2005, 7, 36–39. [Google Scholar] [CrossRef]
  51. Fink, H.; Panne, U.; Theisen, M.; Niessner, R.; Probst, T.; Lin, X. Determination of metal additives and bromine in recycled thermoplasts from electronic waste by TXRF analysis. Fresenius. J. Anal. Chem. 2000, 368, 235–239. [Google Scholar] [CrossRef] [PubMed]
  52. Huang, S.; Fu, Q.; Yan, L.; Kasal, B. Characterization of interfacial properties between fibre and polymer matrix in composite materials—A critical review. J. Mater. Res. Technol. 2021, 13, 1441–1484. [Google Scholar] [CrossRef]
  53. Gulmine, J.V.; Janissek, P.R.; Heise, H.M.; Akcelrud, L. Polyethylene characterization by FTIR. Polym. Test. 2002, 21, 557–563. [Google Scholar] [CrossRef]
  54. Li, D.; Zhou, L.; Wang, X.; He, L.; Yang, X. Effect of crystallinity of polyethylene with different densities on breakdown strength and conductance property. Materials 2019, 12, 1746. [Google Scholar] [CrossRef] [Green Version]
  55. Prasad, A. A quantitative analysis of low density polyethylene and linear low density polyethylene blends by differential scanning calorimetery and fourier transform infrared spectroscopy methods. Polym. Eng. Sci. 1998, 38, 1716–1728. [Google Scholar] [CrossRef]
  56. Luis, F.; Moncayo, G. Lignocellulosic Polymer Composites; Scrivener Publishing and John Wiley & Sons, Inc.: Hoboken, NJ, USA, 2015. [Google Scholar]
  57. Alzerreca, M.; Paris, M.; Boyron, O.; Orditz, D.; Louarn, G.; Correc, O. Mechanical properties and molecular structures of virgin and recycled HDPE polymers used in gravity sewer systems. Polym. Test. 2015, 46, 1–8. [Google Scholar] [CrossRef]
  58. Schweighuber, A.; Himmelsbach, M.; Buchberger, W.; Klampfl, C.W. Analysis of polycyclic aromatic hydrocarbons migrating from polystyrene/divinylbenzene-based food contact materials. Mon. Fur Chem. 2019, 150, 901–906. [Google Scholar] [CrossRef] [Green Version]
  59. Khan, M.Z.R.; Srivastava, S.K.; Gupta, M.K. A state-of-the-art review on particulate wood polymer composites: Processing, properties and applications. Polym. Test. 2020, 89, 106721. [Google Scholar] [CrossRef]
  60. Horta, J.F.; Simões, F.J.; Mateus, A. Study of Wood-Plastic Composites with Reused High Density Polyethylene and Wood Sawdust. Procedia Manuf. 2016, 12, 221–229, 2017. [Google Scholar] [CrossRef]
  61. Haddou, G.; Dandurand, J.; Dantras, E.; Maiduc, H.; Thai, H.; Giang, N.V.; Trung, T.H.; Ponteins, P.; Lacabbane, C. Mechanical and thermal behaviour of bamboo flour-reinforced XLPE composites. J. Therm. Anal. Calorim. 2016, 124, 701–708. [Google Scholar] [CrossRef] [Green Version]
  62. Jose, A.S.; Athijayamani, A.; Jani, S.P. A review on the mechanical properties of bio waste particulate reinforced polymer composites. Mater. Today Proc. 2020, 37 Pt 2, 1757–1760. [Google Scholar] [CrossRef]
  63. Zhang, W.; Yao, X.; Khanal, S.; Xu, S. A novel surface treatment for bamboo flour and its effect on the dimensional stability and mechanical properties of high density polyethylene/bamboo flour composites. Constr. Build. Mater. 2018, 186, 1220–1227. [Google Scholar] [CrossRef]
Figure 1. Experimental framework of the study.
Fibers 10 00085 g001
Figure 2. BP preparation steps: (A) harvesting; (B) chopping and sun dying; (C) grinding; (D) sieving to targeted particle size; (E) surface treatment; (F) vacuum oven drying.
Fibers 10 00085 g002
Figure 3. Compounding and consolidation process: (a) BP; (b) recycled LLDPE, MDPE, and HDPE; (c) compounding process; (d) WPC granulates; (e) reduced size of WPC granulates; (f) compression molding; (g) WPC board.
Fibers 10 00085 g003
Figure 4. (A) Samples for both FS and UIS; (B) FS test; (C) UIS test; (D) TS sample; (E) TS test.
Fibers 10 00085 g004
Figure 5. FTIR characterization of post-consumer PE types (LLDPE, MDPE, and HDPE).
Fibers 10 00085 g005aFibers 10 00085 g005b
Figure 6. DSC graph of endothermic and exothermic heating cycle.
Fibers 10 00085 g006
Table 1. Experimental design of WPC formulation.
rPE PlasticsPE (%)BP (%)Sample CodeCompounding ConditionConsolidation Conditions
Temperature (°C)Speed (r/m)Time (min)Temperature (°C)Pressure (torr)Total time (min.)
LLD70% (HC)30% (U)HCLLD-BPU150551517010013
70% (HC)30% (T)HCLLD-BPT150551517010013
30% (LC)70% (U)LCLLD-BPU150551517010013
30% (LC)70% (T)LCLLD-BPT150551517010013
MD70% (HC)30% (U)HCMD-BPU160551517010013
70% (HC)30% (T)HCMD-BPT160551517010013
30% (LC)70% (U)LCMD-BPU160551517010013
30% (LC)70% (T)LMD-BPT160551517010013
HD70% (HC)30% (U)HCHD-BPT170551518010013
70% (HC)30% (T)HCHD-BPU170551518010013
30% (LC)70% (U)LCHD-BPU170551518010013
30% (LC)70% (T)LCHD-BPT170551518010013
EM70% (HC)30% (U)HCEM-BPU165551517510013
70% (HC)30% (T)HCEM-BPU165551517510013
30% (LC)70% (U)LCEM-BPU165551517510013
30% (LC)70% (T)LCEM-BPU165551517510013
Table 2. Results of chemical characterization of EHB subjected to different ranges of alkaline treatment.
Sugar Analysis (%)Treatment Condition
UntreatedTreated (2%)Treated (3%)Treated (5%)Treated (10%)
Xylose16.83 (1.73)15.47 (1.03)13.31 (1.59)12.81 (1.08)12.05 (1.43)
Glucose45.86 (2.45)50.30 (2.85)52.61 (2.34)53.64 (1.96)57.16 (1.83)
Mannose0.48 (0.025)0.48 (0.02)0.34 (0.05)0.57 (0.04)0.62 (0.03)
Galactose0.46 (0.035)0.38 (0.05)0.38 (0.09)0.32 (0.05)0.39 (0.09)
Arabinose0.91 (0.687)1.28 (0.87)1.10 (0.03)1.12 (0.018)1.16 (0.78)
Rhamnose0.09 (0.058)0.09 (0.002)0.05 (0.001)0.03 (0.013)0.07 (0.07)
Total sugar64.63 (3.946)70.00 (3.59)72.23 (3.57)72.04 (2.86)73.98 (3.08)
Hydrolysis residue31.0 (2.05)28.7 (2.05)26.7 (2.28)26.6 (1.58)25.1 (1.68)
Acid soluble lignin1.08 (0.293)0.89 (0.056)0.94 (0.058)0.81 (0.06)0.84 (0.07)
Cellulose45.86 (3.28)50.30 (1.35)52.61 (1.51)53.64 (3.77)57.16 (2.88)
Hemicellulose18.77 (1.23)17.7 (1.66)15.18 (1.85)14.55 (2.06)14.29 (1.23)
Lignin32.08 (2.35)29.59 (2.56)27.64 (1.24)27.14 (1.16)25.94 (6.54)
Table 3. Main absorptions of PE in the IR region and their assignment. Reprinted/adapted with permission from Ref. [47] ©2006, John Wiley and Sons and Ref. [53] ©2002, Elsevier.
Band Group (cm−1)Assigned Molecular VibrationsIntensity
2970–2950/2880–2860Methyl C-H asymmetric/symmetric stretching.Weak
1470–1430/1380–1370Methyl C-H asymmetric/symmetric bendingWeak
2935–2915/2865–2845Methylene C-H asymmetric/symmetric stretchingStrong
1485–1445Methylene C-H bending (rocking) deformationStrong
730–710Methylene (CH2)n rocking n ≥ 3Medium to strong
2900–2880Methyne C-H stretchingStrong
1350–1330Methyne C-H bending deformationMedium
1176Wagging deformationVery weak
1306Twisting weak deformationWeak
1377Umbrella mode of vibrations Medium
Table 4. Crystallization and melting process values of recycled polyethylene.
Recycled PETc (◦C)Tm (◦C)ΔHc (J/g)ΔHm (J/g)Xc (%)
rLLDPE10712593.282109.3537.32
rMDPE114130149.07142.0548.44
rHDPE115134214.02205.7370.02
Table 5. Results of residual metal additives in recycled PE plastics (LLDPE, MDPE, and HDPE).
ElementrLLDPErMDPErHDPEElementrLLDPErMDPErHDPE
Cr7.3 (0.8)18.6 (0.72)22.7 (0.8)Se <LOD1.6 (0.18)<LOD
Ba1227.5 (4.5)133.9 (2.17)226 (9.2)As<LOD1.1 (0.10)1.1 (0.3)
Ti296.9 (1.3)26.9 (4.6)806 (9.3)Hg2.3 (0.3)3.8 (4.5)1.8 (0.4)
Cl736 (8.4)36.4 (2.91)304.9 (7.87)Zn82.4 (4.5)3.2 (0.10)281.4 (3.5)
Sb87.4 (0.4)<LOD9.4 (0.4)Cu5.1 (0.7)4.3 (8.4)14.9 (0.8)
Sn12.2 (0.5)12.1 (0.33)7.5 (0.1)Ni18.4 (0.5)11.1 (0.37)16.4 (0.4)
Cd4.4 (0.3)3.8 (0.26)6.3 (0.3)Co9.7 (0.9)5.2 (0.62)5.0 (0.7)
Sr23 (0.2)<LOD38.6 (0.1)Fe627 (2.4)137.1 (5.8)316.9 (2.4)
Bi<LOD<LODLODMon51.5 (2.3)2.4 (0.79)19.1 (1.2)
Pd2.3 (0.1)1.3 (0.012)177.6 (0.2)V7.9 (0.7)3.7 (0.39)15.5 (0.6)
Br0.3 (2.6)LOD0.6 (0.1)LOD—limit of detection
Table 6. PAHs in recycled LLD PE, MDPE, and HDPE.
PAHsLimitrLLDPErMDPErHDPE
Naphthalene100.20738 (0.2196)0.25113 (0.12015)0.03270 (0.0269)
Acenaphthylene 0.00770 (0.0001)0.01413 (0.00906)0.00000 (0.0000)
Acenaphthene 0.00887 (0.0056)0.03099 (0.01002)0.01238 (0.0001)
Fluorene 0.01551 (0.0155)0.02957 (0.00169)0.00424 (0.0024)
Phenanthrene500.11248 (0.0822)0.23434 (0.01553)0.10209 (0.0168)
Anthracene0.03625 (0.0012)0.05968 (0.04590)0.02027 (0.0011)
Fluoranthene0.11139 (0.0585)0.17757 (0.03708)0.13680 (0.0206)
Pyrene0.16325 (0.0732)0.29692 (0.08331)0.12201 (0.0178)
Benz(a)anthracene10.02514 (0.0091)0.16928 (0.18993)0.02079 (0.0035)
Chrysene10.08101 (0.0067)0.21962 (0.17629)0.07487 (0.0012)
Benzo(b)fluoranthene10.03212 (0.0177)0.25188 (0.28633)0.01712 (0.0029)
Benzo(k)fluoranthene10.02028 (0.0112)0.26010 (0.28621)0.0134 (0.00200)
Benzo(a)pyrene10.01943 (0.0039)0.35439 (0.4350)0.01483 (0.0021)
Indeno(123cd)perylene10.02369 (0.0053)0.41596 (0.49378)0.02464 (0.0020)
Dibenz(a.h)anthracene10.02250 (0.0076)0.44742 (0.49331)0.01198 (0.0008)
Benzo(ghi)perylene10.02735 (0.0039)0.33573 (0.38826)0.01836 (0.0024)
Total500.88226 (0.25390)3.47403 (1.04085)0.60994 (0.0424)
Table 7. Mechanical properties of the virgin and recycled PE (LLD, MD, HD).
PE TypesTS (MPa)TM (MPa)FS (MPa)FM (MPa)UIS (KJ/m2)
rLLD7.65 (1.73)123.56 (65)11.36 (0.41)230.57 (88)15.28 (1.43)
rMD14.72 (1.38)430.75 (57)26.58 (0.84)628.94 (66)6.27 (1.58)
rHD20.65 (1.58)997.85 (58)36.67 (0.76)780.58 (76)5.38 (0.85)
rEM13.68 (0.52)650.67 (68)22.45 (1.05)530.87 (87)9.58 (3.05)
vLLD12.05 (1.95)190.60 (43)13.05 (1.35)270.23 (38)18.06 (0.56)
vMD18.72 (1.65)675.53 (67)31.58 (1.87)773.37 (65)12.27 (3.29)
vHD23.14 (0.68)1160 (134)42.54 (0.91)980.53 (53)7.05 (2.35)
vEM14.65 (0.85)665.54 (76)25.18 (1.23)674.86 (50)13.46 (0.87)
Table 8. Mechanical properties of WPC formulated from recycled PE plastics and BP.
rPESample IdTS (MPa)TM (MPa)FS (MPa)FM (MPa)UIS (KJ/m2)
LLDHCLLD-BPU6.52 (0.2)766.60 (48)14.65 (1.52)994.1 (23.5)10.97 (1.3)
HCLLD-BPT6.73 (0.2)809.85 (52)14.82 (1.18)995.5 (17.21)11.21 (2.1)
LCLLD-BPU3.84 (0.1)1084.38 (63)10.08 (0.41)1564.5 (25.64)3.01 (2.1)
LCLLD-BPT4.21 (0.1)1182.26 (77)11.658 (0.59)1955.3 (63.5)3.95 (0.22)
MDHCMD-BPU13.40 (0.5)1821.25 (51)27.316 (0.55)2063.4 (11.5)6.49 (0.79)
HCMD-BPT13.51 (0.2)1884.45 (50)30.1 (1.86)2367.2 (14.78)6.86 (0.99)
LCMD-BPU6.27 (0.1)1809.90 (2.8)15.93 (2.12)2645.8 (57.56)2.58 (0.42)
LMD-BPT7.13 (0.3)1968.84 (10)16.23 (0.162)2704.8 (104.14)3.41 (0.33)
HDHCHD-BPU14.57 (0.5)1888.46 (50)32.62 (0.71)2534.6 (68.67)5.59 (1.9)
HCHD-BPT17.47 (0.1)2287.87 (30)33.54 (2.32)3019.5 (165.32)6.35 (0.9)
LCHD-BPU8.375 (0.2)2505.57 (22)18.308 (2.12)3033.2 (173.52)2.34 (0.44)
LCHD-BPT10.15 (0.1)2966.90 (55)22.58 (3.15)3728.5 (219.8)2.89 (0.47)
EMHCEM-BPU11.03 (0.2)1478.85 (47)23.37 (0.36)1737.3 (91.69)6.68 (0.27)
HCEM-BPU11.23 (0.2)1506.84 (27)24.63 (0.85)1901.8 (117.59)8.24 (2.14)
LCEM-BPU6.63 (0.3)1999.36 (37)14.45 (1.48)2428.9 (272.86)2.38 (0.25)
LCEM-BPU7.45 (0.4)2180.88 (90)17.23 (1.44)2778.2 (211.44)3.60 (0.36)
Publisher’s Note: MDPI stays neutral with regard to jurisdictional claims in published maps and institutional affiliations.

