
Interlaminar Shear Properties of Bamboo Composite for Structural Applications


1
College of Engineering, IT & Environment, Charles Darwin University, Darwin, NT 0810, Australia
2
School of Architecture, Karlsruhe Institute of Technology, 76131 Karlsruhe, Germany
3
Centre for Advanced Materials Processing and Manufacturing (AMPAM), The University of Queensland, St. Lucia, QLD 4072, Australia
4
Centre for Infrastructure Performance and Reliability, The University of Newcastle, Callaghan, NSW 2308, Australia
*
Authors to whom correspondence should be addressed.
Fibers 2022, 10(7), 59; https://doi.org/10.3390/fib10070059
Submission received: 9 April 2022
/
Revised: 28 May 2022
/
Accepted: 17 June 2022
/
Published: 12 July 2022
(This article belongs to the Collection Feature Papers in Fibers)
Abstract
:Interlaminar shear strength in bamboo composite (BC) is mainly provided by epoxy resin as the matrix in BC. This may greatly change due to humidity. This study aims at evaluating the shear strength of BC by testing and developing probabilistic relationships. The interlaminar shear strength of bamboo composite (BC) in different moisture conditions was tested according to ASTM D2344. The results show that the maximum shear stress does not generally occur at the centroid of samples, which could be associated with imperfections in BC layers. An extreme value theory-based model is suggested to evaluate the probability of shear failure in BC samples. The shear capacity decreased from 20.4 MPa to 14 MPa as the humidity increased from 60% to 90%. A summary of findings is as follows: It was found that under transient moisture conditions, local failure is likely to happen before the first significant crack occurs. Local failure is suggested to be considered in the design for serviceability. Stress drop caused by the local failure could exceed 10% of total shear strength and, therefore, should be regarded as a serviceability design. The probabilistic model developed in this study could be used for developing structural design safety factors.
1. Introduction
Plant fibre composites as sustainable construction materials have received significant attention in recent years [1,2]. The application of plant fibre composites has several advantages in the construction industry, and therefore attention has been turned toward these materials as substitutes for conventional construction materials [3,4,5].
Natural fibre composites generally have lower embodied carbon than conventional construction materials. For instance, in the case of bamboo composites, embodied carbon is negative [6]. Natural fibres generally cost less than synthetic fibres [3,7,8] and are very low in production energy [9,10]. Bamboo fibres have a tensile strength of 210–233 MPa and an elastic modulus of 11–30 GPa [11]. A comprehensive collection of natural fibre properties can be found in [12]. In addition to the technical advantages of natural fibre composites, increasing demand for these materials could help global equity. Many natural fibres, such as bamboo, jute, sisal, etc., are mainly planted in developing countries [13,14,15]. The average annual gross income per capita in these countries is about AUD 1000 [15]. Expanding the market for natural fibres could potentially help global equity by generating sustainable jobs in developing countries.
Despite the developments in construction applications of natural fibre composites, less than 5% of these composites are used for structural purposes and are primarily used in the automation industry [11]. Some significant improvements in current natural fibre composites seem necessary before the construction sector might benefit from their advantages.
Using bamboo fibres in a polymer matrix is not new and was tried in 1989 [16] and 1992 [17]. A reasonable flexural strength of more than 150 MPa was attained in those studies. Most of the earlier studies were focused on using chemical processing methods, which would damage the inherent mechanical properties of bamboo fibres. In the patented production method used by ETH, no chemical treatment is used, and epoxy consumption is considerably lower. In contrast, the mechanical properties of bamboo fibre and epoxy composite have been improved [18]. Experiments showed that bamboo composite has average tensile and compression strengths of 300 MPa and 180 MPa. The flexural modulus of elasticity of bamboo composite is about 30 GPa [18]; as such, and considering the density of bamboo composite, which is approximately 1.19 g/cm3, structural efficiency (see [19]) of bamboo composite is more than steel, concrete, and most common structural timbers. This suggests that bamboo composite could be used as load bearing member in construction. In particular, the high tensile and compressive capacity of bamboo composite could be effectively employed in truss structures.
The main challenge in using natural fibre composites as structural elements such beams, columns, and bracings is their long-term behaviour under environmental conditions [20,21]. Strength failure criteria of natural fibre composites are not entirely understood, and therefore best practices for modelling failure criteria in these materials are still being investigated [22]. In some recent studies, analytical constitutive models have been developed to estimate the hygrothermal ageing process of natural fibres [23]. Results in [24] showed that although the stiffness of cellular boards and beams made of hemp and flax fibres was comparable to that of E-glass composite, the moisture resistance was much lower than that of E-glass. A reduction of more than 50% in toughness was reported in roof tiles made of sisal and eucalyptus files in a cement matrix after four months of exposure to outside weather in Pirassununga, Brazil, during the summer [25]. Both natural fibres and natural polymer matrices are influenced by weathering effects [7,26], which makes choosing natural polymer matrices difficult, especially when they are more expensive than petroleum-based resins [27]. The mechanism of water diffusion in composite materials and its effect on the material strength have been explored in different studies [28,29].
While use of natural composites in the construction industry is gaining more momentum, there is still a significant gap in technical knowledge on the long-term behaviour of these materials. Further, shear capacity as the key weak point of natural materials and environmental effects on shear capacity of natural fibre composites should be further investigated prior to real life applications. This study focuses on the effects of weathering on the shear properties of BC. There are some reasons why shear strength is the focus of this study. Firstly, shear capacity dominates the design of bolted connections in BC. Bolted connections are the typical type of connection method for BC members. Secondly, the results of previous studies show that the shear capacity of BC is relatively more sensitive to the quality of production and weathering effects. For example, epoxy might not penetrate completely between fibres, resulting in weak areas (i.e., voids) from which cracks initiate under shear stress and cause delamination in samples. Finally, the tensile strength ratio to shear strength in BC is relatively higher than in common timber or Mass Engineered Timbers (MET), making BC relatively more susceptible to shear failure such as shear-out mode of failure in structural connections.
Shear strength and tensile strength in fibre composites are mainly influenced by matrix (resin) shear capacity, fibre–matrix interfacial strength capacity, and fibre tensile capacity [30]. The matrix in the bamboo composite studied here was a two-component epoxy system with a bisphenol A-based resin and an amine-based hardener. Production and material details of the studied bamboo composite are explained in [18].
The density and size of imperfections and flaws may reduce the shear strength of specimens. The shear capacity reduction depends on the size and form of defects and is well discussed in fracture mechanics [31,32,33]. In the following sections, the shear capacity of BC in ambient conditions and under different humidity conditions is studied. This may help develop structural design criteria for BC members in the future. This understanding may help in future improvements in the polymer resin, fibre–matrix interfacial, or fibre strength capacity. In the following sections, factors influencing BC shear properties are discussed. Experimental tests and probabilistic analysis are referred to support the arguments.
2. Experimental Program
2.1. Material
The bamboo species used in this study was a 5-year-old Phyllostachys edulis, known as Moso bamboo and sourced from Indonesia. Approximately 1 mm bamboo veneers were made and impregnated with a two-component epoxy with a bisphenol A-based resin and an amine-based hardener. Bamboo veneers were bonded through a hop press process with varying pressure and temperature. Hot pressing pressure was between 15 MPa and 25 MPa, while the temperature was 80 °C to 140 °C. The final composite was cured for 12 h at a constant temperature of 40 °C. Details of the production process can be found in [18]. Bamboo fibre tensile strength is more than 300 MPa [34], which is close to the tensile strength of bamboo composite used in this study. Under compression, the strength of 180 MPa was measured, while the shear strength was measured at 20.4 MPa in ambient conditions.
2.2. Testing BC Shear Strength in Lab Condition
The shear strength of BC in lab conditions was evaluated in this section. Shear capacity was estimated by employing the 3-point loading method ASTM D2344. Tests were conducted in a Shimadzu AG-IC 100 kN machine. A sample result is shown in Figure 1. Tests were done at 20 °C (T = 20 °C) and 60% humidity (H = 60%). A Komeg KMH-150 environmental chamber was used for weathering the samples. Fibres were unidirectional and aligned in the specimen’s longer direction, as shown in Figure 1. Specimens of the size of 50 mm × 15 mm by 8 mm were exposed to this condition for 21 days. These specimens are called S-20-60 in this paper. In total, thirty S-20-60 specimens were tested. Given the small size of the specimens, it was assumed that they were in equilibrium humidity condition at the test time. Figure 1 shows a shear specimen during the test. To ensure enough interfacial strength between bamboo fibres and the matrix, the length of fibres in a composite should be more than a threshold commonly termed critical fibre length [35,36]. For most fibres and matrices, a fibre length of 3 mm is well beyond the critical fibre length [37,38]. Fibres used for BC were well above 3 mm. This suggests that interfacial strength between fibre and matrix was greater than fibre strength, and thus the whole fibre strength was utilised under tension. Details of BC processing are described in [18,39].
Force and deflection for all tested samples were recorded, and diagrams similar to Figure 2 were attained.
To study the effect of moisture on the local failure, samples similar to the set tested in lab conditions of the size of 50 mm × 15 mm × 8 mm were exposed to 40%, 60%, and 90% humidity for 3, 7, and 21 days before conducting three-point tests on them according to ASTM D2344. Five specimens were tested in every combination of humidity level and exposure time.
3. Results and Discussion
A microscopic photograph of the BC cross section is shown in Figure 3.The dark brown parts in the figure show bamboo fibres, which are surrounded by the light brown resin matrix. Failures in BC could be associated with the morphology shown in Figure 3, which will be discussed in the next paragraphs.
Figure 2 shows an example of force–deflection diagrams in lab conditions. All force–deflection graphs show a trend similar to that in Figure 2: The force–deflection curve has an almost linear behaviour before it reaches the diagram’s climax, where the first drop/kink happens. This behaviour repeats a few times until the end of the tests. In all graphs, the maximum force is associated with the first peak. After the first peak, the force at the subsequent peaks is less than or equal to the force at the first peak. After each drop, some strength is recovered until the next drop happens. Each drop in the graph could be associated with a failure in the material caused by a local defect. Defects cause stress concentration and initiate the shear crack/failure.
Minor kinks could be associated with minor failures that do not significantly influence the stress field and are not discussed in this section. Since fibres are oriented unidirectionally and along the lengths of samples, fibres do not contribute to shear resistance considerably, and shear stress is generally carried by the epoxy matrix [30]. Therefore, a shear crack happens when the shear force reaches the matrix shear capacity. If a flaw exists in the matrix, stress concentrates around the flaw, and the matrix can fail under a lower force than it would if there was no flaw. The theory of stress concentration in the neighbourhood of a defect is well discussed in fracture mechanics [30,33]. A flaw in a BC member could be where resin has not covered (wetted) the bamboo fibres. This is the basis for developing a probabilistic framework for evaluating shear strength, presented in the next section.
3.1. Developing a Probabilistic Formulation for Shear Strength of BC
This section aims to develop a model for predicting the shear strength of BC with varying sizes. Microscopic mechanisms are not considered here; instead, evaluating the engineering properties of the material is intended.
Force–deflection curves of shear specimens in lab conditions suggested that flaws and imperfections in BC significantly dominated the shear capacity of samples. Given that specimens were isotropic along the fibres’ directions, shear would have had a parabolic distribution over the depth of section based on classic strength of materials equations. Therefore, for such samples, the first shear crack would have initiated at the mid-depth of the specimen. However, in most of the samples, the crack did not start at the middle of the samples’ depths. The fact that the first shear crack did not usually occur at the mid-depth suggests that significant flaws existed in the specimens that caused shear stress concentration around the flaws. Thus, cracks initiated at positions other than mid-depth. These flaws could not have been uniformly distributed, otherwise the cracks would have generally initiated at the mid-depths of samples.
The diagram in Figure 4A shows the relative distance of the first crack relative to the centroid in the 30 tested shear specimens. Points in Figure 4B show the relationship between the position of cracks and stress concentration. To obtain points in Figure 4B, it was assumed that the material was elastic, and deformations were small between two events of cracking (two kinks in the diagrams). These assumptions were reasonable based on BC’s tensile and compression tests. Additionally, as Figure 2 shows, the force–deflection chart between the two significant kinks was almost linear, suggesting that the assumptions mentioned above could be employed. Based on these assumptions, Equation (1) was used, and data points were obtained. Figure 4B shows the relation between the position of cracks relative to the centroid and stress concentration at the crack, given that linear elastic assumptions are valid. This is explained in more detail as follows:
If maximum stress failure theory [30] is considered valid for specimens, then shear failure occurs when:
in which:
- : Distance from centroid
- : Effective shear stress at
- : Stress concentration factor
- : Shear stress where crack happens
- : Ultimate shear strength when no significant flaw exists
Stress concentration was calculated based on Equation (1). As this diagram shows, stress concentration increased with distance from the centroid. This suggests that the size of imperfections and flaws increased with the distance from the centroid.
The criterion of was considered in this regard, in which is specimen depth as in Figure 1. Six samples out of 30 tested specimens met this proximity criterion. Average shear strength and COV in these samples were 20.4 MPa and 15.1%, respectively.
was calculated based on the previously mentioned linear elastic assumptions using Equation (3):
Regression analysis showed that the standard deviation in the linear regression shown in Figure 4B was 0.135. Therefore could be considered a normal random variable as follows:
in which .
Failure at happens when Equation (1) is satisfied at , and failure in a sample happens when the maximum of reaches . Thus, the load capacity of a sample can be considered as an extreme value problem:
in which is the normal cumulative density function.
As Equation (4) suggests, the probability distribution for effective shear stress changes by ; thus, is not an iid (independent and identically distributed) random variable, and therefore the cumulative density function (CDF) of does not belong to the domain of attraction of any extreme types. Therefore, herein, failure probability of a sample is estimated numerically. Equation (6) shows the formulation for calculating the failure probability of a sample under load . A Poisson probability distribution is considered for the number of cracks. Thus, the term is associated with the existence of at least one crack in the volume , and is associated with no crack in . is assumed to be constant over the section.
in which
- : Expected number of flaws in the unit of volume
- : Width of sample
- : Height (depth) of sample
Apparent shear strength then can be defined as:
in which
- : Expected failure load for a sample.
- : Apparent shear strength in a sample
The only unknown variable in Equation (6) is . To estimate , data points were split into two groups. In the first group, sample height was between 6.5 mm and 7.5 mm, and in the second group, sample height was between 6.5 mm and 8.5 mm. was estimated at 8 × 10⁻⁶ for the first group, as shown in Figure 5. Then, using , the expected value of was obtained from Equation (6) and compared with the mean value of obtained from experimental data points in the second group. The difference between the expected value of from Equation (6) and the value of from data points in the second group was 5.4%. This suggests that could be a good estimation for the rate of flaws in BC. Given , there was an effective flaw in every 11.36 cm3 in the average volume of BC.
Equation (6) suggests that the size of BC members would influence their shear capacity. This is illustrated in Figure 6. This figure presents predictions of the probabilistic model for samples with thicknesses between 5 mm and 10 mm and widths between 10 mm and 15.3 mm based on the test results. Figure 6 shows that expected varies by sample thickness (h) and width (b). Dependence of apparent strength on member size should be considered in structural design with BC. Moreover, Figure 6 shows that apparent strength is higher for thinner elements.
Experimental tests showed that more shear cracks followed the first crack in almost all shear samples before the samples failed in a bending mechanism.
3.2. Effect of Moisture on Interlaminar Shear Properties of BC
It was shown experimentally [40,41,42,43] and via molecular dynamic simulation [44,45] that water molecules affect the mechanical properties of natural fibres by the breakage of hydrogen bonds in cellulose molecules. Crystalline cellulose is the main load-bearing component of natural fibres [46,47]. As discussed in [44], some regions of cellulose chains could be amorphous, in which water molecules could rearrange the structure of amorphous cellulose and change the mechanical properties of the whole cellulose chain [44,48]. Hemicellulose and lignin have more sorption sites than does crystalline cellulose and could account for more absorbed moisture [45]. Hemicellulose and lignin surround cellulose chains [49]. Thus, the BC matrix is expected to be highly influenced by the sorption properties of hemicellulose and lignin, although lignin and hemicellulose are reduced in the BC production process. The moisture-dependent behaviour of the BC matrix (see Figure 7) suggests that lignin and hemicellulose, which host multiple absorption sites, could considerably influence the matrix moisture properties.
Shear tests on BC samples with different moisture contents and in equilibrium conditions showed that moisture reduced the shear capacity of BC. The change in shear capacity with humidity is shown in Figure 7. This figure shows the shear strength of samples due to 40%, 60%, and 90% humidity for 21 exposure days. Considering the sample size, which was 50 mm × 15 mm × 8 mm, it was assumed that after 21 days of exposure, the samples were in moisture equilibrium conditions with the environmental chambers. Five specimens were tested at each humidity level, and shear tests were carried out according to ASTM D2344. The coefficient of variation of shear capacity data points increased with moisture (Figure 7). This could be attributed to the activation of more imperfect sites by moisture, increasing the randomness of shear failure in samples.
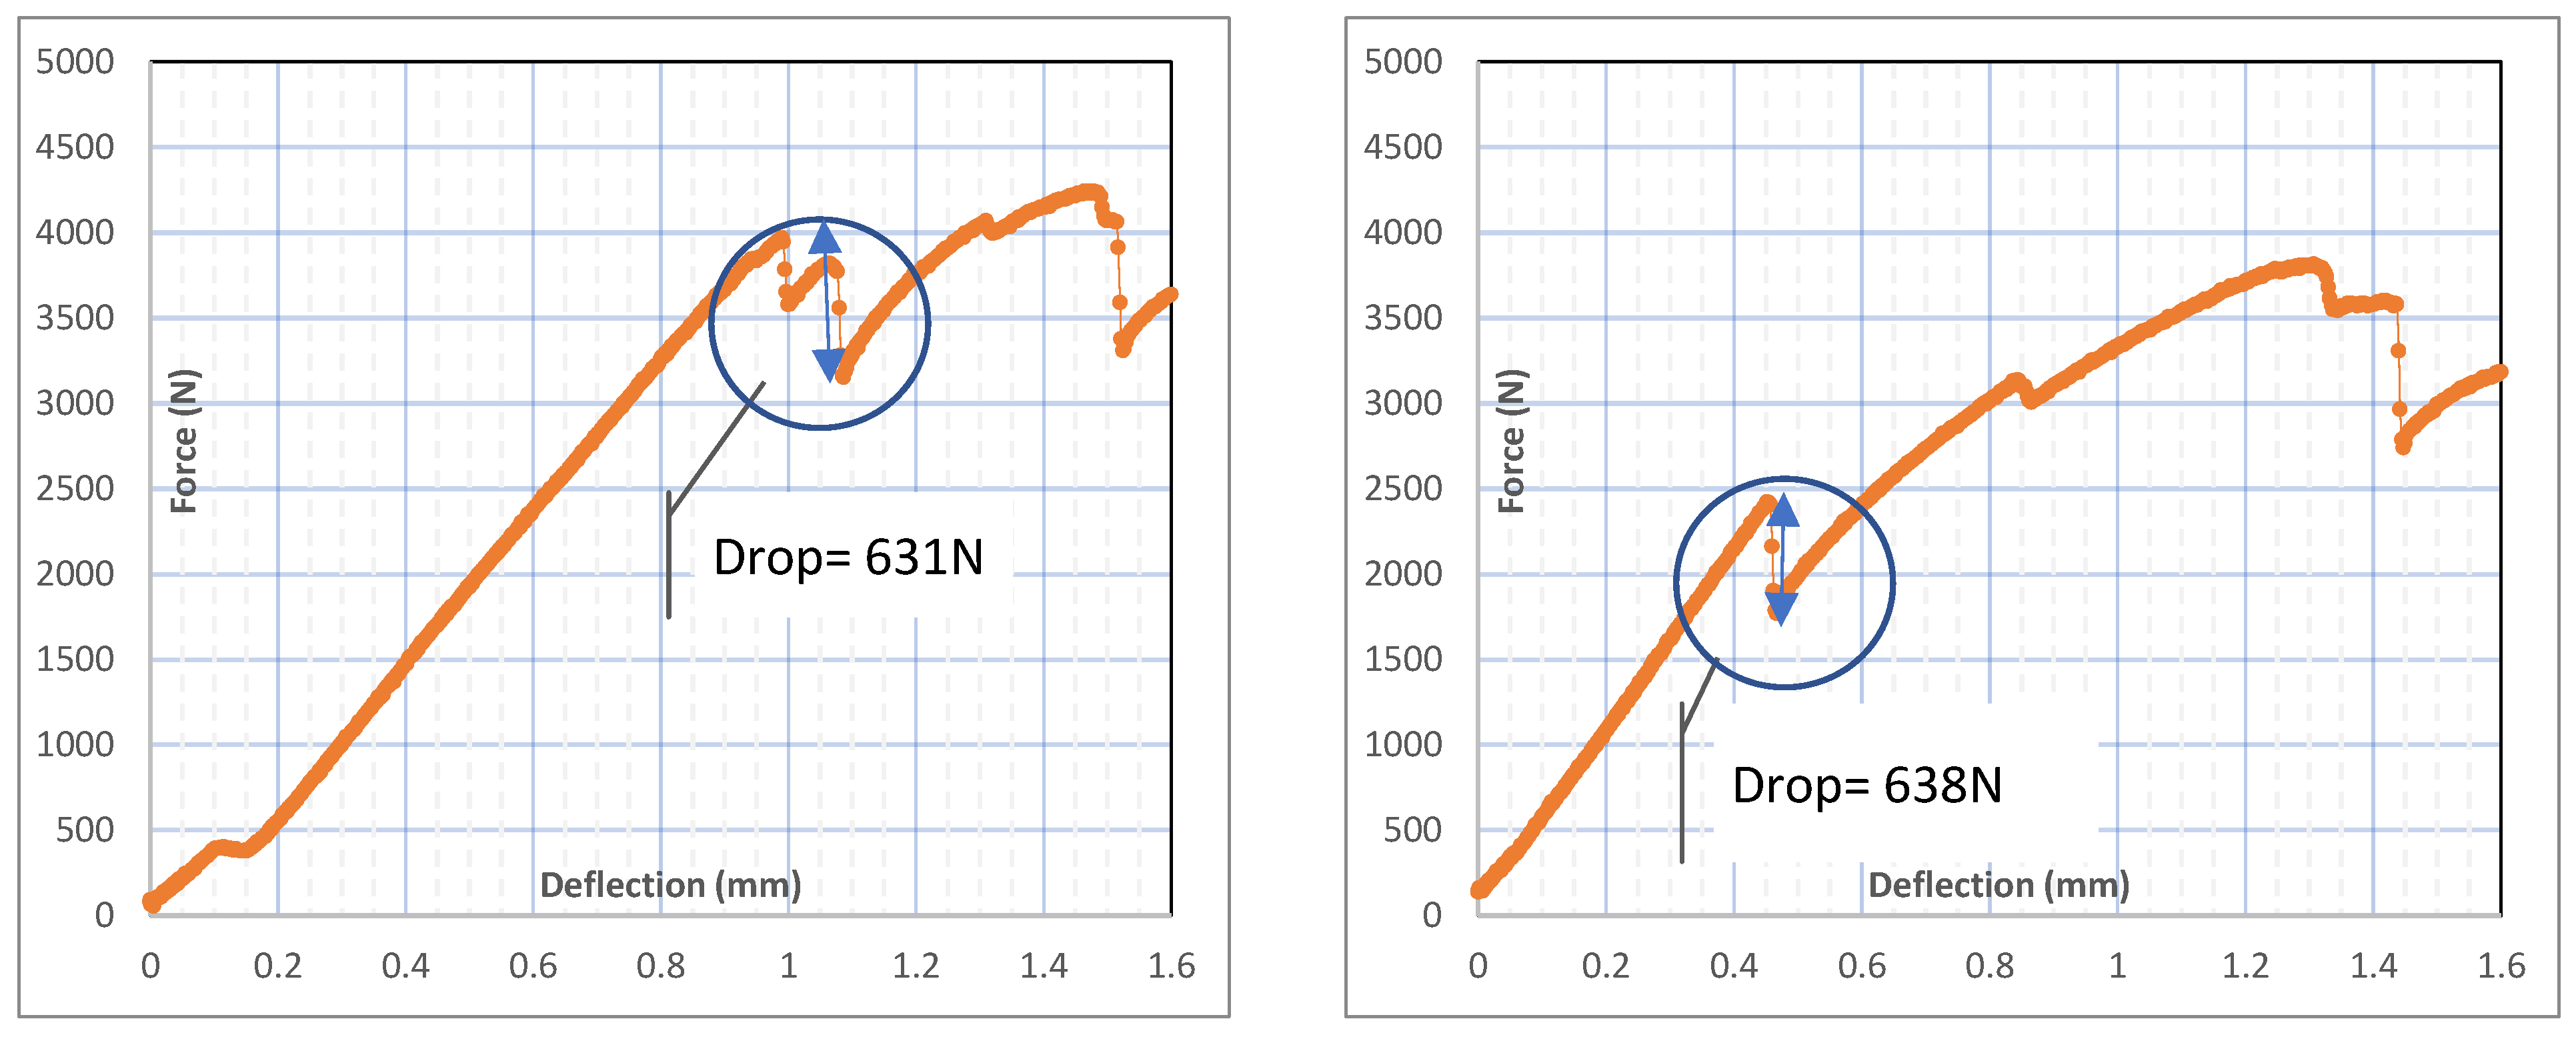
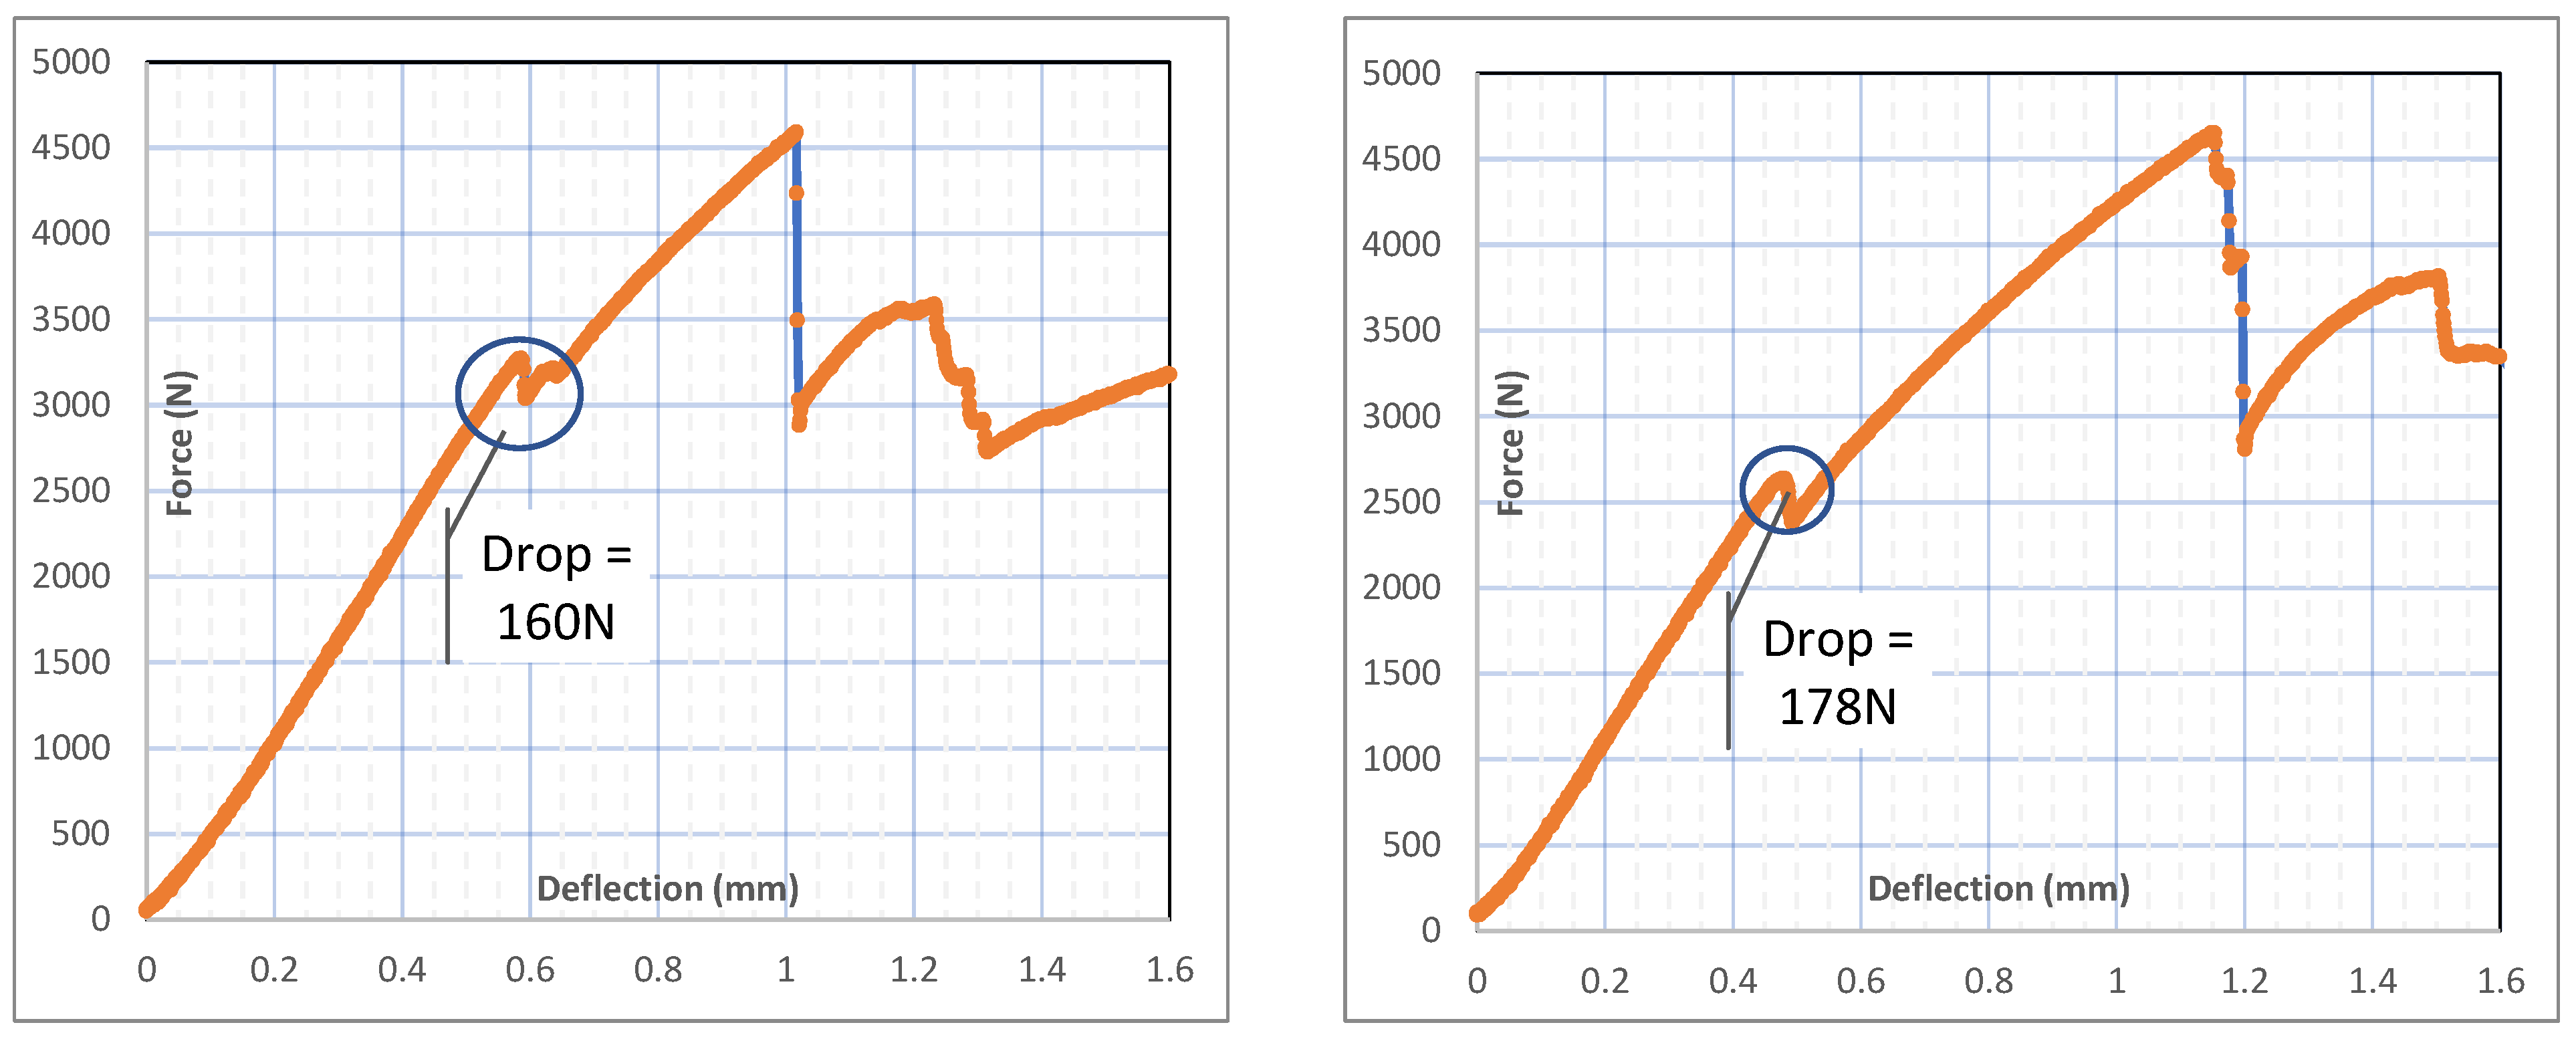
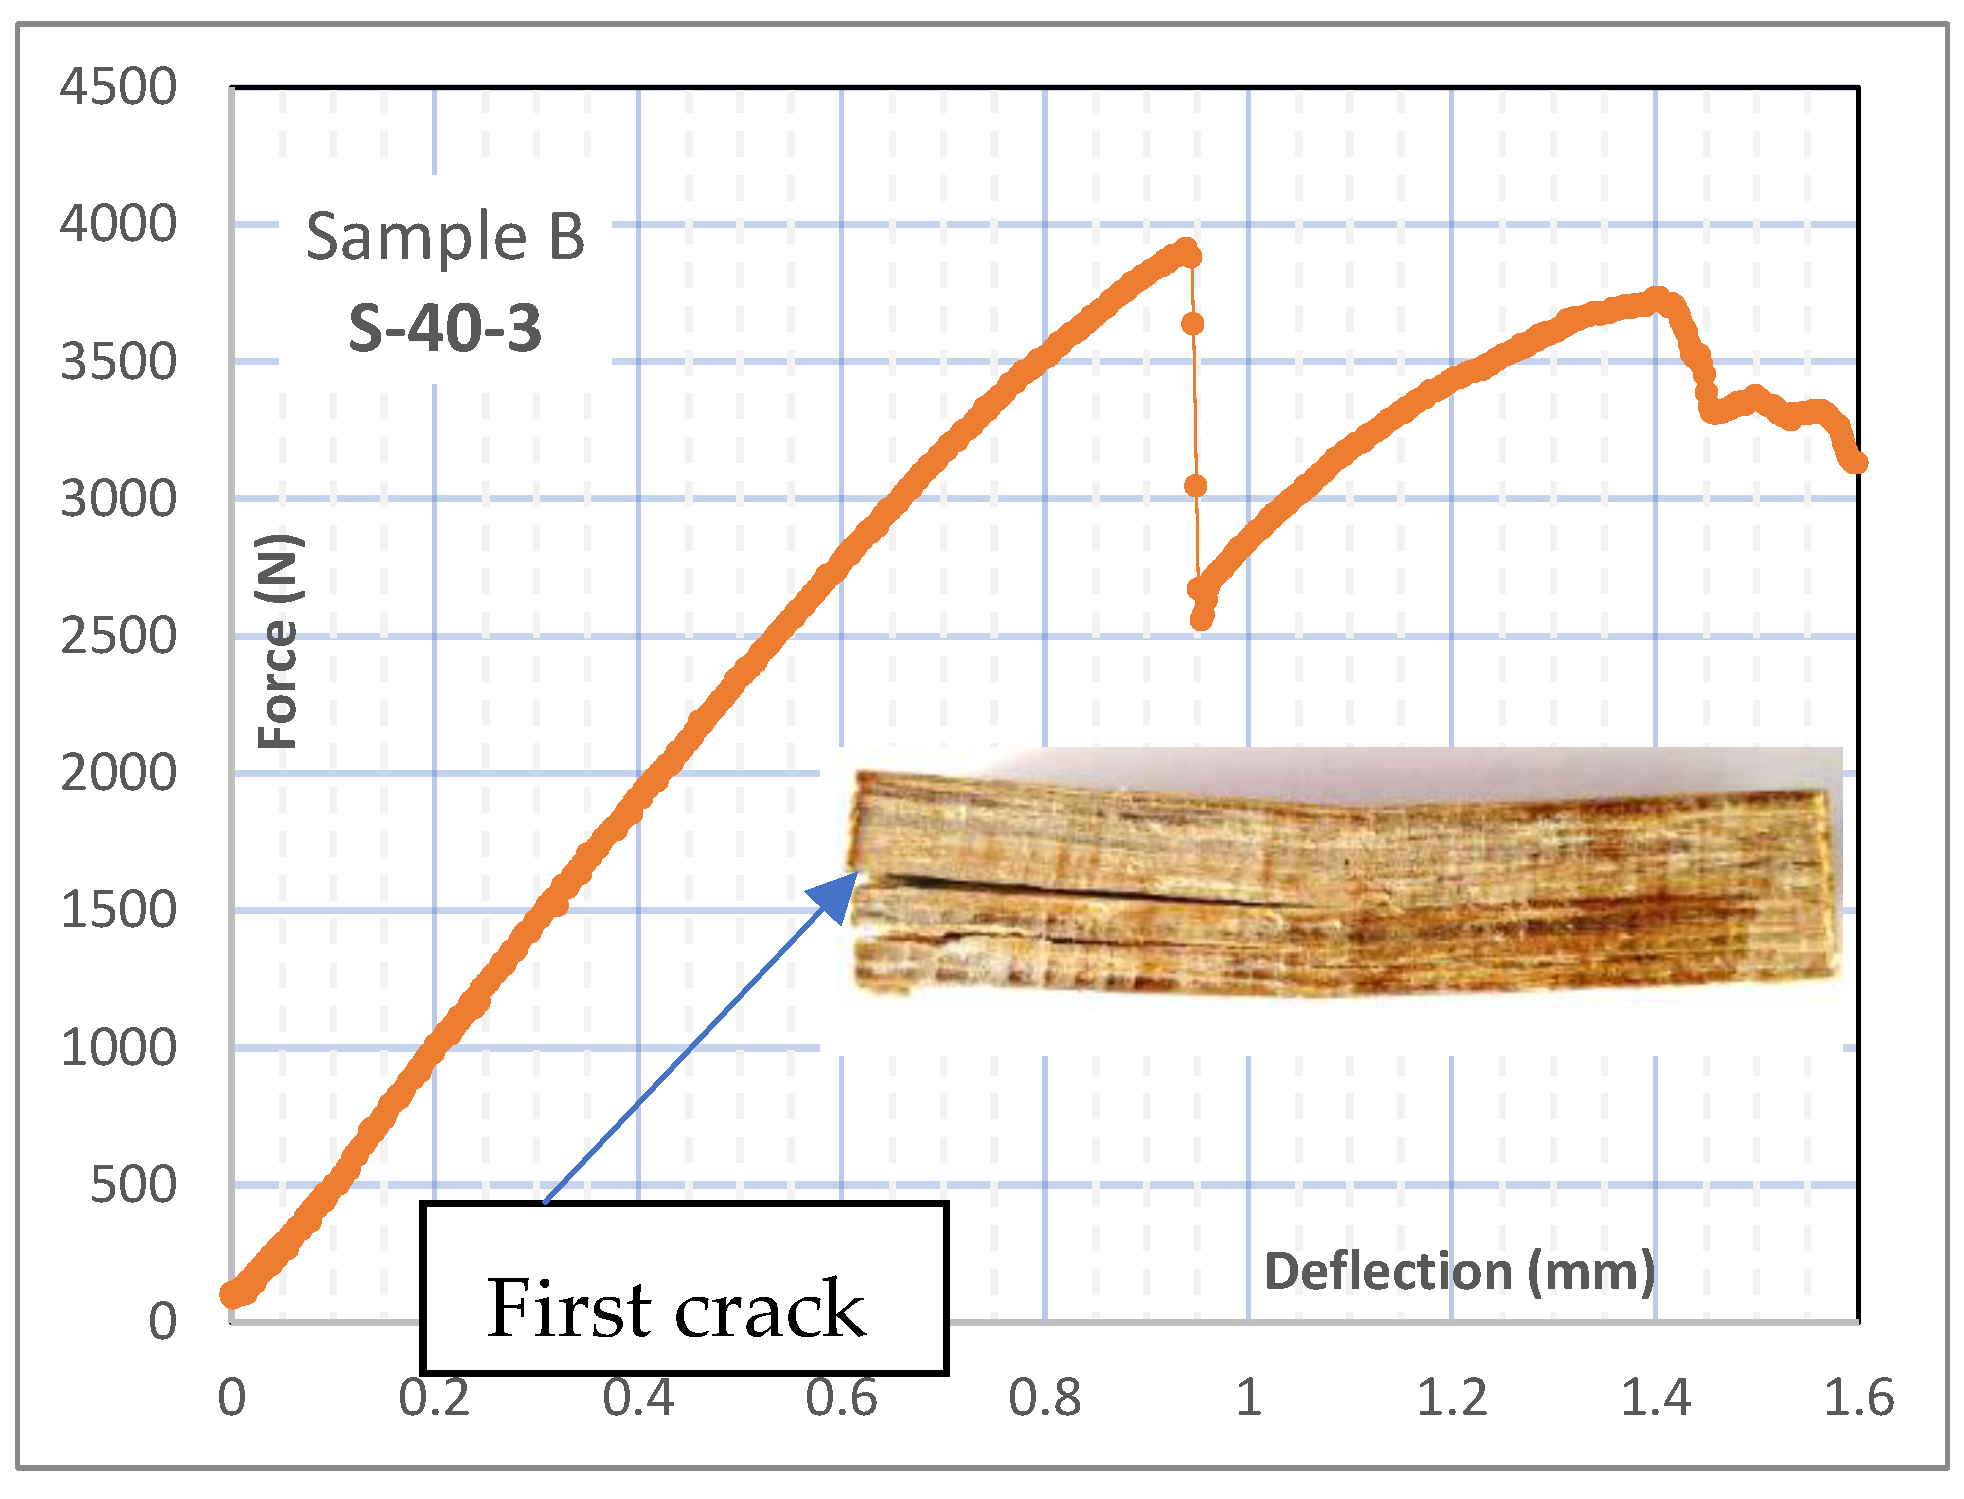
In equilibrium moisture conditions and when specimens were not exposed to humidity change, minor kinks (local failure) in 29 samples out of 30 specimens did not happen before the first crack. This can be seen in Figure 2. However, when the humidity conditions of samples were changed, a different trend in local failure was seen (see Figure 8 and Figure 9). Force–deflection diagrams in Figure 8 and Figure 9 are ascending after the first kink, which suggests that local failures (highlighted by circles in Figure 8 and Figure 9) happened before reaching the shear capacity of the section. The force drop due to local failure was considerable, as seen in Figure 8, and exceeded 630 N, suggesting that a large matrix area ruptured. The force drop due to local failure was lower in samples exposed to the same conditions (T = 20 °C and H = 40%) for seven days (Figure 9). As shown in Figure 9, the force drop in these samples was lower than 180 N. Samples kept in T = 20 °C and H = 40% conditions for 3 and 7 days are called S-20-40-3 and S-20-40-7, respectively.
With increased moisture content in samples, plastic behaviour and thus dissipated energy during failure increased, and force drops (kinks) in the force–deflection diagram decreased. Figure 10 compares force–deflection diagrams for models exposed to H = 90% and H = 40% for 21 days.
Minor kinks in the force–deflection diagram represent local failures, after which the section still has considerable shear capacity (Figure 8 and Figure 9). Local failures should be avoided for serviceability purposes in a structural design. Local failures in BC could also accommodate moisture, which is damaging for a BC member even in the short term (this will be discussed later). One of the parameters compared herein is the force required to cause the first local failure.
Lower force drops in S-20-40-7 samples compared to S-20-40-3 samples could be attributed to the size of local failure in the models. It is well accepted that moisture reduces the strength capacity of plant fibre composites [50,51,52,53]. S-20-40-3 and S-20-40-7 samples desorbed moisture when they moved from H = 60% to H = 40% condition. This made the surface of samples reach the H = 40% condition quickly, but the inner parts needed more time to reach H = 40%. As such, the outer regions of samples were likely to have more shear capacity than the internal parts. Therefore, the area around the core of samples that hosts more moisture and thus less strength could behave like a defect and cause local failures. S-20-40-7 samples had more time to desorb, and therefore the weak region was smaller in them. The smaller weak region in S-20-40-7 compared to S-20-40-3 samples could produce more min energy release [33] when this region failed and therefore caused less force drop. Thus, forcing a drop in desorbed samples for seven days was less than those desorbed for three days (see Figure 8 and Figure 9).
When the polymer matrix (epoxy resin) is mixed with natural components such as hemicellulose, the time-dependent behaviour of the matrix could be influenced by moisture content. Absorption–desorption mechanisms due to annual and seasonal variation in moisture content could also influence the BC matrix and would affect the load-bearing time capacity of BC. This is based on experimental and theoretical evidence that shows that in plant-based materials, mechanical properties would be lower during transient moisture content and before reaching an equilibrium condition [40,53,54]. This transient condition could occur due to environment humidity changes. Comparing force–deflection diagrams for samples with different exposure to humidity could reveal this immediate effect in the BC matrix. To determine if BC matrix shear strength was lower during transient moisture content, shear samples were exposed for three and seven days to the humidity of 40% after they were in the equilibrium moisture condition of 60%. Based on the previous results, it was known that desorption for these samples would continue for more than seven days. Therefore, when shear tests were conducted, both S-40-3 and S-40-7 samples were in transient moisture conditions. Shear tests on these samples showed that the average force needed to make the first crack in S-40-7 samples was about 11% less than that required for the first crack in S-40-3. This was while S-40-7 samples had less moisture content due to longer desorption and were expected to have greater cracking force (see Figure 7). Lower cracking force in S-40-7 samples suggested that the BC matrix shear capacity in transient moisture content could be lower than in the equilibrium moisture conditions. Moisture was lost from the surface of the sample, so there should have been a weak region around the core of S-40-3 and S-40-7 samples with higher moisture. The weak region in S-40-3 samples should have been more significant, as these samples had less time to lose moisture. Therefore, the area with uniform moisture was likely more prominent in S-40-3 samples, accounting for greater cracking force.
The shear behaviour of BC in transient moisture content should be considered in structural design. As mentioned before, it is reasonable to consider the first cracking of BC in serviceability design. Results suggested that the first shear crack could happen under a lower force in transient conditions than in equilibrium conditions with a given moisture content. With diurnal and seasonal humidity variations, which could cause transient moisture content (MC) conditions, the worst transient conditions should be considered for serviceability design.
To gain some more insight into the moisture-dependent behaviour of BC, mechanisms of water transport in BC are discussed here. This could help understand crack development and the serviceability of BC members. Moisture transport in plant-sourced materials is predominately in the vapour phase [55,56]. Three mechanisms of moisture transport could be distinguished in this regard. These are diffusion of vapour in a porous system, sorption by cell walls, and diffusion of bond water through cell walls [52,57]. Vapour diffusion in the porous system and diffusion of bound water could be modelled by Fick’s law [50]. Sorption in the cell wall is usually modelled by two-stage processes [58].
Vapour diffusion in the porous system in BC samples was influential in moisture transport. Let us assume that voids in the BC matrix could not make a network for water vapour to diffuse into the matrix. This assumption means water transport is dominated only by water sorption and water diffusion in cell walls and not vapour diffusion in a porous matrix. Considering this assumption and given that the sorption and diffusion rate of water in hemicellulose are –14 [59], moisture content does not change considerably in seven days. Therefore, a relatively weaker region could not be generated in samples. Thus, local failure in shear tests should not be seen in short periods of three or seven days of the desorption process. Additionally, if this assumption is valid, the shear strength of samples after three or seven days of exposure to new humidity should not change. Results showed that shear strength changed after three and seven days of exposure in all samples exposed to new humidity levels (40% or 90%). This implies that vapour diffusion in porous systems significantly influences BC’s water transport.
Microchannels that make vapour diffusion possible in the BC porous matrix could not be symmetrically distributed. This could be understood when specimens in transient moisture conditions were compared with those in equilibrium moisture conditions. In almost all specimens in equilibrium moisture conditions of 40%, 60%, or 90% humidity, no local failure happened before the general shear failure. However, when specimens were in transient moisture conditions, a local shear failure occurred before the general shear failure. In around 20% of specimens in transient moisture conditions, no local failure happened before the first crack (see Figure 11). In more than 80% of samples in transient moisture conditions, local failure did not occur at the mid-depth of specimens, where shear stress was at a maximum. This suggests that moisture could have been trapped in some spots in the transient samples. Therefore, channels that transfer moisture could not be homogenously distributed. Homogeneity is size-dependent, and for more extensive samples, observations H = 40% conditions could be different.
As mentioned above, diffusion in the porous system is substantially influential in water transport in BC; thus, decreasing void volumes in the matrix is one way to reduce the rate of water diffusion in BC. One way is to optimise hot press pressure in processing BC. However, reducing void volume by optimising hot press pressure cannot be a long-term solution. Firstly, water could transport due to cell wall sorption and diffusion of bond water in the cell wall even when diffusion in the porous system does not occur. Secondly, sorption causes stress relaxation in cell walls [60,61], and stress relaxation could increase the sorption capacity of the cell wall [58]. The synergistic relationship between water sorption and stress relaxation in the cell walls is likely to increase the total diffusion rate in the long-term.
As mentioned before, no coating was applied on specimens tested in this study. Applying a coating on BC will reduce the rate of water transfer.
4. Conclusions and Structural Design Considerations Associated with Shear Properties of BC
Shear strength was measured at 20.4 MPa for BC samples in equilibrium moisture conditions in the lab (temperature = 20 °C and humidity = 60%). This shear capacity happens in the close vicinity of the samples’ centroids (middle of samples height). In 90% humidity and after reaching equilibrium moisture, shear strength could decrease to 14 MPa.
The shear capacity of bamboo composite (BC) in lab conditions and equilibrium moisture conditions decreased with distance from samples’ centroids (middle of sample thickness). This could be associated with the increased chances of inner fibre layers receiving epoxy during production. A linear regression modelled strength reduction by distance from the centroid with R2 of 0.80 fits the experimental data points.
An extreme value cumulative probability function was developed, which fits the failure loads measured experimentally. The model considers a Poisson distribution for the existence of compelling flaws and a normal distribution for the shear strength of BC over the thickness (h) of samples. An apparent defect usually is expected in every 11.36 cm3 of BC volume based on this model. The probabilistic model developed herein could be used in structural design and evaluating safety factors for BC members under shear stress. Safety factors set for BC should include member size, since the strength of BC is shown to be size-dependent.
Moisture can substantially decrease BC shear capacity. The coefficient of variation of shear capacity increases with moisture content, which implies that a more significant safety factor should be considered in the higher range.
In transient moisture conditions, local failure was observed before the first significant crack occurred in the samples. A stress drop caused by local failure can exceed 10% of the total shear strength and, therefore, should be considered in serviceability design. In this regard, two levels of characteristic shear capacities can be regarded for shear design. Local failure is not generally observed in equilibrium moisture conditions.
Author Contributions
Conceptualization, A.R.; methodology, A.R., A.J. and M.M.; software, A.R.; validation, M.B., M.M. and A.J.; formal analysis, A.R.; investigation, A.J. and A.R.; resources, A.J. and A.R.; data curation, A.J. and A.R.; writing—original draft preparation, A.R.; writing—review and editing, M.M., A.J. and M.B.; visualization, A.R. and A.J.; supervision, A.J. and A.R.; project administration, A.J. and A.R.; funding acquisition, the University of Newcastle and Singapore- ETH. All authors have read and agreed to the published version of the manuscript.
Funding
This research was funded by the University of Newcastle, Australia. Grant number: GS170046. Singapore-ETH had in-kind contribution to this project.
Institutional Review Board Statement
Not applicable.
Informed Consent Statement
Not applicable.
Data Availability Statement
Publicly available datasets were analyzed in this study. This data can be found here: https://charlesdarwinuni-my.sharepoint.com/:x:/g/personal/ali_rajabipour_cdu_edu_au/EUGWcucum4dBvz7mIOEvwloBkWNEw8B3dwrpdqbDeDyi9A?e=sagkhS, accessed on 15 January 2022.
Acknowledgments
The financial support provided by the University of Newcastle and Singapore-ETH is gratefully acknowledged. The research was conducted at the Future Cities Laboratory at the Singapore-ETH Centre, which was established collaboratively between ETH Zurich and Singapore’s National Research Foundation (FI 370074016) under its Campus for Research Excellence and Technological Enterprise programme.
Conflicts of Interest
The authors declare no conflict of interest.
References
- Pervaiz, M.; Panthapulakkal, S.; Birat, K.; Sain, M.; Tjong, J. Emerging trends in automotive lightweighting through novel composite materials. Mater. Sci. Appl. 2016, 7, 26. [Google Scholar] [CrossRef] [Green Version]
- Partanen, A.; Carus, M. Wood and natural fiber composites current trend in consumer goods and automotive parts. Reinf. Plast. 2016, 60, 170–173. [Google Scholar] [CrossRef]
- Lau, K.-T.; Hung, P.-Y.; Zhu, M.-H.; Hui, D. Properties of natural fibre composites for structural engineering applications. Compos. Part B Eng. 2018, 136, 222–233. [Google Scholar] [CrossRef]
- Sanjay, M.R.; Madhu, P.; Jawaid, M.; Senthamaraikannan, P.; Senthil, S.; Pradeep, S. Characterization and properties of natural fiber polymer composites: A comprehensive review. J. Clean. Prod. 2018, 172, 566–581. [Google Scholar] [CrossRef]
- Uddin, N.; Uddin, N. Developments in Fiber-Reinforced Polymer (FRP) Composites for Civil Engineering: Developments in Fiber-Reinforced Polymer (Frp) Composites for Civil Engineering; Elsevier Science & Technology: Cambridge, UK, 2013. [Google Scholar]
- Hebel, D.E.; Heisel, F.; Javadian, A.; Wielopolski, M.; Lee, S.; Muller, P.; Schlesier, K. Engineering bamboo—A green economic alternative Part 1 Professorship of Architecture and Construction Dirk E. Hebel. A + U-Archit. Urban. 2016, 548, 162–167. [Google Scholar]
- Dittenber, D.B.; GangaRao, H.V.S. Critical review of recent publications on use of natural composites in infrastructure. Compos. Part A Appl. Sci. Manuf. 2012, 43, 1419–1429. [Google Scholar] [CrossRef]
- Lau, A.K.-T.; Cheung, K.H.Y. 1—Natural fiber-reinforced polymer-based composites. In Natural Fiber-Reinforced Biodegradable and Bioresorbable Polymer Composites; Woodhead Publishing: Sawston, UK, 2017; pp. 1–18. [Google Scholar]
- Dissanayake, N.; Hall, W.; Summerscales, J.; Virk, A. A review of bast fibres and their composites: Part 1–Fibres as reinforcements. Compos. Part A 2010, 41, 1329–1335. [Google Scholar]
- Väisänen, T.; Haapala, A.; Lappalainen, R.; Tomppo, L. Utilization of agricultural and forest industry waste and residues in natural fiber-polymer composites: A review. Waste Manag. 2016, 54, 62–73. [Google Scholar] [CrossRef]
- Shah, D.U. Developing plant fibre composites for structural applications by optimising composite parameters: A critical review. J. Mater. Sci. 2013, 48, 6083–6107. [Google Scholar] [CrossRef]
- Faruk, O.; Bledzki, A.K.; Fink, H.-P.; Sain, M. Biocomposites reinforced with natural fibers: 2000–2010. Prog. Polym. Sci. 2012, 37, 1552–1596. [Google Scholar] [CrossRef]
- Lobovikov, M.; Ball, L.; Guardia, M.; Food and Agriculture Organization of the United Nations; Russo, L. World Bamboo Resources: A Thematic Study Prepared in the Framework of the Global Forest Resources Assessment 2005; Food and Agriculture Organization of the United Nations: Rome, Italy, 2007. [Google Scholar]
- Bourmaud, A.; Beaugrand, J.; Shah, D.U.; Placet, V.; Baley, C. Towards the design of high-performance plant fibre composites. Prog. Mater. Sci. 2018, 97, 347–408. [Google Scholar] [CrossRef]
- Unlocking the Commercial Potential of Natural Fibres; Food and Agriculture Organization of the United Nations: Rome, Italy, 2012.
- Shin, F.G.; Xian, X.-J.; Zheng, W.-P.; Yipp, M.W. Analyses of the mechanical properties and microstructure of bamboo-epoxy composites. J. Mater. Sci. 1989, 24, 3483–3490. [Google Scholar] [CrossRef]
- Jain, S.; Kumar, R.; Jindal, U.C. Mechanical behaviour of bamboo and bamboo composite. J. Mater. Sci. 1992, 27, 4598–4604. [Google Scholar] [CrossRef]
- Hebel, D.E.; Javadian, A.; Heisel, F.; Schlesier, K.; Griebel, D.; Wielopolski, M. Process-controlled optimization of the tensile strength of bamboo fiber composites for structural applications. Compos. Part B Eng. 2014, 67, 125–131. [Google Scholar] [CrossRef]
- Ashby, M.F. Materials Selection in Mechanical Design; Elsevier Science: Amsterdam, The Netherlands, 2016. [Google Scholar]
- Mohanty, A.K.; Misra, M.; Drzal, L.T. Natural Fibers, Biopolymers, and Biocomposites; CRC Press: Boca Raton, FL, USA, 2005. [Google Scholar]
- Cheung, H.-Y.; Ho, M.-P.; Lau, K.-T.; Cardona, F.; Hui, D. Natural fibre-reinforced composites for bioengineering and environmental engineering applications. Compos. Part B Eng. 2009, 40, 655–663. [Google Scholar] [CrossRef]
- Koh, R.; Madsen, B. Strength failure criteria analysis for a flax fibre reinforced composite. Mech. Mater. 2018, 124, 26–32. [Google Scholar] [CrossRef]
- Tian, F.; Zhong, Z.; Pan, Y. Modeling of natural fiber reinforced composites under hygrothermal ageing. Compos. Struct. 2018, 200, 144–152. [Google Scholar] [CrossRef]
- Burgueno, R.; Quagliata, M.J.; Mohanty, A.K.; Mehta, G.; Drzal, L.T.; Misra, M. Load-bearing natural fiber composite cellular beams and panels. Compos. Part A Appl. Sci. Manuf. 2004, 35, 645–656. [Google Scholar] [CrossRef]
- Roma, L.C., Jr.; Martello, L.S.; Savastano, H., Jr. Evaluation of mechanical, physical and thermal performance of cement-based tiles reinforced with vegetable fibers. Constr. Build. Mater. 2008, 22, 668–674. [Google Scholar] [CrossRef]
- Mohanty, A.; Misra, M.; Drzal, L.T. Surface modifications of natural fibers and performance of the resulting biocomposites: An overview. Compos. Interfaces 2001, 8, 313–343. [Google Scholar] [CrossRef]
- Li, F.; Larock, R. Synthesis, properties, and potential applications of novel thermosetting biopolymers from soybean and other natural oils. In Natural Fibers, Biopolymers, and Biocomposites; CRC Press: Boca Raton, FL, USA, 2005; pp. 727–750. [Google Scholar]
- Wang, B.; Li, D.; Xian, G.; Li, C. Effect of Immersion in Water or Alkali Solution on the Structures and Properties of Epoxy Resin. Polymers 2021, 13, 1902. [Google Scholar] [CrossRef] [PubMed]
- Guo, R.; Xian, G.; Li, F.; Li, C.; Hong, B. Hygrothermal resistance of pultruded carbon, glass and carbon/glass hybrid fiber reinforced epoxy composites. Constr. Build. Mater. 2022, 315, 125710. [Google Scholar] [CrossRef]
- Kaw, A.K. Mechanics of Composite Materials; Taylor & Francis: Tokyo, Japan, 1997. [Google Scholar]
- Anderson, T.L. Fracture Mechanics: Fundamentals and Applications, 3rd ed.; Taylor & Francis: Tokyo, Japan, 2005. [Google Scholar]
- Gross, D.; Seelig, T. Fracture Mechanics: With an Introduction to Micromechanics; Springer: Berlin/Heidelberg, Germany, 2007. [Google Scholar]
- Sun, C.-T.; Jin, Z. Fracture Mechanics; Elsevier: Amsterdam, The Netherlands, 2012. [Google Scholar]
- Yu, Y.; Tian, G.; Wang, H.; Fei, B.; Wang, G. Mechanical characterization of single bamboo fibers with nanoindentation and microtensile technique. Holzforschung 2011, 65, 113–119. [Google Scholar] [CrossRef]
- Favre, J.-P.; Jacques, D. Stress transfer by shear in carbon fibre model composites. J. Mater. Sci. 1990, 25, 1373–1380. [Google Scholar] [CrossRef]
- Favre, J.-P.; Sigety, P.; Jacques, D. Stress transfer by shear in carbon fibre model composites. J. Mater. Sci. 1991, 26, 189–195. [Google Scholar] [CrossRef]
- Bos, H.L. The Potential of Flax Fibres as Reinforcement for Composite Materials; Technische Universiteit Eindhoven Eindhoven: Eindhoven, The Netherlands, 2004. [Google Scholar]
- Awal, A.; Cescutti, G.; Ghosh, S.; Müssig, J. Interfacial studies of natural fibre/polypropylene composites using single fibre fragmentation test (SFFT). Compos. Part A Appl. Sci. Manuf. 2011, 42, 50–56. [Google Scholar] [CrossRef]
- Hebel, D.E.; Javadian, A.; Wielopolski, M.; Schlesier, K.; Heisel, F.; Griebel, D. Process-Controlled Tensile Properties of Newly Developed Bamboo Composite Materials. In Proceedings of the Symposium Bio-Based Composites, Leuven, Belgium, 16–20 September 2013. [Google Scholar]
- Coffin, D.; Habeger, C.C., Jr. The mechanics of sorption-induced transients in the loss tangent. J. Pulp Pap. Sci. 2001, 27, 385–390. [Google Scholar]
- Simpson, W. Sorption theories applied to wood. Wood Fiber Sci. 2007, 12, 183–195. [Google Scholar]
- Berthold, J.; Rinaudo, M.; Salmeń, L. Association of water to polar groups; estimations by an adsorption model for ligno-cellulosic materials. Colloids Surf. A Physicochem. Eng. Asp. 1996, 112, 117–129. [Google Scholar] [CrossRef]
- O’sullivan, A.C. Cellulose: The structure slowly unravels. Cellulose 1997, 4, 173–207. [Google Scholar] [CrossRef]
- Kulasinski, K.; Keten, S.; Churakov, S.V.; Guyer, R.; Carmeliet, J.; Derome, D. Molecular Mechanism of Moisture-Induced Transition in Amorphous Cellulose. ACS Macro Lett. 2014, 3, 1037–1040. [Google Scholar] [CrossRef] [PubMed]
- Youssefian, S.; Rahbar, N. Molecular Origin of Strength and Stiffness in Bamboo Fibrils. Sci. Rep. 2015, 5, 11116. [Google Scholar] [CrossRef] [PubMed]
- Staiger, M.; Tucker, N. Natural-fibre composites in structural applications. In Properties and Performance of Natural-Fibre Composites; Elsevier: Amsterdam, The Netherlands, 2008; pp. 269–300. [Google Scholar]
- Salazar, M.Á.H. Viscoelastic Performance of Biocomposites. In Composites from Renewable and Sustainable Materials; InTech: Yokohama, Japan, 2016. [Google Scholar]
- Beever, D.; Valentine, L. Studies on the sorption of moisture by polymers. II. The cellulose-cellulose acetate system. J. Appl. Chem. 1958, 8, 103–107. [Google Scholar] [CrossRef]
- Winandy, J.; Rowell, R. The chemistry of wood strength. Adv. Chem. Ser. 1984, 207, 211–255. [Google Scholar]
- Siau, J.F. Wood: Influence of Moisture on Physical Properties; Department of Wood Science and Forest Products, Virginia Polytechnic Institute and State University: Blacksburg, VA, USA, 1995. [Google Scholar]
- Chen, H.; Miao, M.; Ding, X. Influence of moisture absorption on the interfacial strength of bamboo/vinyl ester composites. Compos. Part A Appl. Sci. Manuf. 2009, 40, 2013–2019. [Google Scholar] [CrossRef]
- Krabbenhøft, K. Moisture Transport in Wood. In A Study of Physical—Mathematical Models and Their Numerical Implementation; Technical University of Denmark: Lyngby, Denmark, 2003. [Google Scholar]
- Back, E.L.; Salmen, L.; Richardson, G. Transient effects of moisture sorption on the strength properties of paper and wood-based materials. Sven. Papp. 1983, 86, 61–71. [Google Scholar]
- Salmén, L.; Olsson, A.-M. Physical properties of cellulosic materials related to moisture changes. Wood Sci. Technol. 2016, 50, 81–89. [Google Scholar] [CrossRef]
- Time, B. Hygroscopic Moisture Transport in Wood; Norwegian University of Science and Technology Trondheim: Trondheim, Norway, 1998. [Google Scholar]
- Wadsö, L. Describing non-Fickian water-vapour sorption in wood. J. Mater. Sci. 1994, 29, 2367–2372. [Google Scholar] [CrossRef]
- Stamm, A.J. Combined bound-water and water-vapour diffusion into Sitka Spruce. For. Prod. J. 1960, 10, 644–648. [Google Scholar]
- Engelund, E.T.; Thygesen, L.G.; Svensson, S.; Hill, C.A.S. A critical discussion of the physics of wood–water interactions. Wood Sci. Technol. 2013, 47, 141–161. [Google Scholar] [CrossRef] [Green Version]
- Kelly, M.W.; Hart, C.A. Water vapor sorption rates by wood cell walls. Wood Fiber Sci. 2007, 1, 270–282. [Google Scholar]
- Schniewind, A.P. Recent progress in the study of the rheology of wood. Wood Sci. Technol. 1968, 2, 188–206. [Google Scholar] [CrossRef]
- Kollmann, F.F. Mechanics and rheology of wood. In Principles of Wood Science and Technology; Springer: Berlin/Heidelberg, Germany, 1968; pp. 292–419. [Google Scholar]
Figure 1.
Shear test as per ASTM-D2344.

Figure 2.
Sample force–deflection (3-point test); specimens in equilibrium conditions of T = 20 °C and H = 60%.
Figure 2.
Sample force–deflection (3-point test); specimens in equilibrium conditions of T = 20 °C and H = 60%.
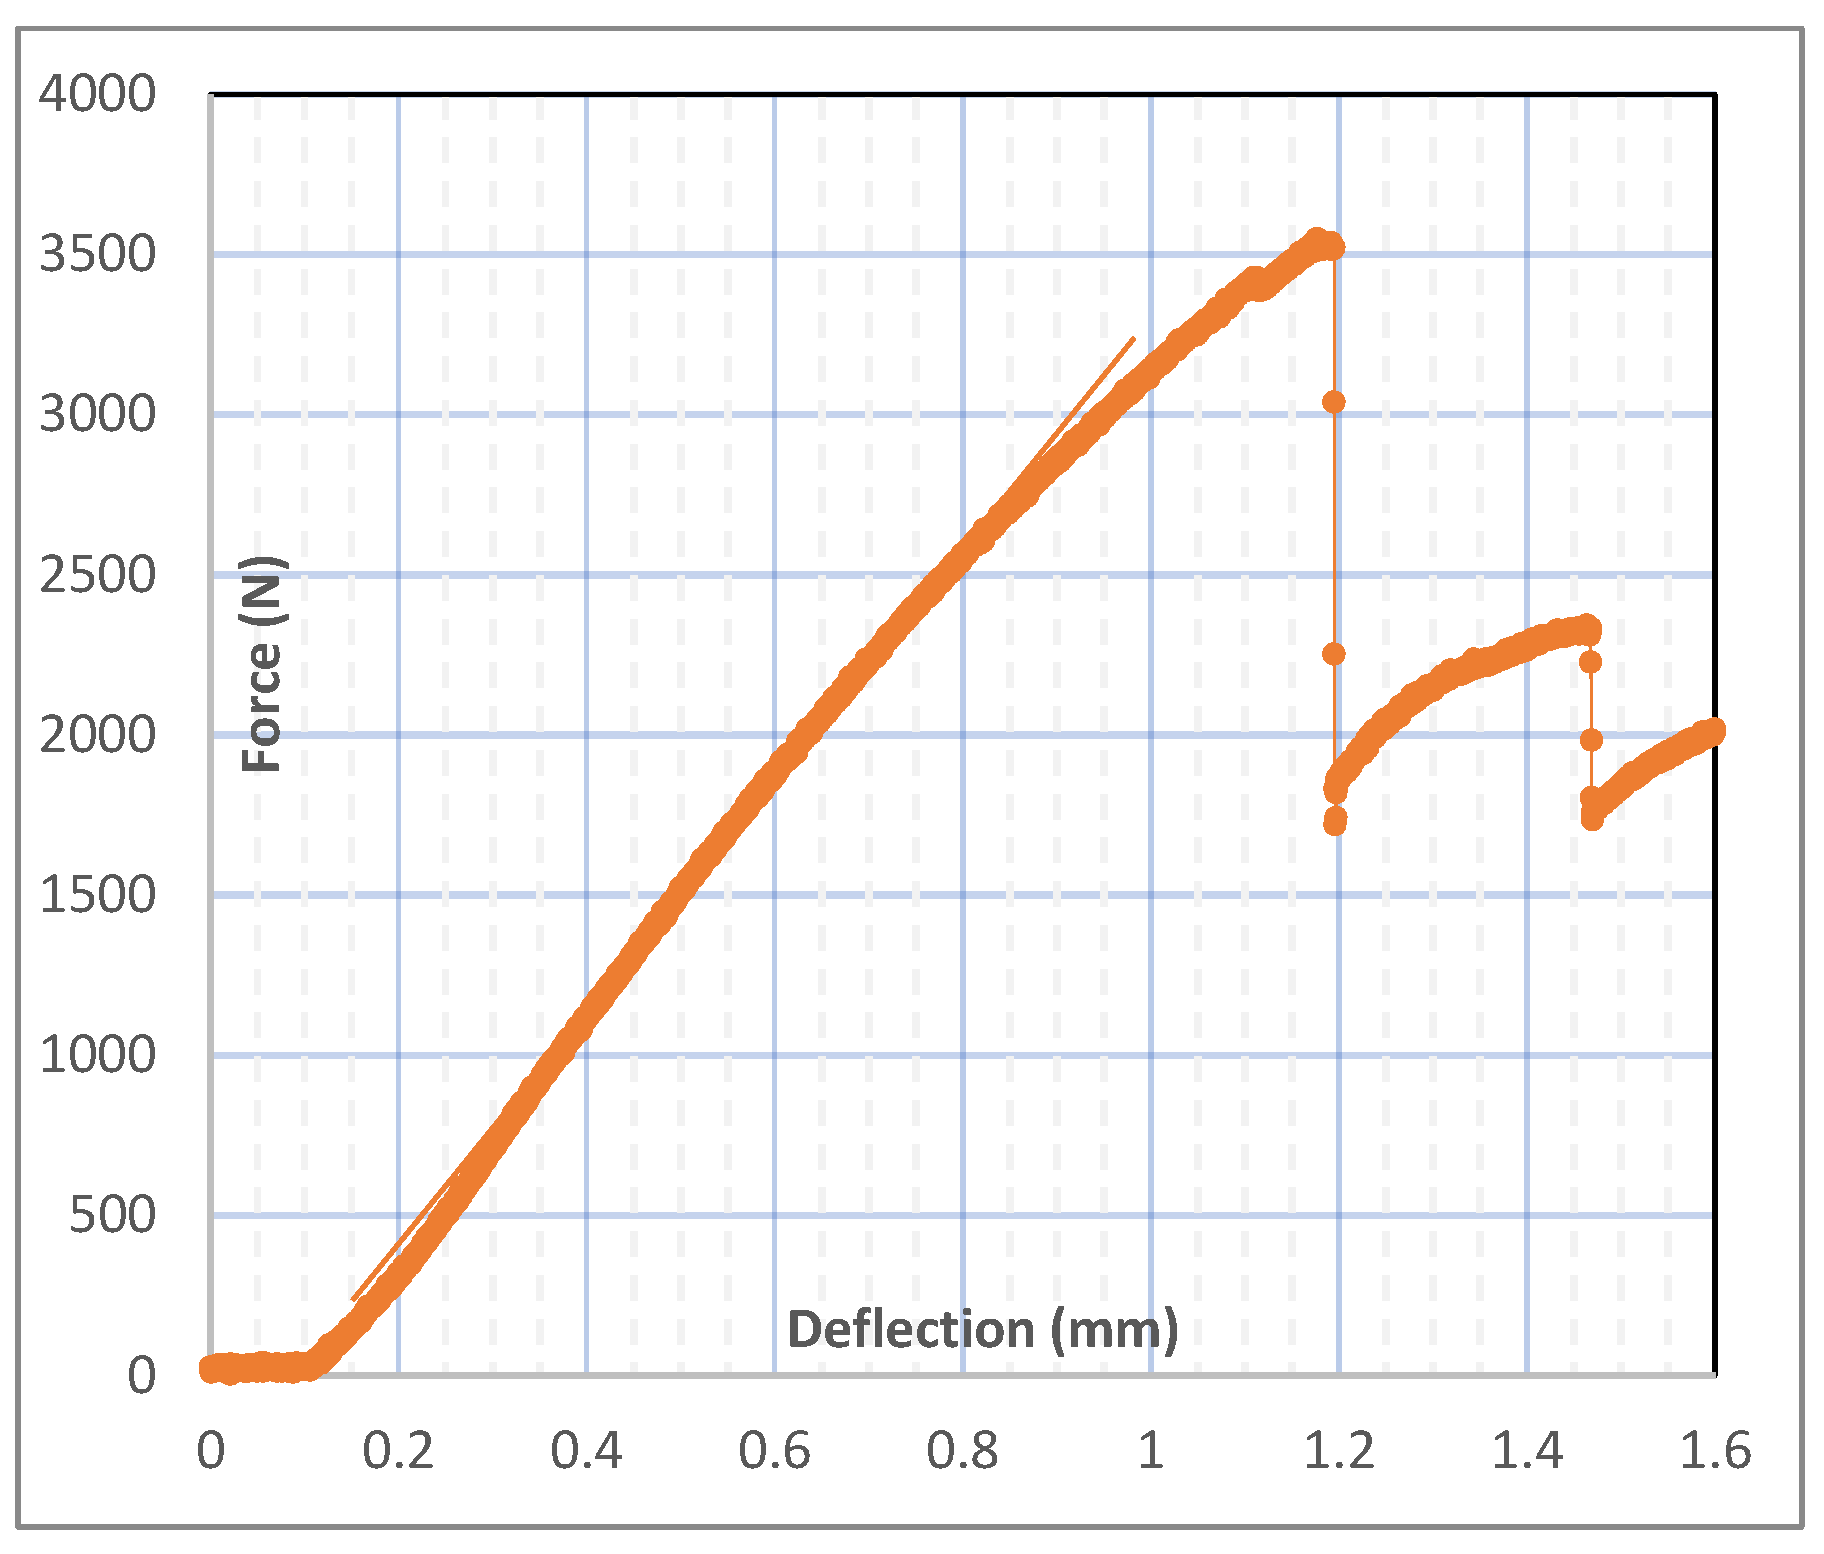
Figure 3.
Cross section of BC.
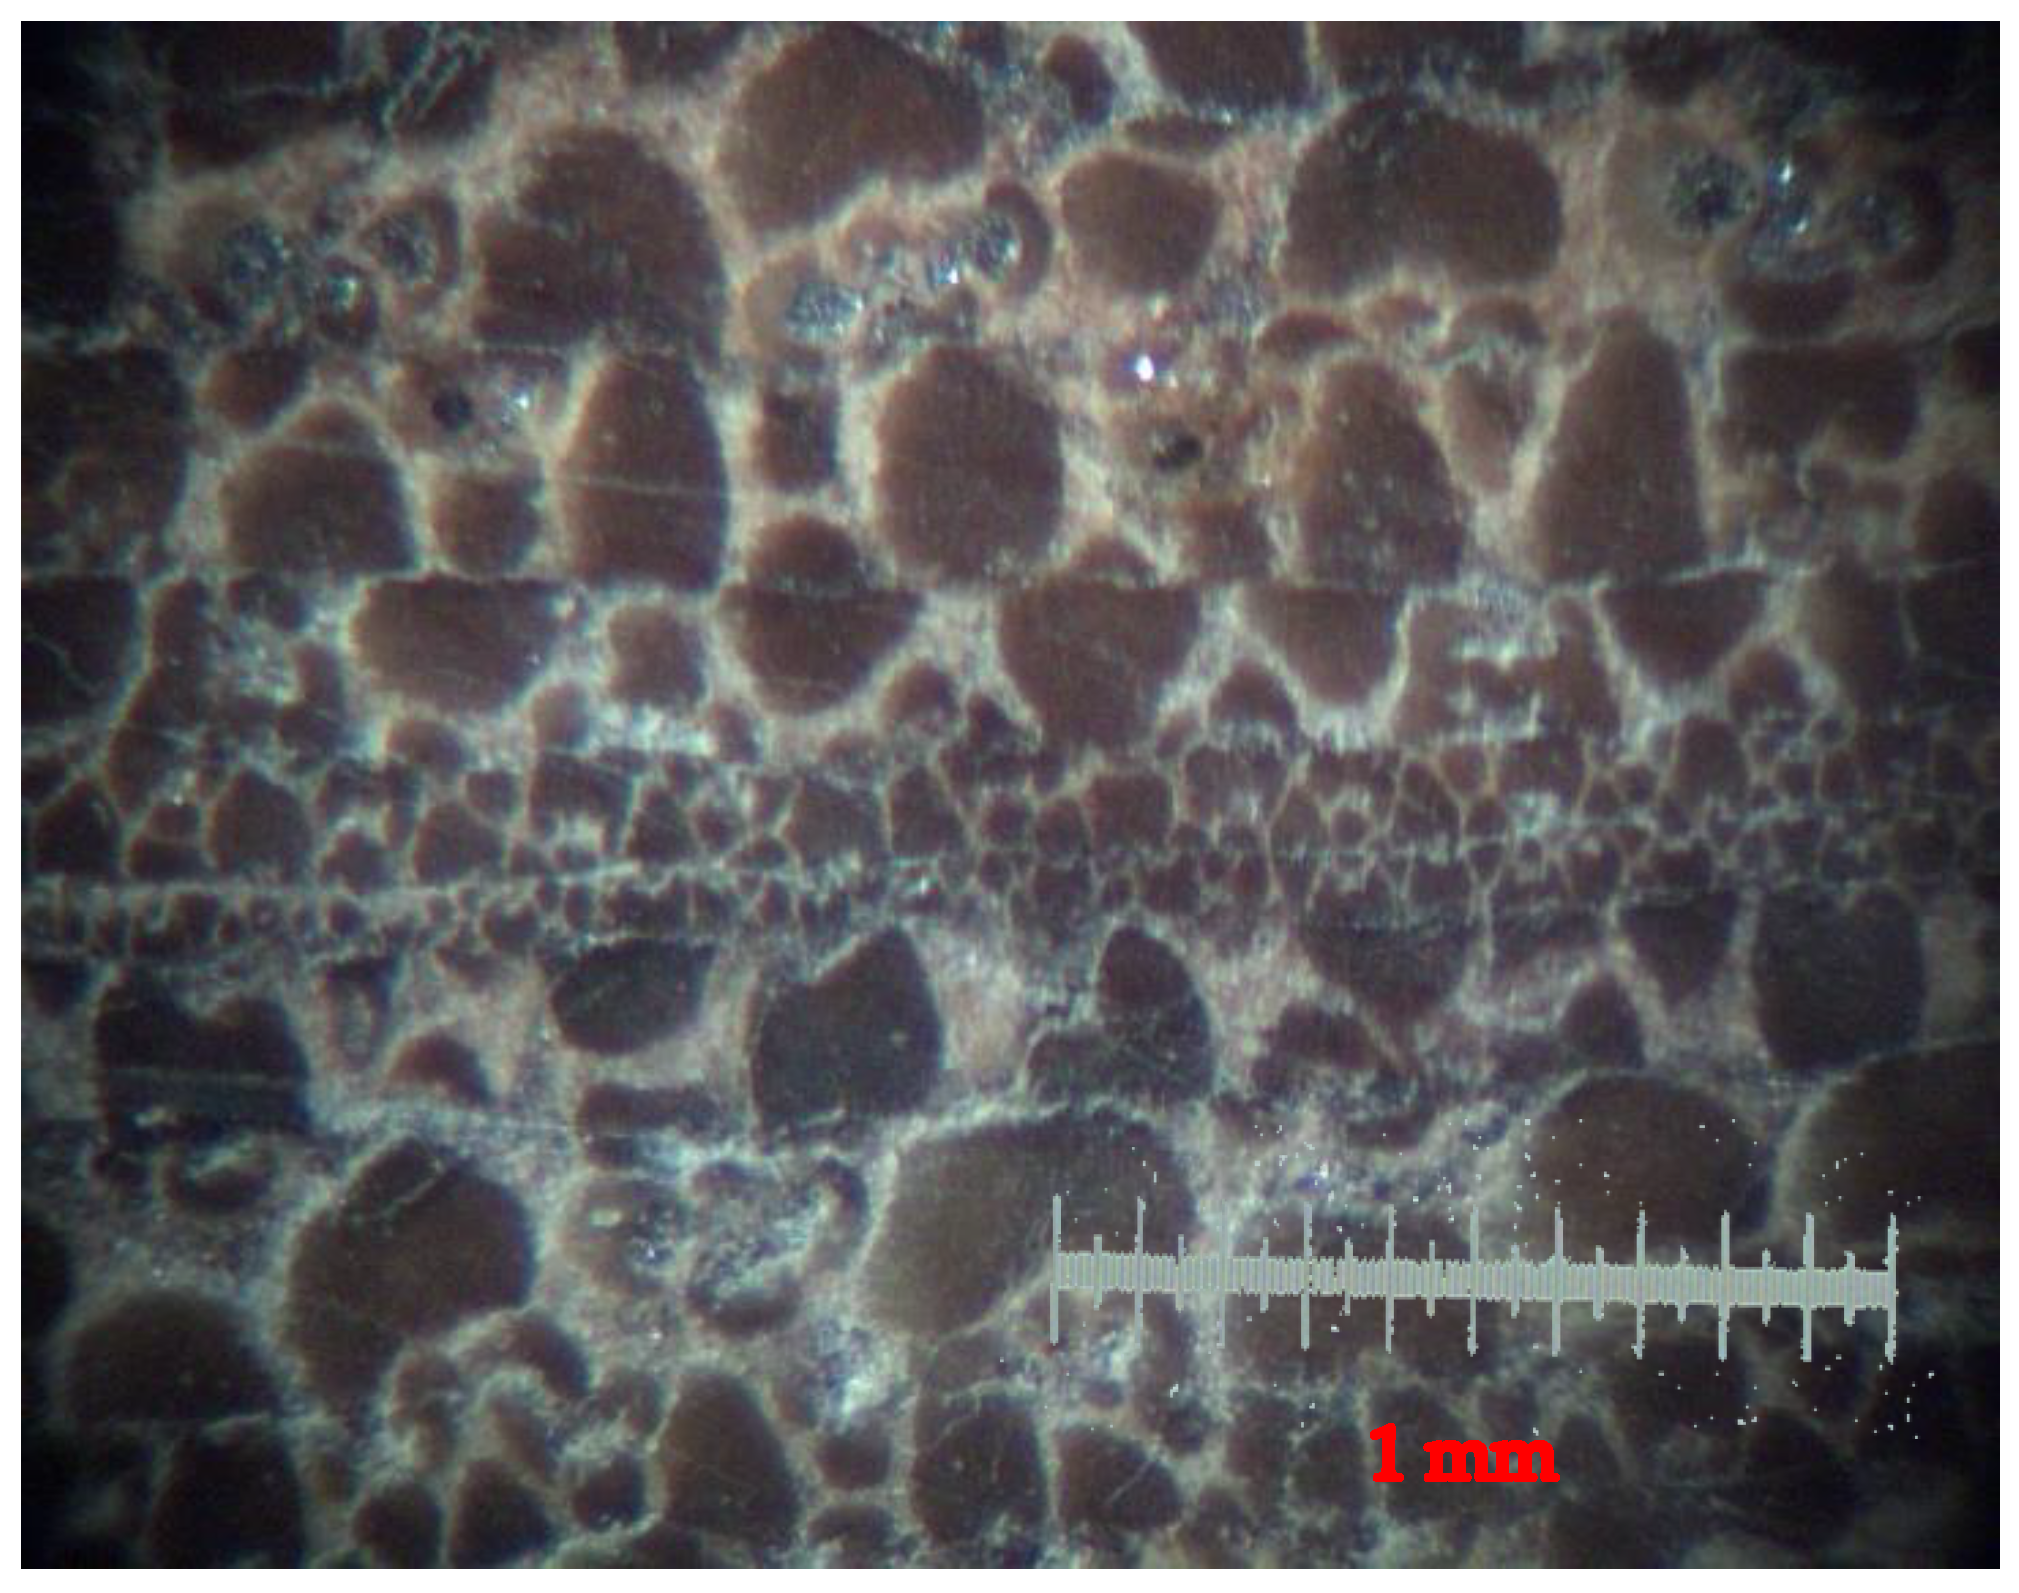
Figure 4.
(A) Absolute distance of first cracks in specimens relative to section centroid. (B) Stress concentration as in Equation (1).
Figure 4.
(A) Absolute distance of first cracks in specimens relative to section centroid. (B) Stress concentration as in Equation (1).

Figure 5.
versus ν for the first group of data points (6.5 mm < h < 7.5 mm).
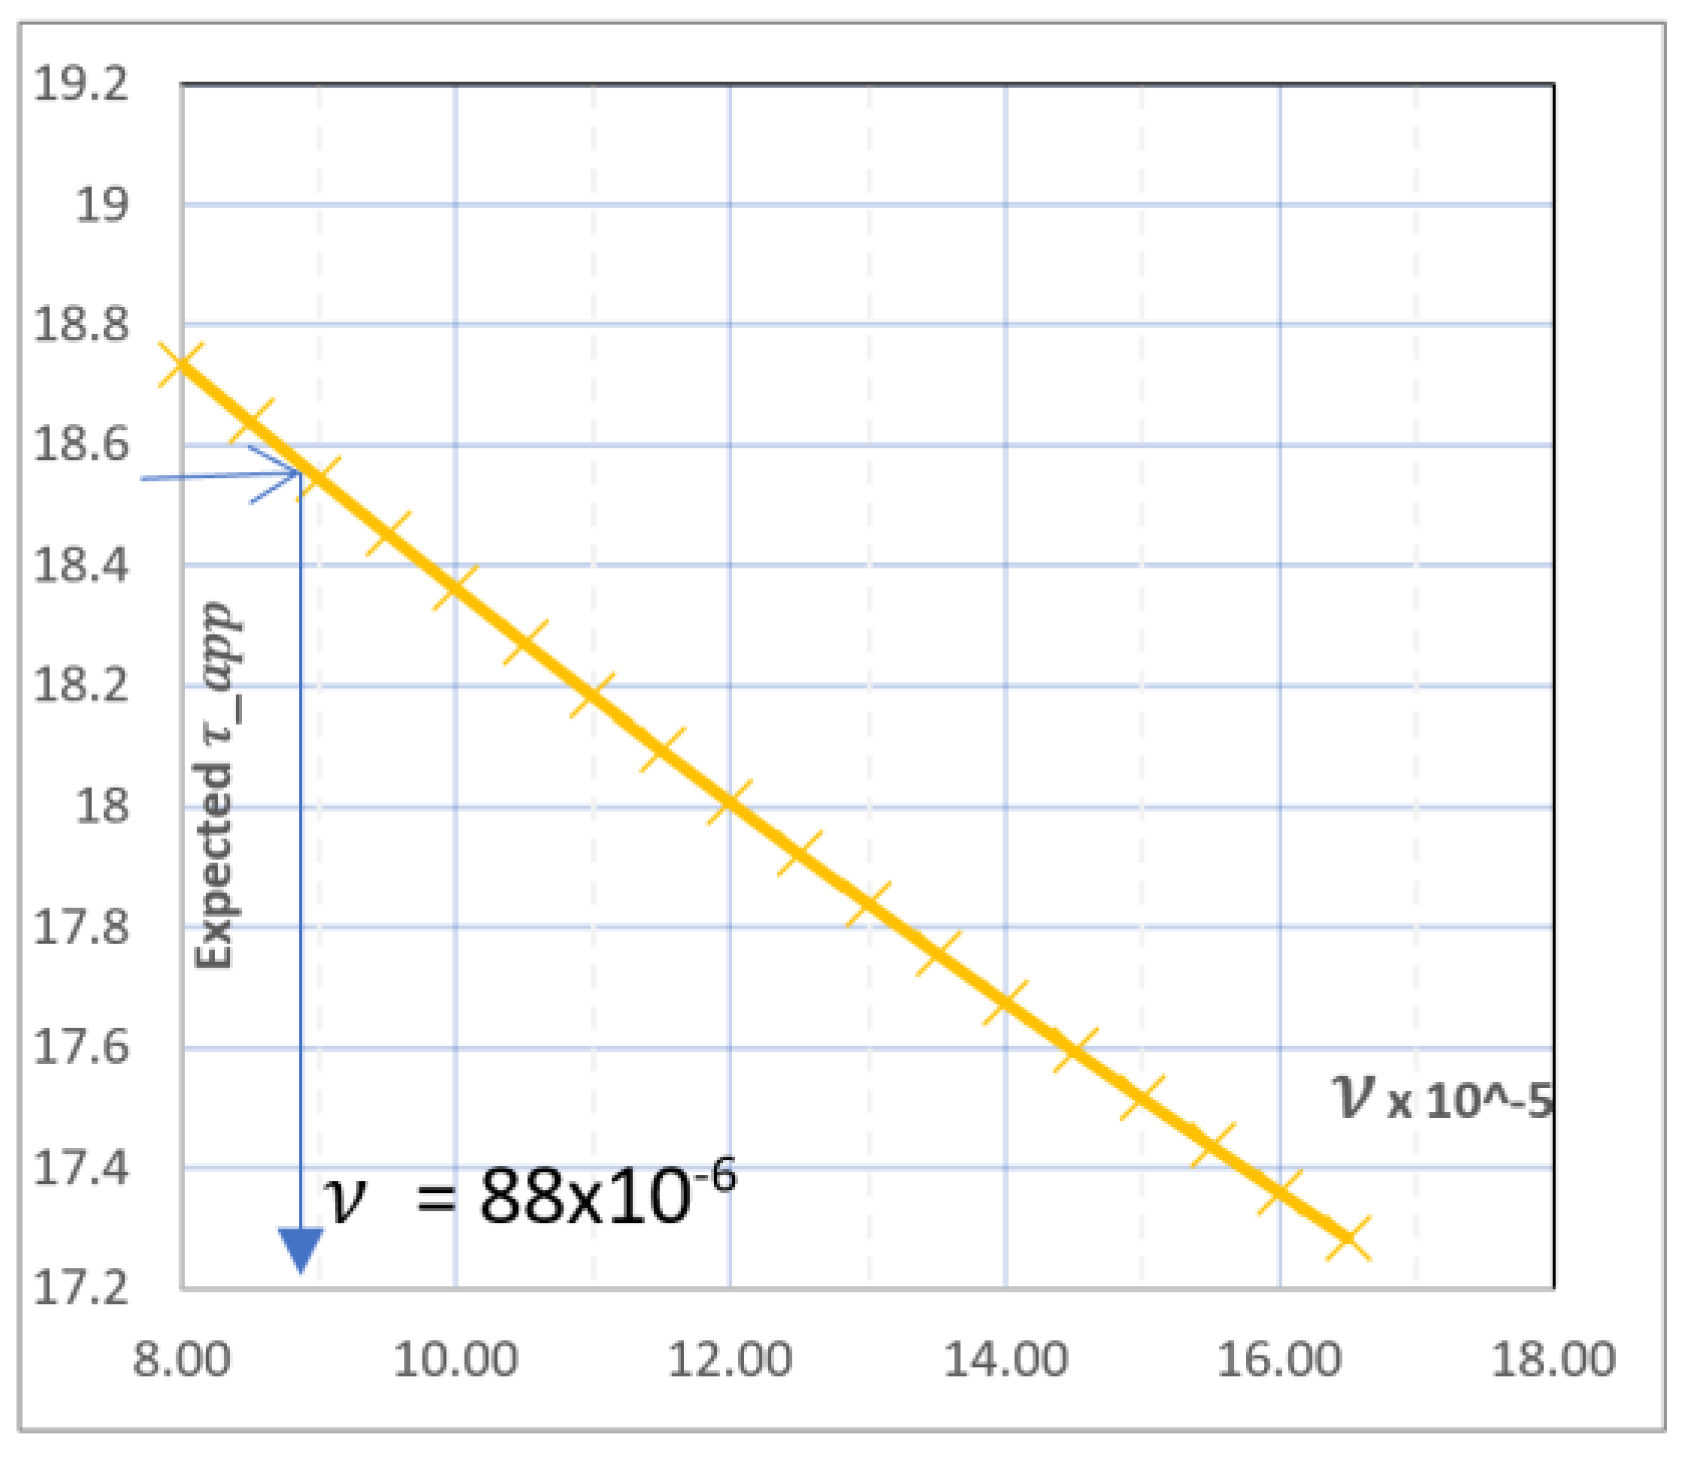
Figure 6.
versus sample height (h) and width (b); Nu = 0.000088.
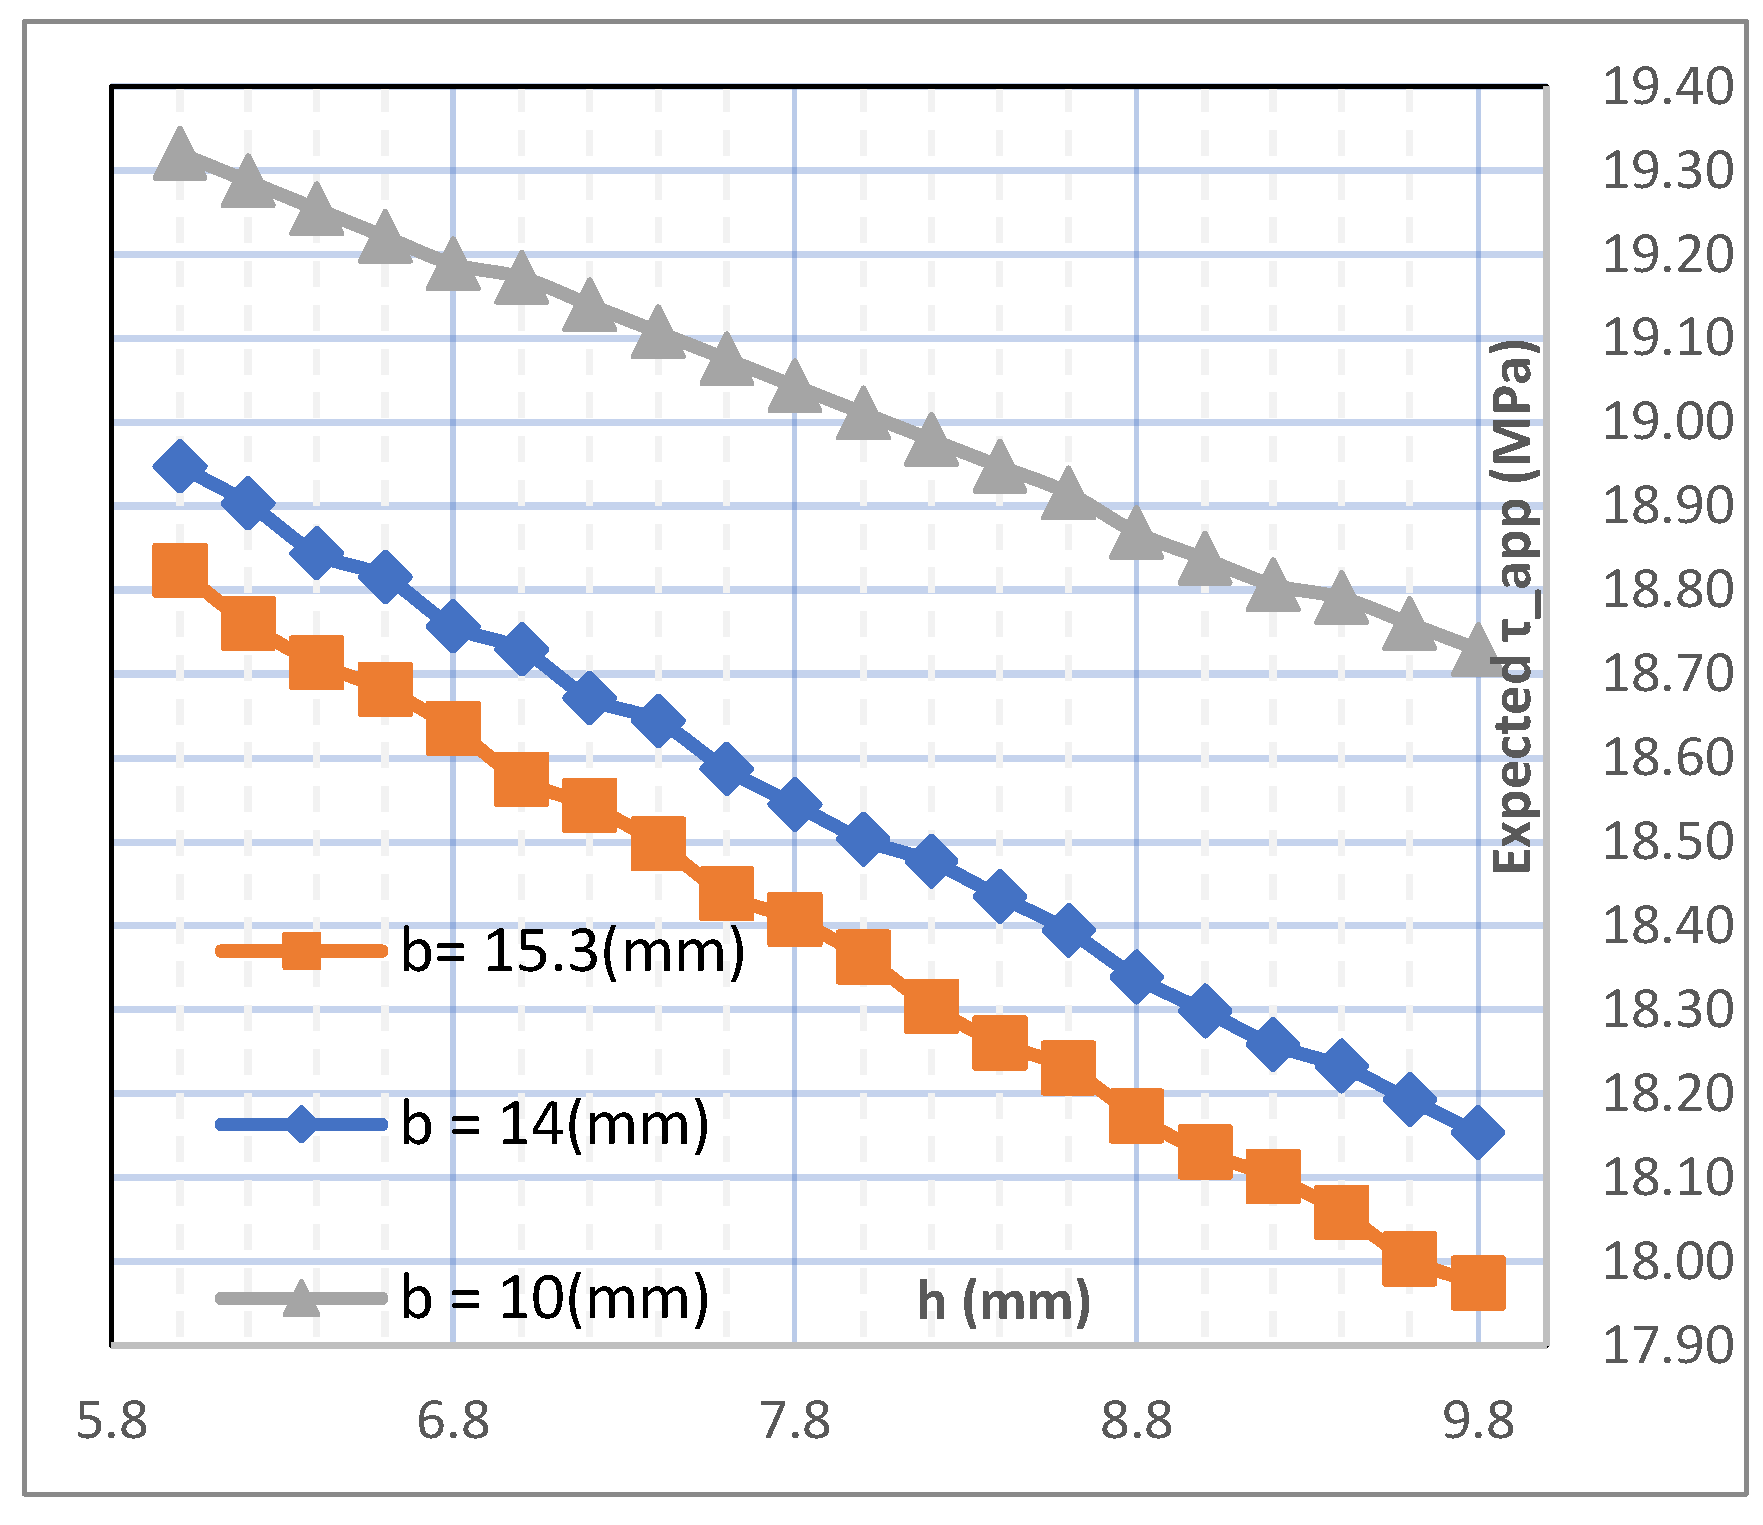
Figure 7.
Change of shear strength by environmental humidity. Shear tests were conducted on samples after 21 days of exposure, and the mean results are shown.
Figure 7.
Change of shear strength by environmental humidity. Shear tests were conducted on samples after 21 days of exposure, and the mean results are shown.
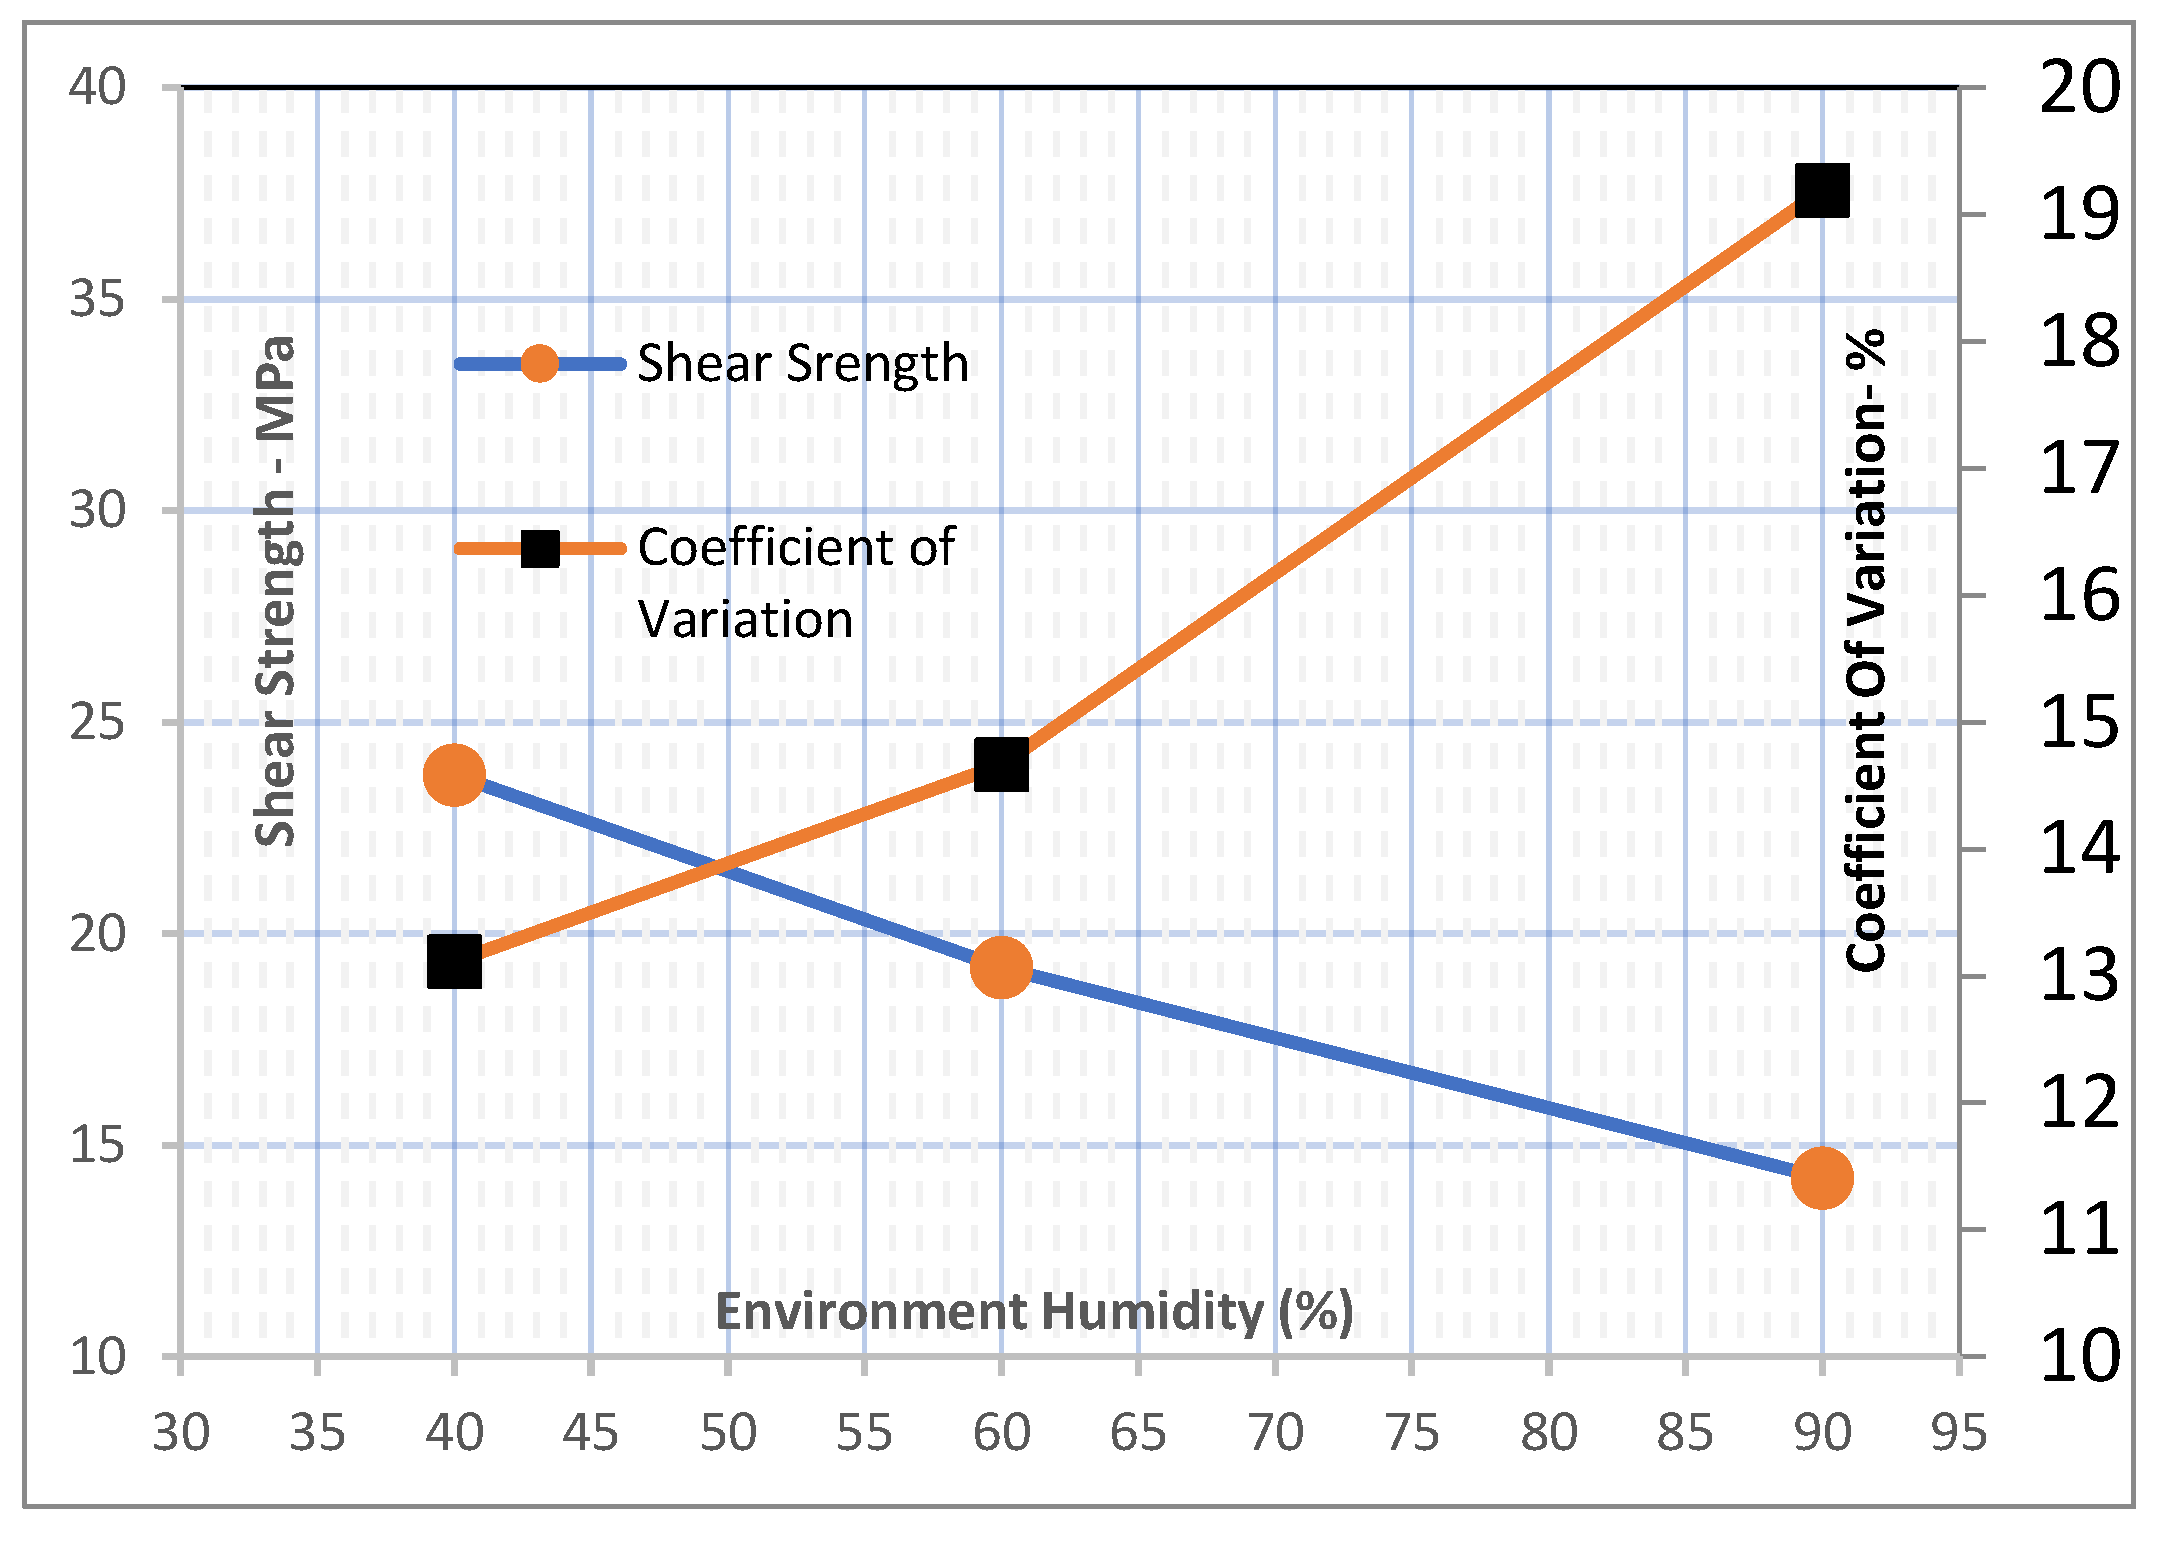
Figure 8.
Force–deflection (3-point test); samples were exposed to conditions of T = 20 °C and H = 40% for three days.
Figure 8.
Force–deflection (3-point test); samples were exposed to conditions of T = 20 °C and H = 40% for three days.

Figure 9.
Force–deflection (3-point test); samples were exposed to the conditions of T = 20 °C and H = 40% for seven days.
Figure 9.
Force–deflection (3-point test); samples were exposed to the conditions of T = 20 °C and H = 40% for seven days.

Figure 10.
Three-point shear test force–deflection diagrams under different environmental humidity conditions—exposure time = 21 Days.
Figure 10.
Three-point shear test force–deflection diagrams under different environmental humidity conditions—exposure time = 21 Days.
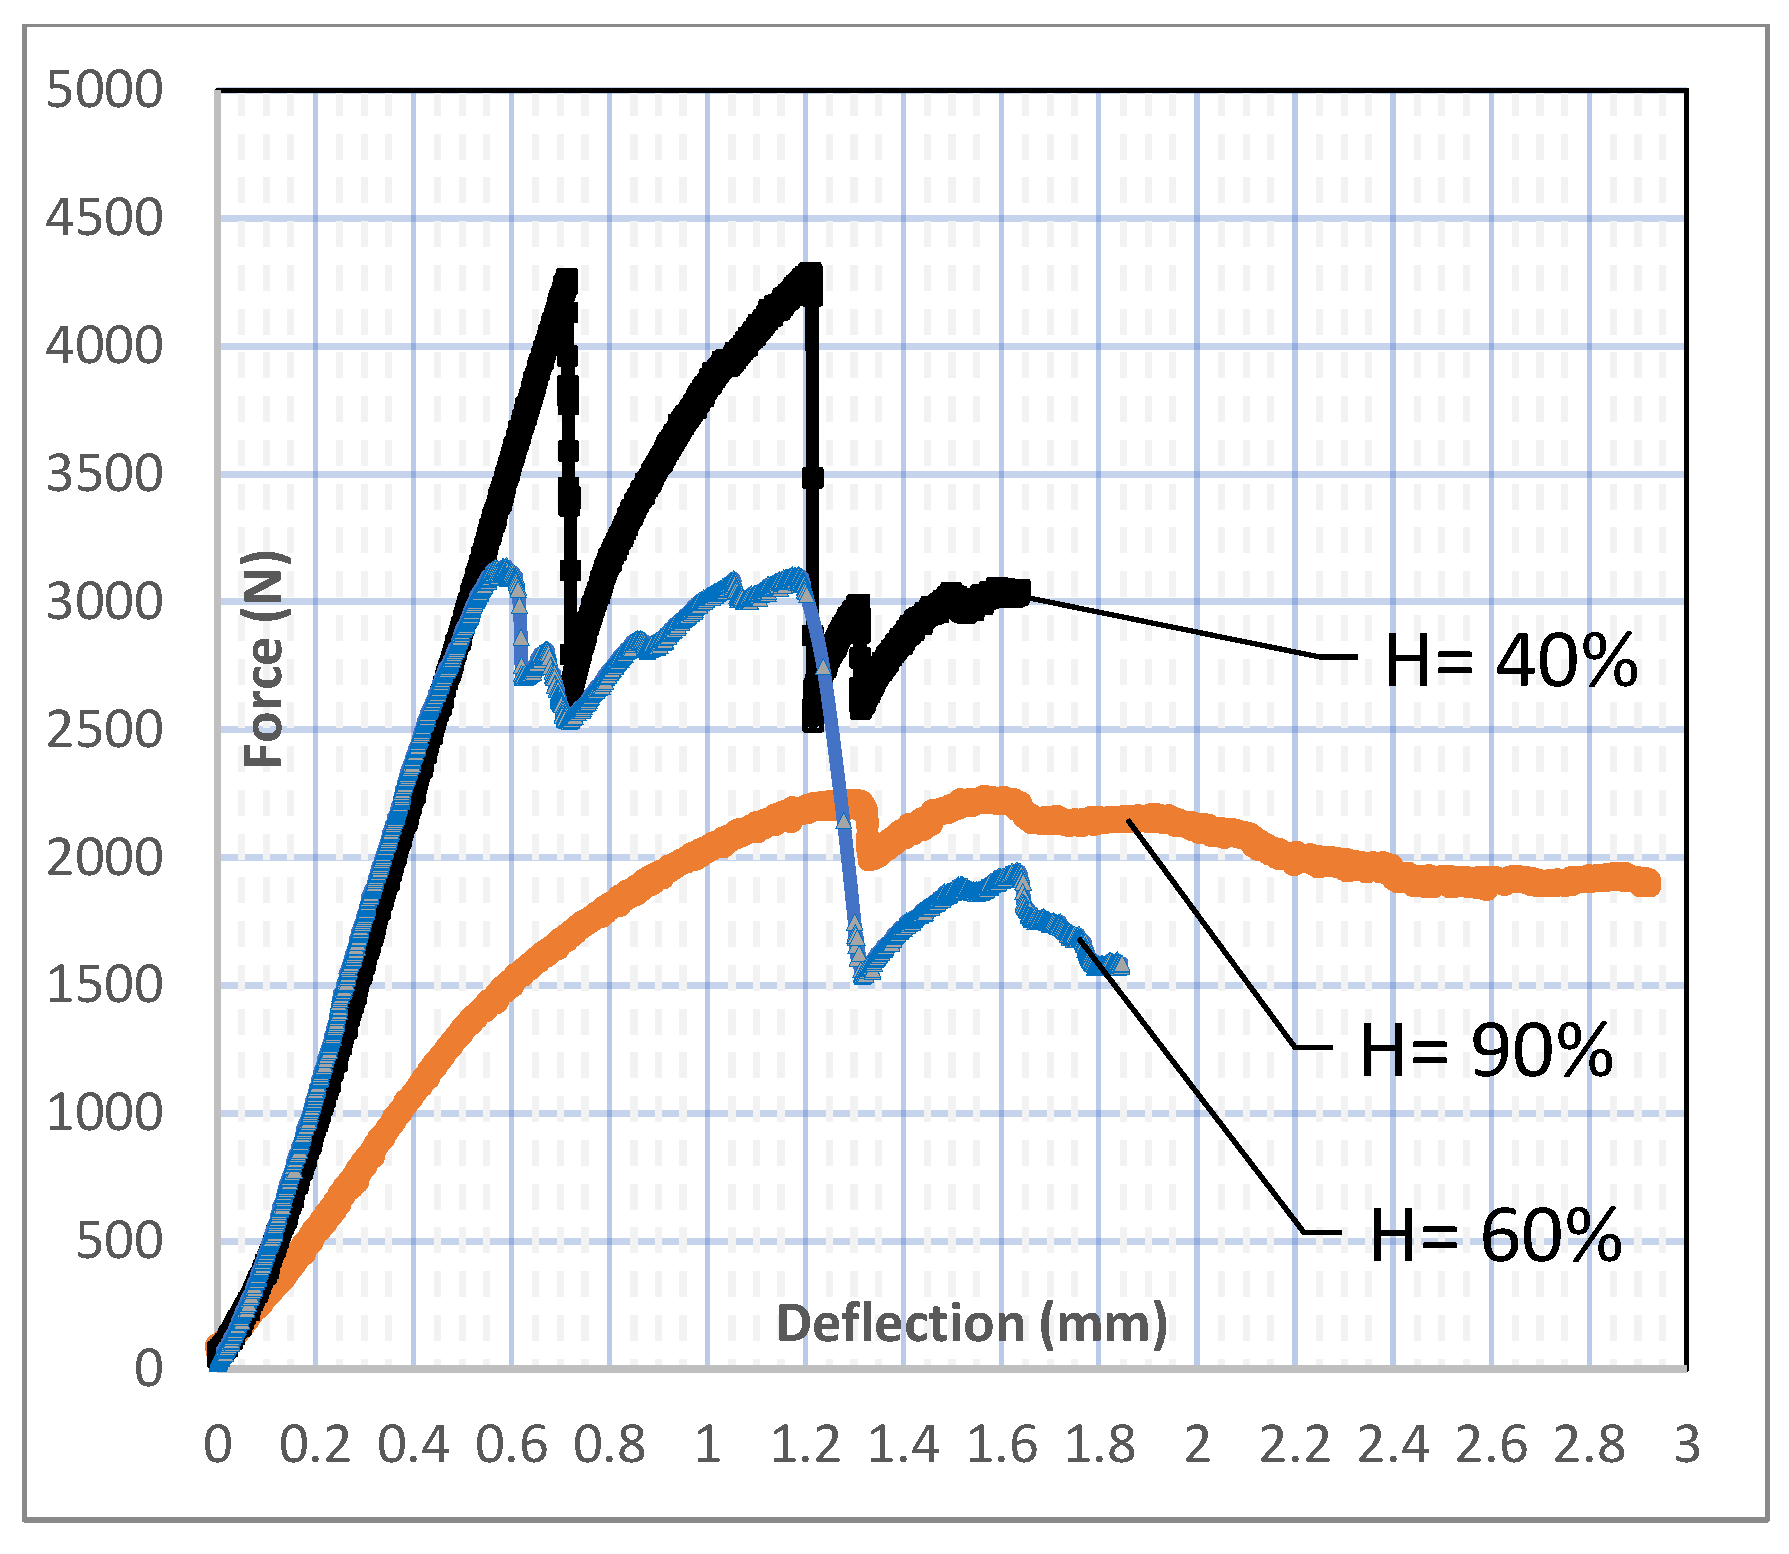
Figure 11.
Force–deflection (3-point test); local failure does not happen in a few S-40-3 samples. Samples were exposed to T = 20 °C for three and seven days. Original conditions: T = 20 °C and H = 60%. Only in a few samples did cracks occur in the middle.
Figure 11.
Force–deflection (3-point test); local failure does not happen in a few S-40-3 samples. Samples were exposed to T = 20 °C for three and seven days. Original conditions: T = 20 °C and H = 60%. Only in a few samples did cracks occur in the middle.

Publisher’s Note: MDPI stays neutral with regard to jurisdictional claims in published maps and institutional affiliations. |
© 2022 by the authors. Licensee MDPI, Basel, Switzerland. This article is an open access article distributed under the terms and conditions of the Creative Commons Attribution (CC BY) license (https://creativecommons.org/licenses/by/4.0/).
Share and Cite
MDPI and ACS Style
Rajabipour, A.; Javadian, A.; Bazli, M.; Masia, M. Interlaminar Shear Properties of Bamboo Composite for Structural Applications. Fibers 2022, 10, 59. https://doi.org/10.3390/fib10070059
AMA Style
Rajabipour A, Javadian A, Bazli M, Masia M. Interlaminar Shear Properties of Bamboo Composite for Structural Applications. Fibers. 2022; 10(7):59. https://doi.org/10.3390/fib10070059
Chicago/Turabian StyleRajabipour, Ali, Alireza Javadian, Milad Bazli, and Mark Masia. 2022. "Interlaminar Shear Properties of Bamboo Composite for Structural Applications" Fibers 10, no. 7: 59. https://doi.org/10.3390/fib10070059
Note that from the first issue of 2016, this journal uses article numbers instead of page numbers. See further details here.