
Influence of Particle Size on the Mechanical Properties of Single-Layer Particleboards
Johann Heinrich von Thünen Institute, Federal Research Institute for Rural Areas, Forestry and Fisheries, Institute of Wood Research, 21031 Hamburg, Germany
*
Author to whom correspondence should be addressed.
Fibers 2024, 12(4), 32; https://doi.org/10.3390/fib12040032
Submission received: 20 December 2023
/
Revised: 5 March 2024
/
Accepted: 12 March 2024
/
Published: 2 April 2024
Abstract
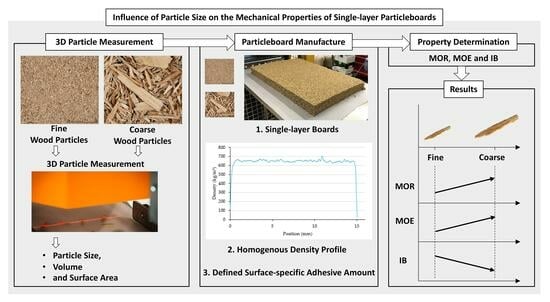
:While most of the influences on the mechanical properties of particleboard appear to have been investigated, there is a lack of knowledge about the influence of particle size or particle dimensions due to the absence of a suitable particle measuring technique. The introduction of laser-based 3D scanning technology makes it possible to automatically determine the dimensions, surface area, and volume of particles. In this study, the influence of particle size on the mechanical properties of particleboards was investigated. To isolate potentially overlapping influences, single-layer particleboards with a uniform density profile were produced and analyzed. The amount of adhesive specific to the surface of the (fine) face layer particles and (coarse) core layer particles was adjusted utilizing 3D scanning of the surface areas to ensure comparability despite changes in particle size. It was found that with increasing particle size, the modulus of rupture (MOR) and modulus of elasticity (MOE) increase, while the internal bond strength (IB) decreases. It is considered whether these effects result from a particle-size-dependent orientation of the particles in the board. Furthermore, it is shown that all the aforementioned properties increase with increasing surface-specific adhesive amounts. Examples are provided to demonstrate how such fundamental relationships can be utilized to enhance the particleboard production process.
1. Introduction
With an annual global production volume of 105.3 million m3 in 2022 [1], particleboard represents a fundamental wood-based composite material in commercial applications. Its widespread use in the furniture and construction industries highlights its importance as a cost-efficient alternative to solid wood and plywood. The production of particleboard involves a complex process, wherein the preparation of wood particles plays a substantial role and contributes significantly to the total production costs [2]. Understanding the influence of particle dimensions is essential, as they affect board properties [3]. Therefore, comprehending the impact of particle size on board properties is of significant importance for optimizing production processes in terms of efficiency and ensuring consistent quality.
While the variables that influence the properties of particleboard appear to have been widely investigated, there are inevitable gaps in the knowledge of the influence of particle dimensions. The primary reason for this limitation is that, to date, particle dimensions have been assessable only through undifferentiated sieve analysis to an insufficient extent using 2D image analysis or with immense personnel expenditure through manual individual measurements. In the case of 3D image analysis based on free-falling particles, different results are obtained for repetitively measured particles depending on their orientation to the cameras. Previous research approaches shared a common limitation in that their test setups did not enable an isolated examination of the effect of particle dimensions, despite a fundamental absence of appropriate particle measurements. Their results are therefore obscured by parameters that have well-known influences on board properties. These are board density [4,5,6], distinctive density profile [7], multi-layered board structure (different particle sizes in face and core layer), obvious particle-size distribution perpendicular to the board plane, adhesive content (AC) [3] (pp. 786–789), and surface-specific adhesive amount (SSAA) [2]. For an isolated investigation, these parameters have to be kept constant.
For example, Istek et al. [8] investigated three-layer particleboards with varying particle dimensions in the face and core layers by using different sieve fractions. Due to the production parameters (press temperature: 180 °C; press duration: 190 s), it is likely that the boards possess distinctive density profiles that vary with the applied particle material and thus obscure the influence of the particle size. Furthermore, the inevitable change in the SSAA with variation in the particle dimensions was not taken into account. The bending properties increased with increasing face and core layer particle size. The IB increased with increasing core layer particle size, whereas changing the surface layer particle size did not lead to a significant increase in IB. Niemz and Sonderegger [9] provide insights into the relationship between particle dimensions and board properties, although they provide no details on the chosen experimental setup. They note an increase in the MOR with increasing particle length and a decrease with particle width and thickness. The MOR and MOE increase up to a slenderness ratio (defined as the ratio of length to thickness) of approximately 100. Further, the IB decreases with increasing particle length and width and reaches a maximum at moderate (not defined in detail) particle thicknesses. Arabi et al. [10] investigated single-layer particleboards made of three different sieve fractions of poplar particles and found an increase in the bending properties with an increasing slenderness ratio, while the opposite was found for IB. With the chosen production parameters (press temperature: 180 °C; press duration 5 min), the particleboards must have had a distinctive density profile and therefore were unsuitable for assessing the isolated influence of particle size. Arabi et al. [11] obtained similar results for the relationship between the slenderness ratio and the mechanical properties of particleboard by applying the response surface method. Post [12] analyzed boards made of particles with varying dimensions and a constant SSAA (but a distinctive density profile due to a press temperature of 135 °C and a press duration of 15 min) and found an increase in the bending properties with an increasing slenderness ratio of up to 300. In contrast, Kitahara and Kasagi [13] found an increase in the bending properties with decreasing particle size while investigating boards made of particles of proportionally different sizes (uniform shape), keeping the SSAA constant. Kimoto et al. [14] made single-layer particleboards of particles of different sizes and with a distinctive density profile (press temperature: 130 °C; press duration: 18 min) without keeping the SSAA constant. They found an increase in the MOR and a decrease in the IB when increasing the slenderness ratio up to 100.
In all the described research approaches, the test setups did not allow an investigation of the isolated influence of the particle size. Therefore, the main aim of the present study was to investigate the isolated influence of the particle size on the mechanical properties of particleboard without the overlapping effects of the following:
- A multi-layered board structure (different particle sizes in face and core layers);
- A distinctive density profile (perpendicular to the board plane);
- A changing specific amount of adhesive caused by a change in surface area (SSAA).
This was achieved by producing and investigating single-layer particleboards with a uniform density profile and a defined SSAA made from (fine) face layer particles (FLPs) and (coarse) core layer particles (CLPs) obtained from an industrial particleboard manufacturer.
In this paper, a comprehensive investigation into the impact of particle size on particleboard properties is presented. The recently developed 3D Particleview (Fagus-GreCon Greten GmbH & Co. KG (GreCon), Alfeld, Germany) measurement technology is used, which automatically determines the dimensions, surface, and volume of particles and enables one to calculate the material-specific surface area (mm2/g) and, thus, the SSAA (g/m2). The MOR and MOE were found to increase with increasing particle size, while the opposite applies to the IB. Such data regarding basic correlations are crucial for process optimization.
2. Materials and Methods
2.1. Wood Particles and Adhesive
The wood particles used in this study were FLPs and CLPs supplied by the particleboard manufacturer Pfleiderer Deutschland GmbH, Neumarkt, Germany. They were taken from the material flow after drying and before gluing.
The FLPs were sieved in preparation for the measurement by using an Allgaier TSM 600/3 sieve machine (Allgaier-Werke GmbH, Uhingen, Germany) with a sieve insert of 1 mm mesh size. The particles were dried in a laboratory convection dryer at 103 °C to a residual moisture content (MC) of approximately 1% and packed in airtight polyethylene bags for intermediate storage.
The adhesive used was urea formaldehyde (UF) adhesive with 66% solid content, a pH of 7.5 to 9, viscosity of 400 to 600 mPa·s (at 20 °C), and a gel time of 40 to 60 s (at 100 °C). An ammonium nitrate solution with 40% solid content was used as the hardener.
2.2. Determination of Particle Moisture Content
The particle moisture content (MC) was determined by using a thermogravimetric moisture analyzer Sartorius MA 35 (Sartorius AG, Göttingen, Germany).
2.3. Three-Dimensional Particle Measurement
To determine the particle dimensions, the particle surface and the particle volume, an automated laser scanner (3D Particleview (GreCon)) with version 1.0.0.0 of the software was used. The resolution of the measuring device is 0.1 mm in length and width and 0.02 mm in thickness. Thus, to ensure a reliable measurement, the FLPs were sieved. The chosen measurement mask was “min. area 1 mm2”, the conveyor belt speed was set to 15 m/min, the first vibratory feeder was set to 16%, and the second vibratory feeder was set to 45% of the maximum available vibration rate.
FLPs and CLPs were measured by using triple determination. Each measuring run weighed approximately 5 g for FLPs. To ensure that a similar number of particles was measured for CLPs, a weight of 24 g was selected based on the number of particles per gram.
In addition to measuring particle length, width, thickness, and surface, the slenderness ratio (length divided by thickness), width ratio (length divided by width), and flatness (width divided by thickness) were calculated for each individual particle. The mean values are provided in Section 3.
2.4. Calculation of SSAA
The SSAA was calculated on the basis of the dry particle mass, the AC (mass of solid adhesive in relation to dry particle mass), and the surface area per gram (dry particles), following Equation (1),
while the surface area per gram was calculated as the quotient of surface area and dry particle mass.
SSAA = (dry wood mass × AC)/surface area per gram,
2.5. Mat Center Temperature Measurement
Thermocouples were used to check the temperature at the center of two additional test boards, one made from FLPs and the other made from CLPs. Three thermocouples were placed at the center of each test board during scattering. The mat temperature was documented during pressing by using the laboratory hot press’s integrated data logger. This allowed for verification that the adhesive was fully cured and the particle mat center had reached a minimum temperature of 100 °C.
2.6. Particleboard Manufacturing
Single-layer particleboards were produced using a computer-controlled laboratory hot press, Siempelkamp Typ 2 (G. Siempelkamp GmbH & Co. KG, Krefeld, Germany). The target density of the boards conditioned at 20 °C and 65% relative humidity (RH) was 650 kg/m3. The target board thickness was 15 mm. The target MC of the particle mat (mass of water in relation to dry mass of particle mat) was 7.1%. The AC varied from 8 to 5.3 and 12.2%; the corresponding SSAAs were 8.2 and 12.5 g/m2 (see Table 1). Before application, 6% hardener (mass of solid content in relation to dry particle mass) was added. Gluing of the particles was conducted by using a portable concrete mixer (Atika Maschinenfabrik Wilhelm Pollmeier GmbH & Co., Ahlen, Germany) with a drum diameter of 600 mm. The adhesive was transported through a silicone hose from the beaker to the nozzle (Schlick Mod. 940/5 0.8 mm W38558 (Düsen-Schlick GmbH, Untersiemau/Coburg, Germany)) with an orifice of 1.8 mm by using a Watson-Marlow 323 peristaltic hydraulic pump (Watson-Marlow GmbH, Rommerskirchen, Germany). The glue was applied by using a pressure of approximately 5 bar onto the falling stream of particles at the center of the rotating drum. The amount of additional water was calculated with regard to particle moisture content and added with an atomizer before applying the adhesive to the particles in the rotating drum. The particle MC was unified in this manner, rather than by adding water to the adhesive beforehand, ensuring a uniform viscosity during all tests. Furthermore, by scattering the particle mat in excess, the desired density was achieved despite the mat’s lateral deflection during the pressing process.
The particles were weighed and scattered in a forming mold of 585 × 400 mm positioned on an aluminum caul plate covered with siliconized paper to prevent adherence between the board and caul plates. The finished scattered particle mat was pre-compacted before the forming mold was removed. After removing the forming mold, the particle mat was covered with a second siliconized paper and transferred to the laboratory hot press.
In order to obtain particleboards with a uniform density profile, the cold particle mat was compacted to a thickness of 15 mm with a closing time of 30 s and a pressure limited to 230 bar in the hot press. During the following 60 min, the distance was kept constant at a pressure limited to 120 bar, while the press temperature was steadily increased to 120 °C. After hot pressing, the boards were cooled at ambient conditions, edge-trimmed to 515 × 330 mm, and then stored in a climate chamber at 20 °C and 65% RH before sample cutting.
2.7. Test Specimen Preparation
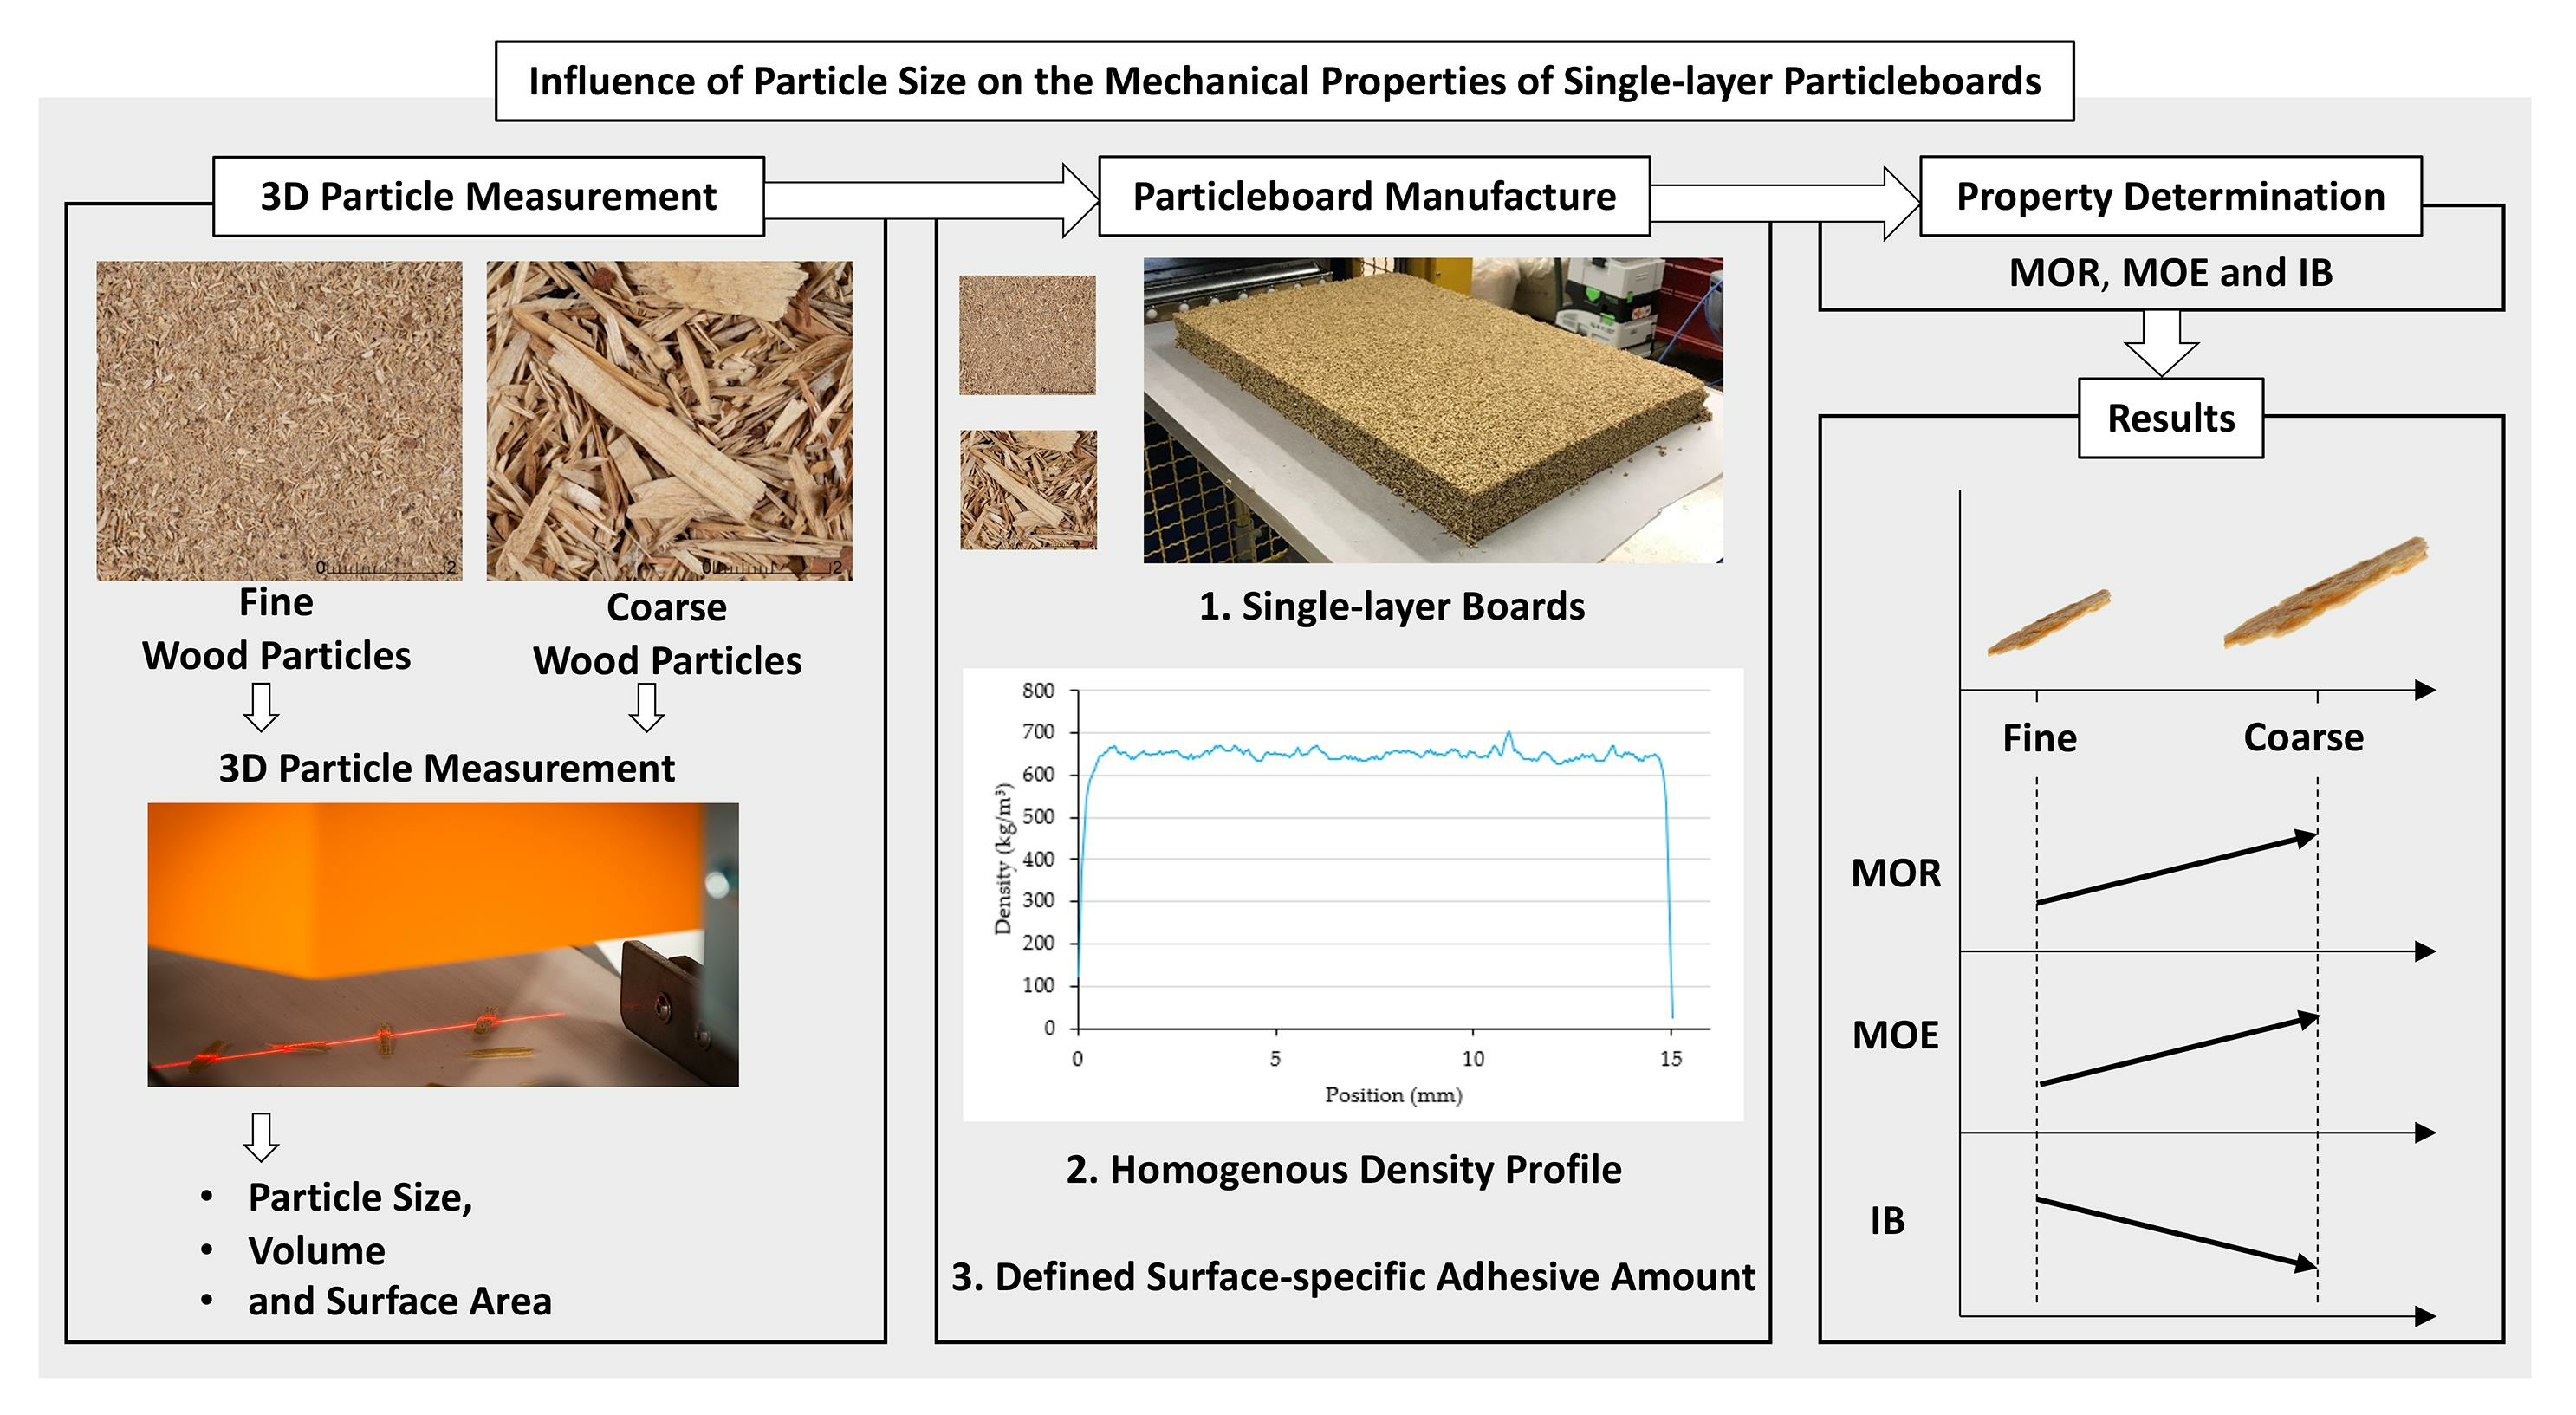
According to the cutting plan shown in Figure 1, for BT 1 to BT 4,
- Six test specimens were cut ((350 × 50 × 15) mm) for MOR and MOE determination;
- Twelve test specimens were cut for ((50 × 50 × 15) mm) the determination of the IB.
Between cutting and testing, the test specimens were stored in a climate chamber at 20 °C and 65% RH.
To confirm that the board preparation process yields boards with uniform density profiles, three samples measuring 50 × 50 × 15 mm were cut from each board. The samples were taken from the edges of the examined bending specimens, and density scans were performed.
2.8. Board Density Determination
The board density was determined according to [15].
2.9. Density Profile Determination
Density profiles (density distribution perpendicular to the board plane) were determined using a Dense-Lab X laboratory density scanner (Electronic Wood Systems GmbH, Hameln, Germany) with the resolution set to 20 (0.36 mm/s).
2.10. Horizontal Density Distribution
The distribution of the density in the horizontal direction of the board was determined by calculating the bulk densities of all bending and IB test specimens for each test board. The absolute value of the deviation (AVD) from the mean value of the tested specimens per test board was set in relation to the mean value (of all test specimens per board) and given as a percentage, following Equation (2).
Density deviation = (AVD/Mean value) × 100
2.11. MOR, MOE, and IB Determination
2.12. Experimental Design
Four types of board, each produced in triplicate, were manufactured. The boards were composed of varying particle materials (FLPs, CLPs) and SSAAs (8.2 g/m2, 12.5 g/m2) (see Table 1). For board type (BT) 1, the SSAA calculation was based on the surface area of the CLPs along with an AC of 8%. Similarly, for BT 2, the SSAA calculation was based on the surface area of FLPs and an AC of 8%. The AC for BT 3 was calculated by using the SSAA of BT 1, in combination with the surface area of FLPs. Similarly, the AC for BT 4 was calculated by using the SSAA of BT 2, along with the surface area of CLPs, in accordance with Equation (3):
AC = ((SSAA × surface area per gram)/dry particle mass)/100
The FLPs served as a particle material with a small particle size, and the CLPs served as a particle material with a large particle size.
In order to investigate the influence of particle size on the board properties, the SSAA of BT 1 (CLP) selected was the same as that of BT 3 (FLP), and that of BT 4 (CLP) was the same as that of BT 2 (FLP). The different surface areas of the particle materials resulted in different ACs.
From the combined consideration of the board properties of BT 1 and BT 3, as well as BT 2 and BT 4, the influence of particle size on the board properties can be deduced since, in addition to the density, the SSAA was kept constant.
From the consideration of BT 1 and BT 4, as well as BT 2 and BT 3, the influence of the SSAA can be derived since the particle size was kept constant.
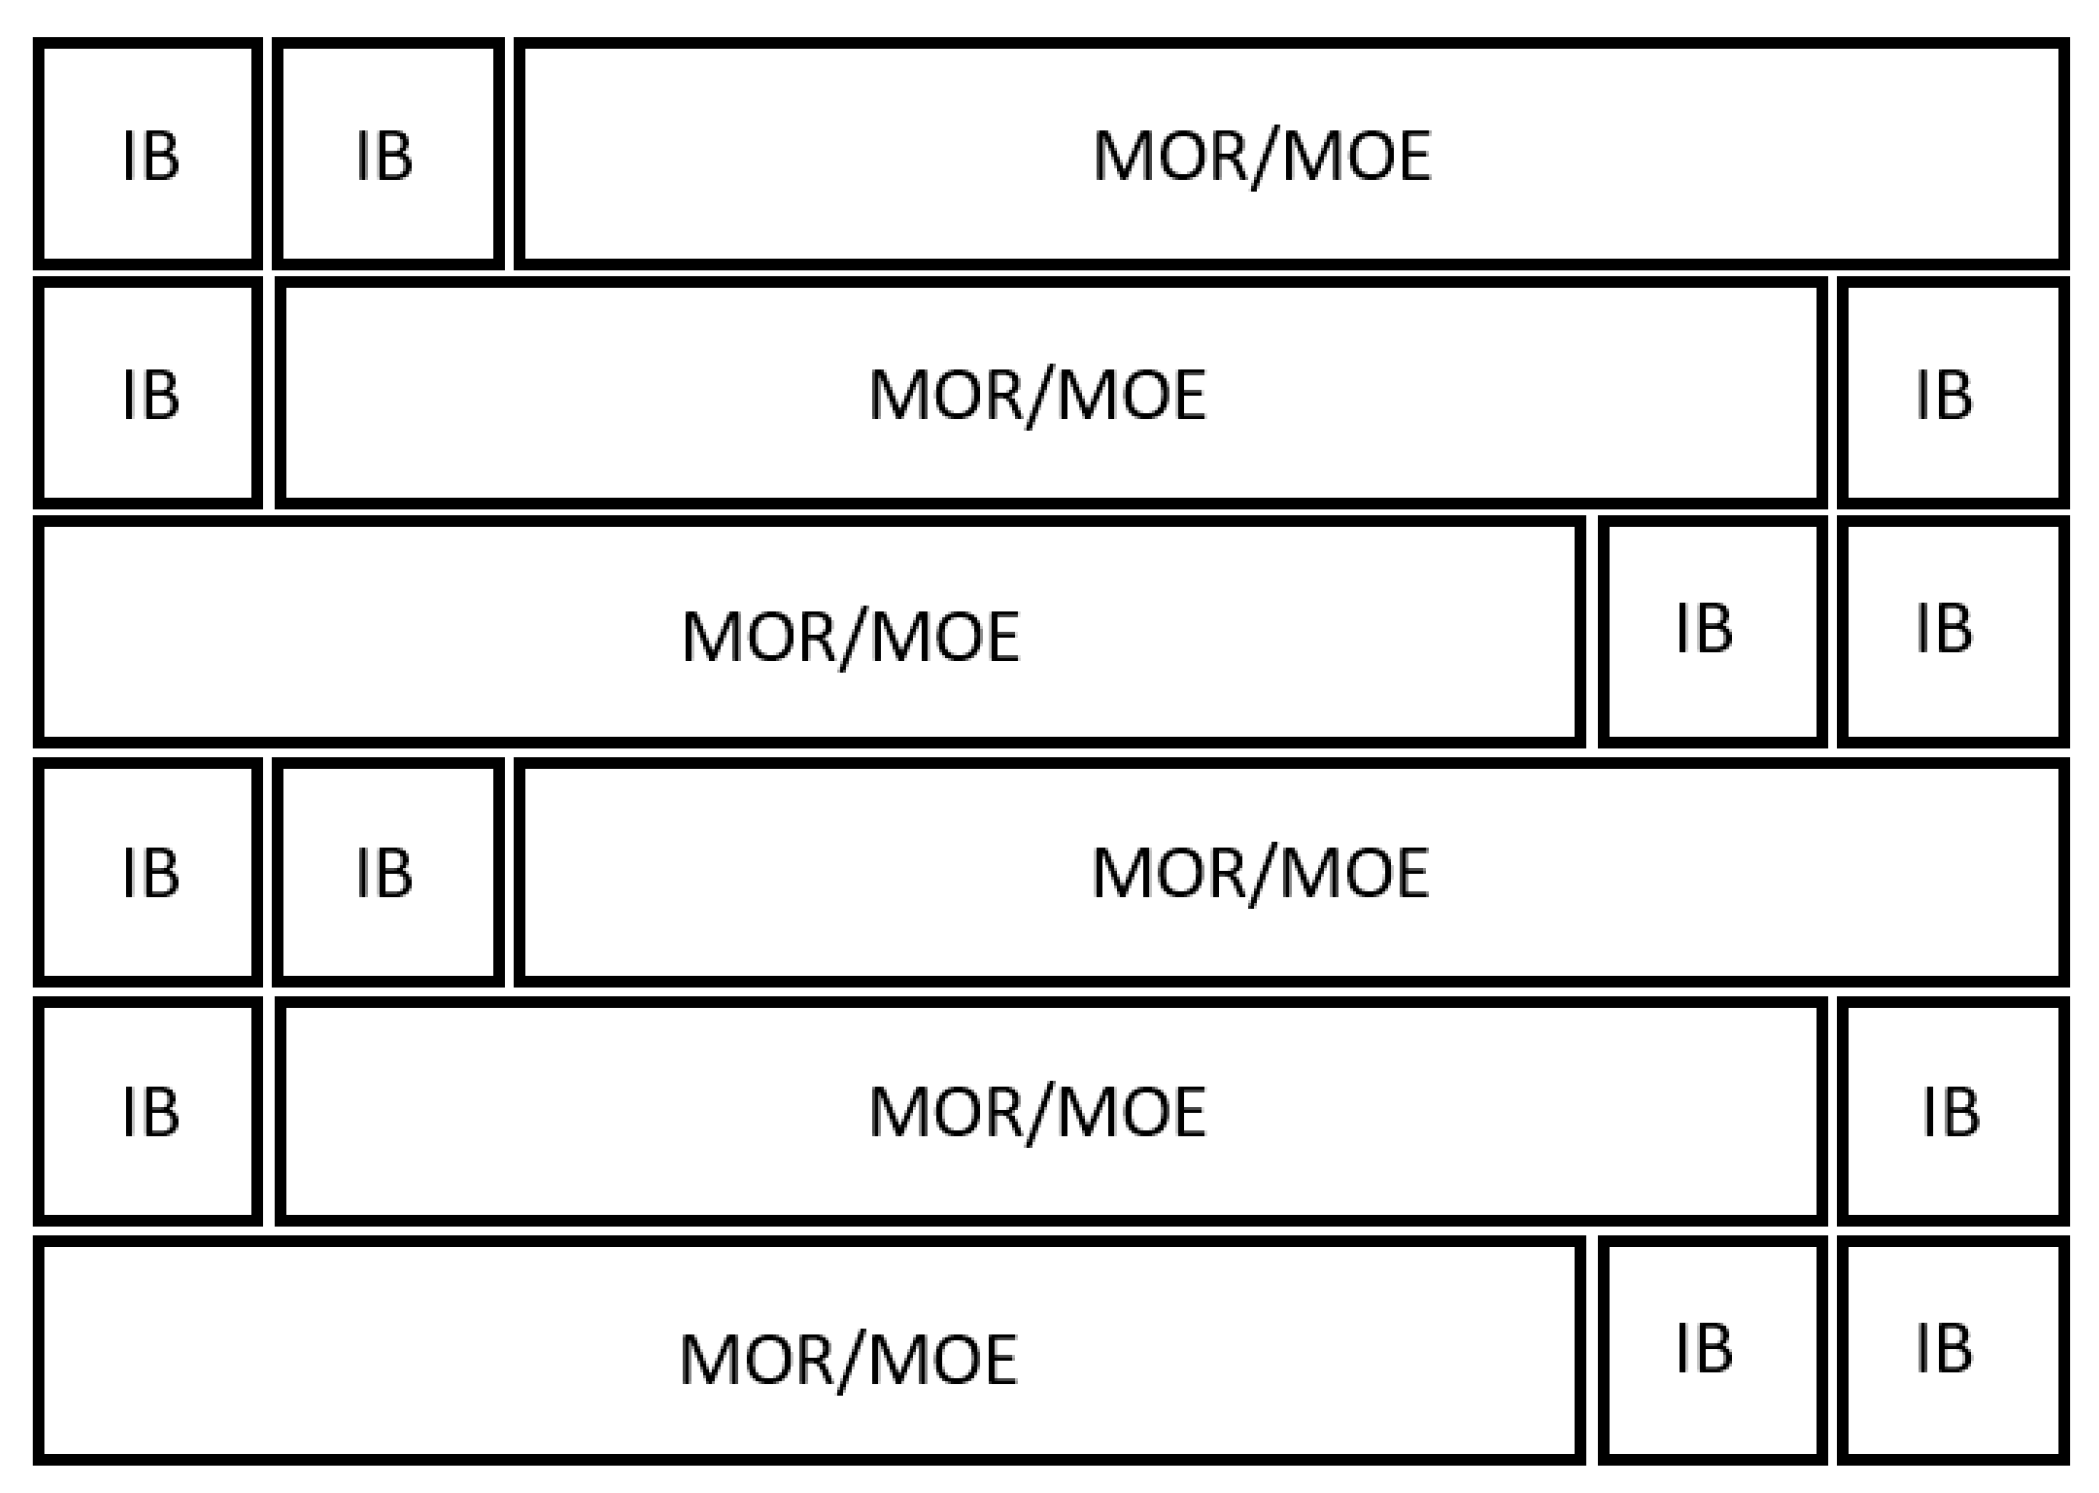
2.13. Statistical Analysis
Statistical analysis and graphical representation of the experiments were carried out by using the JMP 16 analysis tool (SAS, Cary, NC, USA) and Microsoft Excel 2021 (Microsoft Corporation, Redmond, DC, USA), respectively.
Each dataset was checked for extreme outliers by applying the interquartile range (IQR) method, with the IQR being the difference between the third quartile (Q3 or 75% quantile) and the first quartile (Q1 or 25% quantile). As the lower criterion for defining an extreme outlier, the first quartile minus the triple IQR (Q1 − 3 IQR) was used; as the upper criterion for defining an extreme outlier, the third quartile plus the triple IQR (Q3 + 3 IQR) was used. In the case of a detected extreme outlier, all data available for this test specimen were excluded from the evaluation.
2.14. Shift of Data to Targeted Board Density
Between excluding extreme outliers and conducting further statistical evaluation, the values for the mechanical board properties were adjusted to match the target density. This was achieved by calculating a linear regression between specimen density and strength, which was then applied to each board type to bring the corresponding strength to the level matching the board’s target density (Equation (4)).
Adjusted property = ((Target density − Achieved density) × Slope) + Property
3. Results
3.1. Three-Dimensional Particle Measurement
Table 2 presents the results of the 3D particle measurement. Regarding FLPs, in total, 52,306 particles were measured, while there were 59,024 CLPs. For the FLPs, the mean length, width, and thickness are 2.0, 0.9, and 0.23 mm; for the coarser CLPs, they are 3.6, 1.1, and 0.33 mm. The mean slenderness ratio, width ratio, and flatness are 10.1, 2.4, and 4.4 for the FLPs and 12.9, 3.4, and 4.0 for the CLPs. Compared to the CLPs, the FLPs have a higher surface area per gram (9734 versus 6389 mm2/g).
3.2. Verification of Press Program Suitability and Board Characteristic Achievement
Both the FLPs and the CLPs required a maximum of 53 min for the mat center temperature to reach 100 °C (the maximum value recorded by the six thermocouples).
The greatest percentage density deviation was located in an IB test specimen at the very edge of board 1 of BT 1 with a deviation of 13.7%. The mean density deviation for each test board varied from 1.6% (board 2 of BT 3) to 4.6% (board 2 of BT 1).
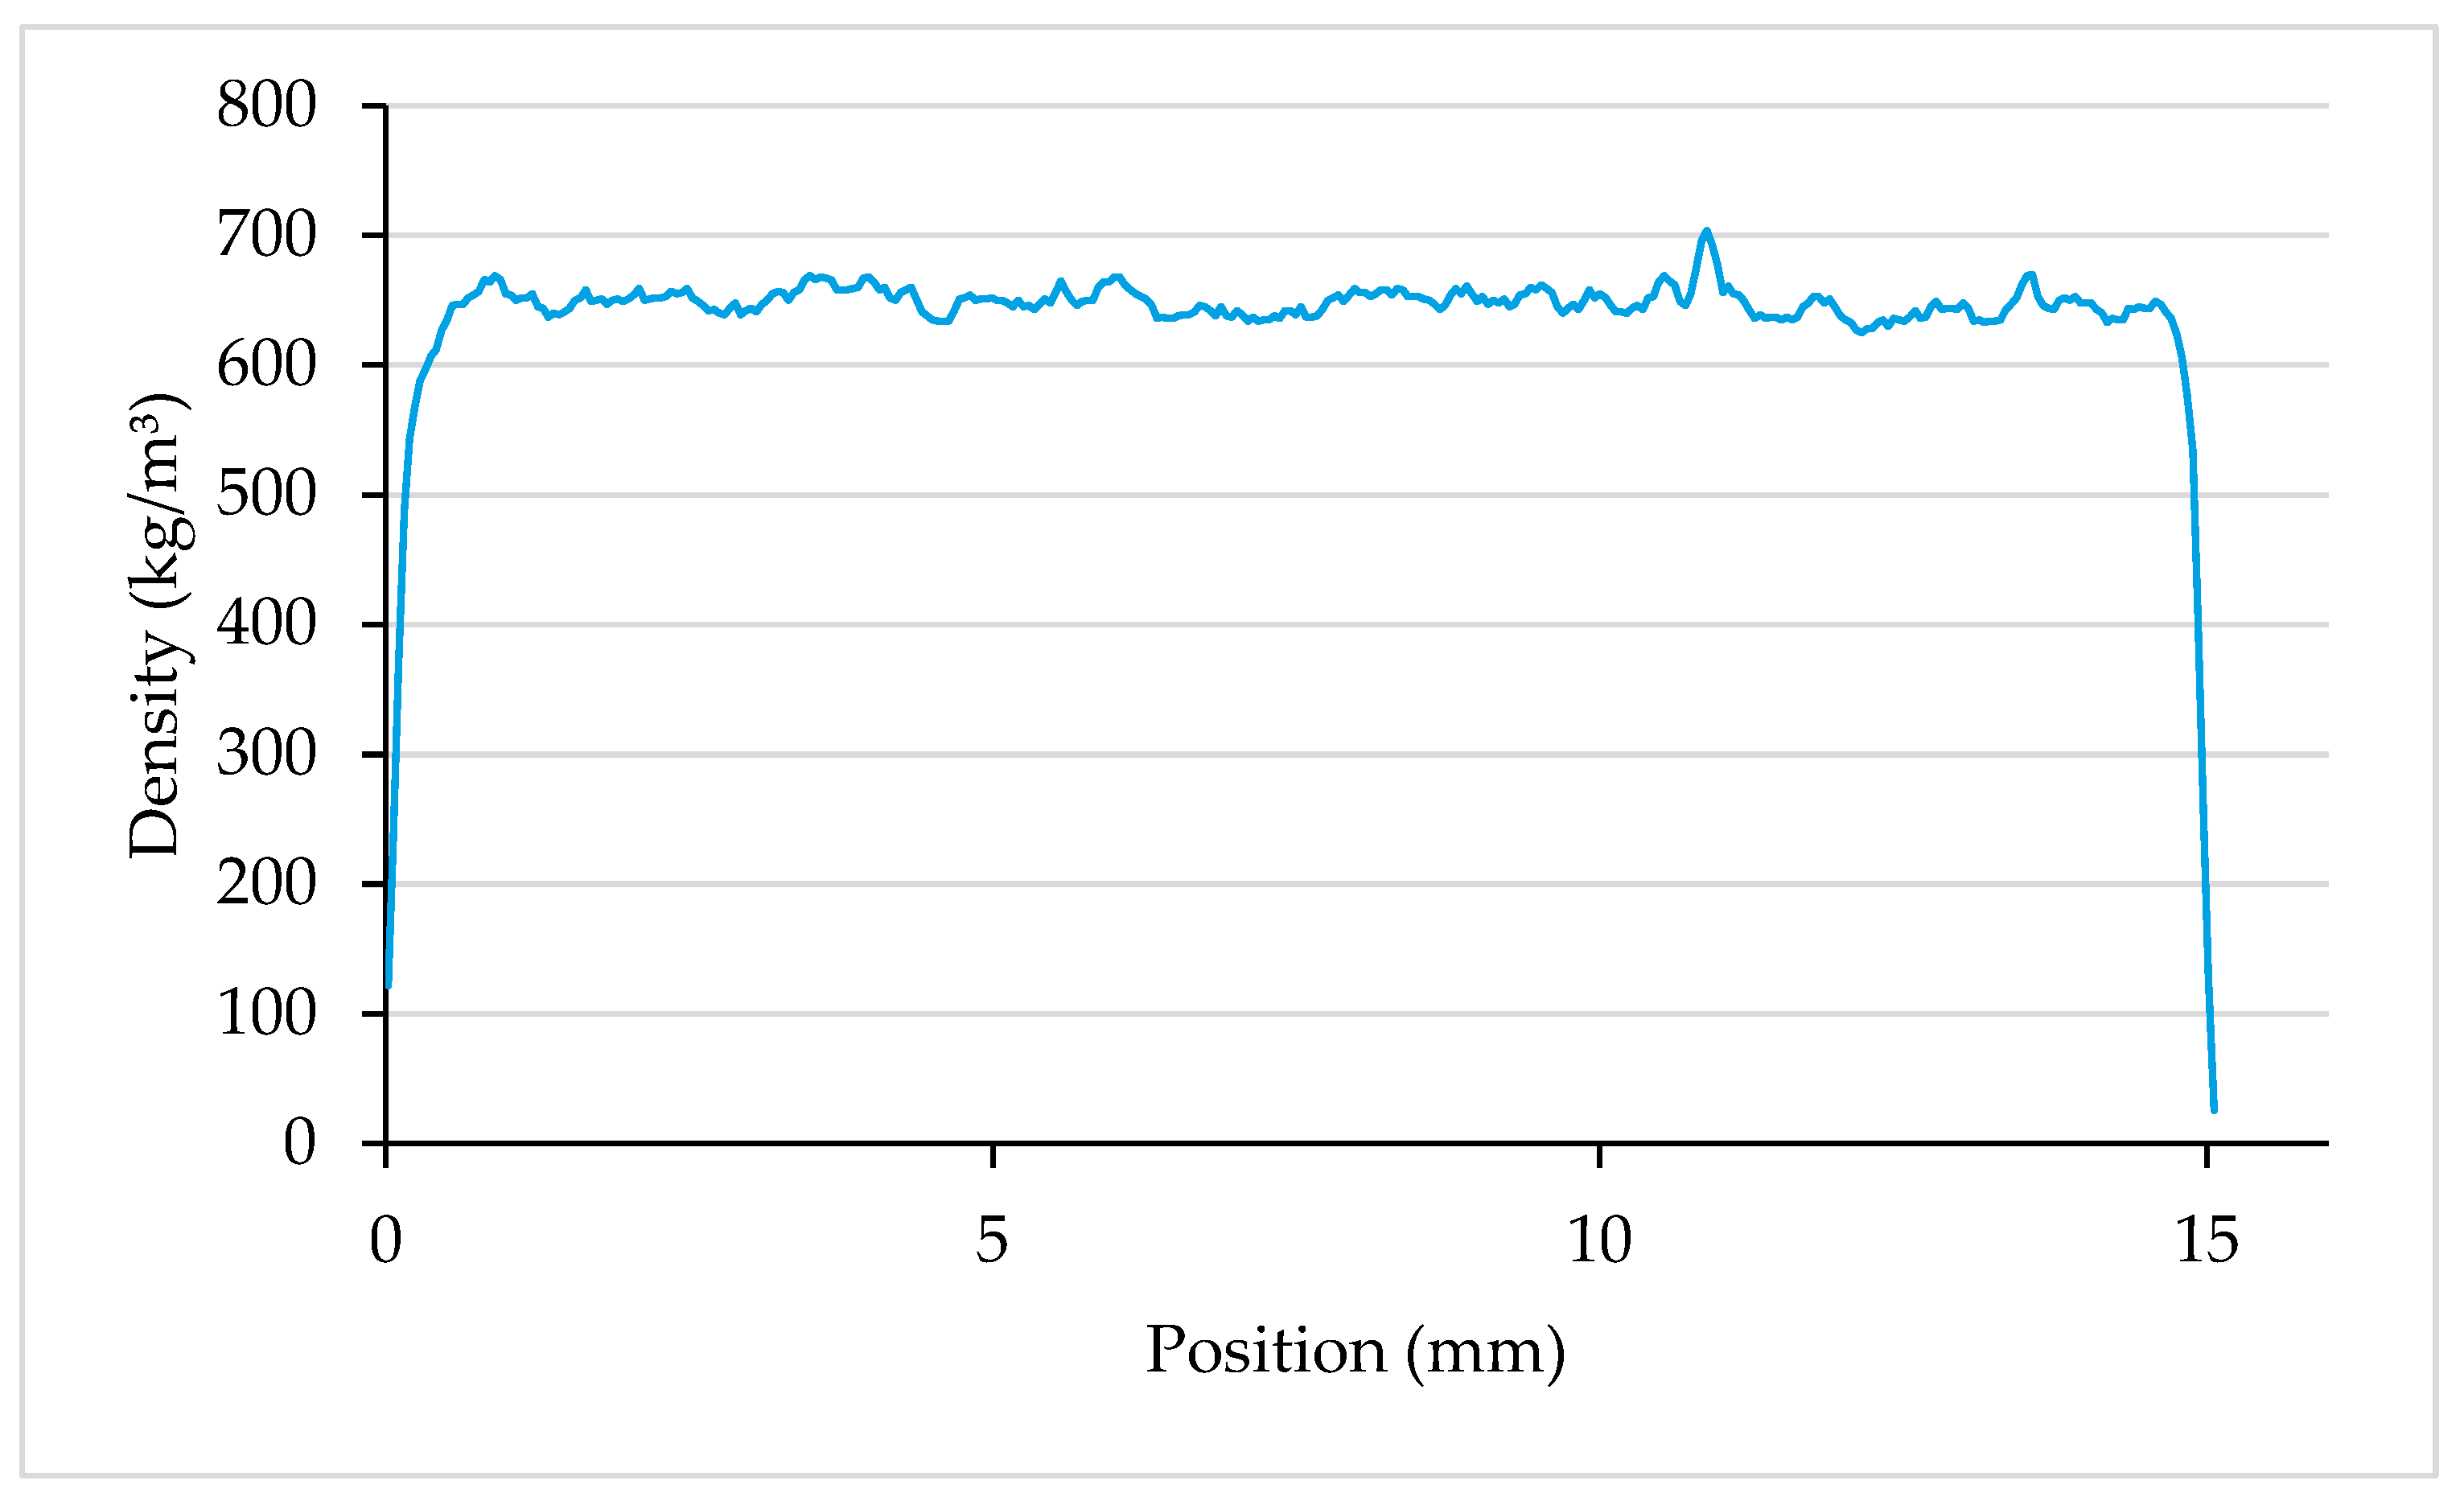
Figure 3 shows an exemplary density profile of an FLP board. In all cases, the intended uniform density profile was achieved.
3.3. Main Experiments
No extreme outliers were detected in any of the considered datasets following IQR outlier detection. Since density-compensated mean values were considered for further evaluation, density data are given in the Supplementary Materials.
Table 3 presents the outcomes of the bending and internal bond tests conducted on BT 1, BT 2, BT 3, and BT 4. For the properties shown, a comparative assessment of the mean values between the individual boards for each board type is provided in capital letters. Statistically significant differences exist between the mean values annotated with different letters.
A comparison of the mean MOR of individual boards of the same board type showed no statistically significant differences. The mean MOEs showed statistically significant differences between the individual boards of BT 1 and BT 4, while the mean IBs are statistically different between the individual boards of BT 1, BT 2, BT 3, and BT 4. To be able to make a more reliable statement about the influence of particle size and SSAA on the mechanical properties, the mean values for each board type are used as follows.
In addition to the mean values for the mechanical properties of each board type, Table 4 presents the results of pairwise mean value comparisons on the influence of particle size and SSAA on MOR, MOE, and IB. The mean values for MOR, MOE, and IB vary significantly between the different board types depending on the particle material and SSAA.
A comparison between BT 3 and BT 1 shows the influence of particle size, as both have an identical SSAA of 12.5 g/m2 but are made from fine and coarse particles, respectively. The fine FLP board BT 3 shows a significantly lower MOR and MOE than the coarse CLP board BT 1. The opposite was observed for the IB. For BT 3, the values for MOR, MOE, and IB are 7.2 (±4%), 1212 (±2%), and 1.30 (±6%) N/mm2, respectively. In contrast, for BT 1, the values are 10.0 (±5%), 1635 (±3%), and 0.85 (±5%) N/mm2. The same coherences are found by comparing BT 2 and BT 4, both of which were produced with a constant SSAA of 8.2 g/m² while varying the material from FLPs to CLPs.
A comparison of BT 2 and BT 3, which are both FLP boards but were produced with SSAAs of 8.2 g/m2 and 12.5 g/m2, respectively, shows the influence of the SSAA on the mechanical properties. BT 2, produced with an SSAA of 8.2 g/m2, has a statistically significantly lower MOR, MOE, and IB compared to BT 3, produced with an SSAA of 12.5 g/m2. For BT 2, the MOR, MOE, and IB are 6.9 (±3%), 1162 (±2%), and 1.01 (±5%) N/mm2, while for BT 3, they are 7.2 (±4%), 1212 (±2%), and 1.30 (±6%) N/mm2. The same statistically significant coherences were found when comparing BT 4 and BT 1, both made of CLPs, when changing the SSAA from 8.2 to 12.5 g/m3.
4. Discussion
The main aim of this study was to investigate the isolated influence of particle size on the mechanical properties of particleboards by excluding confounding effects of other influencing variables.
For both a low (8.2 g/m2) and high (12.5 g/m2) SSAA, the MOR and MOE increased with a change in particle size from fine to coarse. The opposite applies for the IB, even if the (mass-specific) AC is kept at a constant level of 8%, which even equates to a higher SSAA for CLPs. Consequently, it appears that coarse particles are beneficial for a high MOR and MOE, while fine particles are advantageous for a high IB.
The correlation between particle size and bending properties seems plausible, as can be easily understood by comparing the particle sizes and bending properties of oriented strand board (OSB) and particleboard. The results of the IB are less easy to interpret, considering that Sackey et al. [19] found that the admixture of coarse particles in the core layer leads to an increased IB. It is, therefore, possible that the relationship between particle size and IB is influenced by another variable, for example, the particle shape and presumably, in consequence, particle orientation.
From the particle measurements, one can determine to what extent the dimensions of the surface and core layer particles differ from each other (see Table 2). Based on these data, the ratios of dimensions to each other (length to width to thickness) can be calculated and specified as follows:
- FLPs: 1 to 0.5 to 0.1;
- CLPs: 1 to 0.3 to 0.1.
The following values of slenderness ratios, width ratios, and flatness, respectively, were obtained:
- FLPs: 10.1, 2.4 and 4.4;
- CLPs: 12.9, 3.4 and 4.0.
It can be seen that the particle sizes in the present study were not varied with a constant particle shape, as was the case in [13], but the dimensions were varied disproportionately to each other. It is conceivable that this leads to a different orientation of the particles in the board and obscures the effects of the particle size.
It can be further assumed that coarse particles, due to their higher slenderness ratio, tend to be oriented parallel to the board plane during scattering. Fine, more cubic particles with a lower slenderness ratio tend to be oriented more randomly and are also perpendicular to the board plane. According to Niemz and Wenk [20], the longitudinal wood anatomical direction is predominantly oriented parallel to the longitudinal axis of the particles, which leads to the highest strength properties in the axial direction. This fact, together with the aforementioned shape-dependent orientation of the particles during scattering, could explain the increase in bending properties with increasing particle size and also the increase in the IB with decreasing particle size. In both cases, the particles are predominantly strained in the axial direction. However, this theory is only valid if the break occurs in the wood and not in the adhesive joint, which has not been investigated in the present study. The aforementioned approach could be substantiated by May [21], who found increased IB values when particles are oriented vertically in the core layer.
Further, an increase in all investigated board properties (MOR, MOE, IB) was found when increasing the SSAA from 8.2 g/m2 to 12.5 g/m2 within one material type (FLPs or CLPs, respectively). This reflects the well-known (positive) correlation between AC and board properties. The increase in MOE, MOR, and IB with increasing SSAA can be attributed to the availability of more adhesive in relation to the particle surface, resulting in better interconnection between the particles.
Many existing studies have (unwittingly) investigated not the influence of particle size, but rather the influence of the SSAA. This is because the AC was kept constant for particles of different sizes; hence, the SSAA was unintentionally changed. If, for example, the particle size is increased while the AC is kept constant, the total particle surface decreases and the SSAA increases, which—as shown by the presented results—leads to an increase in all considered board properties.
A comparison of this study’s results with prior studies has proven challenging due to this fact. However, if the different methodologies are disregarded, similarities can be observed. For example, various studies have shown a correlation between an increase in bending properties and either an increase in particle size [8] or an increase in slenderness ratio [9,10,11,12,14]. Other studies similarly found an increase in the IB with a decrease in the slenderness ratio [10,11,14]. In contrast, a study on the effect of particle size on bending properties [13] produced results that contradict the results of this study. The partly contradictory results of other studies are presumably due to the different methodologies, which attenuate the comparability.
The basic relationships presented here represent an important basis for the optimization of particleboard processes with regard to cost- and material-efficient production. If, for example, particles with high slenderness ratios are used, boards with conventional properties can be produced with a lower wood input and a lower density. Furthermore, by integrating 3D particle measurements into the process, it may be possible, for example, to counteract poor mechanical board properties because of an unintentional decrease in particle size (e.g., through wear of the knife ring flakers) by increasing the specific amount of adhesive.
Nevertheless, it should be noted that the results presented in this study are valid only for two different particle sizes. Further investigations with multiple fractions would be useful to substantiate the fundamental relationships discussed here. The method presented offers significant benefits, not only in terms of enhancing efficiency but also in predicting board properties. This prediction is possible once the causal link between individual influences and resultant properties is well understood. The approach should be viewed as a significant shift in how the outcomes of property analyses have been historically attributed to numerous overlapping factors. Further research should therefore focus on the impact of particle dimensions, rather than only the impact of particle size, on particleboard properties, given the availability of data from 3D particle measurement techniques.
5. Conclusions
From the present study, the following conclusions can be drawn:
- MOR, MOE, and IB increase when increasing the SSAA from 8.2 g/m2 to 12.5 g/m2 within one material type (FLPs or CLPs, respectively).
- For both a low (8.2 g/m2) and high (12.5 g/m2) SSAA, the MOR and MOE increase with a change in particle size from fine to coarse.
- For both a low (8.2 g/m2) and high (12.5 g/m2) SSAA, the IB decreases with a change in particle size from fine to coarse.
- In the present study, the particle sizes were not varied with a constant particle shape, but the dimensions were varied disproportionately to each other. It is conceivable that varying slenderness ratios, width ratios, and flatness, respectively, can lead to a different orientation of the particles in the board and thus different mechanical properties.
Supplementary Materials
The following supporting information can be downloaded at https://www.mdpi.com/article/10.3390/fib12040032/s1. Excel file: Raw data.
Author Contributions
Conceptualization, N.E. and J.T.B.; methodology, N.E. and J.T.B.; investigation, formal analysis N.E. and J.T.B.; writing—original draft preparation, N.E.; writing—review and editing, N.E., J.T.B. and J.L.; project administration, J.L.; funding acquisition, N.E., J.T.B. and J.L. All authors have read and agreed to the published version of the manuscript.
Funding
This research was funded by the Federal Ministry of Food and Agriculture (BMEL), Bonn/Berlin, Germany, based on a resolution of the German Bundestag (Parliament of the Federal Republic of Germany), administrated by the Fachagentur Nachwachsende Rohstoffe e.V. (Agency for Renewable Resources) (FNR), Gülzow-Prüzen, Germany. The contents of the present paper have been achieved within the research project “Dreidimensionale Partikelvermessung und Prozessintegration in die Spanplattenherstellung” (Three-dimensional particle measurement and process integration in particleboard production), funding code 2220HV090X.
Data Availability Statement
The data presented in this study are included in the article or have been made available through the Supplementary Materials.
Acknowledgments
The authors would like to thank all those colleagues who were engaged in the experimental realization and data analysis, namely, Johannes Beruda (Hamburg University, Hamburg, Germany), Dörte Bielenberg, Lena Falke, Sabrina Heldner, Nora Kalz, Kristin Ploch, Bettina Steffen (all Thünen Institute of Wood Research), and Christina Waitkus (Thünen Institute, Photography).
Conflicts of Interest
The authors declare that they have no conflicts of interest. Due to the formulation of the call for proposals by the project-executing agency, the funder had a minimal indirect role in the design of the study but definitely no role in the collection, analyses, or interpretation of data; in the writing of the manuscript; or in the decision to publish the results.
References
- Food and Agriculture Organization of the United Nations (FAO), FAOSTAT, Forestry, Forestry Production and Trade. Available online: https://www.fao.org/faostat/en/#data/FO (accessed on 10 October 2023).
- Benthien, J.T.; Sieburg-Rockel, J.; Engehausen, N.; Koch, G.; Lüdtke, J. Analysis of Adhesive Distribution over Particles According to Their Size and Potential Savings from Particle Surface Determination. Fibers 2022, 10, 97. [Google Scholar] [CrossRef]
- Dunky, M.; Niemz, P. Holzwerkstoffe und Leime: Technologie und Einflussfaktoren [Wood-Based Materials and Adhesives: Technology and Influencing Factors]; Springer: Berlin/Heidelberg, Germany, 2002; pp. 18–21, 645–927. ISBN 978-3-642-55938-9. [Google Scholar]
- Plath, E. Einfluß der Rohdichte auf die Eigenschaften von Holzwerkstoffen [Influence of Density on the Properties of Wood-based Materials]. Eur. J. Wood Wood Prod. 1963, 21, 104–108. [Google Scholar] [CrossRef]
- Istek, A.; Siradag, H. The effect of density on particleboard properties. In Proceedings of the International Caucasian Forestry Symposium (ICFS), Artvin, Turkey, 25–26 October 2013; pp. 932–938. [Google Scholar]
- Liiri, O. Investigations on properties of wood particle boards. Pap. Puu 1961, 43, 3–18. [Google Scholar]
- Wong, E.D.; Zhang, M.; Wang, Q.; Kawai, S. Formation of the density profile and its effects on the properties of particleboard. Wood Sci. Technol. 1999, 33, 327–340. [Google Scholar] [CrossRef]
- Istek, A.; Aydin, U.; Özlüsoylu, I. The effect of chip size on the particleboard properties. In Proceedings of the International Congress on Engineering and Life Science (ICELIS), Kastamouno, Turkey, 26–29 April 2018; pp. 26–29. [Google Scholar]
- Niemz, P.; Sonderegger, W. Holzphysik: Physik des Holzes und der Holzwerkstoffe [Wood Physics: Physics of Wood and Wood-based Materials]; Carl Hanser Verlag: München, Germany, 2017; pp. 61–62. [Google Scholar]
- Arabi, M.; Faezipour, M.; Layeghi, M.; Enayati, A.A. Interaction analysis between slenderness ratio and resin content on mechanical properties of particleboard. J. For. Res. 2011, 22, 461–464. [Google Scholar] [CrossRef]
- Arabi, M.; Haftkhani, A.R.; Pourbaba, R. Investigating the effect of particle slenderness ratio on optimizing the mechanical properties of particleboard using the response surface method. BioResources 2023, 18, 2800–2814. [Google Scholar] [CrossRef]
- Post, P.W. Effect of Particle Geometry and Resin Content on Bending Strength of Oak Flake Board. For. Prod J. 1958, 8, 317–322. [Google Scholar]
- Kitahara, K.; Kasagi, K. Effects of raw chip dimensions on the physical and mechanical properties of chip-board. Wood Ind. 1955, 10, 406–412. [Google Scholar]
- Kimoto, K.; Ishimori, E.; Sasaki, H.; Maku, T. Studies on the Particle Boards: Report 6: Effects of Resin Content and Particle Dimension on the Physical and Mechanical Properties of Low-Density Particle Boards; Kyoto University Research Information Repository: Kyoto, Japan, 1964; Volume 32. [Google Scholar]
- DIN EN 323:1993; Wood-Based Panels; Determination of Density. German Version; European Standards s.r.o.: Plzen, Czech Republic, August 1993.
- DIN EN 310:1993; Wood-Based Panels; Determination of Modulus of Elasticity in Bending and of Bending Strength. German Version; European Standards s.r.o.: Plzen, Czech Republic, August 1993.
- BS EN 319:1993; Particleboards and Fiberboards; Determination of Tensile Strength Perpendicular to the Plane of the Board. European Standards s.r.o.: Plzen, Czech Republic, April 1993.
- Benthien, J.T.; Ohlmeyer, M. Effects of flat-shaped face layer particles and core layer particles of intentionally greater thickness on the properties of wood-reduced particleboard. Fibers 2020, 8, 46. [Google Scholar] [CrossRef]
- Sackey, E.K.; Semple, K.E.; Oh, S.W.; Smith, G.D. Improving core bond strength of particleboard through particle size redistribution. Wood Fiber Sci. 2008, 2, 214–224. [Google Scholar]
- Niemz, P.; Wenk, S. Kenngrößen zur Beurteilung von Spangemischen und deren Meßbarkeit [Parameters for assessing paricle mixtures and their measurability]. Holztechnologie 1989, 30, 117–122. [Google Scholar]
- May, H.A. Herstellung von Holzspanplatten mit orientierten Spänen und unterschiedlicher Formgebung [Production of particleboard with oriented particles of different shapes]. Eur. J. Wood Wood Prod. 1974, 32, 169–176. [Google Scholar] [CrossRef]
Figure 1.
Cutting plan applied for BT 1 to BT 4. (IB = internal bond strength, MOR = modulus of rupture, MOE = modulus of elasticity).
Figure 1.
Cutting plan applied for BT 1 to BT 4. (IB = internal bond strength, MOR = modulus of rupture, MOE = modulus of elasticity).

Figure 2.
Scheme for selecting a suitable test for statistical data analysis given by Benthien et al. [18].
Figure 2.
Scheme for selecting a suitable test for statistical data analysis given by Benthien et al. [18].

Figure 3.
Exemplary density profile for an FLP (face layer particle) board.


Table 1.
Details on the different board types produced. (CLPs = core layer particles, FLPs = face layer particles, AC = adhesive content, and SSAA = surface-specific adhesive amount).
Table 1.
Details on the different board types produced. (CLPs = core layer particles, FLPs = face layer particles, AC = adhesive content, and SSAA = surface-specific adhesive amount).
| Board Type (BT) | Particle Material | AC | SSAA |
|---|---|---|---|
| 1 | CLPs | 8% | 12.5 g/m2 |
| 2 | FLPs | 8% | 8.2 g/m2 |
| 3 | FLPs | 12.2% | 12.5 g/m2 |
| 4 | CLPs | 5.3% | 8.2 g/m2 |
Table 2.
Results of the 3D particle measurements. (FLPs = face layer particles; CLPs = core layer particles).
Table 2.
Results of the 3D particle measurements. (FLPs = face layer particles; CLPs = core layer particles).
| Particle Material | Sample Weight (g) | Length * (mm) | Width * (mm) | Thickness * (mm) | Specific Surface Area (mm²/g) |
|---|---|---|---|---|---|
| FLPs | (3 times) 5 | 2.0 (±44.5%) | 0.9 (±31.3%) | 0.23 (±39.7%) | 9734 |
| CLPs | (3 times) 24 | 3.6 (±74.8%) | 1.1 (±67.0%) | 0.33 (±79.9%) | 6389 |
* Mean value (±coefficient of variation).
Table 3.
Density-compensated (650 kg/m3) mean values (±coefficient of variation) for modulus of rupture (MOR), modulus of elasticity (MOE), and internal bond strength (IB) for all manufactured boards, as well as the results of a comparison between the mean values for each board type (homogenous groups represented by uppercase letters) (CLPs = core layer particles, FLPs = face layer particles, AC = adhesive content, and SSAA = surface-specific adhesive amount).
| Board Type (BT) | Board | Particle Material | AC (%) | SSAA (g/m²) | MOR (N/mm²) | MOE (N/mm²) | IB (N/mm²) |
|---|---|---|---|---|---|---|---|
| 1 | 1 | CLPs | 8 | 12.5 | 10.1 (±3%) A | 1639 (±2%) A, B | 0.81 (±5%) A |
| 2 | CLPs | 8 | 12.5 | 10.2 (±6%) A | 1668 (±4%) A | 0.87 (±4%) B | |
| 3 | CLPs | 8 | 12.5 | 9.9 (±5%) A | 1598 (±1%) B | 0.87 (±4%) B | |
| 2 | 1 | FLPs | 8 | 8.2 | 6.9 (±2%) A | 1148 (±2%) A | 0.97 (±4%) A |
| 2 | FLPs | 8 | 8.2 | 6.8 (±3%) A | 1181 (±2%) A | 1.06 (±3%) B | |
| 3 | FLPs | 8 | 8.2 | 6.9 (±5%) A | 1157 (±2%) A | 0.99 (±3%) A | |
| 3 | 1 | FLPs | 12.2 | 12.5 | 7.1 (±5%) A | 1213 (±3%) A | 1.21 (±6%) A |
| 2 | FLPs | 12.2 | 12.5 | 7.3 (±2%) A | 1227 (±1%) A | 1.34 (±4%) B | |
| 3 | FLPs | 12.2 | 12.5 | 7.2 (±5%) A | 1195 (±1%) A | 1.34 (±3%) B | |
| 4 | 1 | CLPs | 5.3 | 8.2 | 8.2 (±5%) A | 1417 (±1%) A | 0.60 (±3%) A |
| 2 | CLPs | 5.3 | 8.2 | 8.6 (±7%) A | 1491 (±4%) A, B | 0.65 (±4%) B | |
| 3 | CLPs | 5.3 | 8.2 | 8.8 (±5%) A | 1494 (±4%) B | 0.68 (±4%) C |
Table 4.
Density-compensated (650 kg/m3) mean values (±coefficient of variation) for modulus of rupture (MOR), modulus of elasticity (MOE), and internal bond strength (IB) for all board types, as well as the results of pairwise mean value comparisons for investigating the influence of particle size and surface-specific adhesive amount (SSAA) (homogenous groups represented by uppercase letters) (FLP = face layer particle, CLP = core layer particle, MOR = modulus of rupture, MOE = modulus of elasticity, and IB = internal bond strength).
| Board Type (BT) | Material | SSAA (g/m²) | MOR (N/mm²) | MOE (N/mm²) | IB (N/mm²) |
|---|---|---|---|---|---|
| 3 | FLPs | 12.5 | 7.2 (±4%) A | 1212 (±2%) A | 1.30 (±6%) A |
| 1 | CLPs | 12.5 | 10.0 (±5%) B | 1635 (±3%) B | 0.85 (±5%) B |
| 2 | FLPs | 8.2 | 6.9 (±3%) A | 1162 (±2%) A | 1.01 (±5%) A |
| 4 | CLPs | 8.2 | 8.5 (±6%) B | 1467 (±4%) B | 0.65 (±7%) B |
| 2 | FLPs | 8.2 | 6.9 (±3%) A | 1162 (±2%) A | 1.01 (±5%) A |
| 3 | FLPs | 12.5 | 7.2 (±4%) B | 1212 (±2%) B | 1.30 (±6%) B |
| 4 | CLPs | 8.2 | 8.5 (±6%) A | 1467 (±4%) A | 0.65 (±7%) A |
| 1 | CLPs | 12.5 | 10.0 (±5%) B | 1635 (±3%) B | 0.85 (±5%) B |
Disclaimer/Publisher’s Note: The statements, opinions and data contained in all publications are solely those of the individual author(s) and contributor(s) and not of MDPI and/or the editor(s). MDPI and/or the editor(s) disclaim responsibility for any injury to people or property resulting from any ideas, methods, instructions or products referred to in the content. |
© 2024 by the authors. Licensee MDPI, Basel, Switzerland. This article is an open access article distributed under the terms and conditions of the Creative Commons Attribution (CC BY) license (https://creativecommons.org/licenses/by/4.0/).
Share and Cite
MDPI and ACS Style
Engehausen, N.; Benthien, J.T.; Lüdtke, J. Influence of Particle Size on the Mechanical Properties of Single-Layer Particleboards. Fibers 2024, 12, 32. https://doi.org/10.3390/fib12040032
AMA Style
Engehausen N, Benthien JT, Lüdtke J. Influence of Particle Size on the Mechanical Properties of Single-Layer Particleboards. Fibers. 2024; 12(4):32. https://doi.org/10.3390/fib12040032
Chicago/Turabian StyleEngehausen, Nick, Jan Thore Benthien, and Jan Lüdtke. 2024. "Influence of Particle Size on the Mechanical Properties of Single-Layer Particleboards" Fibers 12, no. 4: 32. https://doi.org/10.3390/fib12040032
Note that from the first issue of 2016, this journal uses article numbers instead of page numbers. See further details here.