Article

Effect of the Fiber Type and Axial Stiffness of FRCM on the Flexural Strengthening of RC Beams

Department of Civil and Environmental Engineering, University of Windsor, Windsor, ON N9B 3P4, Canada
*
Author to whom correspondence should be addressed.
Fibers 2017, 5(1), 2; https://doi.org/10.3390/fib5010002
Submission received: 12 September 2016 / Revised: 10 November 2016 / Accepted: 18 December 2016 / Published: 6 January 2017
(This article belongs to the Special Issue Fiber Reinforced Polymers (FRP) for Infrastructure Applications)

Abstract

:
The use of externally-bonded fiber-reinforced polymer (FRP) sheets has been successfully used in the repair and strengthening of both the shear and flexural capacities of reinforced concrete (RC) beams, slabs and columns since the 1990s. However, the externally-bonded FRP reinforcements still present many disadvantages, such as poor performance in elevated temperature and fire, lack of permeability and strength degradation when exposed to ultraviolet radiation. To remedy such drawbacks, the fiber-/fabric-reinforced cementitious matrix (FRCM) has been recently introduced. The FRCM system consists of a fiber mesh or grid embedded in a cementitious bonding material. The present research investigates the flexural strengthening of reinforced concrete (RC) beams with FRCM. The experimental testing included eight large-scale concrete beams, 150 mm × 250 mm × 2400 mm, internally reinforced with steel bars and strengthened in flexure with FRCM. The investigated parameters were the internal steel reinforcement ratio and the FRCM systems. Two steel reinforcement ratios of 0.18 and 0.36 of the balanced reinforcement ratio, as well as three FRCM systems using glass, carbon and PBO fibers were investigated. Test results are presented in terms of load-deflection, load-strain and load-crack width relationships. The test results indicated that the PBO FRCM significantly increased the ultimate capacity of the strengthened RC beams with both low and moderate internal reinforcement ratios compared to the glass and carbon FRCM.

1. Introduction

Deterioration of concrete structures is a very common problem that civil engineers all over the world are facing. Deterioration of concrete is caused by several important factors. A very important and major cause of concrete deterioration is the corrosion of the embedded metals (most commonly steel) [1]. Furthermore, another main cause of concrete structures’ deterioration is the exposure to harsh environments; if no protective action is taken, the damage can be significant. In addition to this, exposing concrete to aggressive chemicals, such as acids, has the potential to induce damage. In many countries around the world, structures suffer from overuse and exposure to harsh environments without proper maintenance or rehabilitation. For example, in Canada, more than 40% of the bridges were built 50 years ago and are in need of significant structural rehabilitation [2]. In the U.S., it is estimated that about 200,000 bridges are structurally deficient and require rehabilitation [3]. Not only some structures need repair, but they may need to be modified or redesigned according to the current needs. For example, some structures were built to carry loads that are significantly smaller than the current code requirements. Therefore, engineers need to design and evaluate strengthening methods to respond to those needs.
Therefore, structural rehabilitation (strengthening or repair) is considered one of the most important aspects and challenges facing the construction industry nowadays. There are many common rehabilitation techniques, such as section enlargement, crack injection, external posttensioning and externally-bonded steel plates. Over the past ten years, externally-bonded fiber-reinforced polymer (FRP) sheets gained wide attention. This was adopted in the rehabilitation of RC slabs, beams and columns due to its ease of application and significant enhancement of the strength. However, externally-bonded FRP sheets still suffer from many disadvantages. For example, FRP sheets lack permeability, trapping moisture at the interface and, therefore, affecting the bonding integrity to RC [4]. In addition, low temperature conditions also affect the bond integrity [5]. Moreover, at elevated temperature, the polymer resin decomposes, which significantly reduces the strength of the FRP system [6]; not to mention FRP’s sensitivity to ultraviolet radiation when exposed to sunlight and its high toxic hazard due to the presence of the epoxy resin [7]. Furthermore, it is fundamental to recall that FRP systems possess a sudden brittle type of failure, which is not a preferred type of failure.
Most of the durability drawbacks of FRP are due to the inherent properties of the polymer adhesive. Consequently, the focus has shifted to develop inorganic, cement-based bonding matrix to be used in the composite systems. These cement-based composites were later called FRCM (fiber-reinforced cementitious matrix). In FRCM, a structural reinforcing mesh (fabric or textile) with an open structure, as shown in Figure 1, is used instead of fiber sheets. The strands of the FRCM reinforcing mesh are typically made of fibers that are individually coated or bonded together by a polymeric resin that does not fully impregnate the fibers, as shown in Figure 1. Therefore, the term “dry fibers” is used to define an FRCM mesh per the American Concrete Institute guide for design and construction of externally bonded FRCM systems for repair and strengthening of concrete and masonry (ACI-549-4R-13 [8]). Many types of FRCM are currently available based on the type of fibers used, which include glass, carbon and polyparaphenylene benzobisoxazole (PBO). With each type of fiber, certain polymer-modified and or fiber-reinforced cement mortars should be used. Due to the presence of cementitious bonding material, the FRCM system, unlike FRP, is less affected by temperature fluctuations and possesses porous properties that allow moisture to diffuse through RC structures where FRCM is applied [5]. In comparison to FRP, FRCM is inherently incombustible [4], hence making it a much safer and a convenient alternative to the commonly-used FRP. In addition, research has shown that FRCM can be applied to concrete structures and columns in low temperature conditions and onto wet surfaces [6].

2. Previous Research

Recently, several research works were conducted to evaluate the tensile properties of FRCM composites. A very important and comprehensive research was performed by Arboleda et al. [9] to evaluate the tensile behavior and properties of FRCM composites. The characterization was done under two different boundary conditions, clevis and clamping grips. The clevis grip assembly, as shown in Figure 2, consisted of two steel plates glued to the ends of the coupons. The steel plates were pinned to a transversal pin on the extended part of the plates, and this whole system was connected to a clevis joint, which was pinned to a shackle.
The clamping grip, shown in Figure 3, was obtained by gluing lass fibre-reinforced polymer, GFRP, tabs at the ends of the FRCM coupons and then pressing (clamping) the two ends in the testing machine grips. When clevis grips were used, the failure mode is dominated by the slipping of the fabrics from the mortar; whereas, when clamping grips were used, fabric slippage was limited, and therefore, the coupons reached a higher ultimate strength compared to the ones having clevis grips. The clevis grip presents a more realistic failure behavior that is expected in the application in the field.
In both tests, the tensile stress of the coupon was determined by dividing the tensile load by the fabric’s nominal cross-sectional area. A typical stress-strain diagram of FRCM materials is shown in Figure 4 [8]. The stress-strain behavior of FRCM consists of three main phases. The first phase represents the linear uncracked state where the cement mortar takes the load. Then, as the load increases, the stress transfers from the mortar to the fabric, and that is represented by the multi-cracking process of the matrix. The point or stage at which the first crack takes place is called the transition point and the bend-over point (Mobasher, 2012) [10]. The transition point represents the beginning of the multi-cracking process. Then, the specimen goes through a multi-cracking process, in which the mortars cracks till all of the stresses are transferred from the mortar to the fiber. At this point, the fiber is only carrying the load till it fails either by rupturing or by slipping. From the reported observation, one can model the stress-strain behavior as bi-linear for the analysis and design [8]. Unlike FRCM, the FRP has a perfect linear-elastic tensile stress-strain behavior with brittle sudden failure. Comparing both stress-strain behaviors, it can be concluded that the tri-linear behavior of the FRCM due to the multi-cracking process in the matrix, as well as the gradual failure due to the slippage of fibers resulted in a ductile response, like the post-yielding behavior of mild steel. The post-cracking and post-failure ductile behaviors make FRCM preferable strengthening and repair materials compared to FRP.
Furthermore, some research works were performed to evaluate the effectiveness of FRCM for the flexural strengthening of RC beams. D’Ambrisi and Focacci [4] investigated the effect of fiber net material (PBO and carbon FRCM), the type of mortar matrixes and the strengthening scheme (different U-wrapping configurations) on the flexural behavior of FRCM-strengthened beams having an internal reinforcement ratio of 0.11   ρ b . In addition, the performances of carbon and PBO FRCM-strengthened beams were compared with the performance of carbon FRP-strengthened beams. Babaeidarabad et al. [11] and Loreto et al. [12] investigated the effect of the FRCM fiber types (PBO and carbon), the number of layers (one and four layers) and the concrete compressive strength ( 29.1   MPa and 42.9   MPa ) on the flexure capacity of RC beams with internal steel reinforcement ratios of 0.17   ρ b to 0.195   ρ b The test results and findings of these research works can be summarized as follows:
The FRCM strengthening of RC beams showed a significant increase in the ultimate capacity of up to 92%.
The increase in the ultimate capacity proportion directly with the increase of the axial stiffness of the FRCM fiber net and the number of FRCM layers. The PBO FRCM materials performed better than C-FRCM materials, which is consistent with the axial stiffness of each material.
The increase in ultimate strength of strengthened beams having low-strength concrete is higher than that of high-strength concrete. For example, for strengthened beam having low-strength concrete, flexural capacity increased by 32% (one layer) and 92% (four layers). For high-strength concrete, flexural capacity increased by 13% (one layer) and 73% (four layers) [11].
It was found that RC concrete beams reinforced with two layers of PBO FRCM, which yields an axial stiffness of approximately 83% of one layer of carbon FRP sheets, provided about a 30% increase in the ultimate load, which was almost the same increase as the CFRP strengthening. Meanwhile, two layers of carbon FRCM with an axial stiffness of about 75% that of CFRP, enhanced the ultimate load by only 15% [4].
Moreover, the effectiveness of the FRCM in increasing the ultimate capacity also depends on the bond properties of the fiber/matrix and the matrix/concrete interfaces. D’Ambrisi et al. (2013) concluded that the bond performances of FRCM materials depend on the fibers/matrix coupling; therefore, different types of fibers and mortars will have totally different behavior with the same concrete substrate [13]. According to D’Ambrisi et al. (2011), the typical observed failure modes of FRCM-strengthened concrete beams under flexural loads were the slippage of the fabric within the matrix, delamination of the FRCM at the fiber/matrix interface and detachment of the FRCM from the concrete substrate, as shown in Figure 5 [4]. It was found that PBO FRCM always performed better than the carbon FRCM. The failure mode of carbon FRCM is mainly by delamination and/or detachment. For PBO FRCM materials, D’Antino et al. (2014) also concluded that, prior to failure, a considerable fibers/matrix slip occurs and at failure; the debonding occurs at the fibers/matrix interface without detachment of the cement-based matrix from the concrete substrate [14]. D’Ambrisi et al. (2012) found that the fibers’ arrangement and the number of fiber net layers control the bond behavior and characteristics of FRCM since the delamination occurs at the fibers/matrix interface [15]. It is worth mentioning that all of the available investigations in the current literature on the bond performance of FRCM and concrete were carried out using single or double shear testes (direct shear) on concrete blocks with only PBO FRCM strips.
By examining the main parameters tested in the current literature, it was found that:
  • Two types of fibers, PBO and carbon FRCM, were investigated for the flexural strengthening.
  • A very low steel reinforcement ratio (less than 0.195 ρb) was used in all of the strengthened RC beams in all of the previous research.
  • In terms of the number of FRCM layers, previous researchers focused more on investigating the effect of extreme number of layers, i.e., one layer vs. four layers.
  • No comparison was carried out between the three FRCM systems: glass, carbon and PBO.
Therefore, the objective of this research is to fill some of the gaps that have not been investigated in the literature. This paper focuses on comparing the performance of concrete beams reinforced with low and medium steel reinforcement ratios (0.18 and 0.36 ρb) and strengthened in flexure using two layers (moderate strengthening) of glass, PBO and carbon FRCM systems.

3. Experimental Program
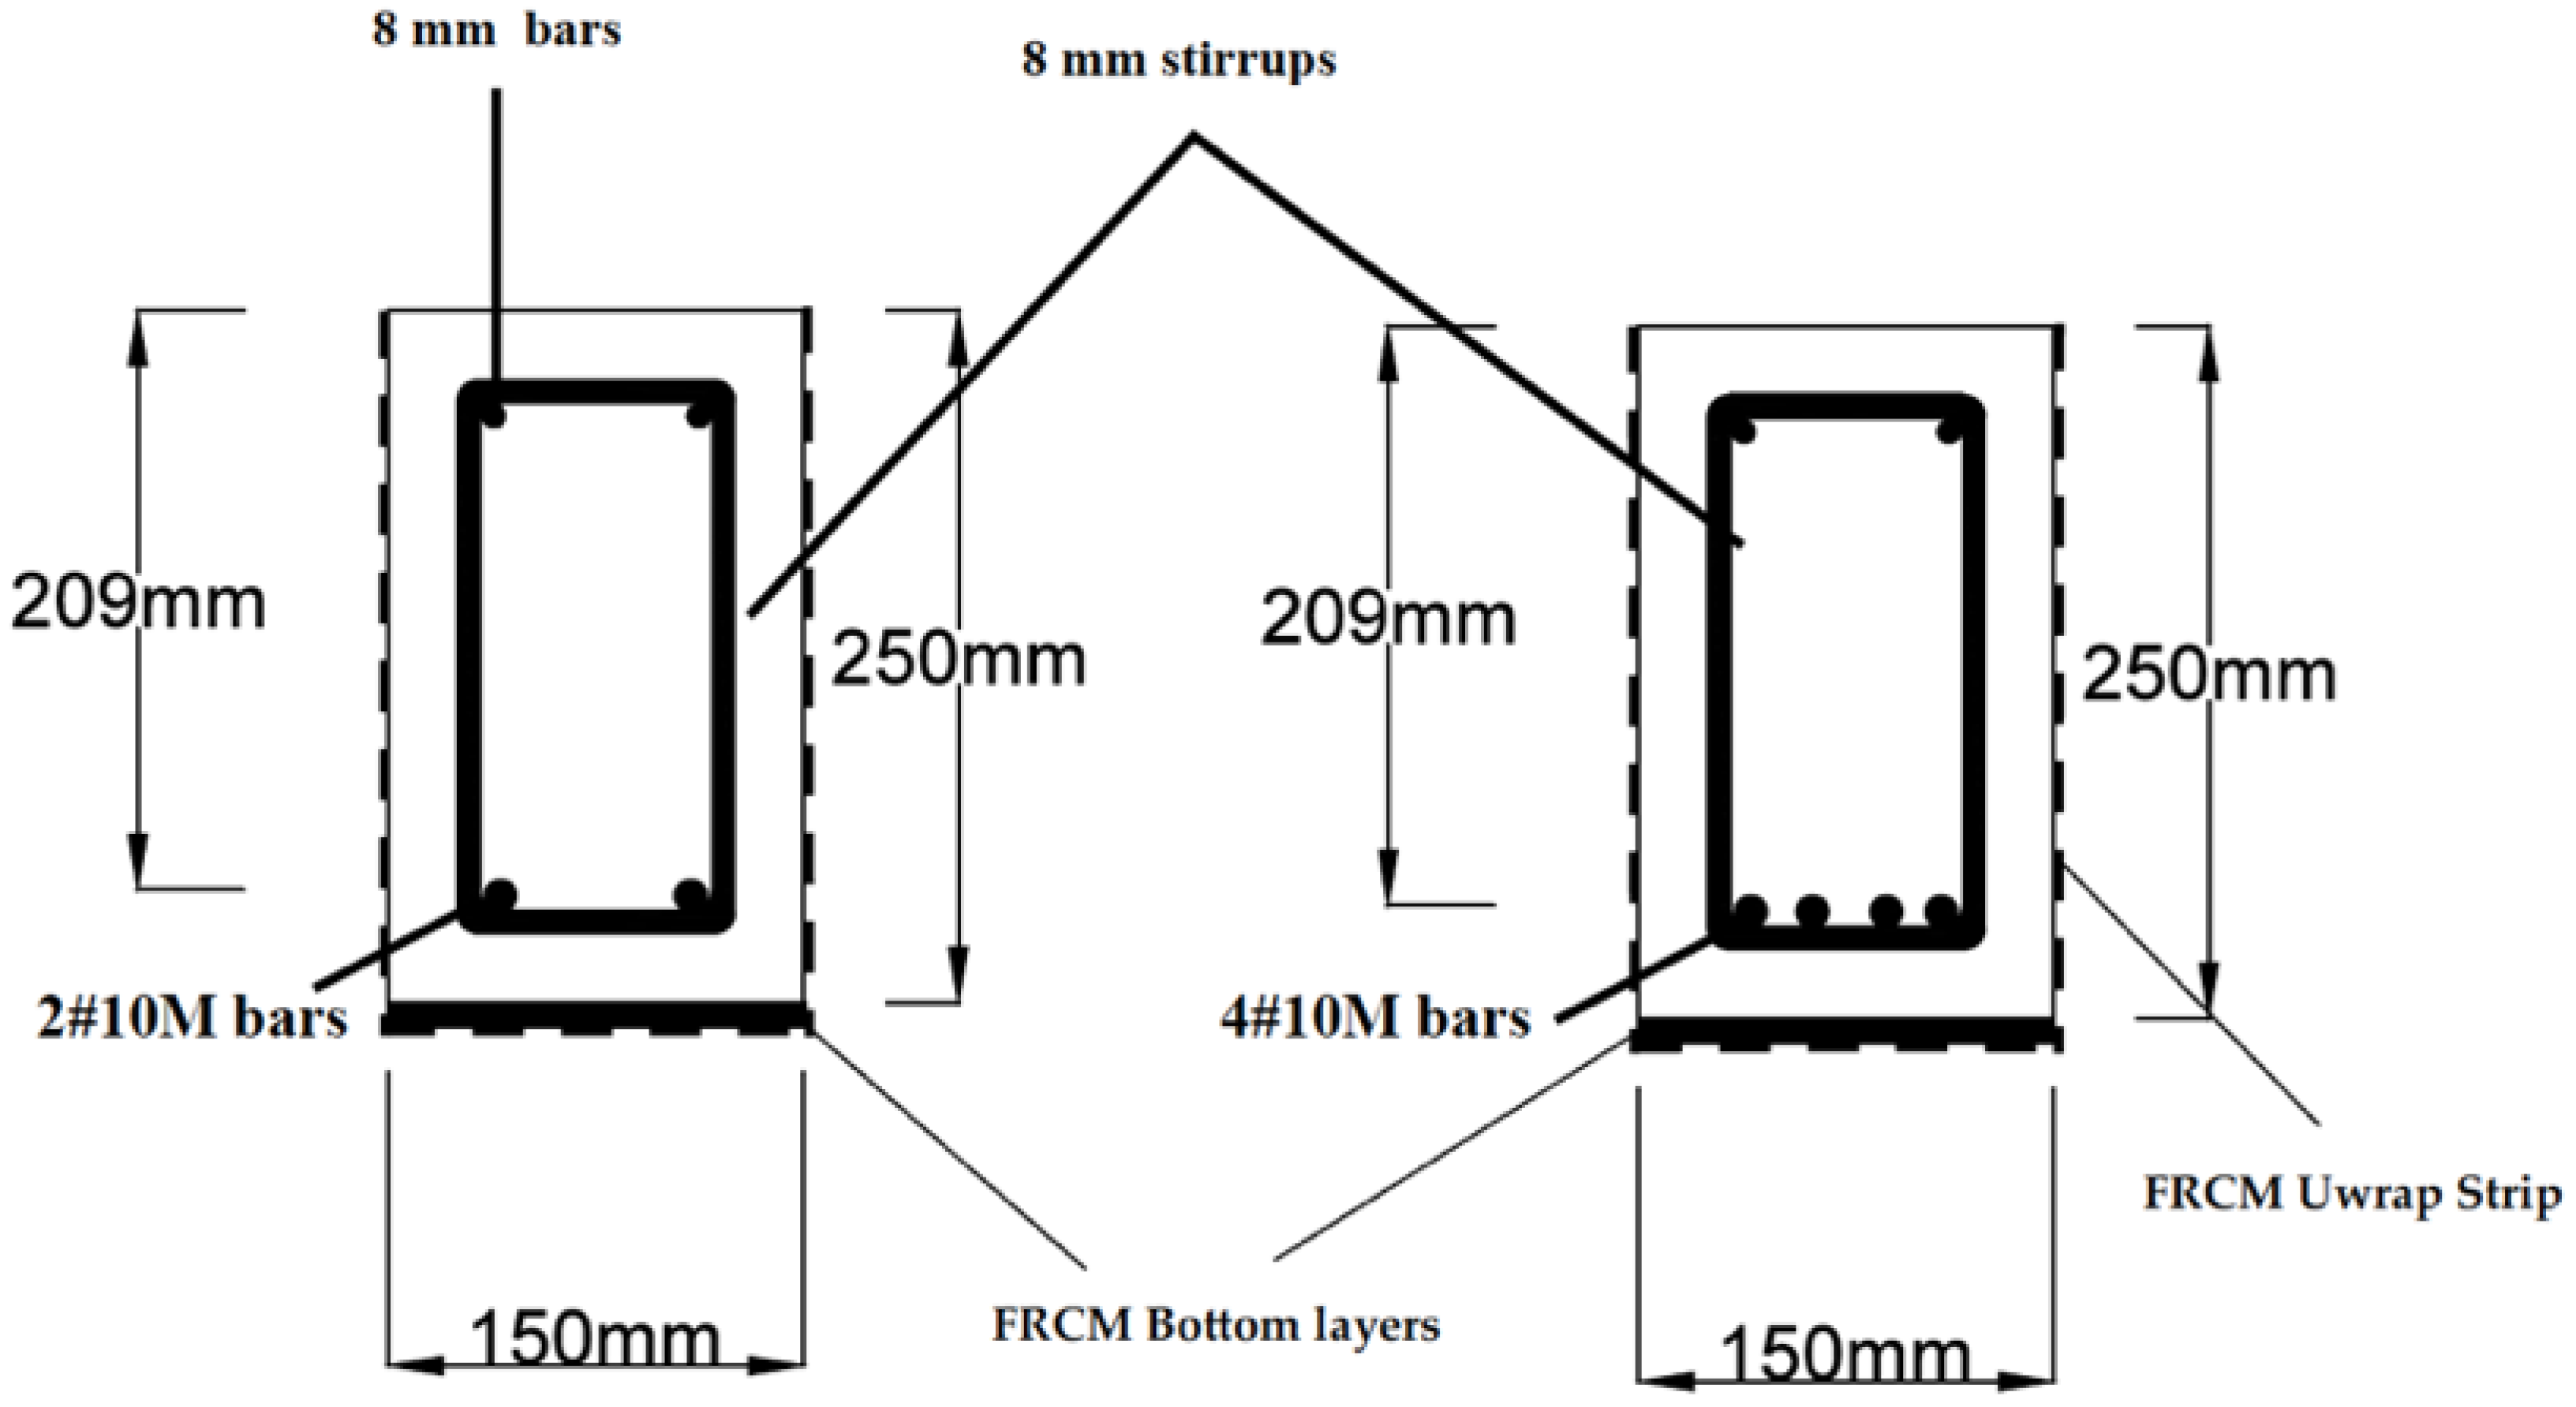
3.1. Test Specimens

The experimental program consists of testing eight large-scale beams; each is 150 mm wide, 250 mm deep and 2400 mm long. The eight test specimens were divided into two groups, I and II, with 4 beams each. Group I and II test specimens will be used to investigate the effect of the reinforcement ratio. Group I beams were reinforced with 2#10M bars as the bottom longitudinal reinforcement, which resulted in a reinforcement ratio of 0.18 of the balanced reinforcement ratio, ρb. For Group II beams, 4#10M bars were used with a reinforcement ratio of 0.36 ρb, as shown in Figure 6. Both Group I and II beams were over-reinforced for shear and were reinforced with 8-mm stirrups spaced at 150 mm. Two to eight millimeter top longitudinal bars were used as stirrup hangers. Within each group, the investigated parameter is the type of FRCM strengthening material. In each group, one beam was used as the control beam, without strengthening, while each of the remaining three beams was strengthened with two layers of PBO, carbon or glass FRCM. Table 1 presents the details of the test matrix. The specimen designation used in the table is as follows: the first character states the specimen type, so for this study, B stands for beam; the second character is the number of steel reinforcing bars; and the third character is the FRCM material type, which is specified as 0 (control), P (PBO), C (carbon) and G (glass). Therefore, B4-P is an internal reinforced with 4#10M steel bars and is externally strengthened with a two-layer PBO FRCM system. Only for specimen B2-G-4, four layers of GFRCM were applied. In addition to the main bottom surface FRCM strengthening, four intermittent FRCM U-shaped strips, each 100 mm wide and consisting of 2 layers, were applied along the beam span, one at each end and one under the load. This U-shaped strips were used to help in delaying the de-bonding of the FRCM from the concrete substrate at the bottom face.

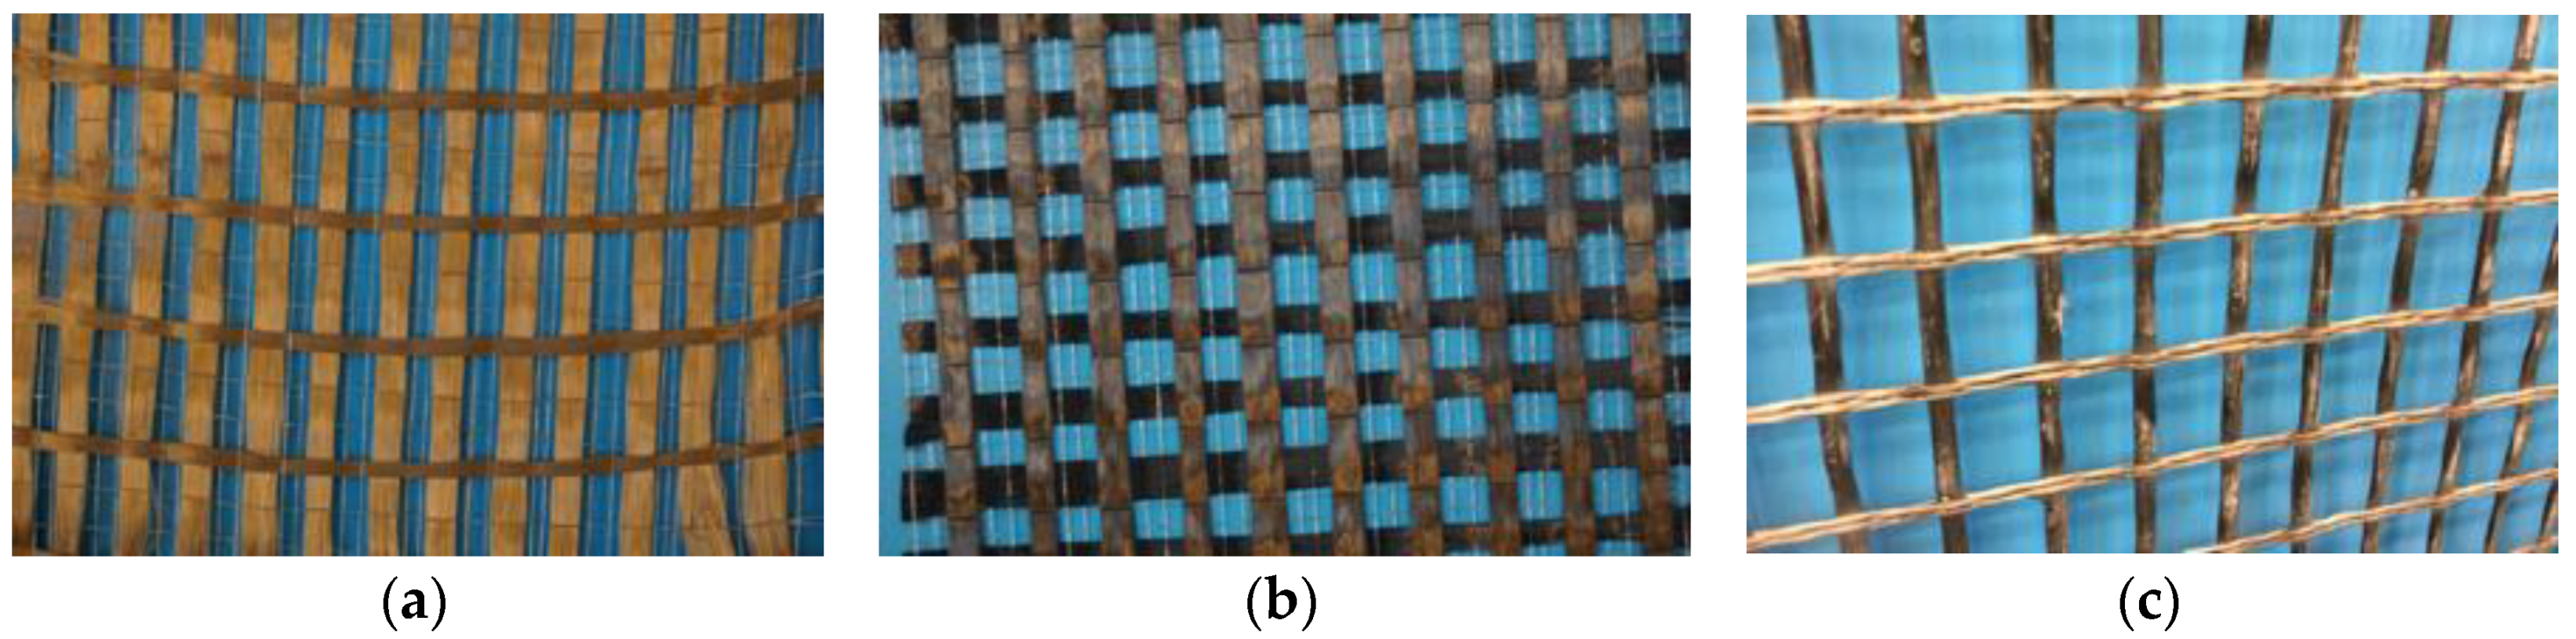
3.2. Material Properties

The test specimens were casted from the same custom-designed concrete batch, which was mixed and poured in the laboratory. The targeted 28-day compressive strength was 30 MPa. Several standard concrete cylinders, 101.6 mm in diameter and 152.4 mm in height, were prepared during casting and cured under the same condition as the reference beam specimens. All specimens were tested after 28-days, and the compressive strength on the testing day was between 32 and 35 MPa with an average of 33 MPa. The reinforcing bars have a yield strength, fy, of about 500 MPa and a modulus of elasticity, E, of 200 GPa.
The glass FRCM has a balanced bi-directional glass fabric net with alkali-resistant coating. The spacing of the fabric tows is 18.2 mm × 14.2 mm (center to center). The mortar used is a one-component, polymer-modified, cementitious mortar with 40 MPa compressive strength [16,17]. The PBO FRCM consists of unbalanced and un-coated bi-directional polyparaphenylene benzobisoxazole (PBO) fiber mesh (dry-fibers) and stabilised inorganic matrix designed to obtain a superior bond with the mesh and the concrete substrate. The PBO fabric toss spacing is 20 mm × 15 mm, and the ultimate tensile stress per unit width is about 265 and 66.5 kN/m in the longitudinal (main) and transverse directions, respectively. The inorganic mortar has a compressive strength of 30 MPa [18,19]. The carbon FRCM was fabricated using a balanced bi-directional carbon fiber mesh and a stabilized inorganic matrix. The fabric has a nominal spacing of 10 mm in both directions, and the mortar has a compressive strength of 20 MPa [19,20]. The mechanical properties of the glass, PBO and carbon fabric, in the longitudinal direction, as provided by the manufacturers, are presented in Table 2.
Table 3 summarizes the mechanical properties of the FRCM systems (cured fibers and matrix). The mechanical properties of the glass FRCM were evaluated based on tensile characterization tests carried out according to Annex A of Acceptance Criteria, AC434, of the International Code Council Evaluation Service, (ICC-ES-2013) [21]. As per the AC434 [21], five FRCM coupons were tested, and the following properties’ parameters were calculated based on the net fabric area:
  • Ultimate tensile strain, ϵ f u .
  • Ultimate tensile stress, f f u .
  • Modulus of elasticity of the cracked specimen, Ef.
The modulus of elasticity of the cracked specimen was calculated using the following equation [21]:
E f = Δ f Δ ϵ = 0.9 f f u 0.6 f f u ϵ @ 0.9 f f u ϵ @ 0.6 f f u
More details about the tensile characterization tests on GFRCM can be found in [22]. Meanwhile, the mechanical properties of the PBO and carbon FRCM systems, as provided by the manufacturers and verified by other research works [10,11,12,18,19,20], were used.

3.3. Fabrication of Test Specimens

Before applying the FRCM system, the specimens were flipped upside down to make the application process easier. To apply the FRCM, the surface of the beam was roughened then dampened with water, but without having any standing water at the surface. An initial layer of mortar was applied, approximately 3 mm thick. Then, the first FRCM mesh was laid down, embedded in the mortar and totally covered by another layer of mortar. This procedure was repeated for each layer of both the main bottom FRCM strengthening and the U-wraps. Figure 7 shows illustrations for the different steps. The applied strengthening was then wet-cured for 3 days.

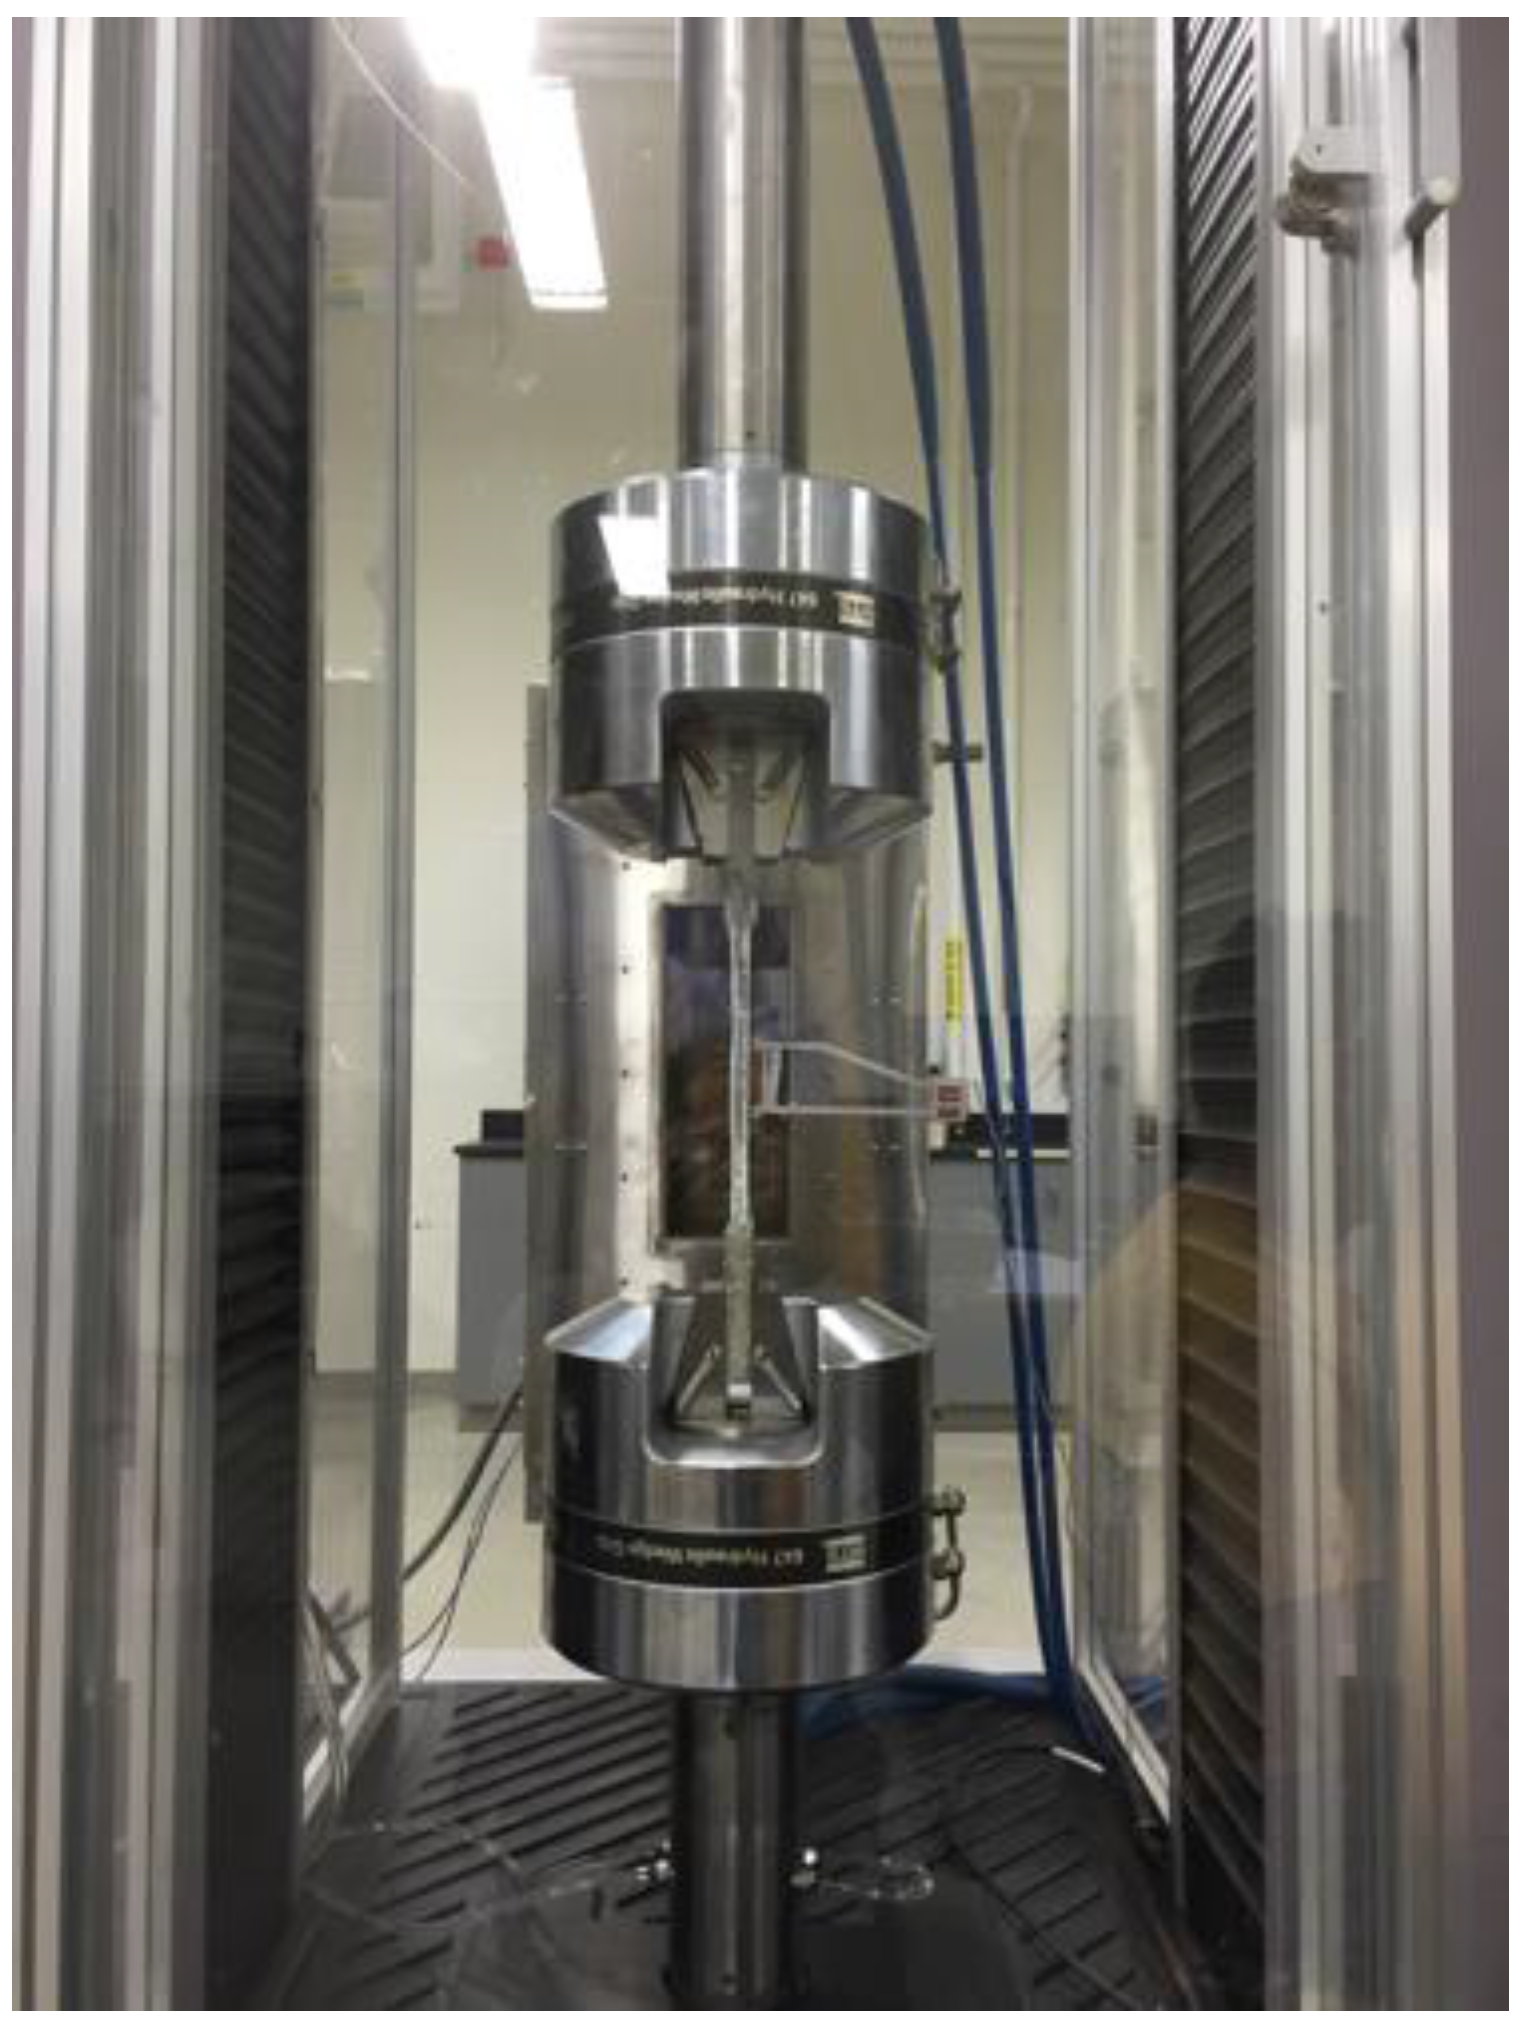
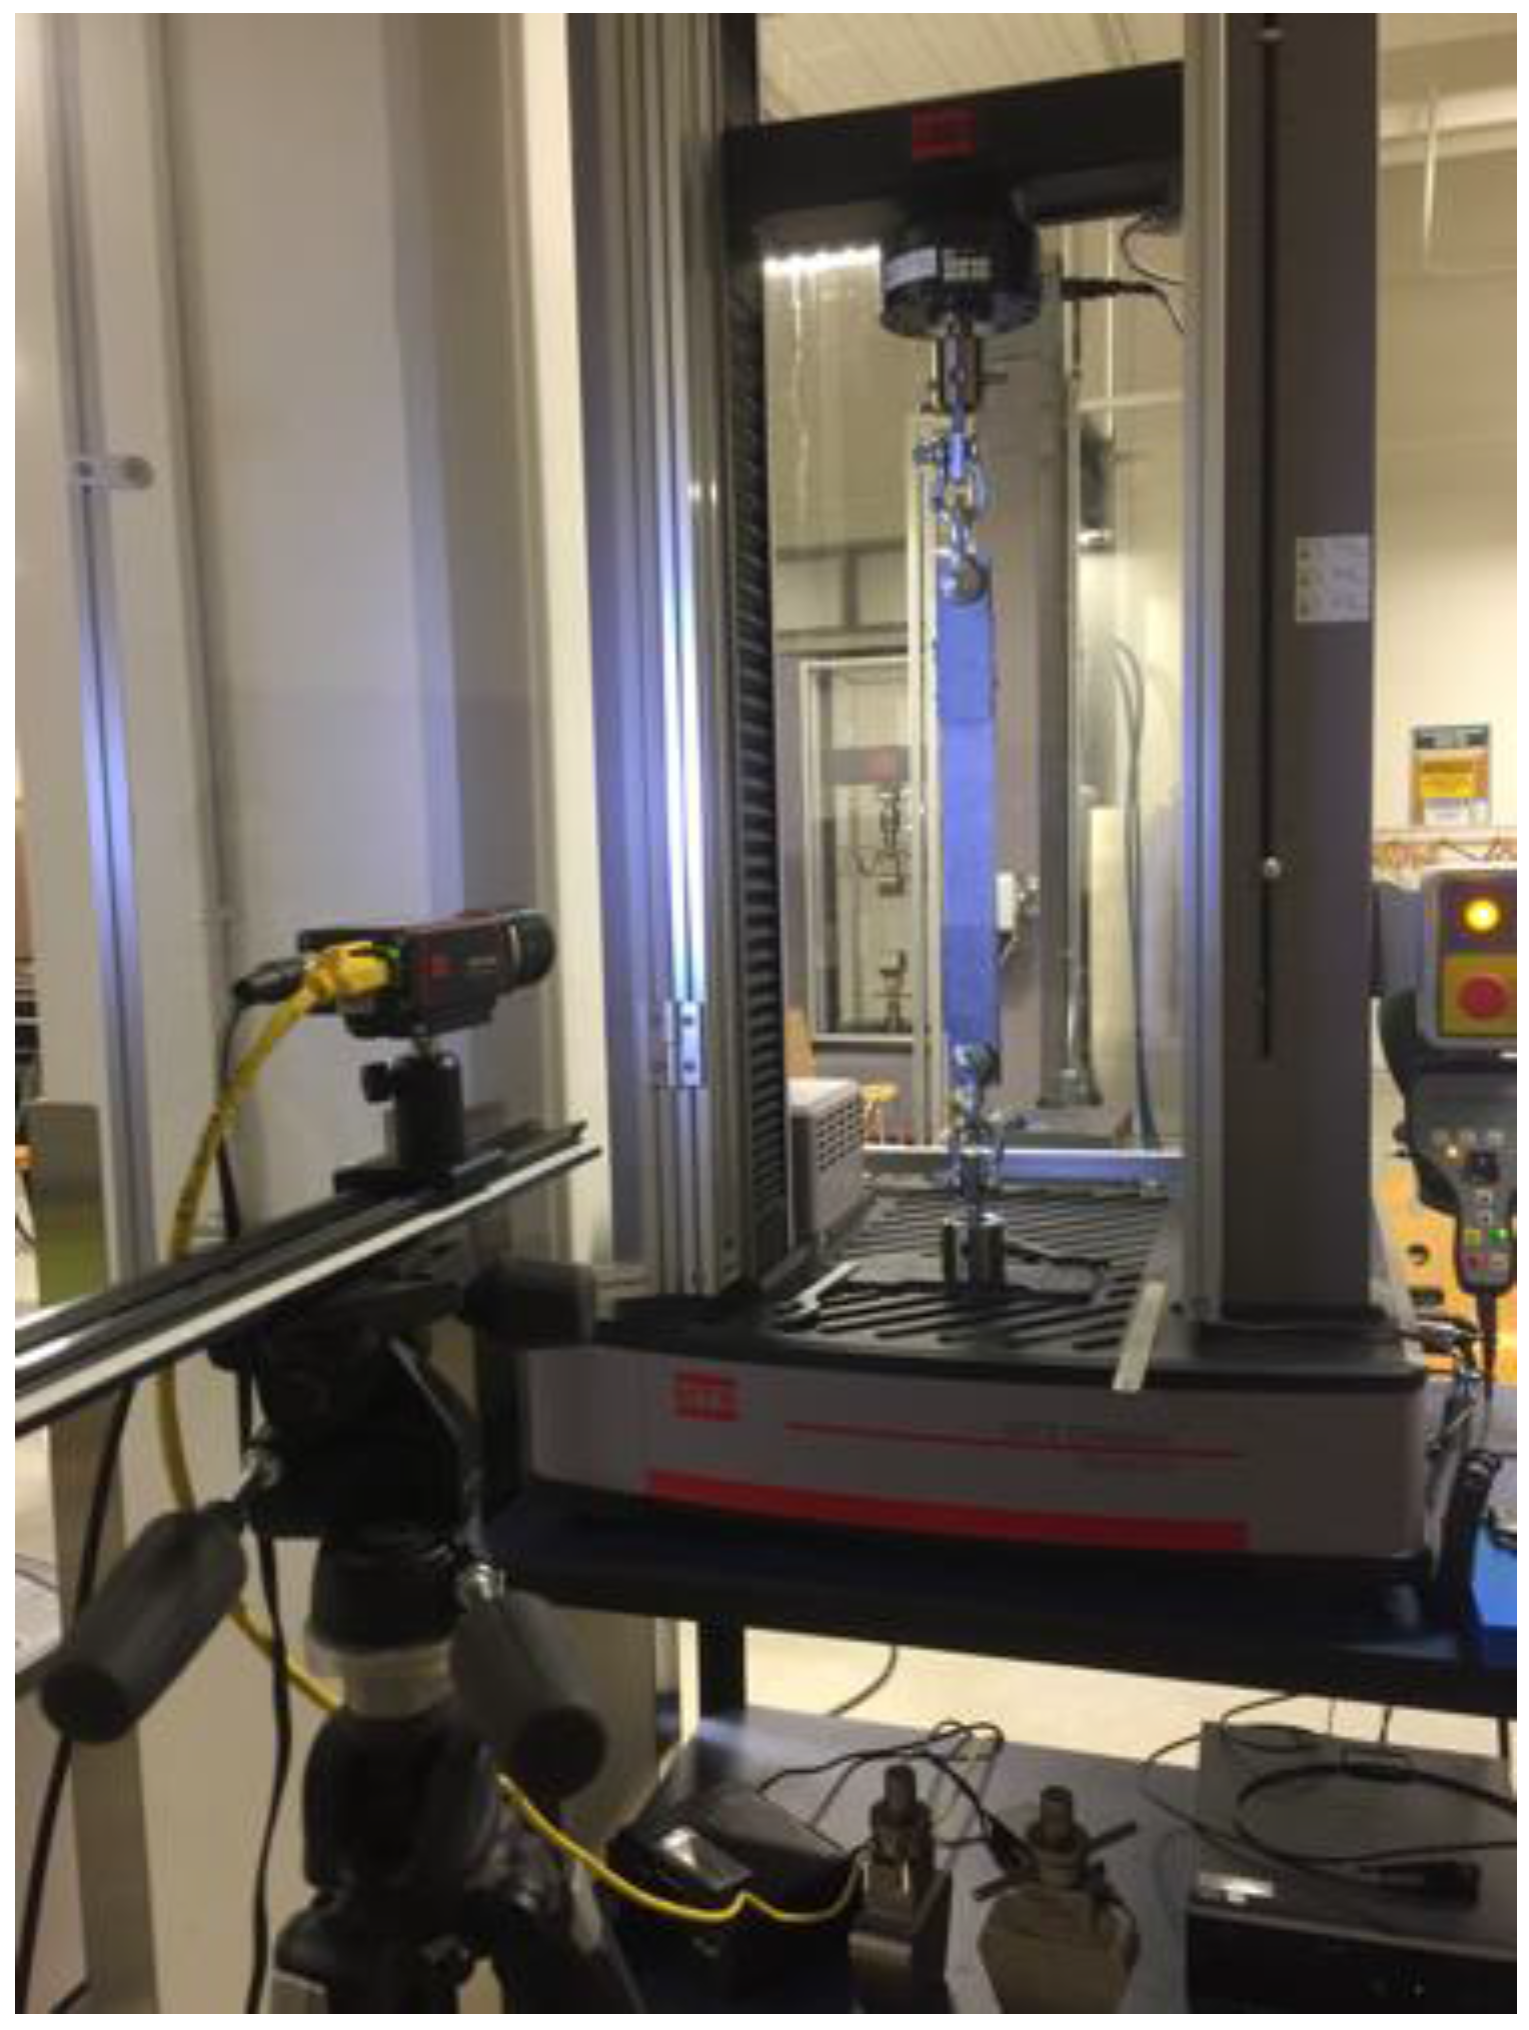
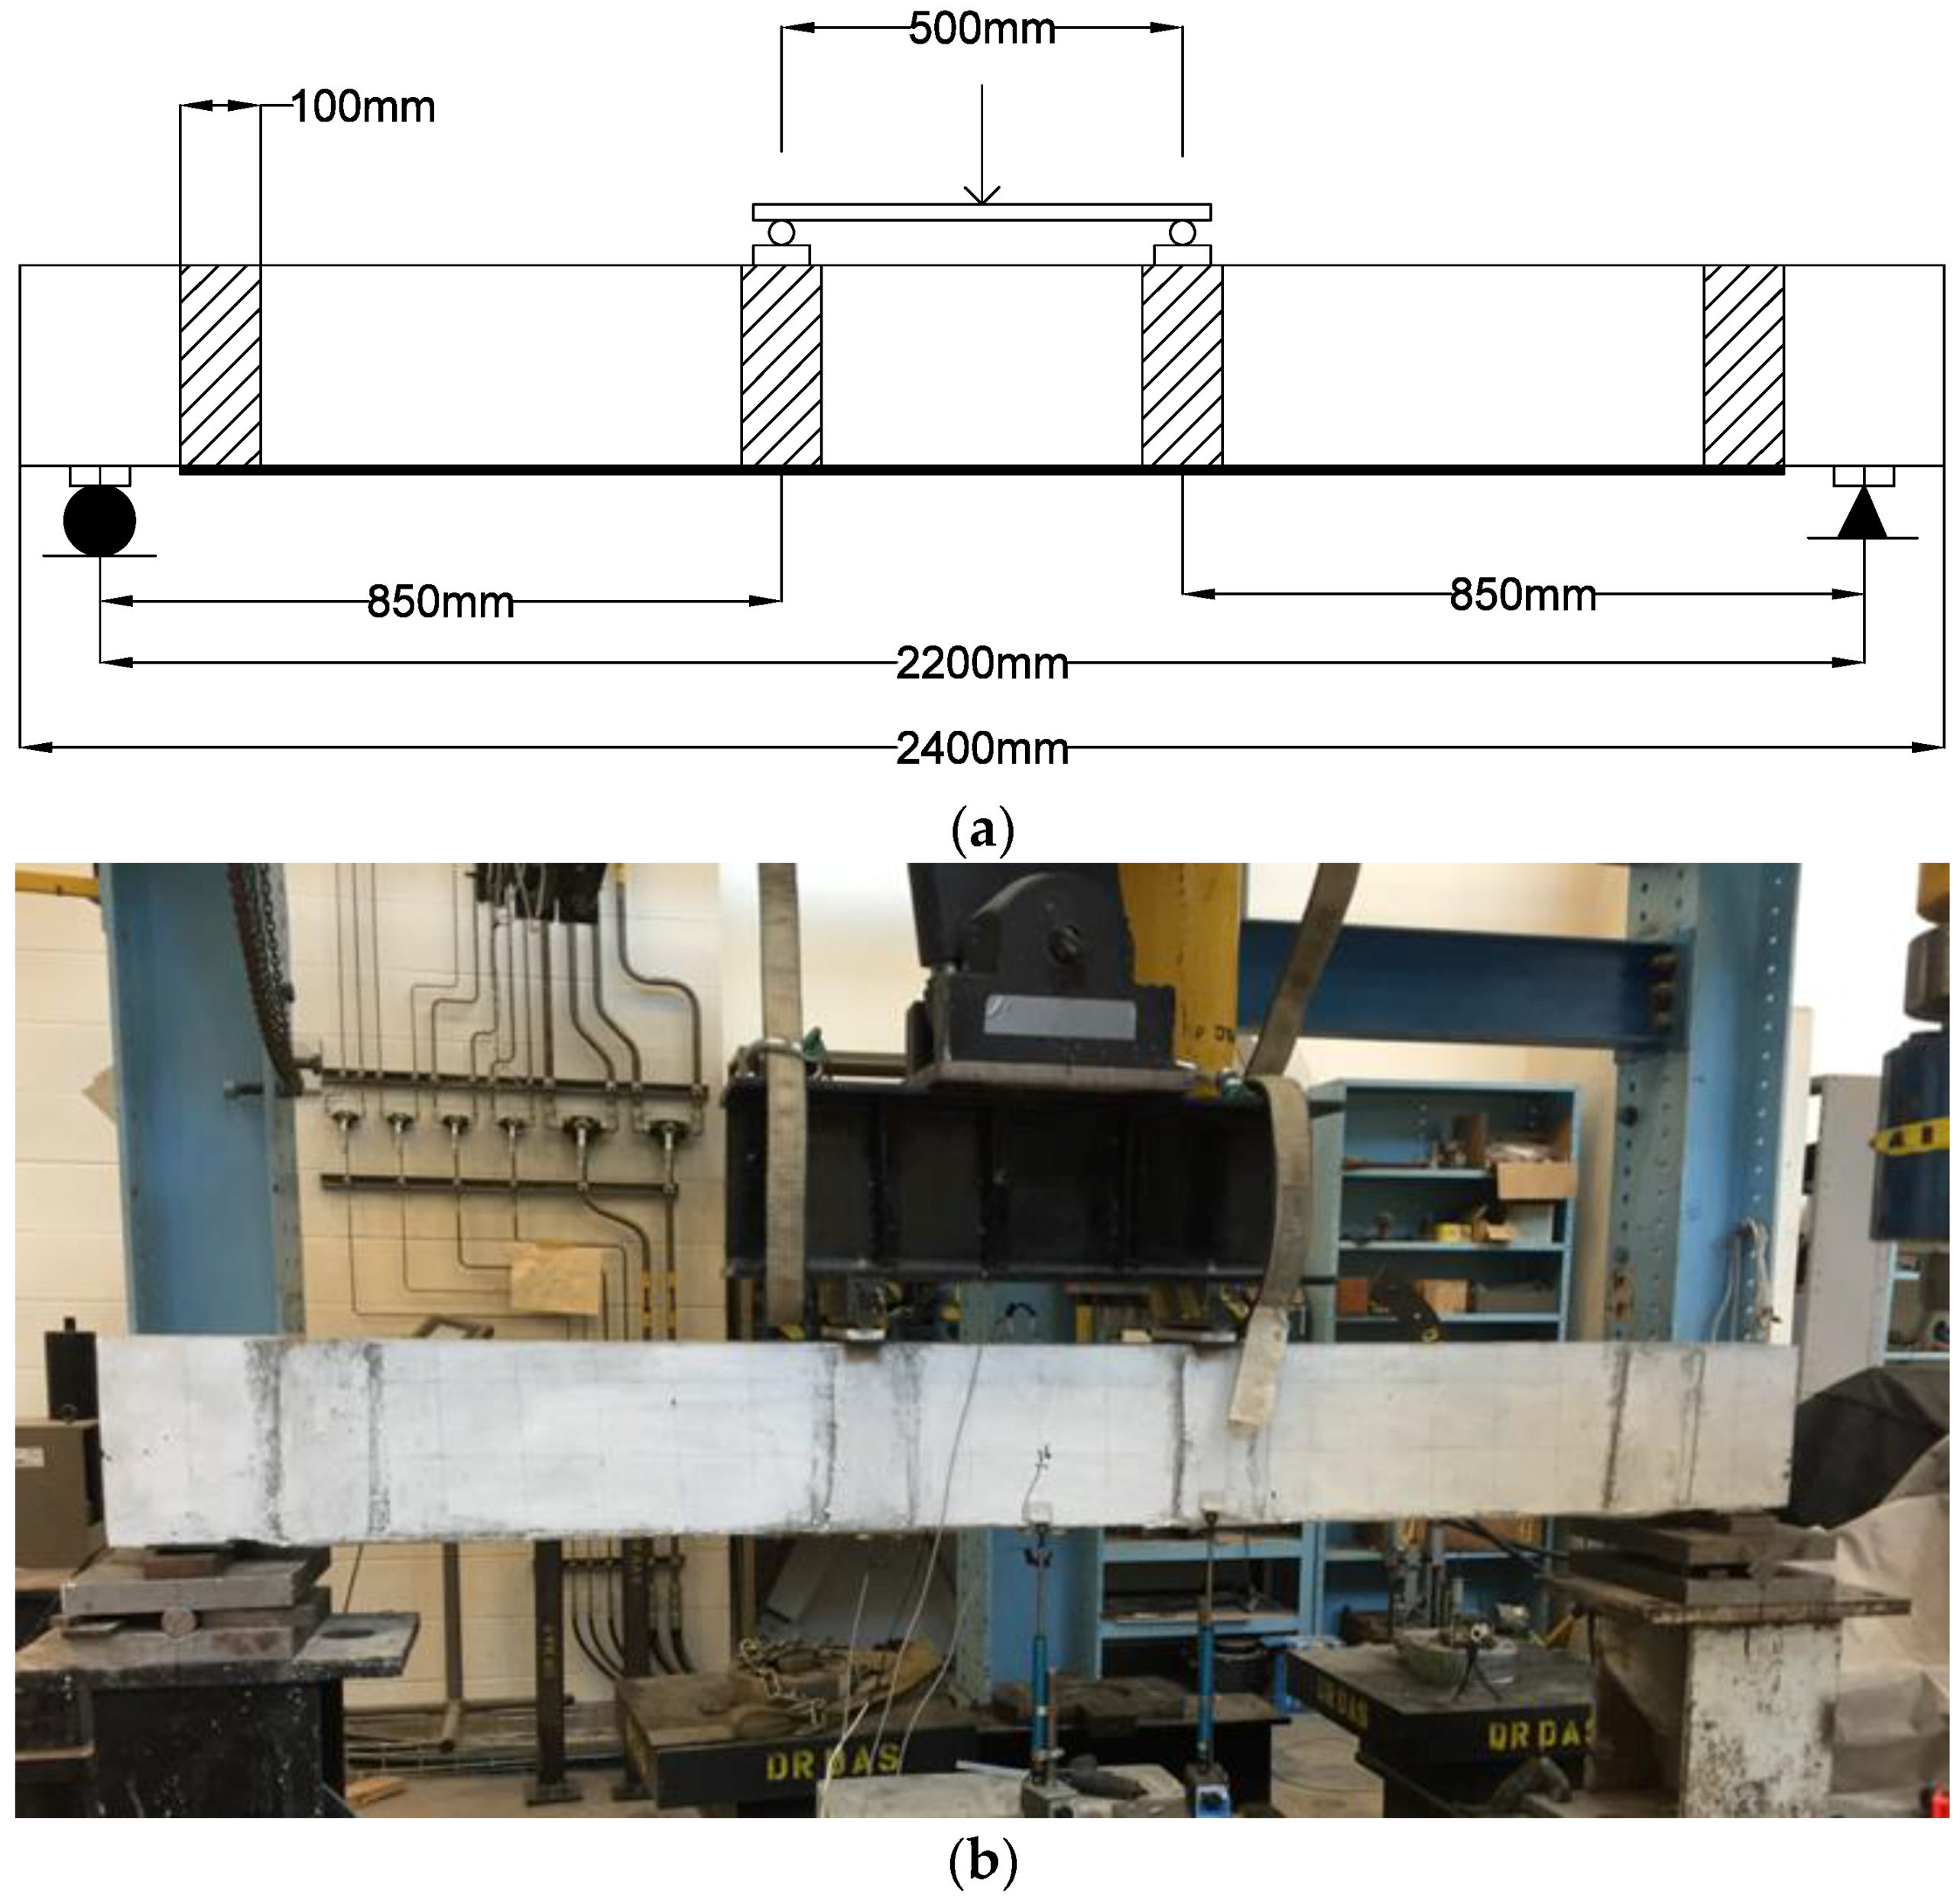
3.4. Test Set-Up and Procedures

The test specimens were simply supported on roller and pin supports over a span of 2200 mm. Two concentrated loads, spaced at 500 mm, were applied at the mid-span using a stiff spreader beam. The load was monotonically applied until failure in a displacement control mode using a 250 kN hydraulic actuator at a rate of 2 mm/min. Figure 8 shows the test and beam setup details.

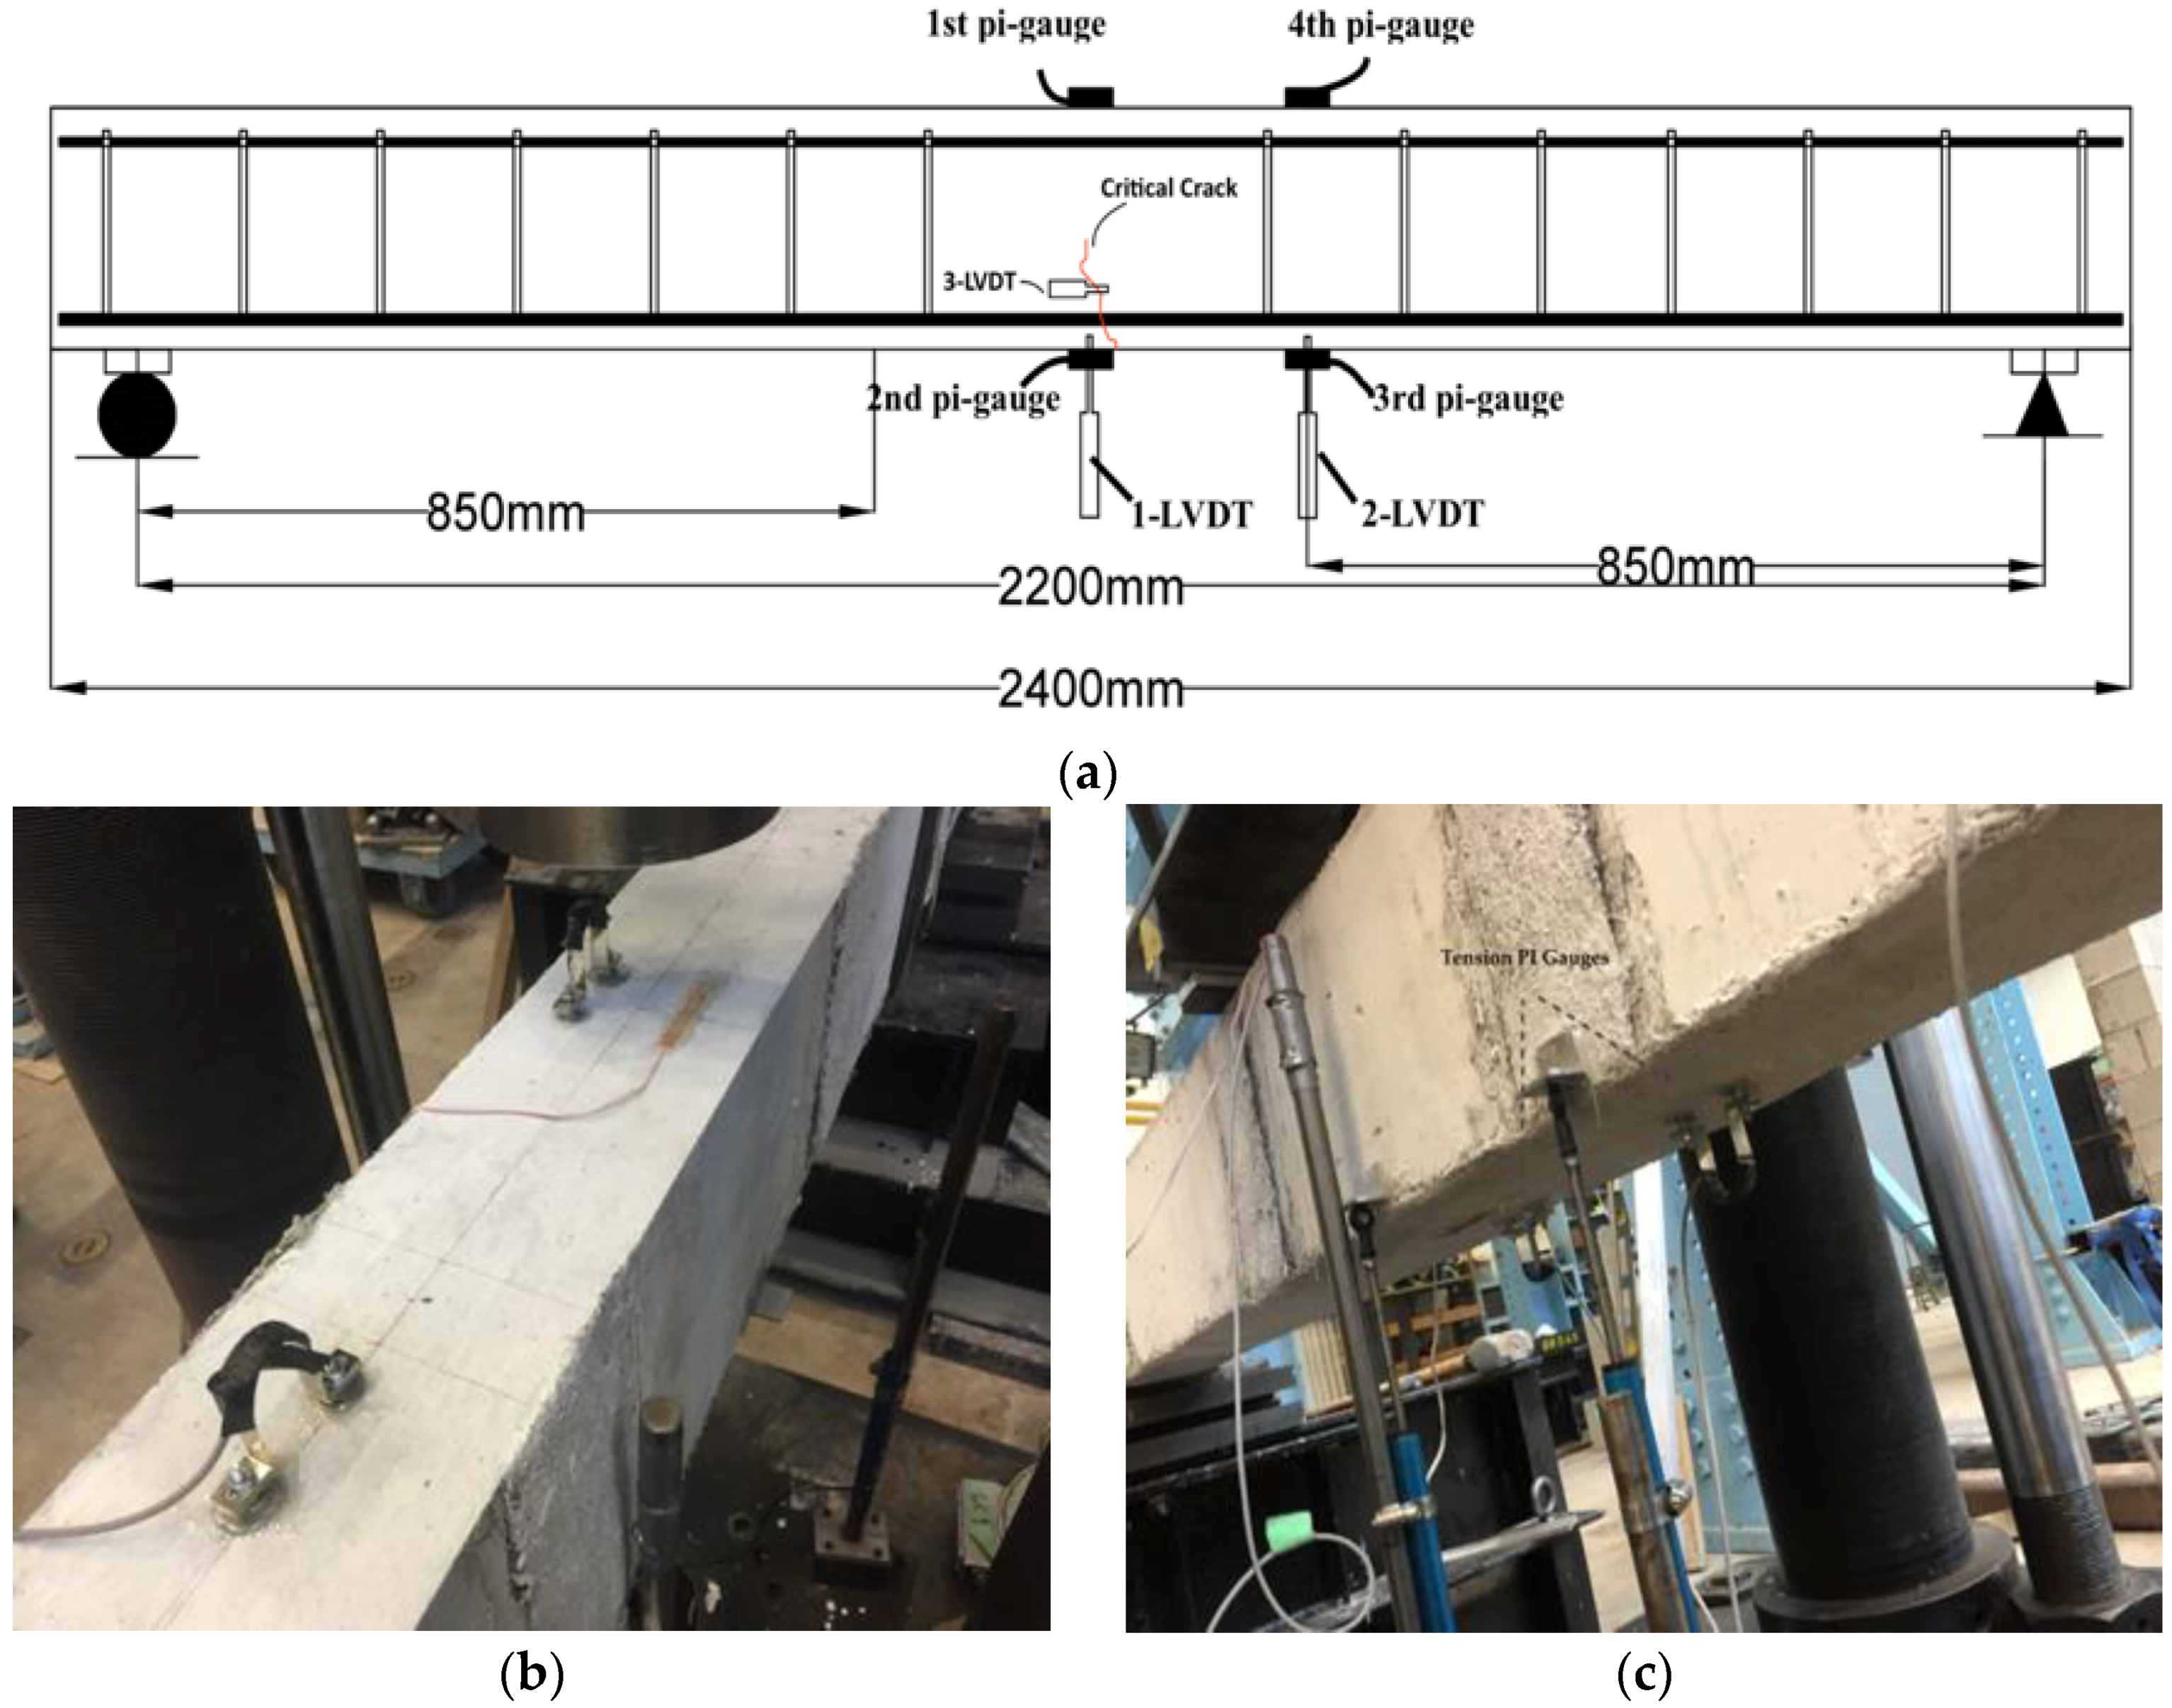
3.5. Instrumentation

Two linear variable differential transducers (LVDTs) were used to measure the deflection on the beam at the mid-span and at the location of the load. Another LVDT was used to measure the crack width of the first noticed cracks at the mid-span after the beam cracked. Two electric-foil strain gauges, 10 mm long, were installed on the bottom surface of the steel reinforcement before casting the concrete to measure the strain. Four PI gauges were installed at the mid-span and load on the beam top surface and on the FRCM surface to measure the maximum compressive and tensile strain. Figure 9 shows the instrumentation details of the set-up.

4. Test Results and Discussion

The load-deflection behaviors of the tested beams in both Groups I and II are shown in Figure 10 and Figure 11. Table 4 summarizes the measured experimental load and deflection values at steel yielding, ultimate load and at failure. Table 4 also shows the ratio of the measured yielding and ultimate loads, post-cracking and post-yielding flexural stiffness, as well as the pseudo-ductility index of the strengthened beams compared to the control ones. The pseudo-ductility index was calculated for each specimen as the ratio between the deflection values at failure and yielding. The failure deflection is assumed to correspond to a load level 20% below the ultimate capacity in the descending part of the load-deflection curve [11]. The post-cracking flexural stiffness represents the slope of the load-deflection curve between the cracking and yielding loads, while the post-yielding flexural stiffness represents the slope of the load-deflection curve between yielding and ultimate capacity. Table 4 also presents comparisons of the experimentally-measured vs. theoretical ultimate load calculated according to the ACI 549.4R-13 [8].
The load-deflection behaviors can be modeled as a tri-linear behavior representing the un-cracked section, post-cracking and post-yielding zones. The FRCM strengthening showed an insignificant effect on the cracking load and pre-cracking flexural stiffness. However, after cracking of the concrete and the cement matrix of the FRCM, the FRCM strengthening showed no significant effect to increase the post-cracking stiffness and the yielding load depending on the fiber net type. After yielding of the internal steel reinforcements and the formation of large cracks in the middle zone of the tested beams, the region of the maximum and constant bending moment, different levels and combinations of degradation and damage in the FRCM/concrete and fiber/matrix bond were observed. The type of bond damage depends mainly on the type of the FRCM material and affects the post-yielding stiffness, ultimate load and final failure mode. The main observed bond damage can be classified into three main categories, namely: (i) Type 1: debonding of fibers from the matrix (fiber slippage); (ii) Type 2: debonding of the FRCM matrix from the concrete (detaching); and/or (iii) Type 3: debonding at the fiber net layer within the FRCM matrix (delamination).

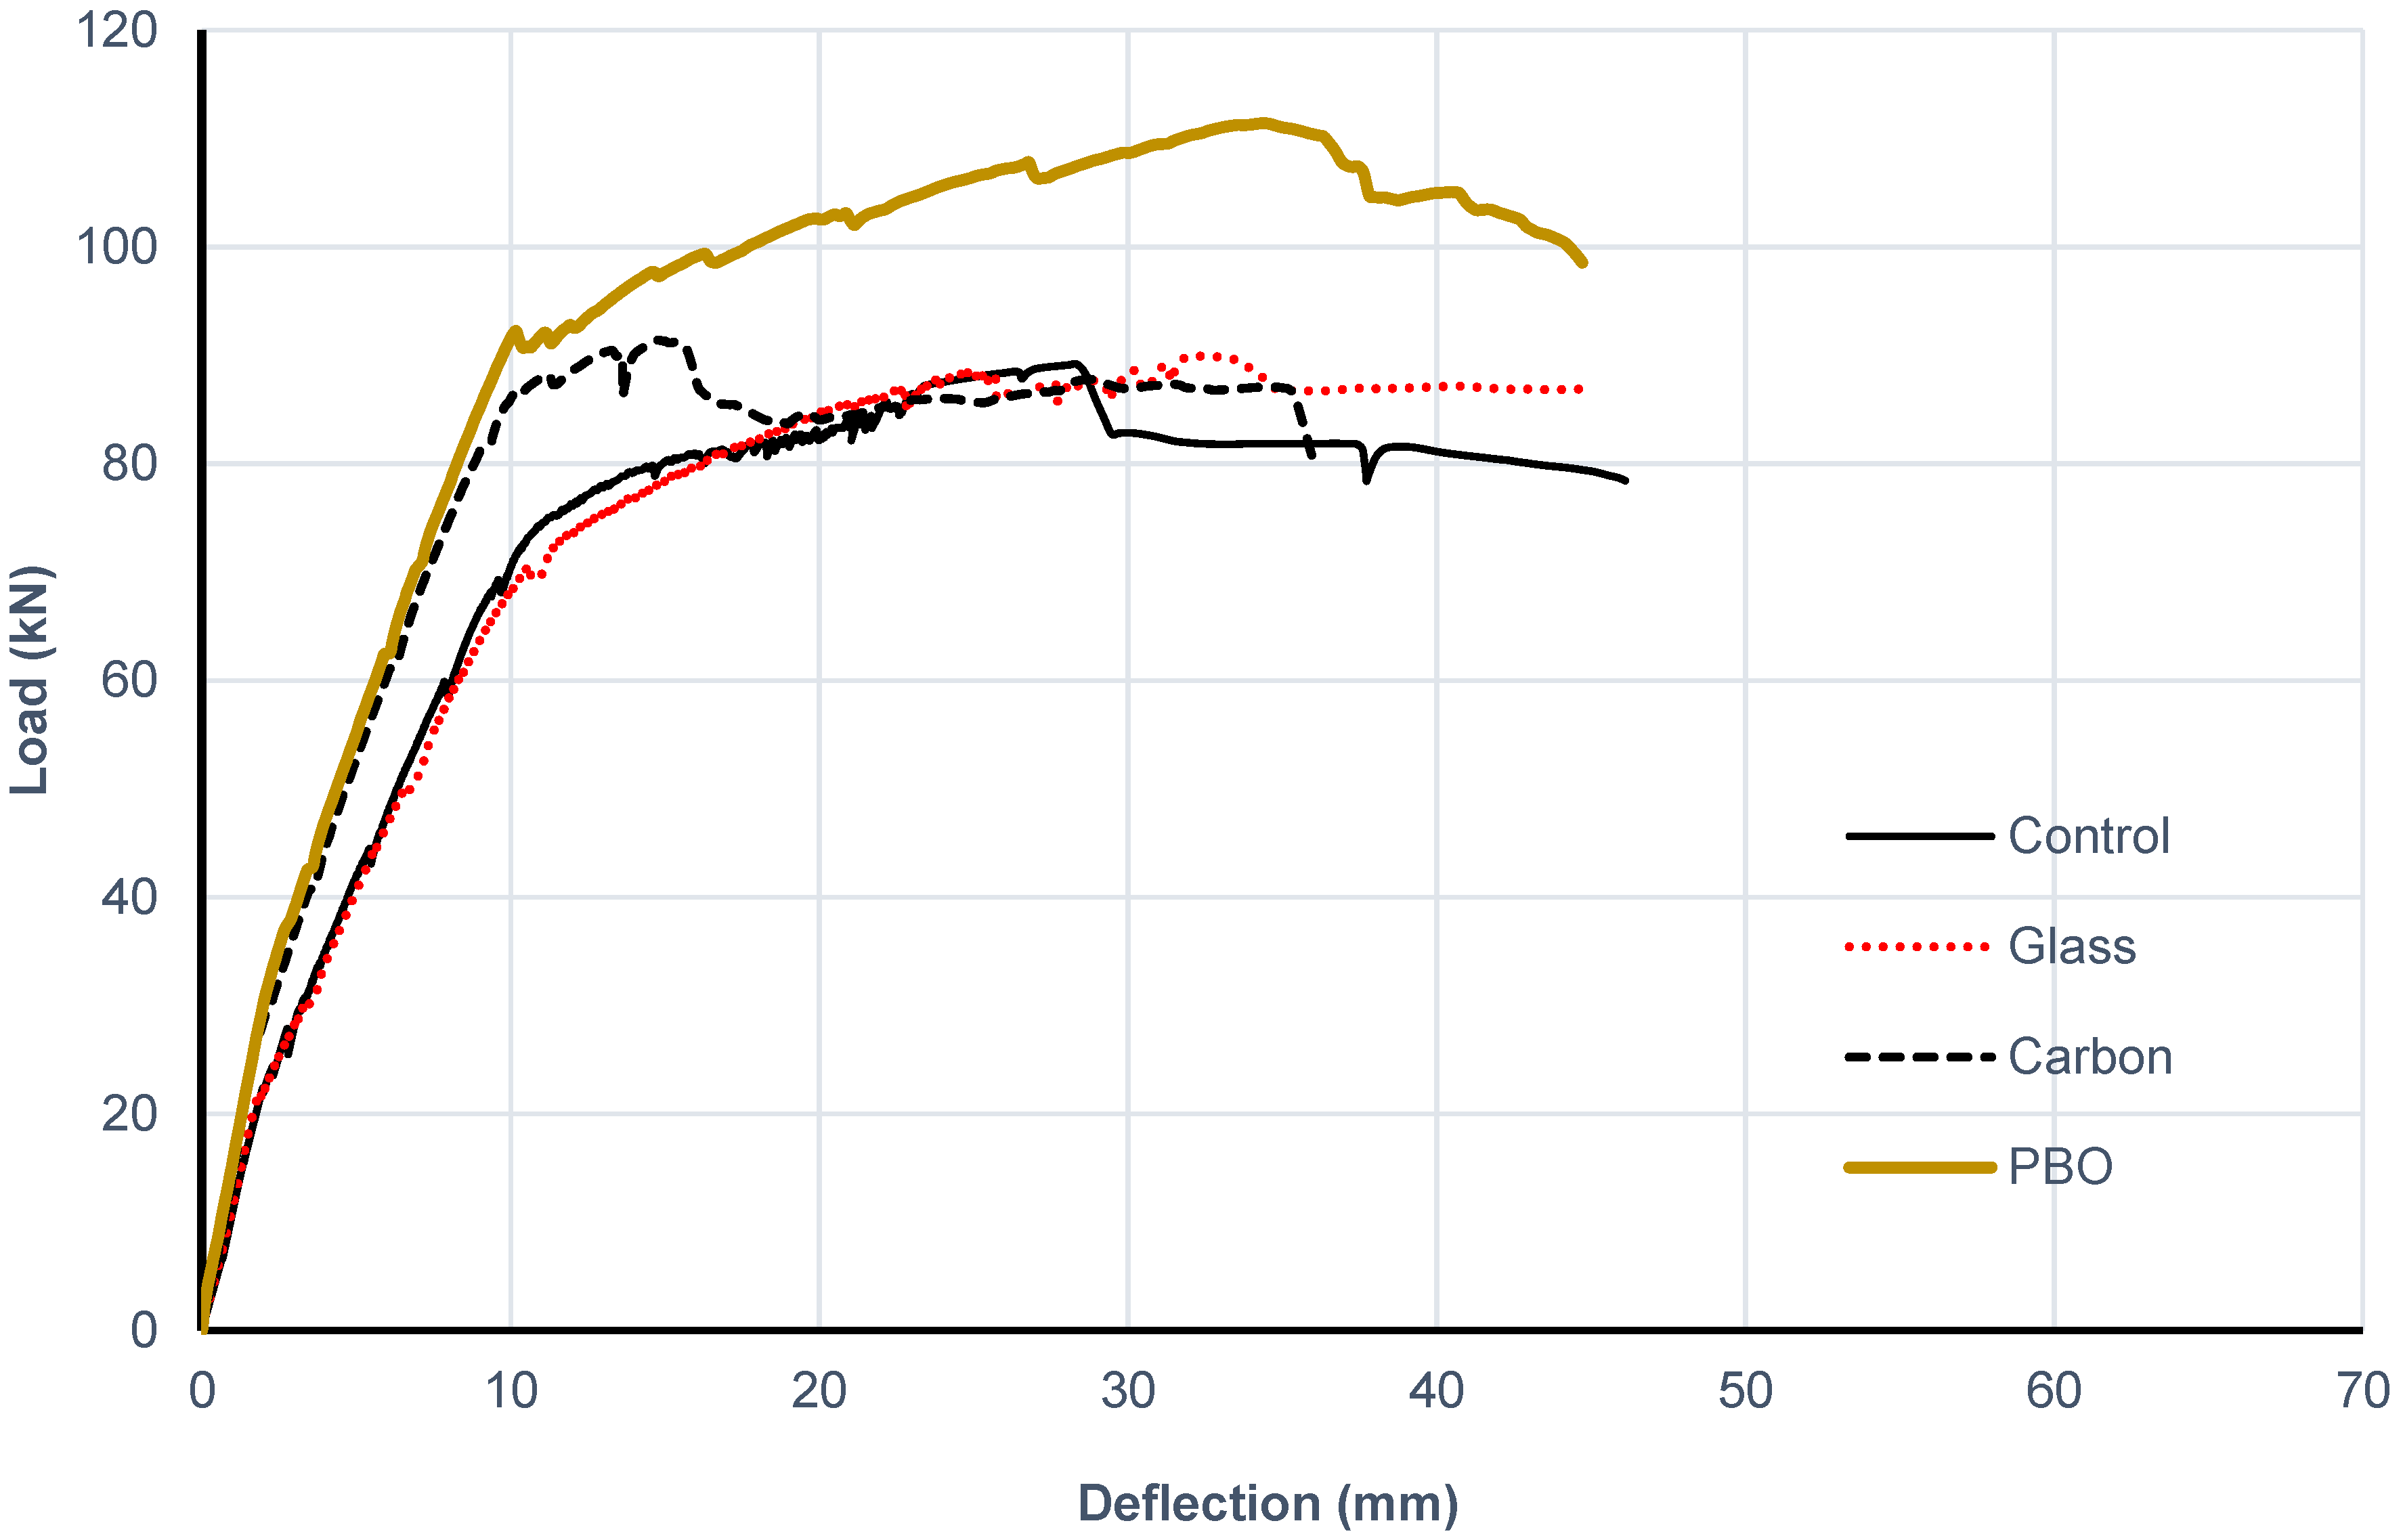
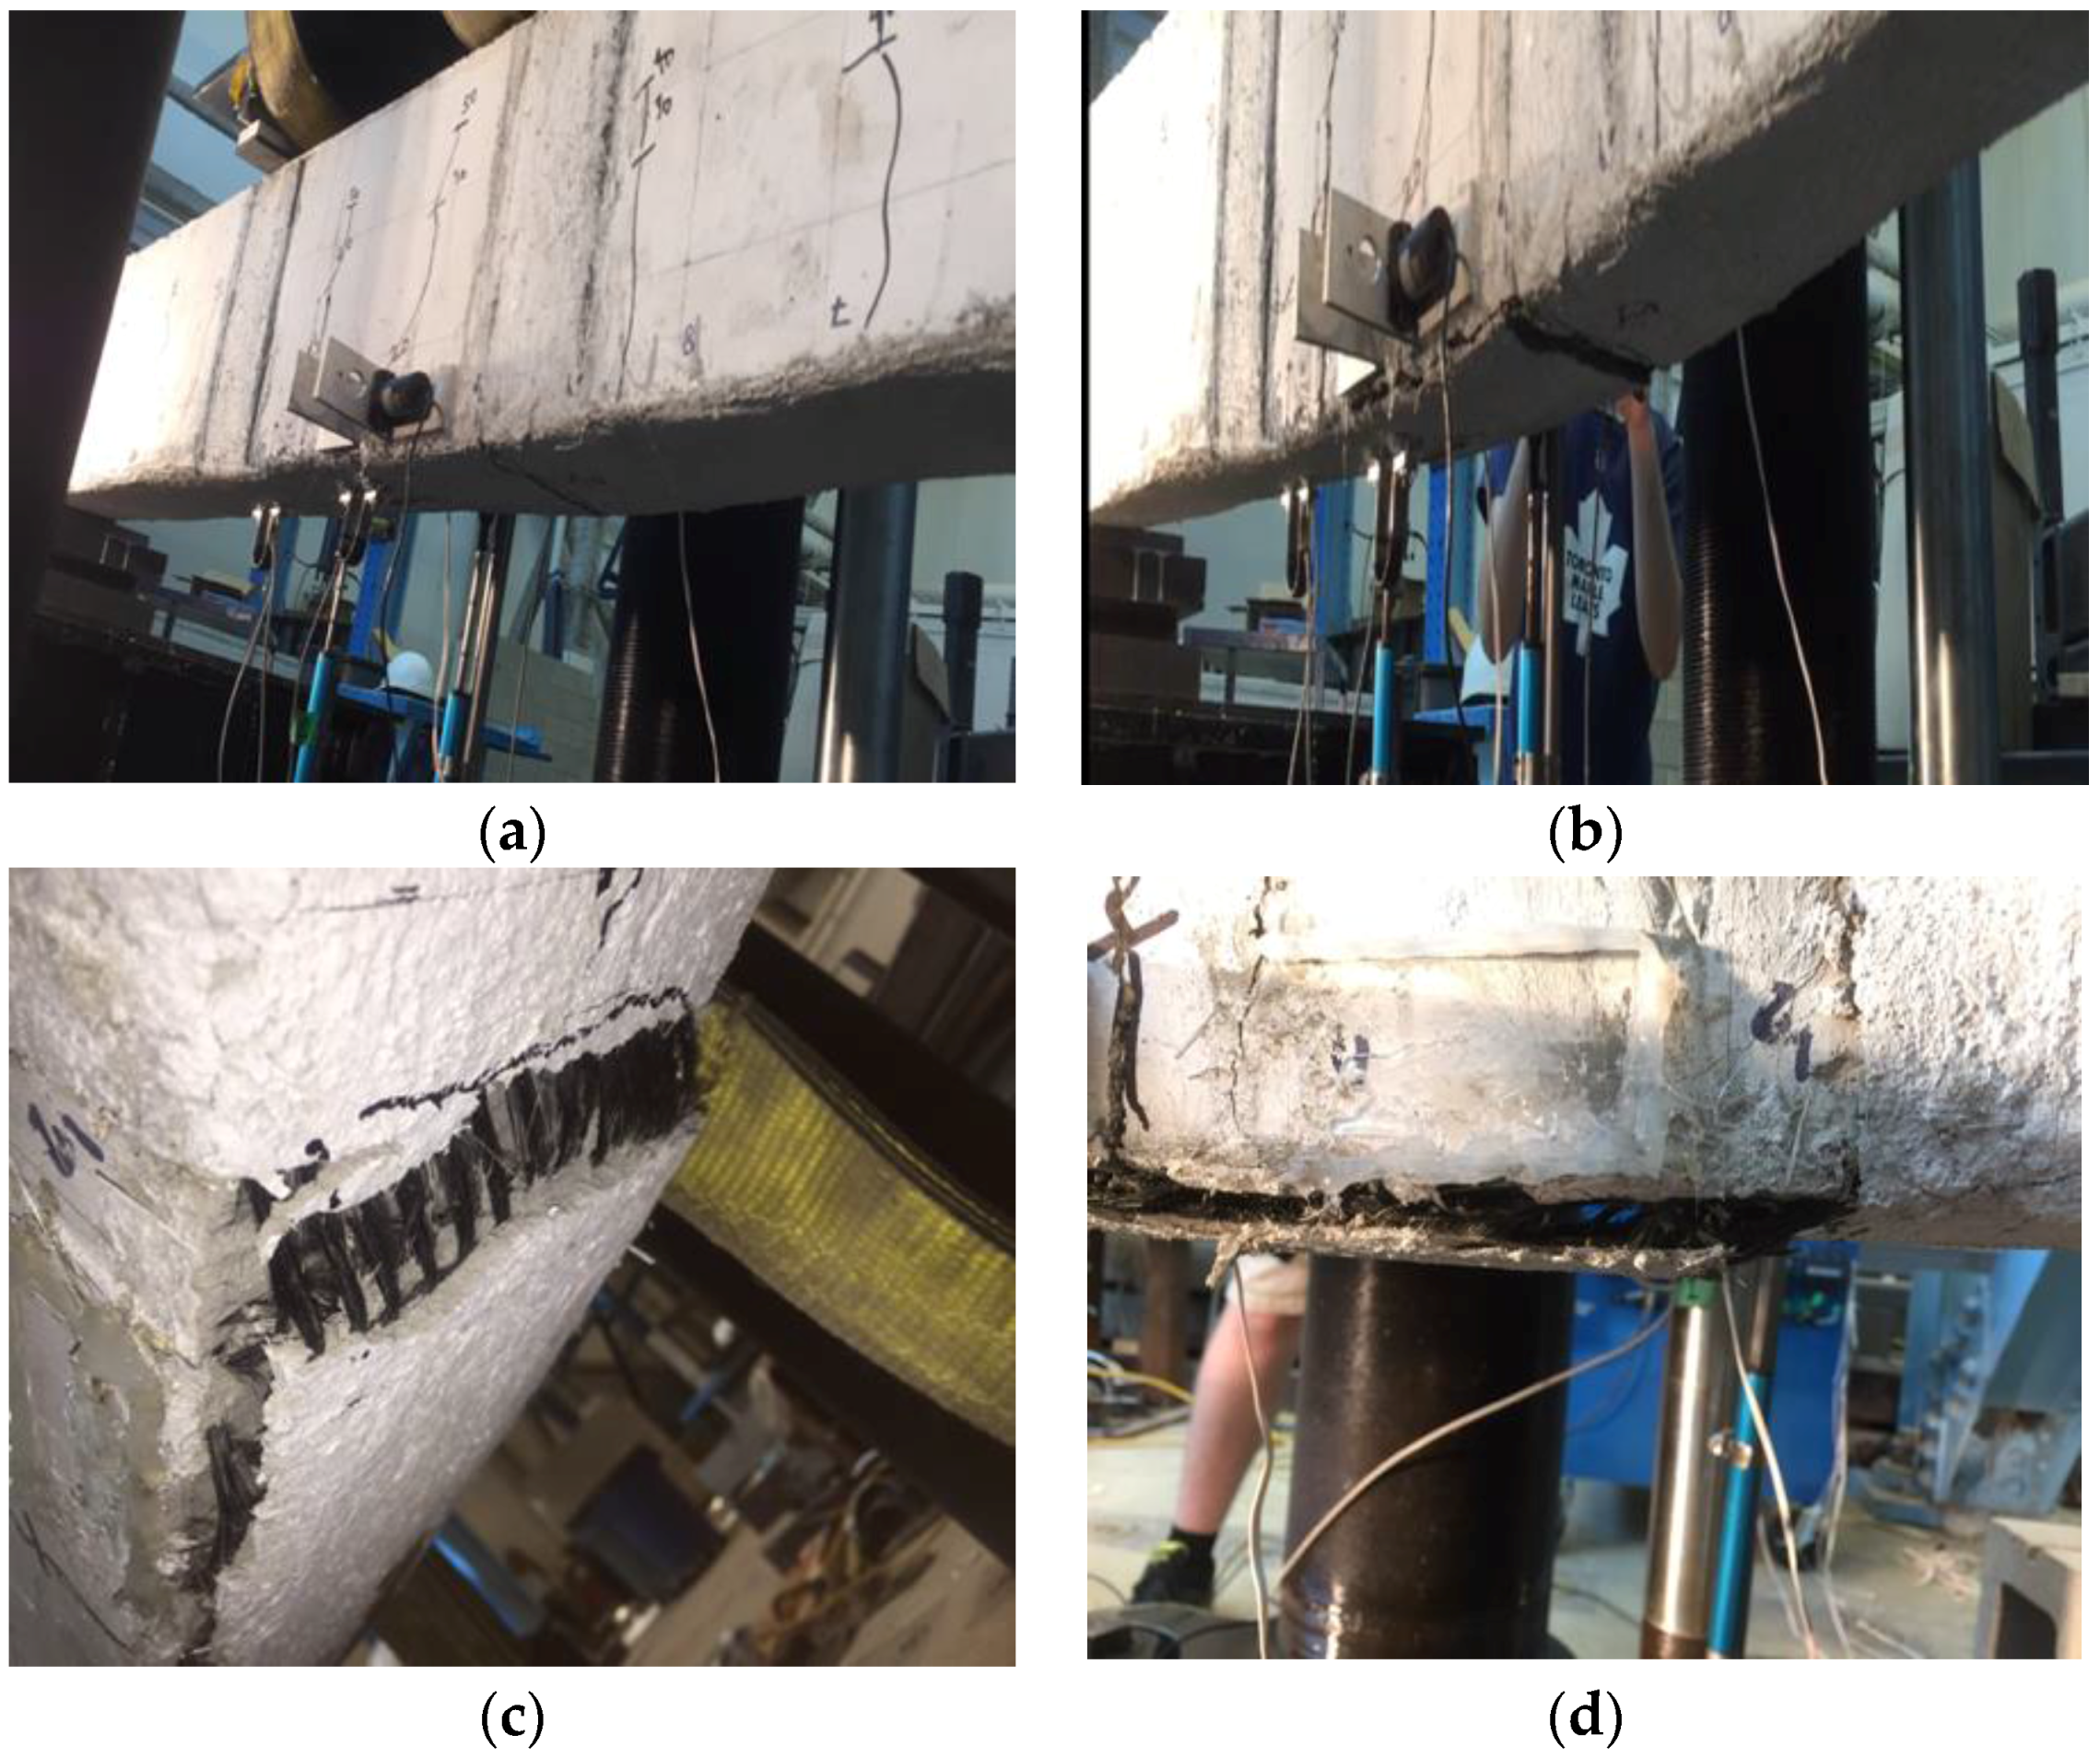
4.1. Effect of FRCM Net Fiber Type

It can be observed from the test results that the PBO FRCM had a significant impact on the ultimate load capacity of the strengthened beams. Test specimens B2-P and B4-P showed a 33% and 25% increase in the ultimate strength compared to the control (un-strengthened) ones, B2-0 and B4-0. Both B2-P and B4-P also showed a consistent increase in the yielding load and post-cracking stiffness of about 20% compared to B2-0 and B4-0. The deflection at ultimate load was always less than the control beam, while the deflection at failure was almost the same. This would indicate the contribution of the FRCM in resisting the applied loads, load-sharing, after yielding of the internal reinforcement.
The main reason behind the significant performance enhancement of B2-P and B4-P is the excellent observed bond between the PBO FRCM and the strengthened beams. For both B2-P and B4-P specimens, partial detaching of the FRCM from the bottom surface of the strengthened beams (Type 3) was observed before ultimate load in the zone between the load and the support, as shown in Figure 12a,b. When the ultimate load was reached, wider cracks in the FRCM with increased slippage of fiber (Type 1) close to the support occurred, as shown in Figure 12c. Only for B2-P, the slippage of fiber is followed by detaching of the U-wrap under the load (Type 2), as shown in Figure 12d. The observed bond behavior of both B2-P and B4-P conforms very well with the findings of previous studies, as discussed in Section 2 [4,12,17,18,20,23].
On the other hand, neither the carbon nor glass FRCM provided a noticeable increase in the ultimate load capacity, as they both resulted in an increase in ultimate load of less than 5%. The C-FRCM resulted in the highest increase in the post-cracking stiffness as the yielding load increased by about 23% and 17%, and the deflection at yielding also decreased in B2-C and B4-C compared to the control ones. However, both B2-C and B4-C suffered from severe degradation and premature bond failure between the FRCM and concrete after yielding of the internal reinforcement. Premature detachment of the C-FRCM (Type 2) occurred at mid-span slightly after the steel yielded, which was quickly followed by slippage of fibers from the mortar (Type 1). This is represented by the sudden drop in load, as shown in the load-deflection curves in Figure 11a,b. As the load increases, an excessive slippage accompanied with an increased detachment was observed until failure, as shown in Figure 13c,d. This premature failure compromises the strengthening effect of the carbon FRCM compared to the PBO FRCM as the carbon fibers slipped rather than reaching the ultimate capacity and rupturing. This behavior was identical for both Group I and II C-FRCM-strengthened beams. Similar failure modes and bond behaviors of the carbon FRCM were also reported in previous studies [4,12].
Test specimens B2-G and B4-G strengthened with glass FRCM showed similar behavior as the carbon FRCM. B2-G, strengthened with four layers of glass FRCM showed higher post-cracking and post-yielding stiffnesses, almost the same as the PBO FRCM. However, premature bond failure in the form of detaching of FRCM (Type 2) occurred at mid-span and propagated through the entire area between the concentrated loads after yielding of the internal reinforcement, as shown in Figure 14a. Increasing the load resulted in slippage of fibers (Type 1) and complete detachment with rupture of the G-FRCM at failure, as shown in Figure 14b. B4-G, which was strengthened with only two layers of glass FRCM, suffered from the premature bond failure between the FRCM and the concrete at early stages, after concrete cracking and before yielding, which totally compromise the strengthening effect. Therefore, the behavior of B4-G is almost the same as the control specimen B4-0.
To avoid the premature bonding failure in carbon and glass FRCM, it is suggested to apply the FRCM as a full and continuous U-wrapping, which covers the full bottom surface and fully or partially extends on both sides of the beam. Furthermore, increasing the roughness of the substrate surface and using another mortar type with better bonding properties to the fabric and to the substrate will help to avoid the premature detachment of the FRCM from the concrete.

4.2. Effect of the Axial Stiffness Ratio of Strengthening Material to the Steel Reinforcement

The test specimens had two different internal steel reinforcements with reinforcement ratios of 0.18 and 0.36 of the balanced ratio. Furthermore, different fiber types and numbers of layers were used in strengthening the flexural capacity of identical beams with different internal reinforcement ratios. The ratio of the axial stiffness of the FRCM strengthening to the axial stiffness of the internal reinforcement is given in Table 3. Test results presented in Table 4 and Figure 10 and Figure 11 indicate that the axial stiffness ratio affects the effectiveness of the FRCM strengthening. Figure 15 shows comparisons of the increase in the ultimate strength of beams in Groups I and II (0.18 and 0.36 internal reinforcement ratios). It can be noticed that the percentage increase in the ultimate strength decreased when the axial stiffness ratio decreased.

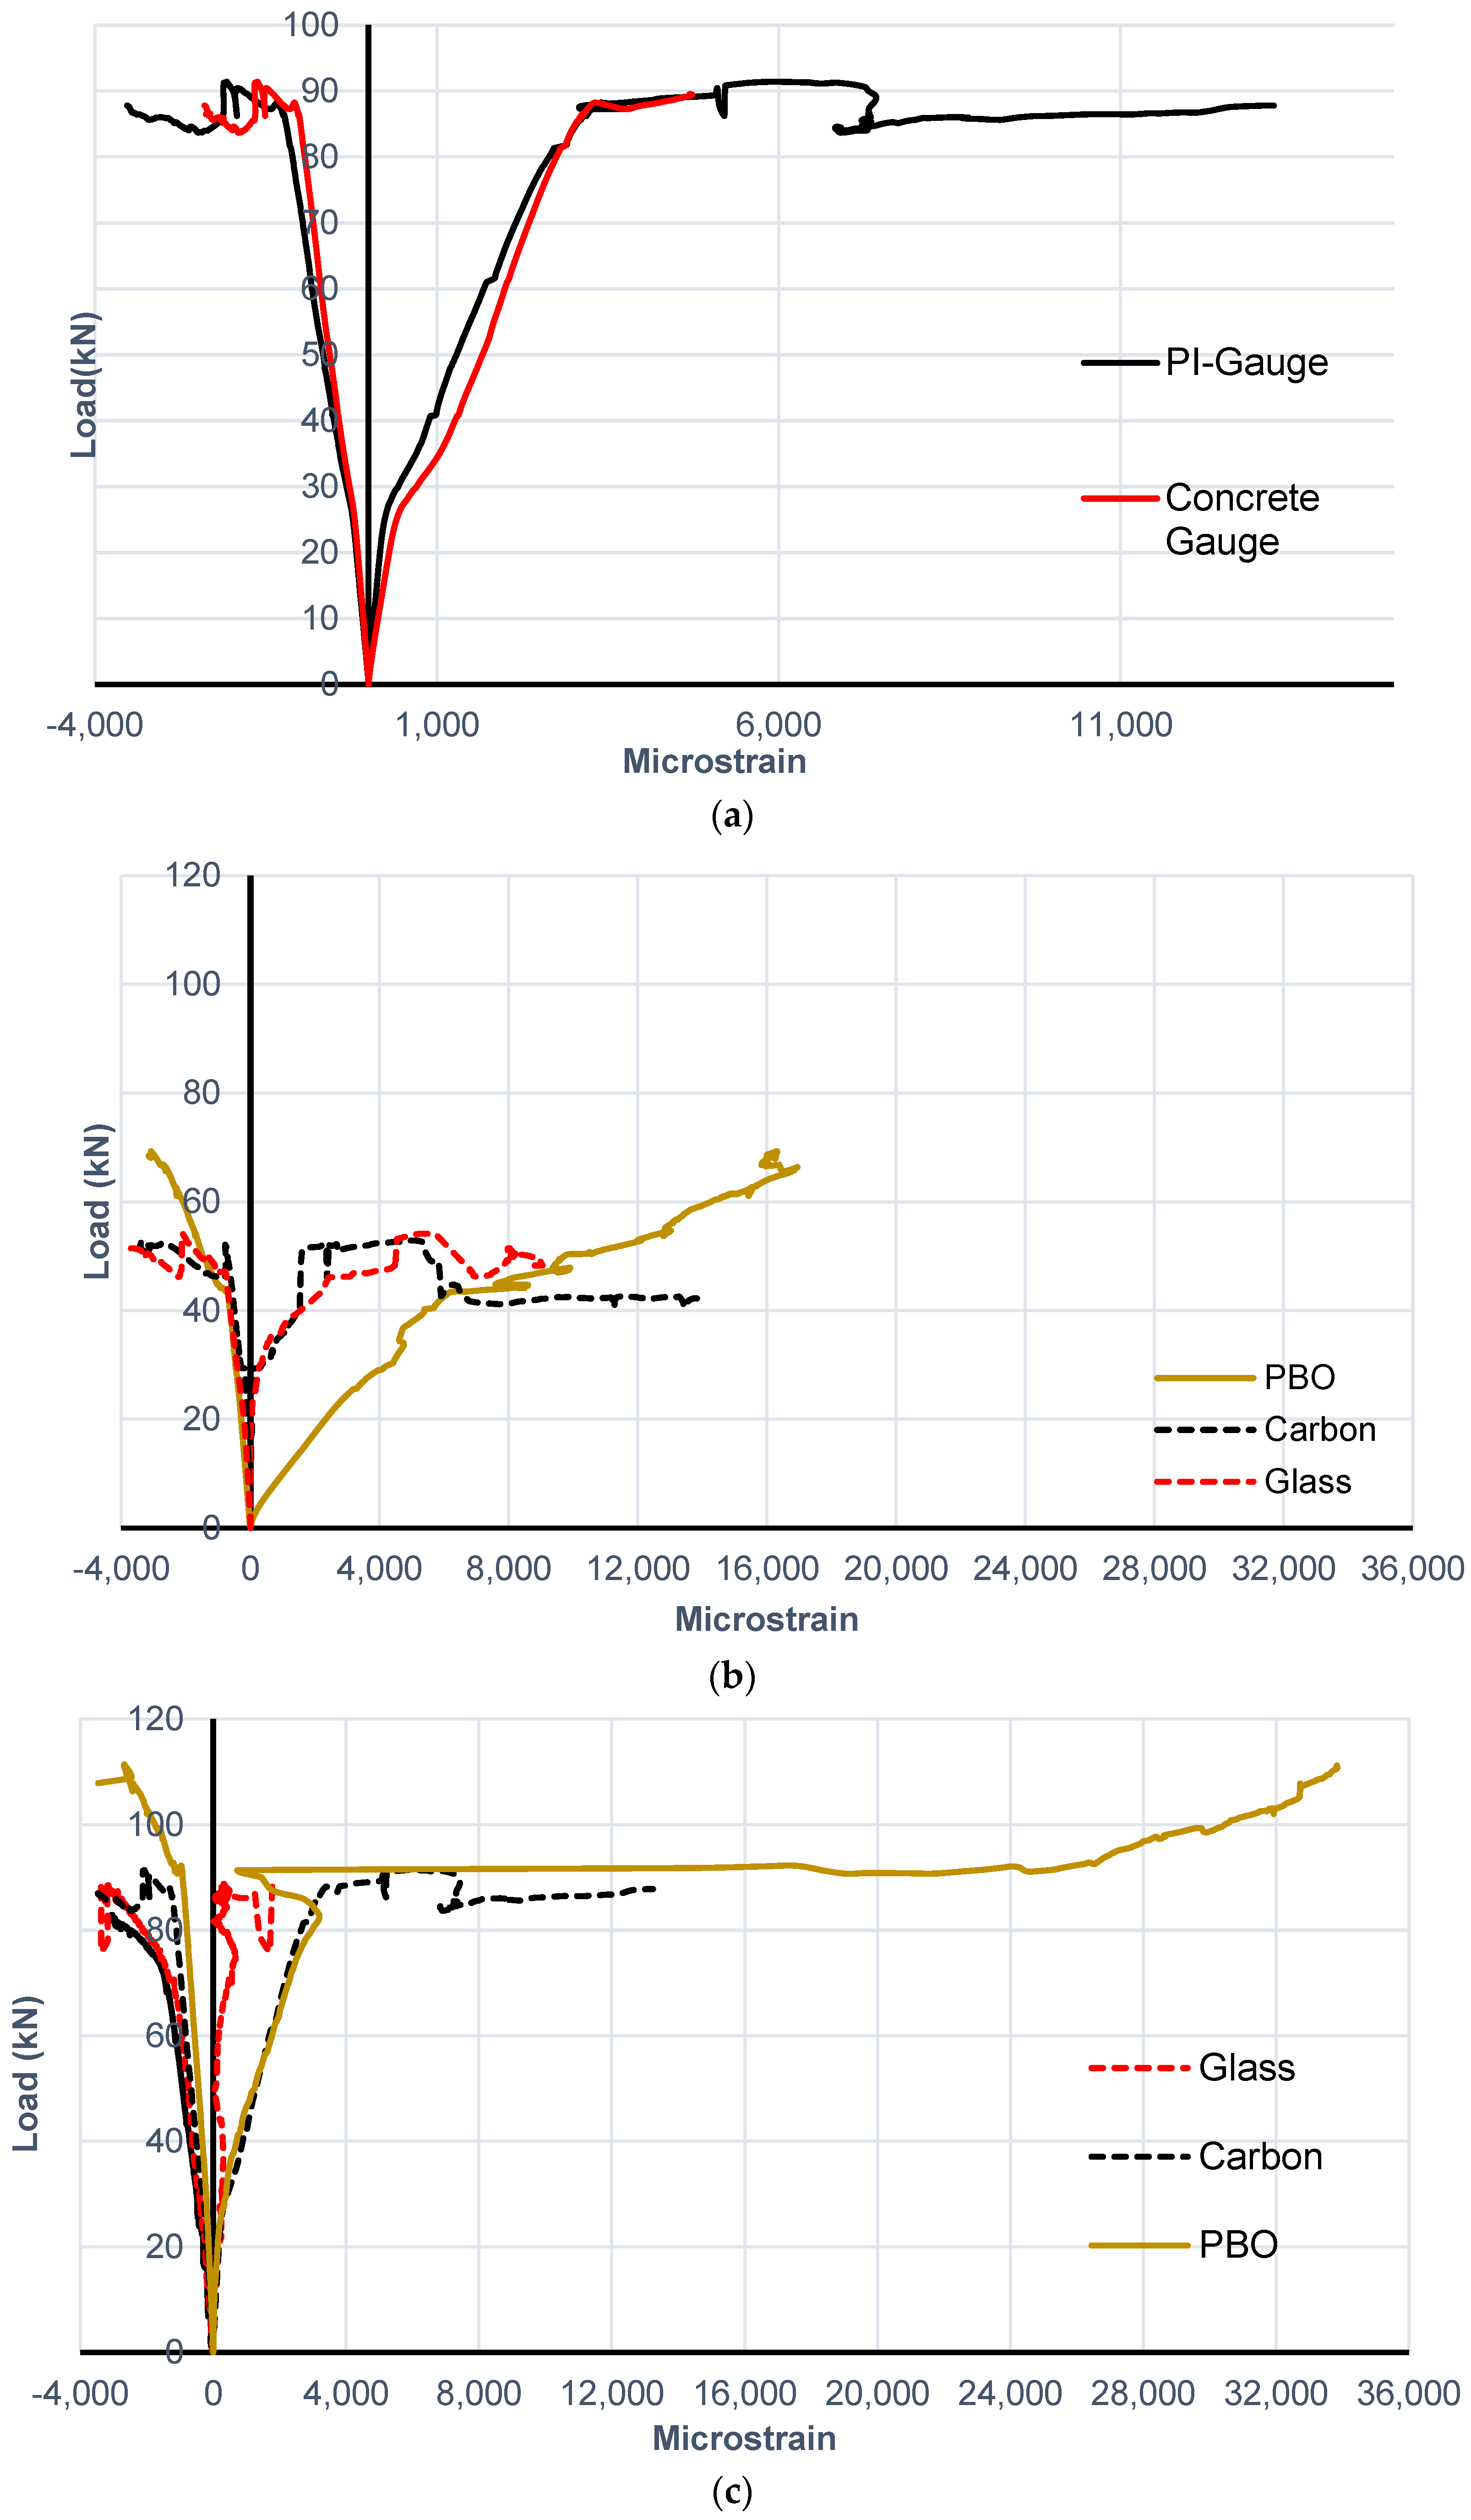
4.3. Load-Strain Relationship

In this section, only the strains in concrete and FRCM at mid-span will be discussed. Two PI gauges were used to measure the concrete top compression and FRCM bottom tension strains at mid-span, as shown in Figure 9b,c. The main advantage of using PI gauges is the ability to monitor the strain behavior even after the development of wider cracks in the concrete and mortar substrate. Some test specimens were also instrumented with 70 mm-long concrete strain gauges to compare and calibrate the readings of the PI gauges. Figure 16a shows the comparisons of both the concrete gauges and PI gauges strain measurements in B4-C specimen. The negative values for the strain represents the compressive strains at the top of the concrete cross-section, whereas the positive values represent the strains at the FRCM bottom surface. It can be noticed that the PI gauge tensile and compressive strain measurements conform well with the concrete strain gauges, in the tension and compression sides, up to about 85 kN. The load-tensile strain behavior can be divided into three main stages: (1) the uncracked stage up to about 25 kN; (2) the multi-cracking process in the FRCM matrix up to about 80 kN; and (3) after the matrix is fully cracked and the load is resisted mainly by the fibers. When the FRCM matrix is fully cracked, the concrete strain gauge is lost, and the PI gauge reading showed a sudden increase in the strain with little to no increase in the load. Figure 16b,c shows the load-strain behaviors for Group I and II specimens, respectively. It can be noticed that the strain measurements in the FRCM conforms with the bond behavior noticed during testing and described in the previous section. Both pre-mature detaching of the FRCM and slippage of FRCM fiber nets resulted in decreasing of the strain measured in the glass and carbon FRCM compared to the PBO FRCM. It can be noticed that the PBO FRCM recorded the highest strain during loading. This indicated that the PBO FRCM was involved in resisting the applied load and, hence, resulted in increasing the ultimate capacity. In Figure 16c, at about 85 kN, partial detaching of the FRCM from the bottom surface of the strengthened beams was noticed, which resulted in the gradual decrease in the strain. The large horizontal plateau (sudden increase in the tensile strain) in the B4-P load-strain behavior was due to the formation of wider cracks in the matrix when the load increased beyond 90 kN. The compressive strains in the concrete at failure was in the range of 3500 to 4000 microstrains.

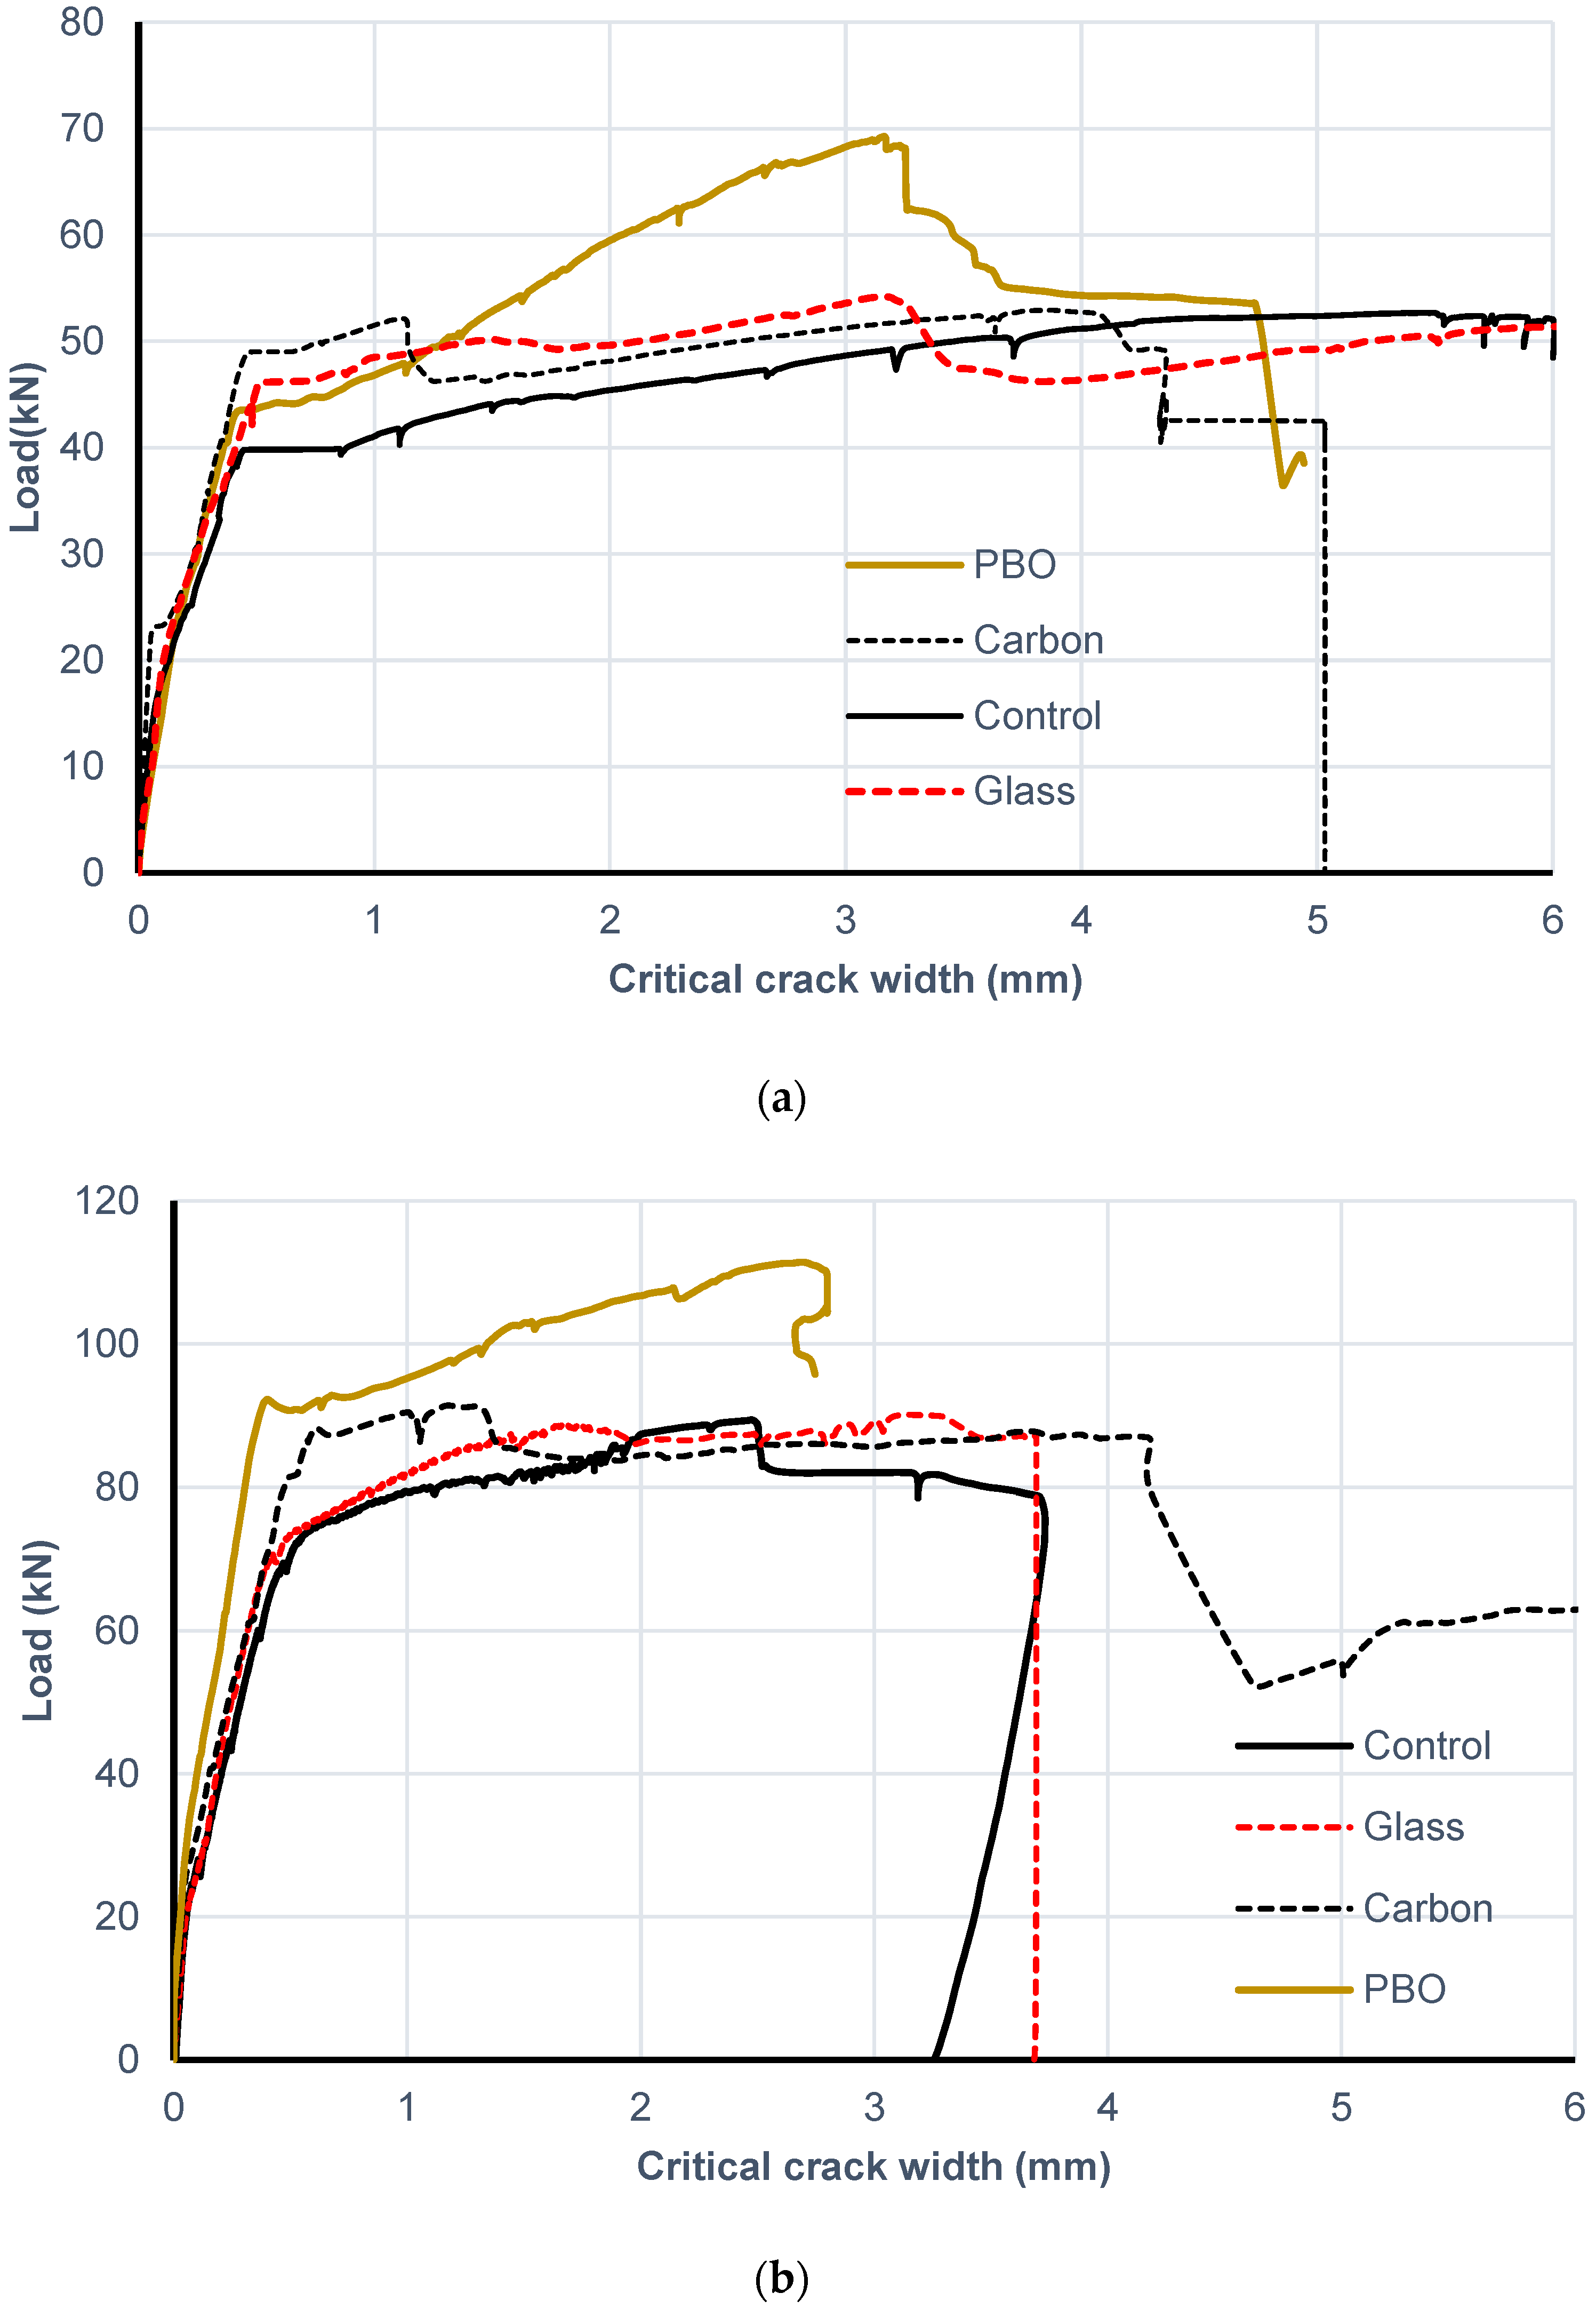
4.4. Critical Crack Width

A short-stroke LVDT was installed at the first crack developed around mid-span, the region of maximum moment, i.e., between the two concentrated loads. The beam is initially loaded until cracking. After cracking, the LVDT was mounted, and the beam was reloaded again until failure. Figure 17a,b shows the load vs. critical width relationships for both Group I and II beams. The behavior is similar to the load-deflection behavior for all beams. The significant increase in the crack width after yielding of the steel reinforcement can be noted. Furthermore, it can be noticed that before any detachment or fiber slippage, the FRCM system helps in reducing the crack width for the strengthened beams in comparison with the control beam.

5. Conclusions

In this research, flexural strengthening of reinforced concrete beams using FRCM is presented. This paper focused on studying the effect of applying two layers (moderate strengthening) of glass, PBO and carbon FRCM systems on the flexure capacity and behavior of concrete beams reinforced with low and medium steel reinforcement ratios (0.18 and 0.36 ρb). From the presented experimental test results, it can be concluded that:
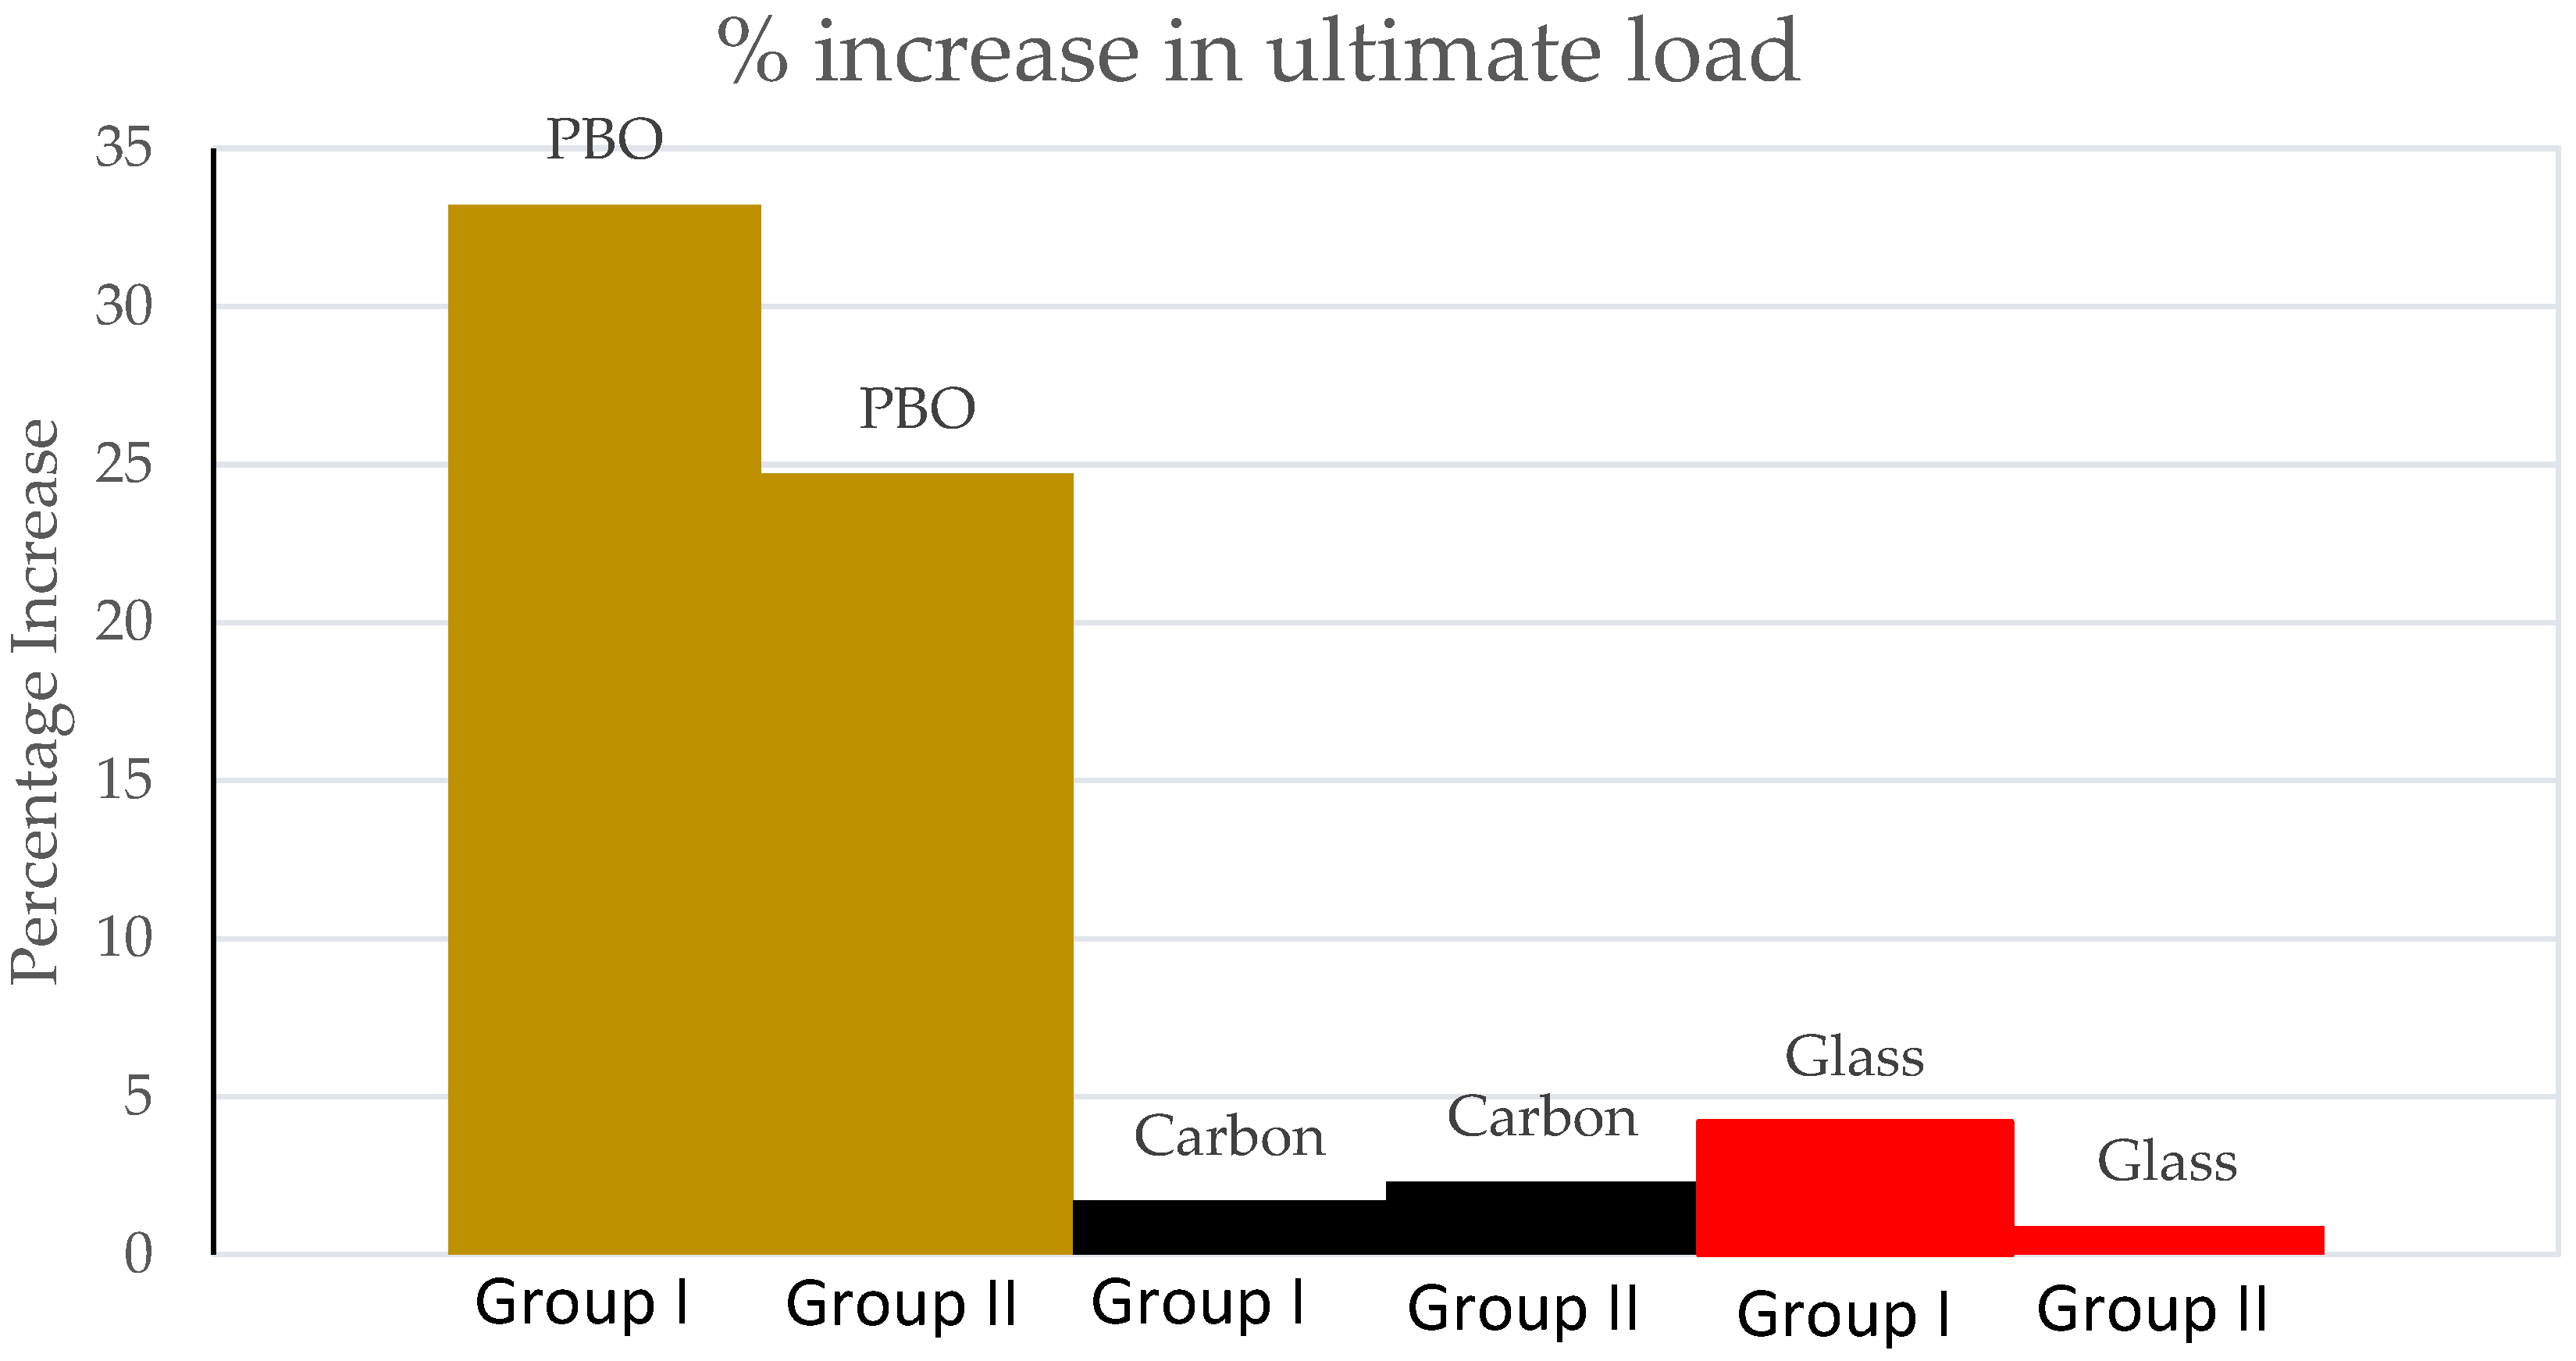
  • PBO FRCM had a significant impact on the ultimate capacity of the strengthened beams. The increases of 33% and 25% were obtained in comparison with the control (un-strengthened beam) for beams reinforced with low and moderate reinforcement ratios, respectively.
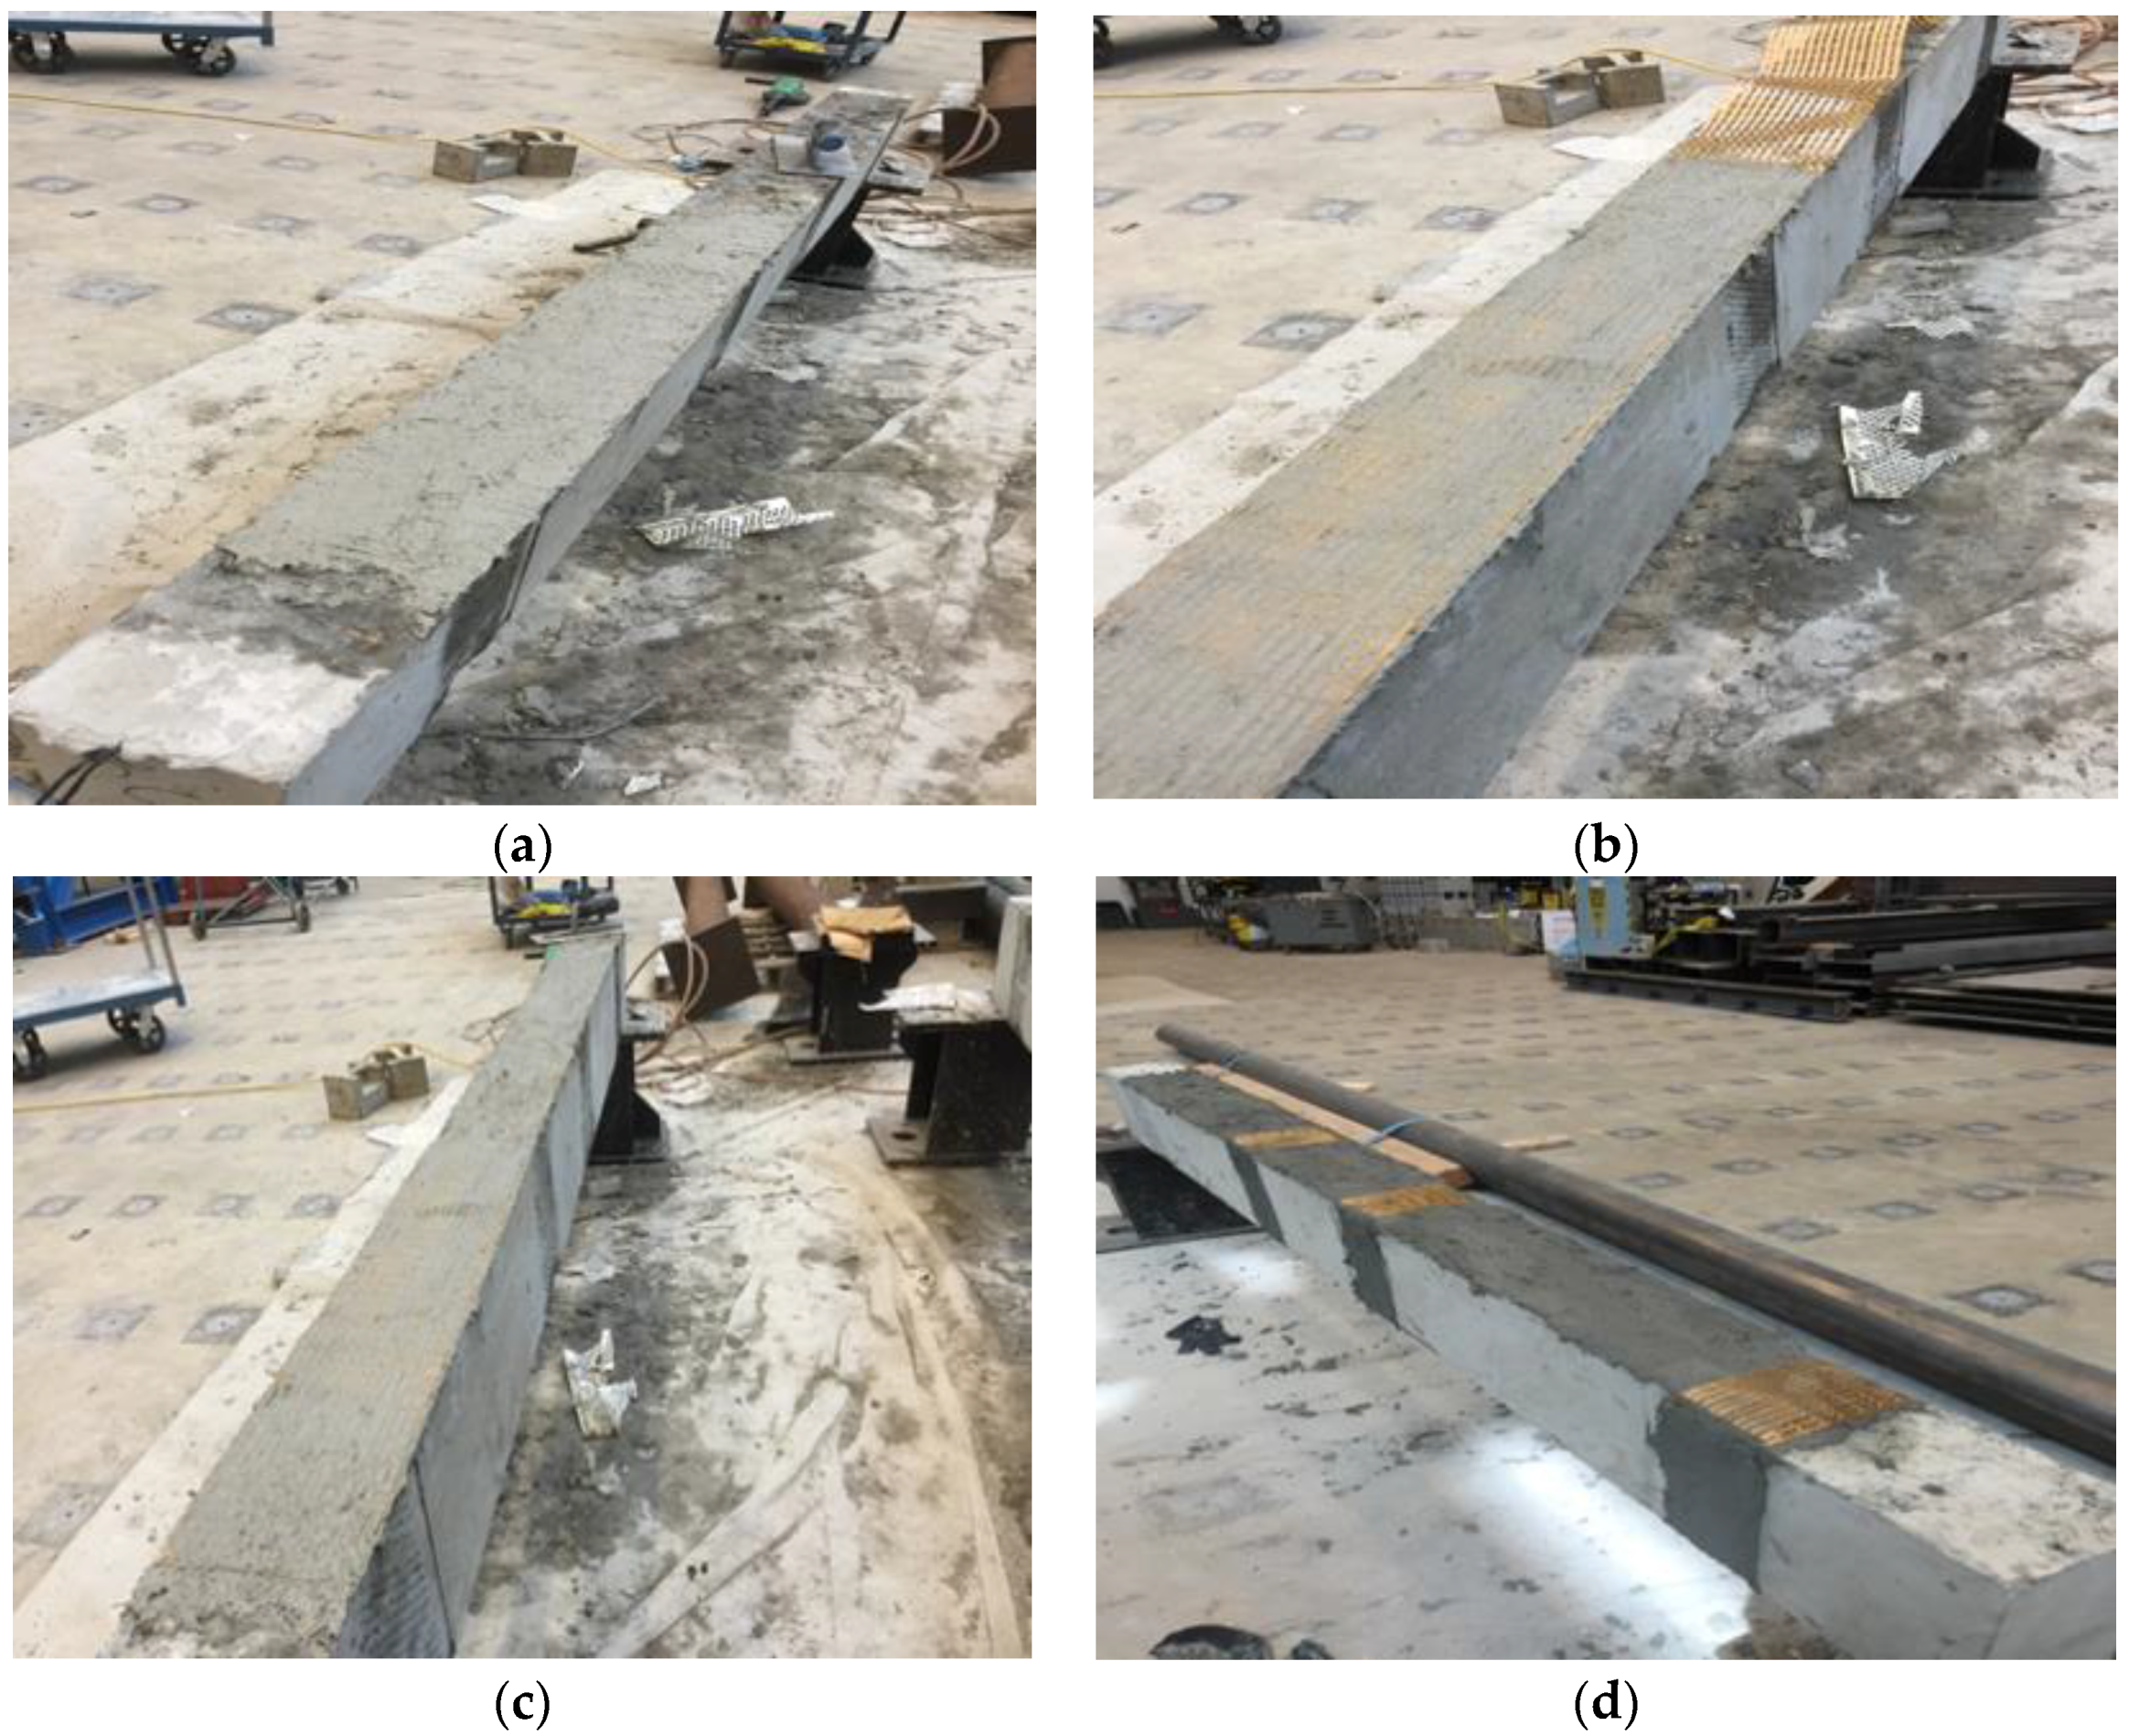
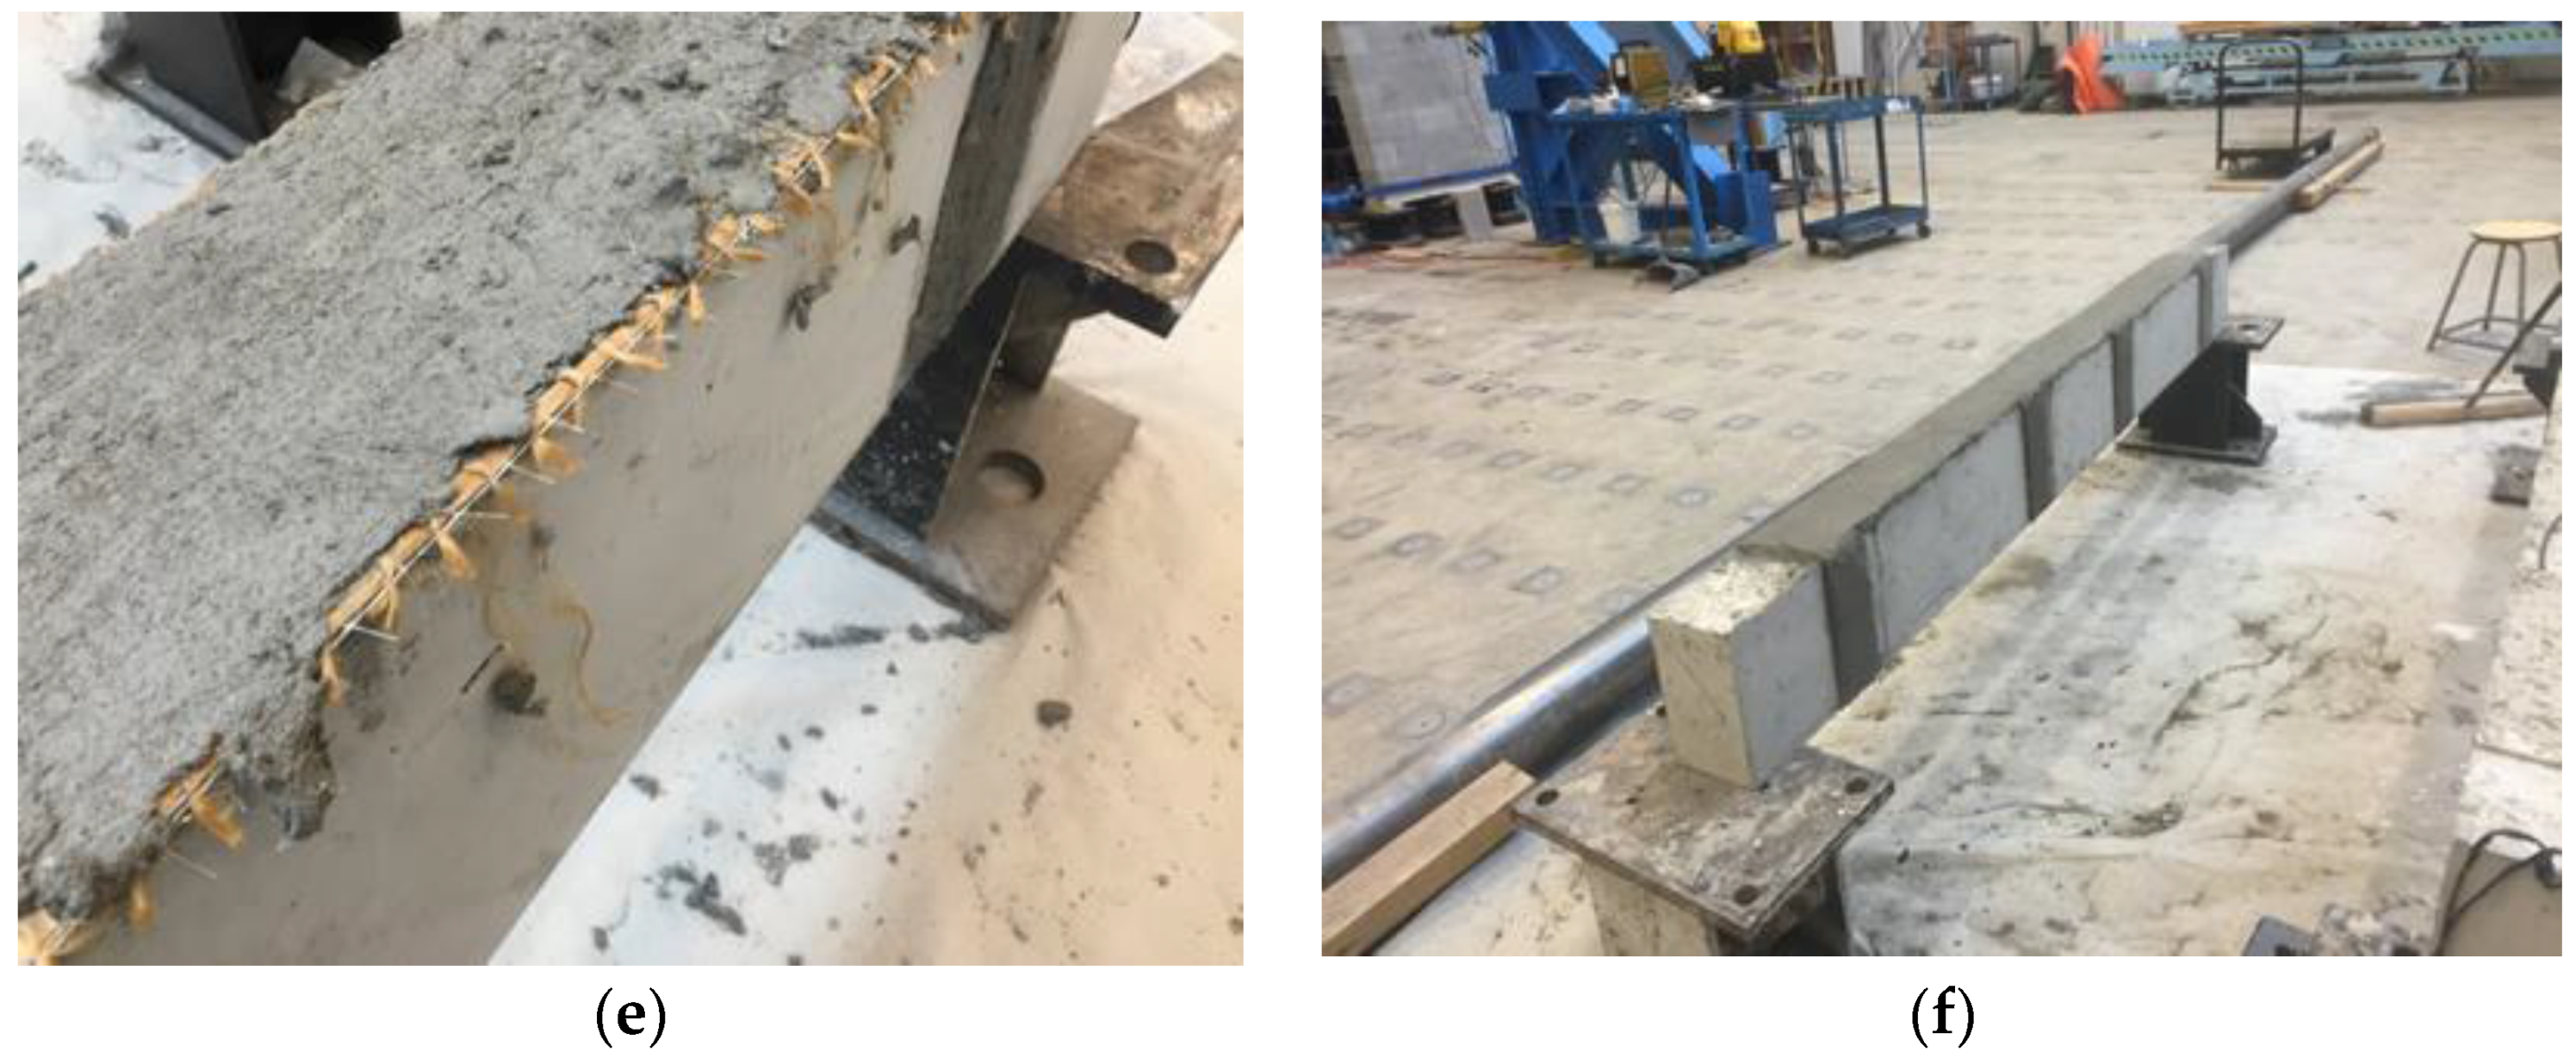
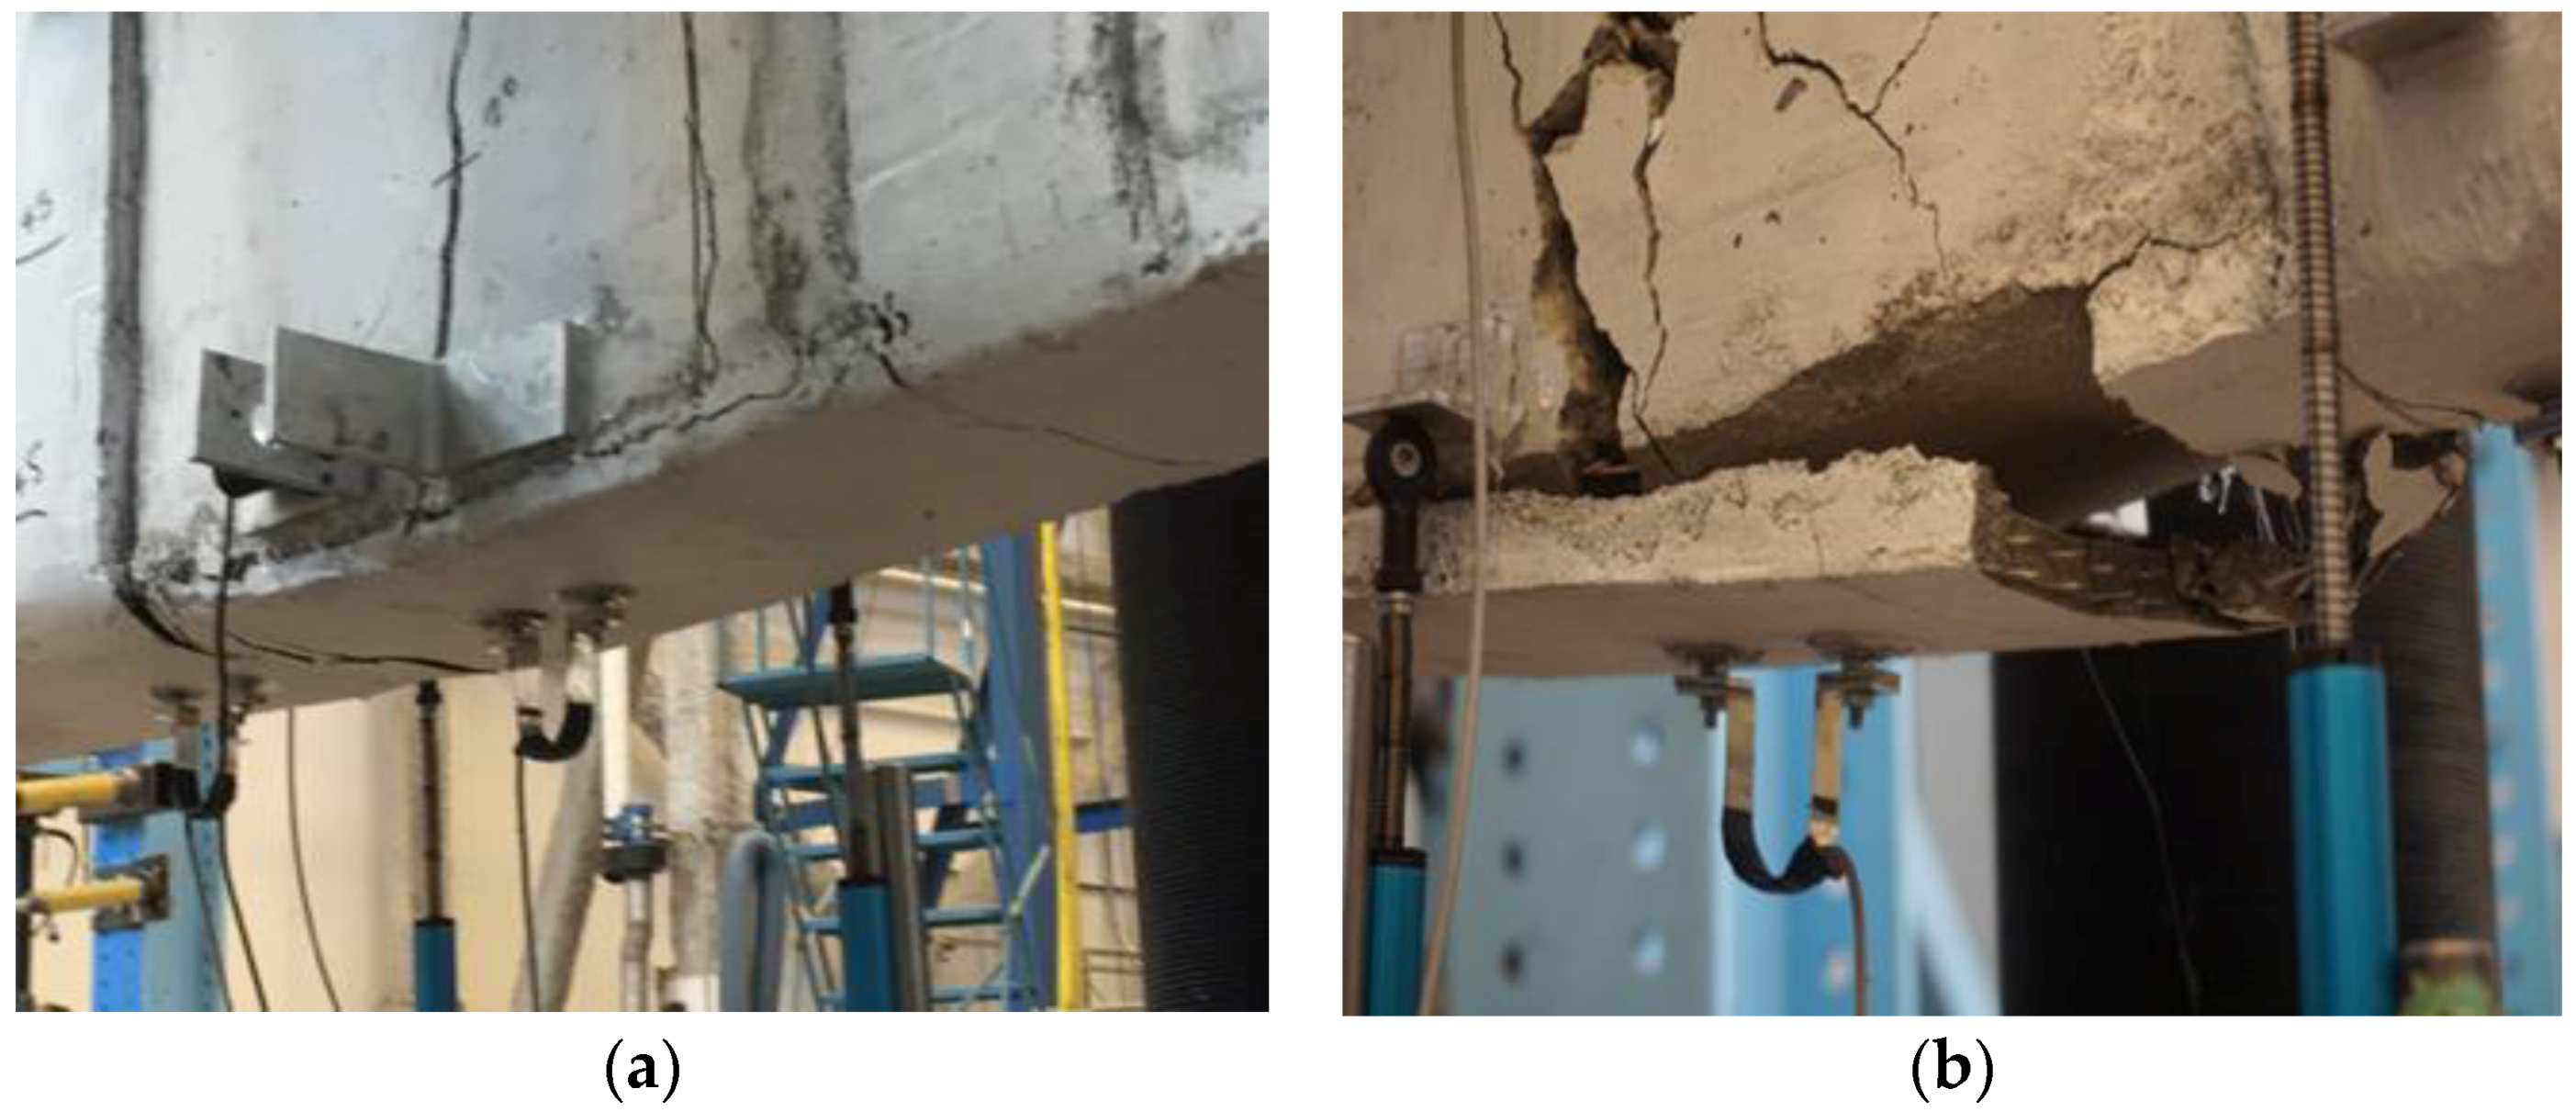
  • Both carbon and glass FRCM did not provide a noticeable enhancement in the ultimate load capacity of the strengthened beams, as they both resulted in an increase in ultimate load less than 5%. This is mainly due to the premature bond failure of the FRCM.
  • The PBO and carbon FRCM increased the strengthened beams post-cracking and post-yielding stiffnesses.
  • It was noticed that as the increase in the ultimate strength decreases, the axial stiffness ratio (EAFRCM/EASteel) decreases.
  • The theoretical analysis carried out according to the ACI 549.4R-13 guidelines shows that the predicted results are within an acceptable accuracy compared to the experimental results.

Acknowledgments

The authors would like to express their gratitude and sincere appreciation for the support and material provided from Ruredil Spa Italy and Sika Canada Inc. The help received from the technical staff of the Structural Laboratory in the Department of Civil and Environmental Engineering at the University of Windsor is also acknowledged.

Author Contributions

This paper is part of Abdulla Jabr M.Sc. research. He fabricated and tested the test specimens and analyze the data under the supervision of the research advisors, Amr El-Ragaby and Faouzi Ghrib. All authors contributed to the analysis and interpretation of data and writing this paper.

Conflicts of Interest

The authors declare no conflict of interest.

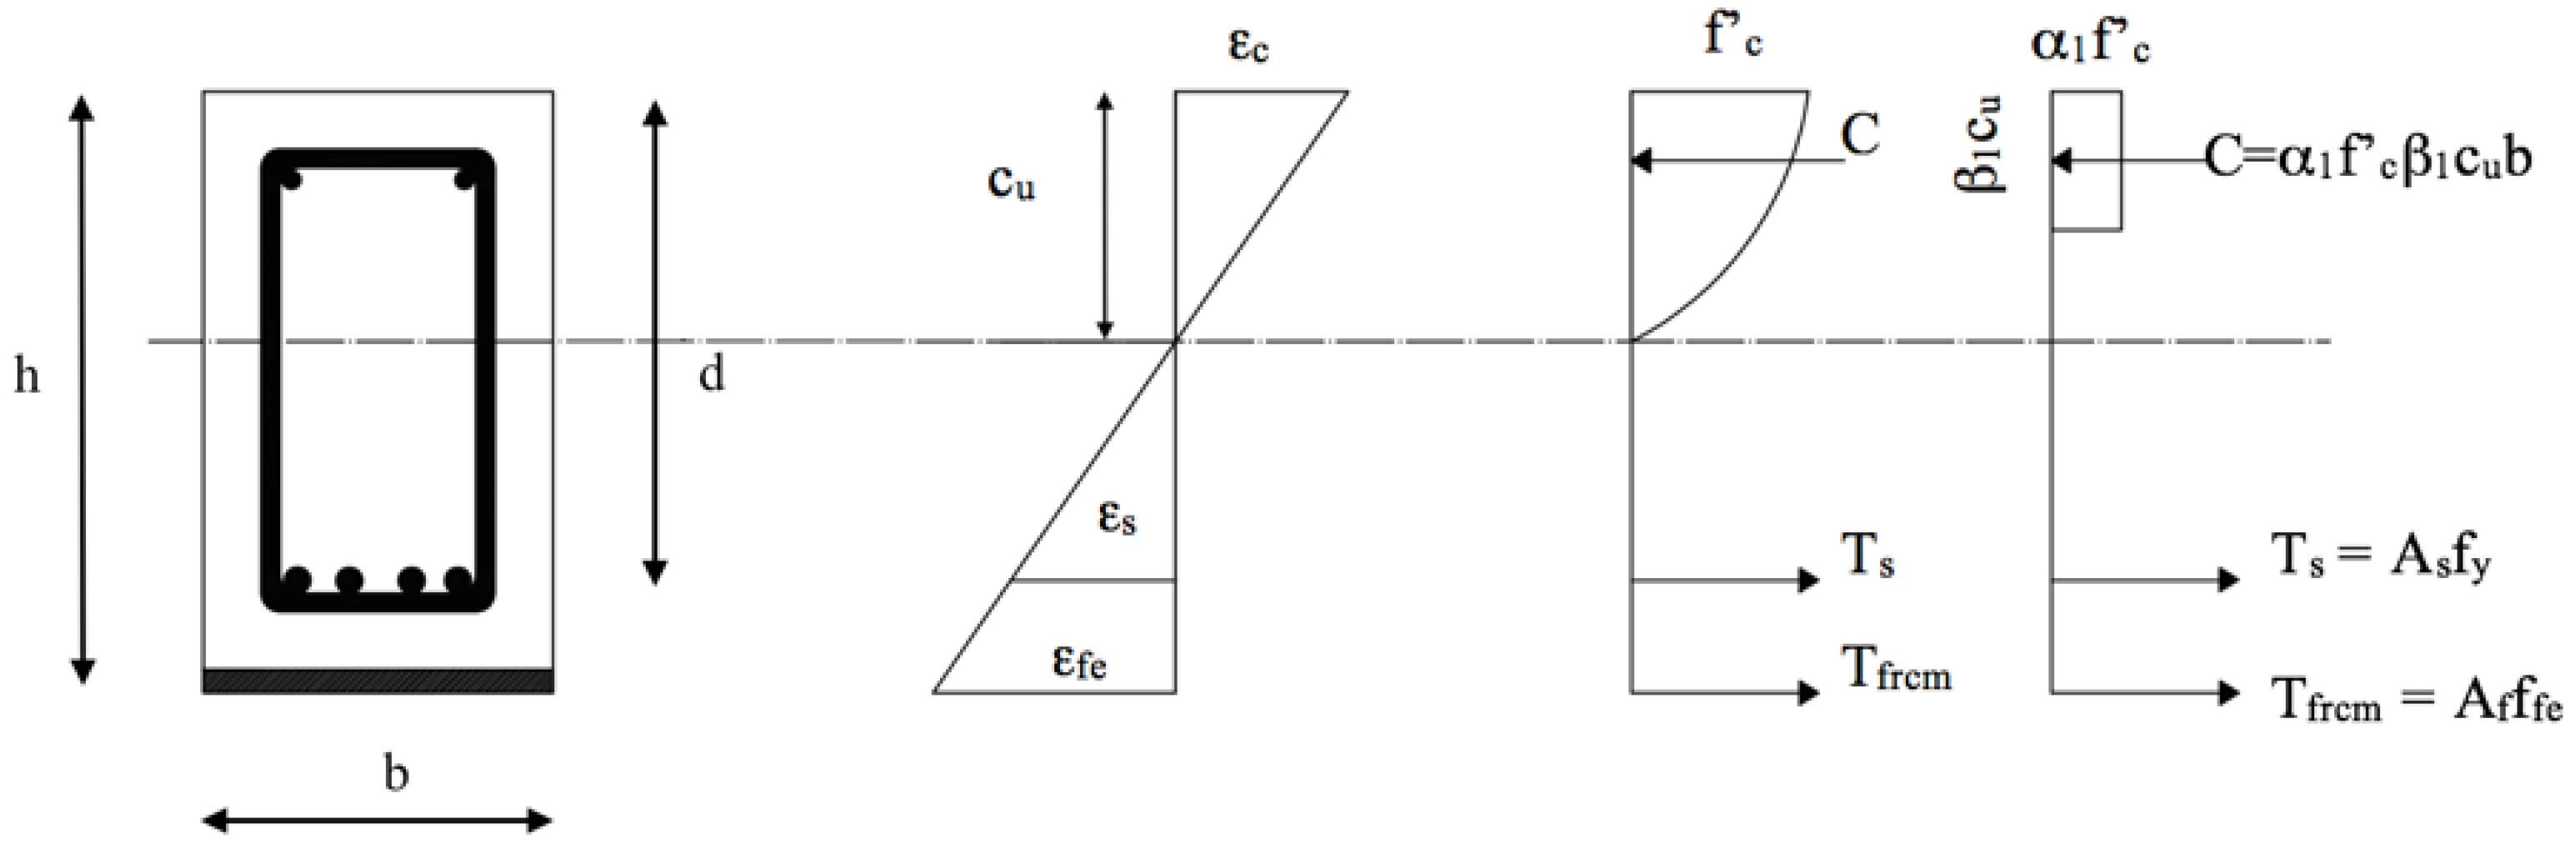
Appendix A. Theoretical Analysis According to ACI 549.4R-13

The contribution of FRCM to enhance the ultimate capacity was calculated as per ACI 549.4R-13 and was based on the following assumptions:
  • Plane sections remain plane after loading.
  • The bond between the FRCM system and the concrete substrate remains effective.
  • The maximum compressive strain in concrete is 0.003.
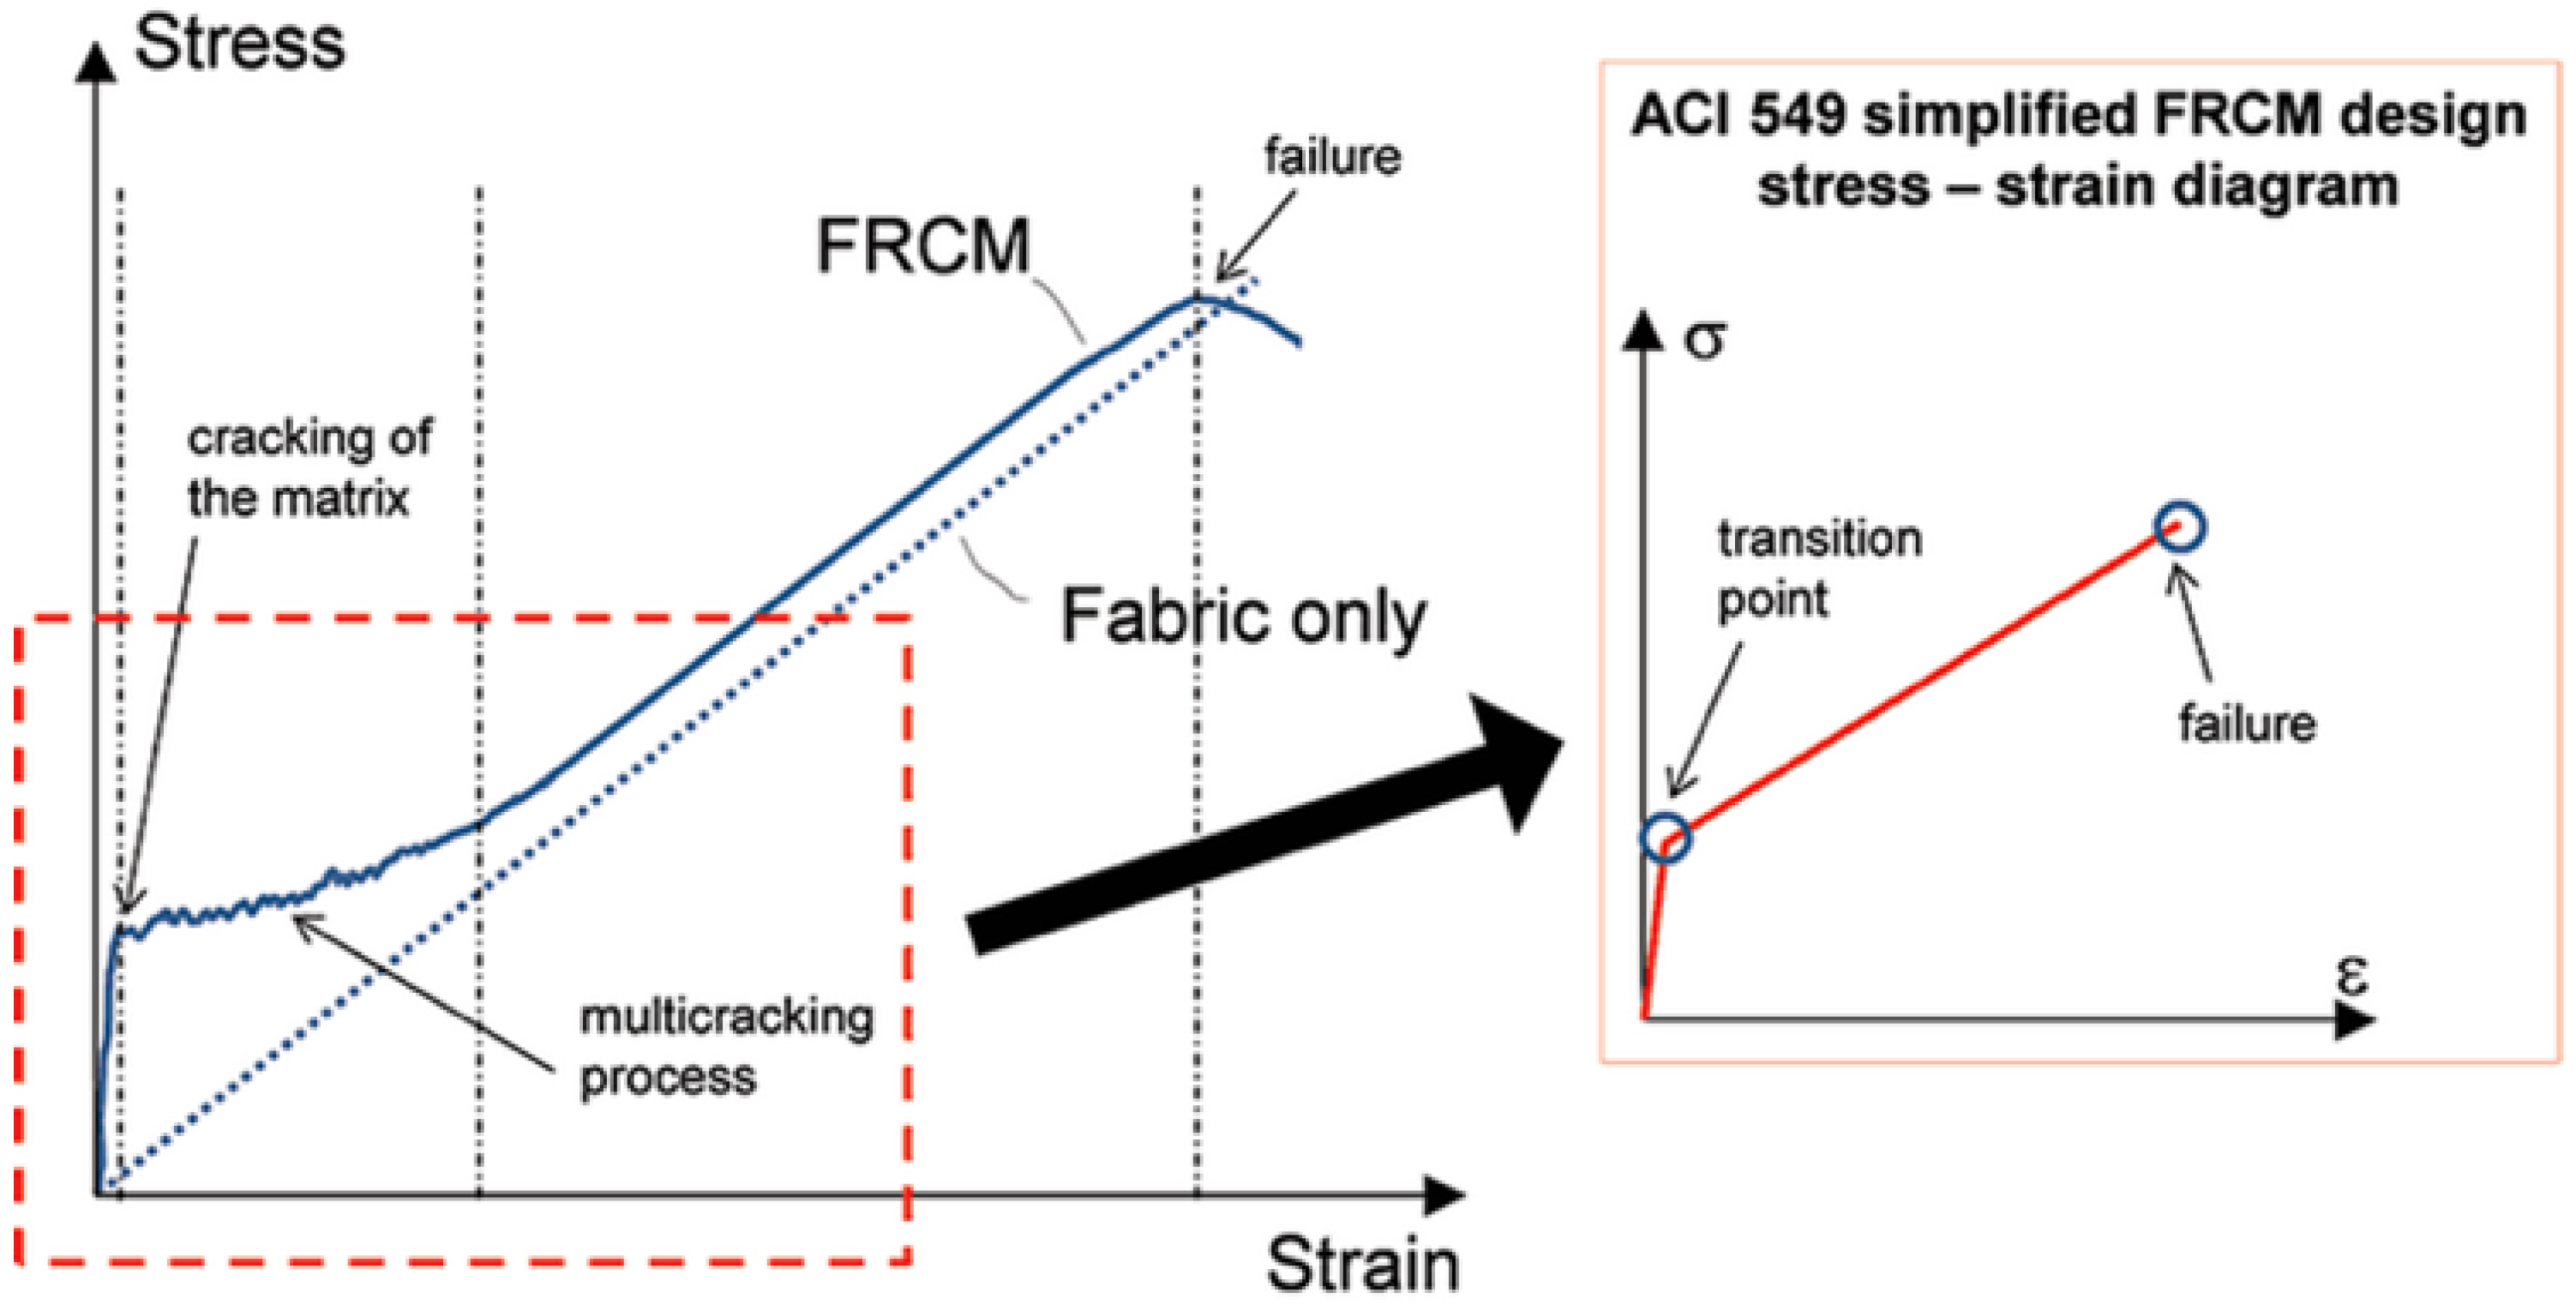
  • FRCM has a bilinear behavior to failure where only the second linear part of the curve is used in analysis and design.
The assumptions proposed by the American Concrete Institute (ACI) are typical for any section analysis for externally-bonded reinforcement applications as shown in Figure A1. The only assumption that is questionable is that the bond between the FRCM system and concrete remains effective. This assumption is valid unless premature debonding occurs, which limits the contribution of the FRCM. If debonding occurs at a later stage close to failure, it does not have a significant effect on the contribution of the FRCM.
Figure A1. Flexural strength analysis for a typical FRCM-strengthened rectangular beam.
Fibers 05 00002 g018
As per the ACI-549, effective tensile strain in the FRCM system at failure, εfe, is limited to εfd, the design strain of the FRCM system, in Equation (A1):
εfe = εfd ≤ 0.012
It must be noted that the ACI-549 defines the design strain of the FRCM system, εfd, as the average strain of the FRCM at failure minus one standard deviation. The limitation in the effective tensile strain to 0.012 is to account for any delamination that might occur, which is not considered when calculating the design strain through tensile testing. The effective tensile stress of the FRCM at failure, ffe, is then calculated in terms of Ef, the cracked elastic modulus of the FRCM system, and εfe, the effective tensile strain, according to Equation (A2):
ffe = Efεfe
Then, using strain compatibility, the compressive strain in concrete can be written in terms of the effective tensile strain in the FRCM according to Equation (A3):
εc = εfe·cu/hcu
where εc is the concrete compressive strain, cu is the neutral axis depth initial trial and h is the height of the concrete member (beam).
Furthermore, using strain compatibility, the steel tensile strain can be written in terms of the effective tensile strain in the FRCM according to Equation (A4):
ε s = d C u h C u × ε f e
where d is the effective depth of the concrete cross-section.
Then, stress in the steel is taken as the lower of the yield stress or the stress at the time of failure as per Equation (A5):
f s = { E s   ε s if E s   ε s f y f y
where fy is the steel yield stress and Es is the modulus of elasticity of steel.
The concrete stress block factors can then be calculated as per the ACI 318 [12] according to Equations (A6) to (A8):
ε c = 1.7 f c E c
β 1 = 4 ε c ε c 6 ε c 2 ε c
α 1 = 3 ε c ε c ( ε c ) 2 3 β 1 ( ε c ) 2
Then, the internal force equilibrium (Equation (A9)) should be satisfied by the calculation of a new value for the neutral axis depth, as is done in Equation (A10):
Ts + Tfrcm = C
where:
T s = A s f s
T f r c m = n A f b f f e
C = α 1 f c β 1 b c u
substituting Equation (A10) into Equation (A9) and rearranging:
c u = A s f s + n A f b f f e α 1 f c β 1 b
where As is the internal steel reinforcement area, n is the number of FRCM layers and Af is the area of FRCM layer per unit width.
If the new value of the neutral axis is close to the initially guessed value, then this iteration is valid. If it is not close, then another iteration must be made until the two values of the neutral axis depth are very close. Finally, the nominal moment resistance Mn is calculated by taking the moment contribution of the steel reinforcement Ms and the FRCM Mfrcm according to Equations (A13) to (A15):
M s = A s f s ( d β 1 c u 2 )
M f r c m = n A f b f f e ( h β 1 c u 2 )
Mn = φm × (Ms + Mf)
The strength reduction factor φm is given by Equation (A15), which is defined in the ACI 562 and ACI-318 as:
ϕ m = { 0.9 for   ε t 0.005 0.65 + 0.25 ( ε t ε s y ) 0.005 ε s y for   ε s y < ε t < 0.005 0.65 for   ε t < ε s y
where ε t is the net tensile strain at the extreme tension steel reinforcement and ε s y is the steel yield strain.
It should be noted that when predicting the maximum load capacity, φm is taken as 1.0. However, for design purposes, the reduction factor is taken according to Equation (A15). Furthermore, in the design provisions, the ACI limits the total force that is contributed by the FRCM. The increase in flexural strength contributed by the FRCM should not exceed 50% of the existing flexural capacity of the structure prior to the FRCM application. Comparing the theoretical and experimental ultimate load capacity, it can be observed that the ACI prediction produces an overall good estimation of the ultimate load capacity. For the PBO FRCM-strengthened beams, the ACI prediction gave a conservative underestimation of the capacity. However, for the C-FRCM and G-FRCM, it gave an overestimation due to the premature debonding failure that happened in those specimens that is not considered by the ACI prediction.

References

  1. Types and Causes of Concrete Deterioration. Available online: http://www.cement.org/docs/default-source/fc_concrete_technology/durability/is536-types-and-causes-of-concrete-deterioration.pdf?sfvrsn=4 (accessed on 4 August 2016).
  2. Bisby, L.A.; Briglio, M.B. ISIS Canada Educational Module No. 5: An Introduction to Structural Health Monitoring; Prepared by ISIS Canada; ISIS Canada: Winnipeg, Manitoba, Canada, 2004. [Google Scholar]
  3. Corrosion Central, NACE. Available online: https://www.nace.org/Corrosion-Central/Industries/Highways-and-Bridges/ (accessed on 4 August 2016).
  4. D’Ambrisi, A.; Focacci, F. Flexural strengthening of RC beams with cement based composites. J. Compos. Constr. 2011, 15, 707–720. [Google Scholar] [CrossRef]
  5. Tumialan, G.; De Luca, A. FRCM Systems. In STRUCTURE Magazine; National Council of Structural Engineers Association: Chicago, IL, USA, 2014. [Google Scholar]
  6. Bisby, L.A.; Stratford, T.J.; Smith, J.; Halpin, S. FRP versus Fiber Reinforced Cementitious Mortar Strengthening Systems at Elevated Temperature. In Proceedings of the 10th International Symposium on Fiber Reinforced Polymer Reinforcement for Reinforced Concrete Structures, ACI SP-279, Tampa, FL, USA, 2–4 April 2011; American Concrete Institute: Farmington Hills, MI, USA, 2011; pp. 49.1–49.20. [Google Scholar]
  7. Turk, A.M. Seismic Response Analysis of Masonry Minaret and Possible Strengthening by Fiber Reinforced Cementitious Matrix (FRCM) Materials. Adv. Mater. Sci. Eng. 2013, 2013, 952497. [Google Scholar] [CrossRef]
  8. ACI (American Concrete Institute). Design and Construction Guide of Externally Bonded FRCM Systems for Concrete and Masonry Repair and Strengthening; ACI 549.4R-13; American Concrete Institute: Farmington Hills, MI, USA, 2013. [Google Scholar]
  9. Arboleda, D.; Carozzi, F.; Nanni, A.; Poggi, C. Testing Procedures for the Uniaxial Tensile Characterization of Fabric-Reinforced Cementitious Matrix Composites. J. Compos. Constr. 2016, 20, 04015063. [Google Scholar] [CrossRef]
  10. Mobasher, B.; Peled, A.; Pahilajani, J. Distributed cracking and stiffness degradation in fabric-cement composites. Mater. Struct. 2012, 39, 317–331. [Google Scholar] [CrossRef]
  11. Babaeidarabad, S.; Loreto, G.; Nanni, A. Flexural Strengthening of RC Beams with an Externally Bonded Fabric-Reinforced Cementitious Matrix. J. Compos. Constr. 2014, 18, 04014009. [Google Scholar] [CrossRef]
  12. Loreto, G.; Leardini, L.; Arboleda, D.; Nanni, A. Performance of RC slab-type elements strengthened with fabric-reinforced cementitious- matrix (FRCM) composites. J. Compos. Constr. 2013, 18, A4013003. [Google Scholar] [CrossRef]
  13. D’Ambrisi, A.; Feo, L.; Focacci, F. Experimental analysis on bond between PBO-FRCM strengthening materials and concrete. Compos. Part B 2013, 44, 524–532. [Google Scholar] [CrossRef]
  14. D’Antino, T.; Carloni, C.; Sneed, L.H.; Pellegrino, C. Matrix-fiber bond behavior in PBO FRCM composites: A Fracture Mechanics Approach. Eng. Fract. Mech. 2014, 117, 94–111. [Google Scholar] [CrossRef]
  15. D’Ambrisi, A.; Feo, L.; Focacci, F. Bond-slip relations for PBO-FRCM materials externally bonded to concrete. Compos. Part B 2012, 43, 2938–2949. [Google Scholar] [CrossRef]
  16. SikaWrap®-350G Grid. grc.sika.com. Available online: http://grc.sika.com/dms/getdocument.get/1d5e3ced-4748-3bf2-9f66-3b5cb8e403d5/010206020040000001_SikaWrap_350_G_gr.pdf (accessed on 7 August 2016).
  17. Sika® Monotop®-623. Available online: https://can.sika.com/dms/getdocument.get/91bef53e-75e5-3a27-b78c-2e8e67b244b8/SikaMonoTop623_pds.pdf (accessed on 2 November 2016).
  18. Ruredil S.p.A. Ruredil X Mesh Gold. Available online: http://english.ruredil.it/SchedeProdottoENG/RuredilXMeshGOLD_ing_1.pdf (accessed on 2 November 2016).
  19. ICC-Evaluation Service ESR-3265. Ruredil X Mesh C10 and Ruredil X Mesh Gold Fabric-Reinforced Cementitious Matrix (FRCM) Composite Systems. Available online: http://www.icc-es.org/Reports/pdf_files/load_file.cfm?file_type=pdf&file_name=ESR-3265.pdf (accessed on 7 August 2016).
  20. Ruredil S.p.A. Ruredil X Mesh C10. Available online: http://www.bob-fr.com/DOCPDF/ruredilxmeshc10_datasheet_0214en.pdf (accessed on 2 November 2016).
  21. ICC-Evaluation Service. 2013. Acceptance Criteria for Masonry and Concrete Strengthening Using Fiber-Reinforced Cementitious Matrix (FRCM) Composite Systems. AC434, Whittier, CA. Available online: http://www.icc-es.org/Criteria_Development/1110-post/17_AC434_final.pdf (accessed on 30 July 2016).
  22. Jabr, A.; Elragaby, A.; Ghrib, F. Flexural Strengthening of RC Beams Using Glass-FRCM. In Proceedings of the 5th International Structural Specialty Conference (CSCE 2016), London, UK, 1–4 June 2016.
  23. Ombres, L. Analysis of the bond between Fabric Reinforced Cementitious Mortar (FRCM) strengthening systems and concrete. Compos. Part B 2015, 69, 418–426. [Google Scholar] [CrossRef]
Figure 1. Types of fiber grids: (a) PBO grid; (b) carbon grid; (c) glass grid.
Fibers 05 00002 g001
Figure 2. Clevis grips.
Fibers 05 00002 g002
Figure 3. Clamping grips.
Fibers 05 00002 g003
Figure 4. Stress-strain behavior of the FRCM system [8]. Reproduced with permission from [8], Copyright ACI, 2013
Fibers 05 00002 g004
Figure 5. Typical load-deflection behavior and failure modes of RC beams strengthened in flexure using FRCM [4]. Reproduced with permission from [4]. Copyright, D’Ambrisi, A., 2014.
Fibers 05 00002 g005
Figure 6. Test specimen details.
Fibers 05 00002 g006
Figure 7. Strengthening procedure: (a) initial mortar layer applied; (b) FRCM mesh partially embedded inside the mortar; (c) FRCM mesh embedded totally inside the mortar; (d) U-wrapped FRCM strips embedded inside the mortar; (e) FRCM mesh covered with mortar; (f) finishing after the application of the second FRCM layer.
Fibers 05 00002 g007aFibers 05 00002 g007b
Figure 8. Test setup: (a) test set-up details; (b) photo of the test set-up.
Fibers 05 00002 g008
Figure 9. Instrumentation details: (a) sketch showing full instrumentation set-up; (b) photo showing top compression PI gauges and concrete strain gauges; (c) photo showing the linear variable differential transducers (LVDTs) and bottom tension PI gauges.
Fibers 05 00002 g009
Figure 10. Load-deflection curves for Group I beams.
Fibers 05 00002 g010
Figure 11. Load-deflection curves for Group II beams.
Fibers 05 00002 g011
Figure 12. PBO FRCM-strengthened beam failure mode. (a) and (b): Detachment of PBO FRCM from concrete; (c): Cracking of the FRCM; (d) and (e): Detachment of FRCM u-wrap.
Fibers 05 00002 g012aFibers 05 00002 g012b
Figure 13. Carbon FRCM-strengthened beam failure mode. (a) and (b): Premature detachement of Carbon FRCM; (c): Slippage of fibers; (d): Detachment of FRCM.
Fibers 05 00002 g013
Figure 14. Glass FRCM-strengthened beam failure mode. (a): Premature bond failure of glass FRCM ; (b): Rupture of glass FRCM.
Fibers 05 00002 g014
Figure 15. Comparisons of the percentage increase in ultimate load.
Fibers 05 00002 g015
Figure 16. Load-FRCM strain behavior at mid-span: (a) B4-C: PI-gauge vs. strain gauge; (b) Group I; (c) Group II.
Fibers 05 00002 g016
Figure 17. Load vs. critical crack width curve: (a) Group I; (b) Group II.
Fibers 05 00002 g017
Table 1. Test matrix. B, beam; P, PBO; G, glass.
GroupBeamInternal Steel ReinforcementExternal FRCM Strengthening% EAFRCM/EASteel
BarsReinforcement Ratio ρFRCM Material# of LayersE a A b (kN)
IB2-02#10M0.18 ρb---0
B2-PPBO219204.8
B2-CCarbon212003.0
B2-G-4Glass 417044.26
IIB4-04#10M0.36 ρb---0
B4-PPBO219202.4
B4-CCarbon212001.5
B4-GGlass 28521.06
aE: Modulus of Elasticity of the fabric; bA: Total cross section area of the fabric.
Table 2. Details of the fibers used in the FRCM fabrics.
Type of FabricYoung’s Modulus (GPa)Ultimate Tensile strength (MPa)Ultimate Tensile Strain (mm/mm)Density (g/cm3)Fiber Area, Af (mm2/mm)Equivalent Thickness (mm)
Glass8026000.03452.60.04750.023 a
PBO27058000.02151.560.050.046 a
Carbon24048000.0181.820.050.047 b
a Equivalent thickness in the wrap direction; b equivalent thickness in both directions.
Table 3. Mechanical properties of the FRCM systems.
Type of FRCMModulus of Elasticity of the Cracked Specimen Ef, (GPa)Ultimate Tensile Strength ffu (MPa)Ultimate Tensile Strain εfu (mm/mm)Fiber Area per Unit Width Af (mm2/mm)Axial Stiffness (EA) per 150-mm Strip (kN)
Glass 159.87150.0090.0475426
PBO 212816640.0180.05960
Carbon 38010310.0100.05600
1 Test was carried out during this research; 2,3 properties were provided by the manufacturers [18,19,20].
Table 4. Summary of the test results.
Beam 1Experimental LoadExperimental Deflection
Yielding Load (kN)Increase in Yielding Load (%)Ultimate Load (kN)Increase in Ultimate Load (%)Theoretical Ultimate Load (kN)Ratio of Exp./Theoretical LoadDef.@ Yielding Load (mm)Defl.@ Ultimate Load (mm)Def. @ Failure (mm)Ratio of Pseudo-Ductility IndexRatio of Post-Cracking Flexural StiffnessRatio of Post-Yielding Flexural StiffnessFailure Mode *
B2-039.8-52-501.04853.653.6111C
B2-P44.211.169.333.259.21.177.540.853.81.071.222.9DB-C
B2-C4923.152.2052.11710.5501.061.323.5DB-C
B2-G-4L46.115.854.24.255.20.987.519.464.51.281.192.6DB-R-C
B4-073.4-89.3-88.11.0110.628.346.1111C
B4-P90.122.7111.424.7981.1410.134.344.70.881.251.07DB-C
B4-C86.217.491.42.394.20.971015.437.80.761.231.06DB-C
B4-G70.5−3.988.60.993.10.9510.62544.91.021.011.01DB-R-C
* Failure mode designated by C indicates concrete compression failure, and DB-C indicates debonding or detaching of the FRCM system followed by concrete compression failure; DB-R-C indicates that the FRCM system debonded followed by fiber rupture and then followed by concrete compression failure. Def.: Refers to Deflection, Exp.: Refers to Experimental.

