Article

Developing Novel Temperature Sensing Garments for Health Monitoring Applications

1
Advanced Textiles Research Group, School of Art & Design, Nottingham Trent University, Bonington Building, Dryden Street, Nottingham NG1 4GG, UK
2
School of Science and Technology, Nottingham Trent University, Clifton Lane, Nottingham NG11 8NS, UK
*
Author to whom correspondence should be addressed.
Fibers 2018, 6(3), 46; https://doi.org/10.3390/fib6030046
Submission received: 30 April 2018 / Revised: 7 July 2018 / Accepted: 9 July 2018 / Published: 10 July 2018
(This article belongs to the Special Issue Electronically Active Textiles)

Abstract

:
Embedding temperature sensors within textiles provides an easy method for measuring skin temperature. Skin temperature measurements are an important parameter for a variety of health monitoring applications, where changes in temperature can indicate changes in health. This work uses a temperature sensing yarn, which was fully characterized in previous work, to create a series of temperature sensing garments: armbands, a glove, and a sock. The purpose of this work was to develop the design rules for creating temperature sensing garments and to understand the limitations of these devices. Detailed design considerations for all three devices are provided. Experiments were conducted to examine the effects of contact pressure on skin contact temperature measurements using textile-based temperature sensors. The temperature sensing sock was used for a short user trial where the foot skin temperature of five healthy volunteers was monitored under different conditions to identify the limitations of recording textile-based foot skin temperature measurements. The fit of the sock significantly affected the measurements. In some cases, wearing a shoe or walking also heavily influenced the temperature measurements. These variations show that textile-based foot skin temperature measurements may be problematic for applications where small temperature differences need to be measured.

1. Introduction

This work considers some of the practical aspects of on-body temperature measurements, with a focus on the creation of innovative temperature sensing garments. The use of textile temperature sensors allows for comfortable on-body temperature measurement, which is desirable for certain telemedicine and health monitoring applications. This work also presents a preliminary trial demonstrating a temperature sensing sock that was previously presented [1]. This trial creates new knowledge regarding skin temperature measurement of the foot using a textile-based temperature sensing garment.
Skin temperature is an important indicator of pathology and is one of the most commonly measured vital statistics in both infants [2] and adults [3]. Continuous temperature monitoring of the skin can provide clinicians with useful information when investigating a variety of conditions, such as non-freezing cold injuries [4,5], the early detection of foot ulcers [6,7], or Raynaud’s disease [8].
Continuous remote temperature measurements can be provided through the use of wearable temperature monitoring devices. However, many wearable temperature monitoring devices are not easily concealed [9,10,11]. Patients prefer wearables that seamlessly integrate into their day-to-day lives while remaining hidden from view, as highlighted in recent studies [12].
Interest in electronic textiles has grown [13]. An electronic textile integrated with sensors is an ideal solution to provide truly discrete sensing by adding comfort and normalcy to the wearable device. A variety of temperature sensing textiles have been developed [14,15,16,17]; however, many are unable to provide localized (point) temperature measurements. The variation in skin temperature between certain points of skin is vital when monitoring conditions such as Raynaud’s disease [8] and the early detection of foot ulcers [6,18,19].
Some textile solutions that allow for localized temperature measurements have been reported in the literature [20], including temperature sensing yarns fabricated using Electronic Yarn (E-yarn) technology [21,22].
This work focuses on using temperature sensing yarns, designed and characterized in earlier work [1,23,24,25], to create a series of innovative textile sensing garments. A key component of this work was to conceptualize and identify the feasibility of developing temperature sensing textiles using temperature sensing yarns. In order to integrate these temperature sensing yarns into garments, new knitting techniques had to be developed, creating important new knowledge. In addition to providing further details on the production of the temperature sensing sock [1], this work introduces a temperature sensing glove that could be used to create a temperature regulated glove for people with Raynaud’s disease or those working in cold environments, and a temperature sensing armband for fever detection. The prototypes provide a fully textile-based solution to provide remote and continuous temperature measurements.
Full details are provided regarding the creation of the three prototype device types, including the knitting details and information about the associated interface hardware. The use of temperature sensing yarns for skin temperature measurements has been investigated. A temperature sensing yarn is initially used to measure the temperature at different points on a hand to better understand the nuances of recording skin contact temperature measurements with the yarns. A detailed experiment is then conducted to identify the effects of contact pressure on the temperature sensing yarn and how this affected the skin-based temperature measurements. The knowledge generated in this work will be useful for other textile-based temperature sensors. A preliminary trial is presented using the temperature sensing socks. This provided useful information about factors affecting this type of textile-based temperature measurement of the foot.

2. Materials and Methods

2.1. Temperature Sensing Yarn Fabrication

Temperature sensing yarns were produced using a method similar to that described previously [1,23,24,25]. To produce the yarns Murata 10 kΩ Negative Temperature Coefficient (NTC) thermistors (NCP15XH103F03RC; Murata, Kyoto, Japan) were soldered onto fine copper wires. The thermistor and interconnects were then encapsulated using an ultraviolet (UV) curable polymer resin with high thermal conductivity (Dymax 9-20801, Dymax Corporation, Torrington, CT, USA) to form a cylindrical micro-pod with a diameter of 0.87 mm and a length of 2.17 mm. The micro-pod was then covered with packing fibers and a warp knitted tube to create the temperature sensing yarns.
Previous work showed that the accuracy of the temperature-sensing yarns was ±0.5 °C 63% of the time, or ±1 °C 89% of the time [1]. This was regarded as acceptable since the accuracy of the thermistor specified by the manufacturer for the inspected range (22.25–62.15 °C) was ±1.37 °C.

2.2. Prototype Temperature Sensing Armbands

Temperature sensing yarns were initially used to produce the armbands. The armband was chosen due to its tubular structure. The human body consists of structures with approximately circular cross-sections, hence it was important to identify if the temperature sensing yarn could be used to develop a tubular wearable device. Additionally, these armbands could be further developed into a fever detection device.
Three prototype armbands were produced, and for each of the prototypes, four temperature sensing yarns were used. The developmental process between each iteration of the armband is shown for completeness and to highlight the practical considerations for creating a monitoring device of this type. During development, the supporting hardware used to record measurements from the yarns was changed for each armband. Additionally, the connection method between the temperature sensing yarn and the hardware was altered in each iteration. For all prototypes, LabVIEW (National Instruments, Austin, TX, USA) was used to present the data captured. 
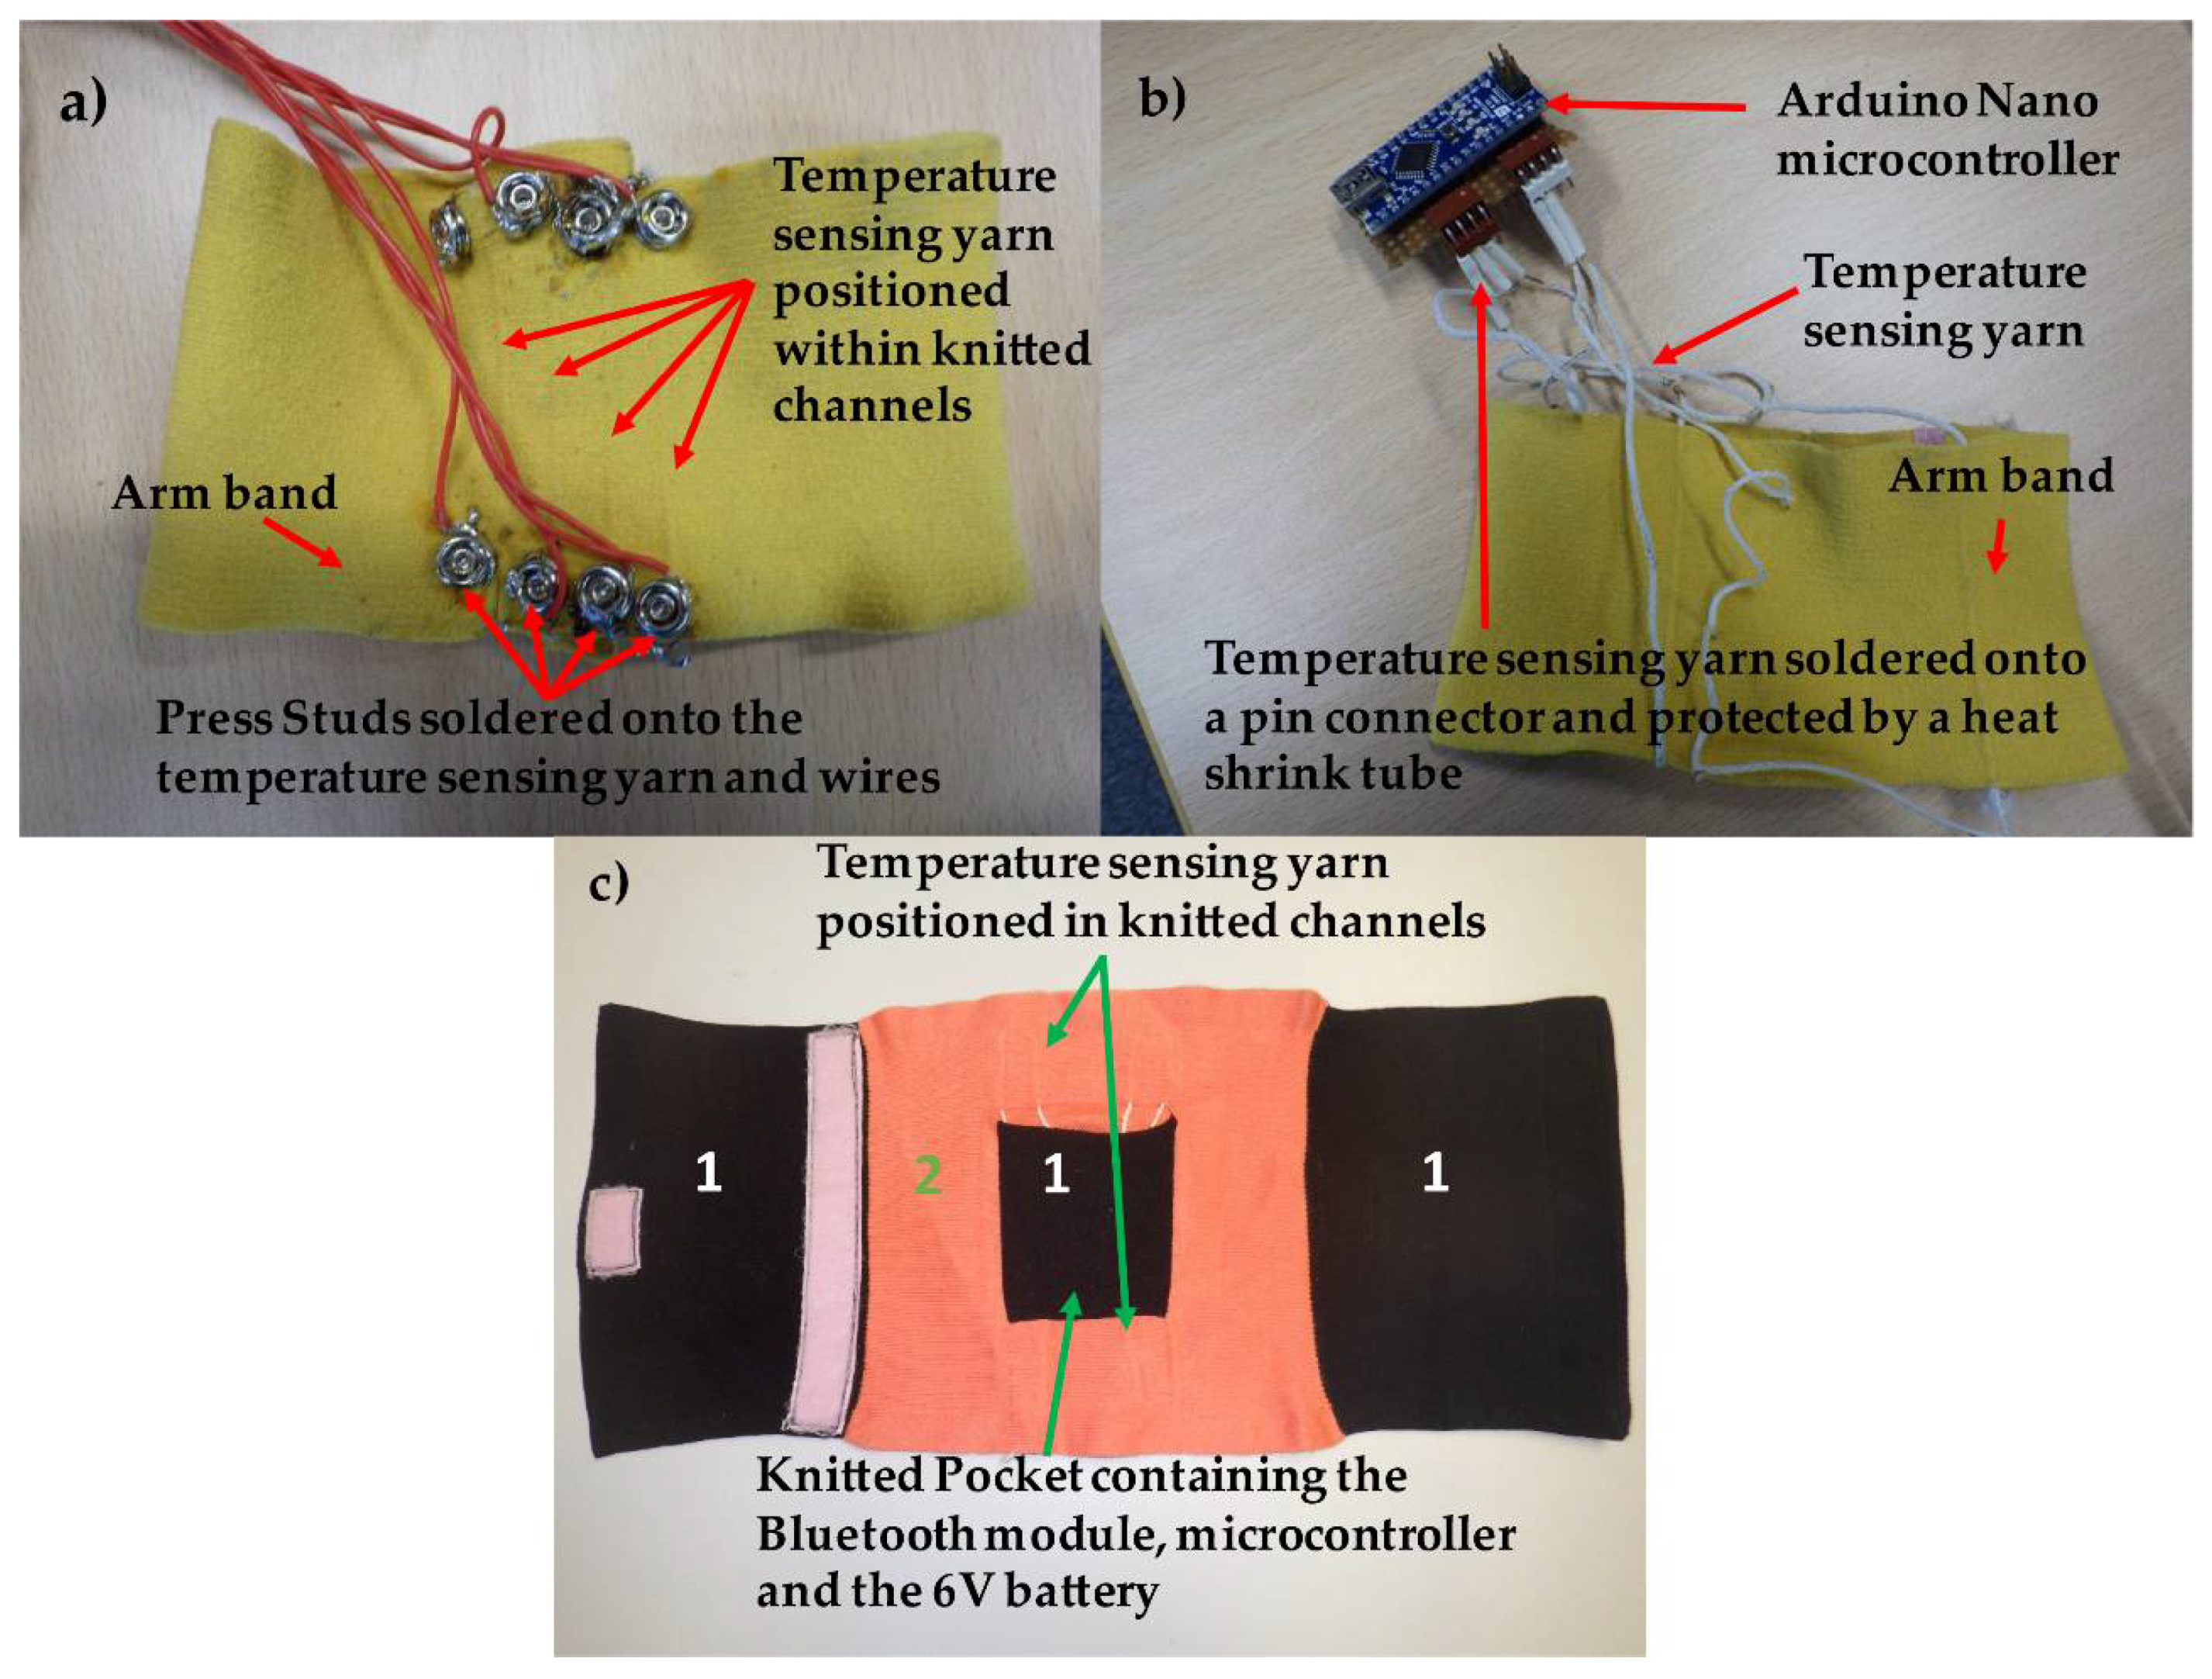
Figure 1 shows annotated photographs of each of the three armband prototypes.
All armbands were knitted using a computerised flat-bed knitting machine, Stoll CMS 822HP E16 (Stoll, Reutlingen, Germany). A flat-bed knitting machine has precisely engineered needle beds composed of flat hardened steel plates. In industrial flat-bed knitting machines, a minimum of two such needle beds are arranged in an inverted V-form. In the needle beds, generally latch needles are placed inside needle tricks (open rectangular grooves precisely cut to accommodate needles) on the top surface of the needle bed. The above assembly guarantees the movement of needles individually and axially during the knitting process. A system of linear cams moves the needles between two dead centers in order to form stitches. The use of the needle-latch to open and close the needle hook area of a latch needle simplifies the stitch formation process.
Modern computerised flat-bed knitting machines are equipped with an electromagnetic system to facilitate the selection of individual needles during the knitting process. This combination of needle tricks, latch needles, and independent needle selection enables the creation of complex three-dimensional (3D) knitted structures on these machines. The use of two needle beds also provides the two needle systems with freedom of movement in two independent planes, thus forming the basis for forming stiches in 3D space.
As such, this technology was used to produce samples with temperature sensing yarns using two basic knitted structures integrated within the same knitted textile: the plain knitted structure and the interlock knitted structure.

2.2.1. First Armband Prototype

The first prototype (Figure 1a) was knitted using a double covered yarn made of 44F13 dtex lycra yarn that was covered with two yellow 78F46 dtex PA66, yarns (Wykes International Ltd., Leicester, UK). The double covered yarn was used due to its elasticity, ensuring that the final armband provided a snug fit. The base fabric was knitted in interlock and four 2 mm diameter tubes were knitted using the plain knitted structure. Four temperature sensing yarns were manually inserted into the plain knitted tube structures using a folded steel guide wire (diameter of 0.49 ± 0.01 mm). This yarn insertion technique was used to insert the temperature sensing yarns into all the prototype garments described in this paper. This manual technique was used due to the difficulty of manufacturing temperature sensing yarns in bulk quantities. Dias et al. have now semi-automated the manufacturing process for these E-yarns [26] so these yarns can be knitted using the Stoll flat-bed knitting machine. In the fabric produced for the first armband, the knitted channels were spaced 10 mm apart to accommodate temperature sensing yarns.
The temperature sensing yarns were connected to the interface hardware using a press-stud connection (press-stud diameter 7.53 mm) as these have been used in several electronic textile applications to form electrical connections [27,28] and create a strong mechanical and electrical connection. The temperature sensing yarns were soldered onto the female part of the metal press-studs as shown in Figure 1a. Thereafter, wires were soldered onto the male part of the press-stud, with the wires leading into a potential divider circuit, which contained 10 kΩ resistors that acted as the second resistors. The exact value of the second resistor was determined with a digital multimeter (Agilent 34410A, Agilent Technologies, Santa Clara, CA, USA) to a precision of 0.01%. The potential divider circuit was then connected to a data acquisition unit (NI DAQ USB 6008). Data were collected and interpreted using a bespoke LabVIEW script.
The main limitation when using this approach was the size of the NI DAQ USB 6008 unit (84.98 × 64.01 × 23.19 mm), which caused connection failures at the press-studs due to its weight. Another issue was caused by the large size of the press-studs, which prevented the temperature sensing yarns from being positioned in close proximity to each other in a fabric.

2.2.2. Second Armband Prototype

For the second armband (Figure 1b), the temperature sensing yarns were positioned 60 mm apart. For this prototype press-studs were not used. Instead, the temperature sensing yarns were soldered directly onto 20-mm-long male flat header connectors with a pitch of 2 mm. The solder joints were then encased within 2.4-mm-diameter heat shrinkable sleeves (Stock No. 397-4263, RS) to enhance the mechanical strength of the connection. An Arduino Nano v3.0 (Arduino, Turin, Italy) was used as the microcontroller instead of the NI DAQ USB 6008 unit due to its smaller size (43.18 × 18.54 mm). The Arduino Nano was then wired into a computer via a mini-B USB cable. The LabVIEW program was modified in order to read the data from the Arduino Nano.

2.2.3. Third Armband Prototype

The third armband (Figure 1c) was knitted using the technique described earlier; however, this design included an integrated pocket. As shown in Figure 1c, the third armband was knitted using two different types of yarns. The base fabric structure (shown by label 2 in Figure 1c) was knitted using a non-elastic 2/32 tex orange Merino wool yarn (Yeoman Yarns, Leicester, UK). The structure also contained four plain knitted tubes for the temperature sensing yarns. Two of the four plain knitted tubes were positioned 40 mm apart above the pocket and the remaining two were positioned 40 mm apart below the pocket. Non-elastic yarn was used to identify if this yarn would influence the snug fit of the armband and in turn, whether the fitting would affect the contact between the temperature sensing yarns and the skin. The sides of the prototype armband and the integrated pocket (labelled 1 in Figure 1c) were knitted using an interlock structure and a double covered yarn made of 44F13 dtex lycra yarn covered with two black 78F46 dtex PA66 yarns (Wykes International Ltd., Leicester, UK). This ensured that the sides of the armband could stretch to fit the wearer’s arm.
This prototype armband could be connected to a PC wirelessly, with the interface hardware included in the knitted pocket of the armband. An Arduino Pro Mini (Arduino, Turin, Italy) was used as the microcontroller due to its small size (17 × 33 mm) and this was connected to a Bluetooth module from Sparkfun Bluetooth Mate Silver (SparkFun Electronics, Boulder, CO, USA) to provide wireless connectivity. This Bluetooth module was chosen due to its low power consumption; however, this also limited its transmission range (the Sparkfun Bluetooth Mate Silver used a RN-42 class 2 Bluetooth module).
The main problem experienced when using the third prototype armband to obtain temperature measurements was the random drop in the Bluetooth signal. It was also observed that the Merino wool yarn failed to provide proper contact between the temperature sensing yarns and the skin; the inadequate stretch properties of Merino wool meant that the armband fitted loosely on the arm.
The experience of creating the temperature sensing armbands and their performance informed the design of two further prototypes: the temperature sensing glove and temperature sensing sock. Therefore, details of the armbands are included in this work for completeness only. Additional experimental work was not conducted using the armband designs presented here.

2.3. Prototype Temeprature Sensing Glove

The prototype temperature sensing glove was developed using the Stoll computerised flat-bed knitting machine described earlier. The prototype was knitted as a seamless glove with integrated tubes for inserting the temperature sensing yarns using double covered yarn composed of 44F13 dtex lycra yarn covered with two black PA66, 78F46 dtex PA66 yarns.
The glove was created by forming successive courses (rows of loops) parallel to the main glove axis along the line of the middle finger. The first row of stitches was formed along the line of the smallest finger, with the process continuing to successively form the four fingers and the thumb with the core section (body of the glove). Each finger was knitted from its distal to its proximal end, with the proximal ends then linked to form a core section. The fingers were knitted using a “C-knitting” process. The thumb was knitted with the core section merging with the proximal end of the thumb, which was continued to complete the glove. By using the C-knitting process for the thumb in this method, the overall shape of the glove could be adapted to the natural shape of the human hand. The fingers were finished by binding the last rows of knitting on the two needle beds together in order to create a seamless glove with a better fit.
Five tubular channels were integrated within the knitted glove structure to accommodate the temperature sensing yarns and to ensure that they remained hidden. This guaranteed the aesthetics of the glove were not affected by the temperature sensing yarns. After knitting, the five temperature sensing yarns were incorporated into the tubular channels with the sensing elements (thermistors) of the temperature sensing yarns positioned at the tips of the five fingers.
The interface hardware design used for Armband Prototype 3 (Figure 1c) was also used for the glove. However, instead of the Sparkfun Bluetooth Mate Silver, a Sparkfun Bluetooth Mate gold module was used, which increased the range of transmission at the cost of consuming more power. The interface hardware was powered using two coin CR2025 3V Lithium Coin Cell (Maplin Electronics, Rotherham, UK). The batteries, the Arduino Pro Mini, and Sparkfun Bluetooth Mate gold module were stacked on top of each other and positioned at the back of the wrist.
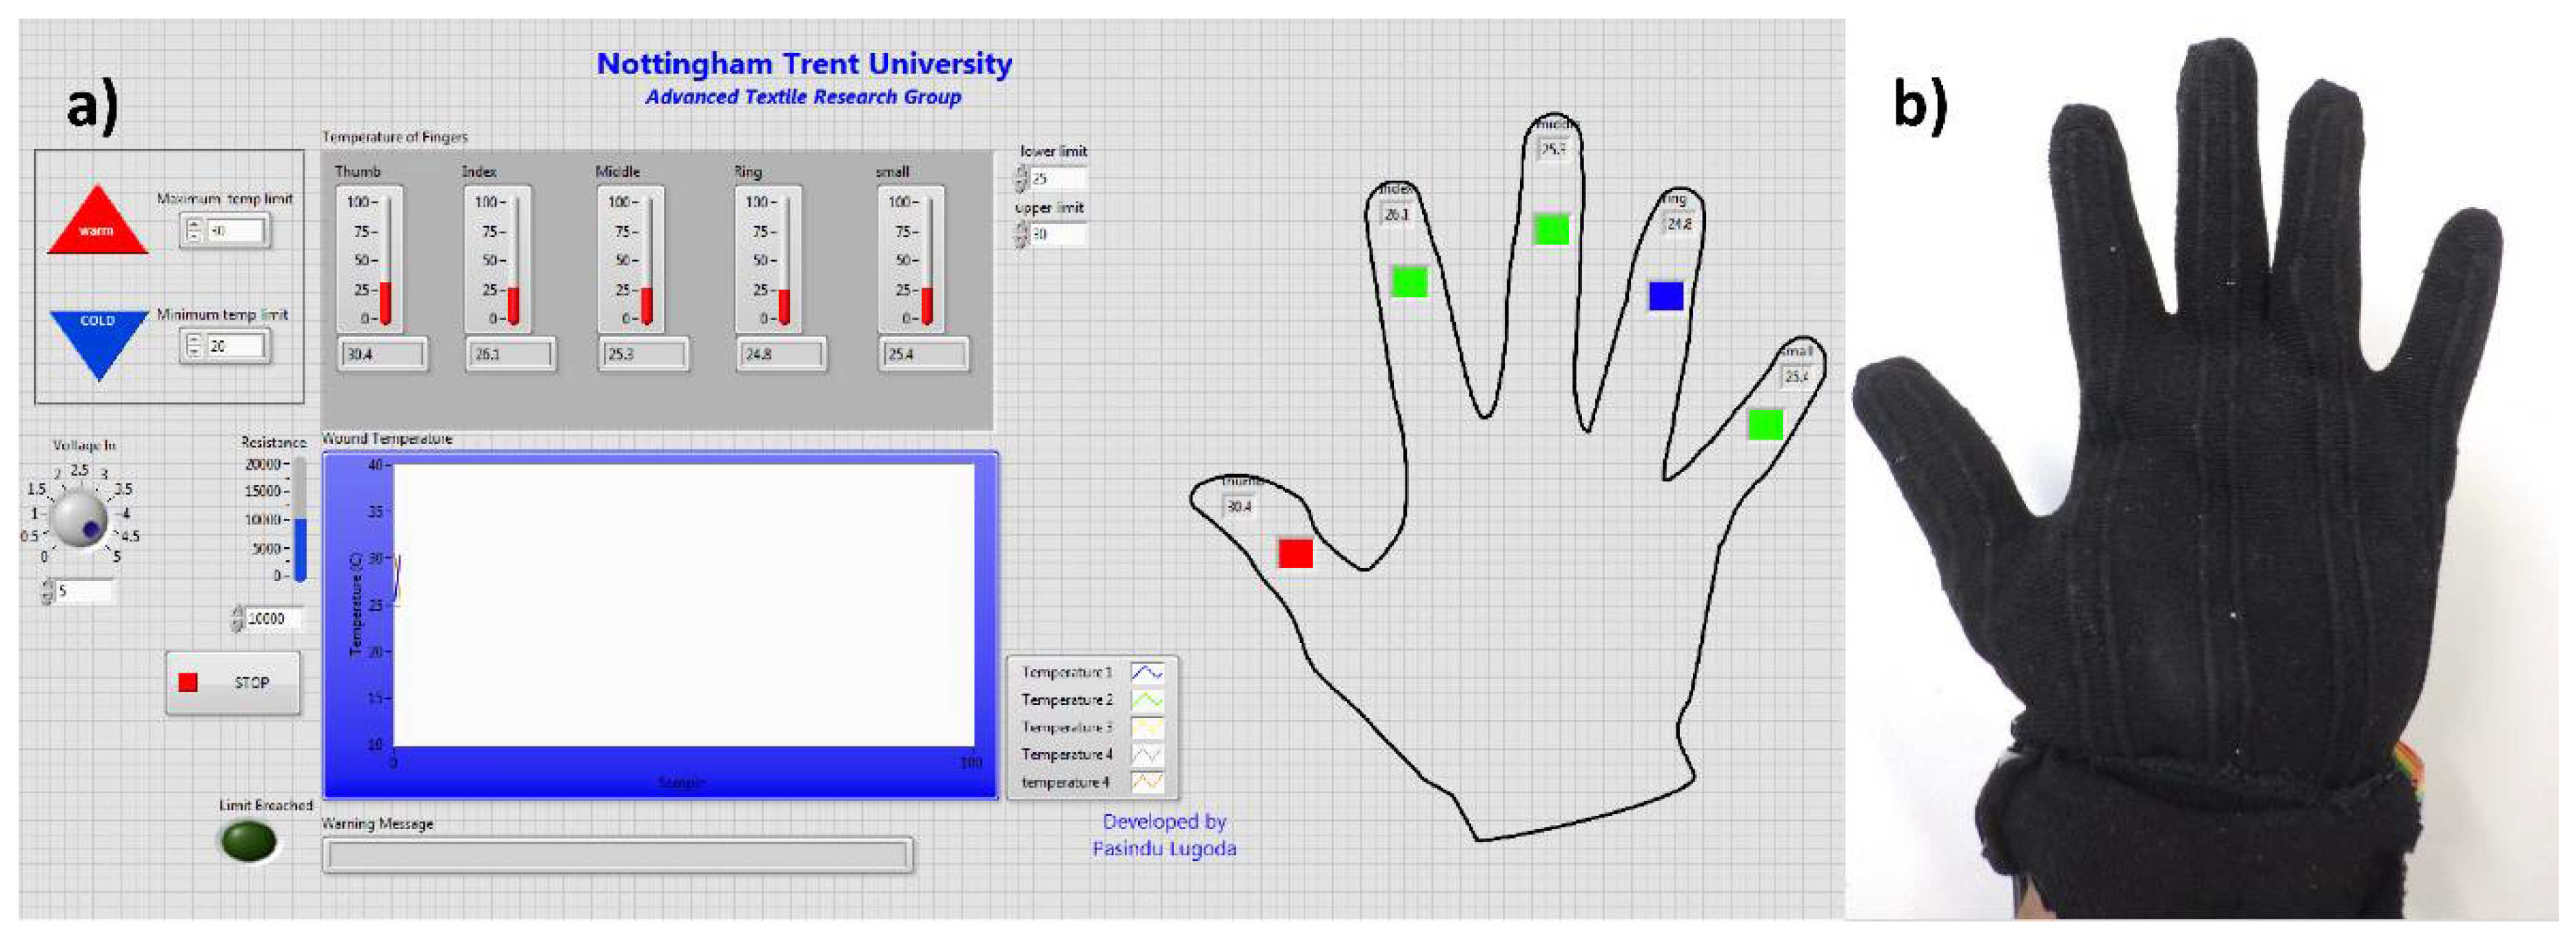
A bespoke LabVIEW script was used to provide the user interface. A picture of a hand was included on the front panel of the program with colored boxes placed on each finger at the position of the five thermistors in the glove. This allowed the user to set temperature limits so that once the temperature went above the set limit, the box turned red, or when it went below, the box turned blue; otherwise, the box remained green. The user interface for the glove and the prototype glove are shown in Figure 2.

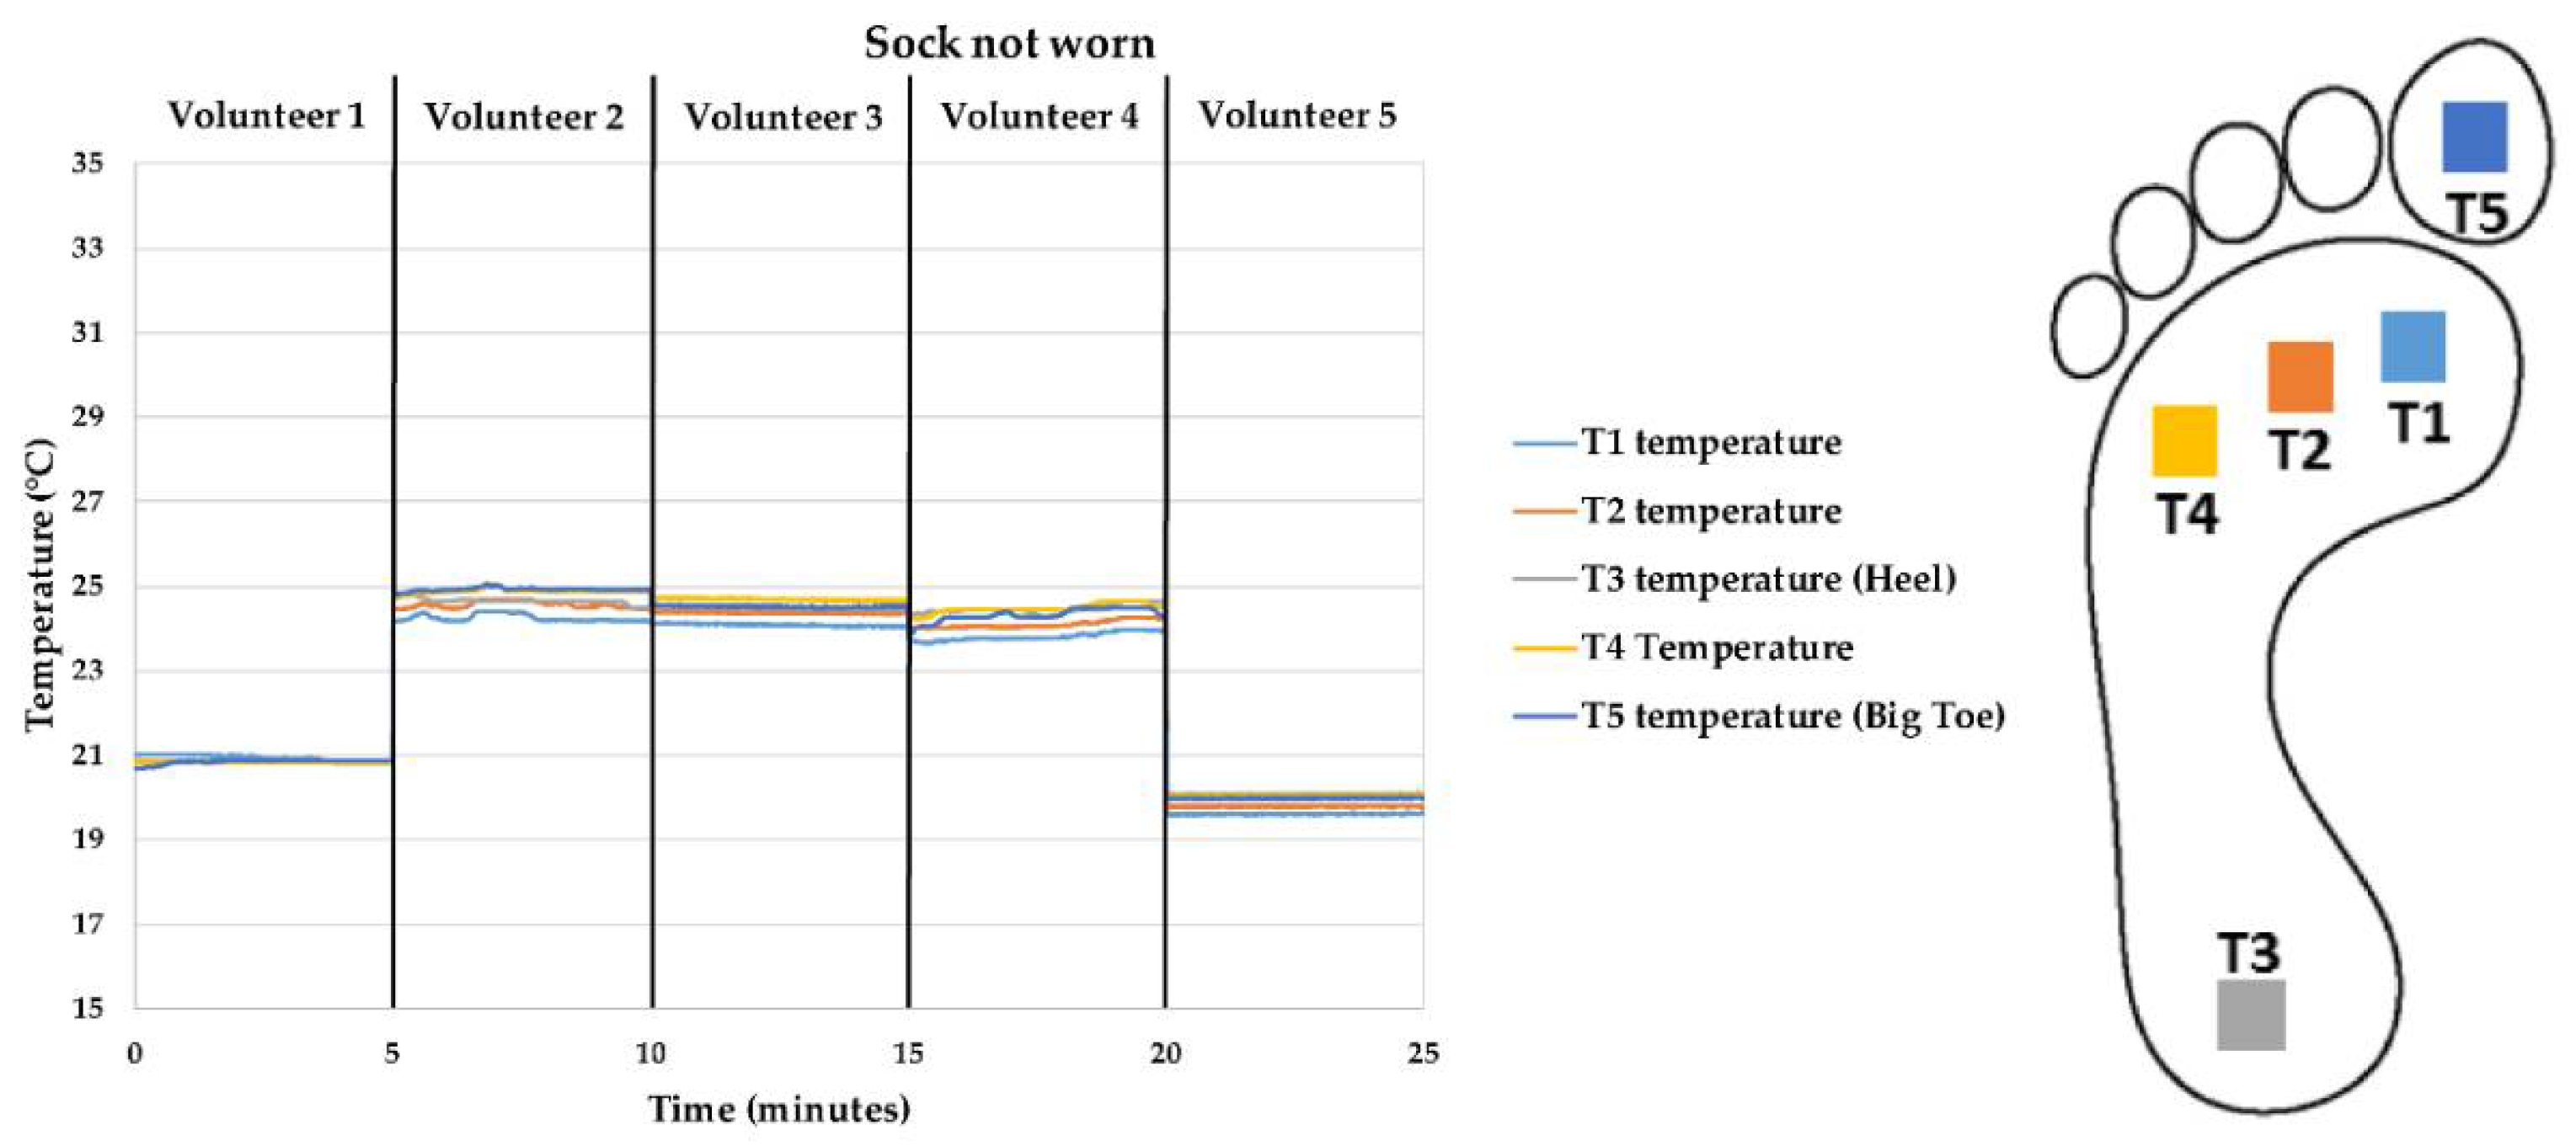
2.4. Prototype Temeprature Sensing Sock

The experience gained by producing the temperature sensing armbands and temperature sensing glove was used to improve the design of a temperature sensing sock. Five temperature sensing yarns were used to produce a sock that could detect temperature at five different points on a foot. The sock was previously and briefly described elsewhere in the literature [1]. The sock was produced using a computerized flat-bed seamless knitting machine (Model SWG 091N3, E15, Shima Seiki, Sakata Wakayama, Japan). The knitted structure had five tubular channels to incorporate the temperature sensing yarns, similar to the technique described in the previous section. A 100% combed black 3/42 tex cotton yarn (Yeoman yarns, Leicester, UK) was used to manufacture the sock. Cotton was chosen as it is one of the most commonly used materials in the manufacture of socks and would therefore add normalcy to the final prototype.
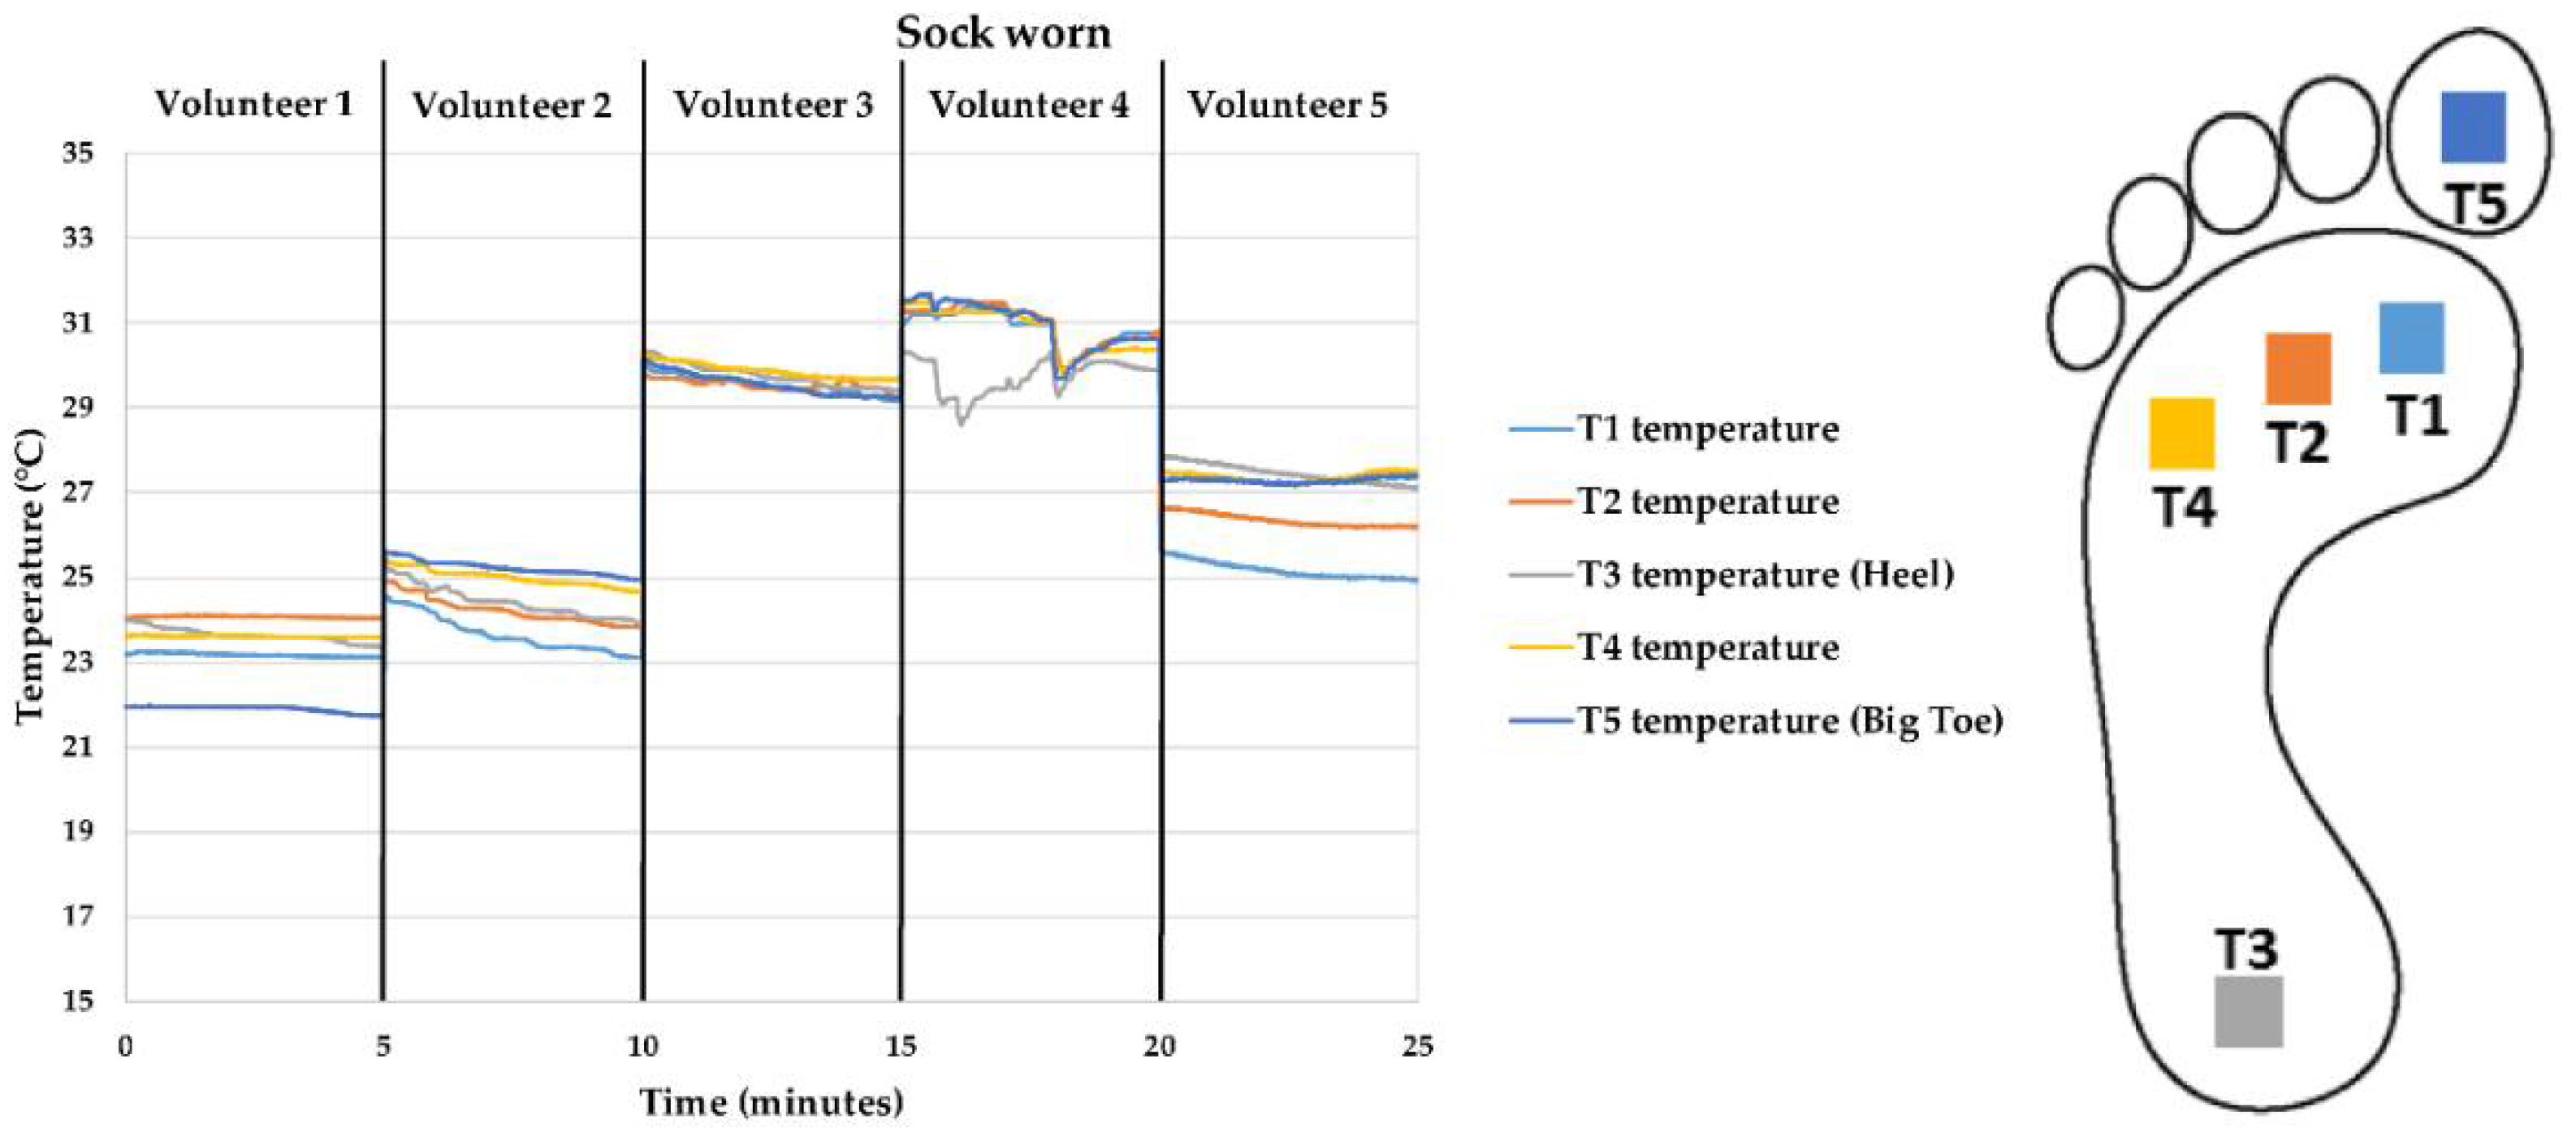
As with all knitted materials, the knitted structure relaxes and shrinks in size after manufacturing and may stretch when worn. Therefore, to ensure that the sensing elements of the temperature sensing yarn were positioned correctly when the sock was worn, a simulated foot was created using plaster (Gypsum). The five positions chosen were the big toe, heel, and three points on the metatarsal head to provide a good indication of the temperature across it. Metal studs were integrated onto the plaster at the five chosen locations to help position the sensing elements of the temperature sensing yarns at the desired locations on the foot. After knitting the sock, the sock was placed onto the simulated foot and the sensing elements of the temperature sensing yarns were positioned to the precise location indicated by the metal studs.
The temperature sensing yarns were connected to a potential divider circuit as discussed earlier. The potential divider circuit was then connected to a USB 6008 DAQ unit that was interfaced to a computer using a USB 2.0 cable (type A to B, National Instruments). The computer provided the power required for the USB 6008 DAQ. The LabVIEW software developed for the glove was modified to be used with the sock. On the front panel, instead of having an image of a hand, an image of a foot was used as previously shown [1]. At the location of each of the sensors in the knitted sock, intensity graphs were positioned as indicators on the foot image. Intensity graphs were used instead of color boxes as this provided a gradual change in color with the change in temperature, providing more information to the end user.

2.5. Measuring Skin Temperature of the Hand Using a Temperature Sensing Yarn

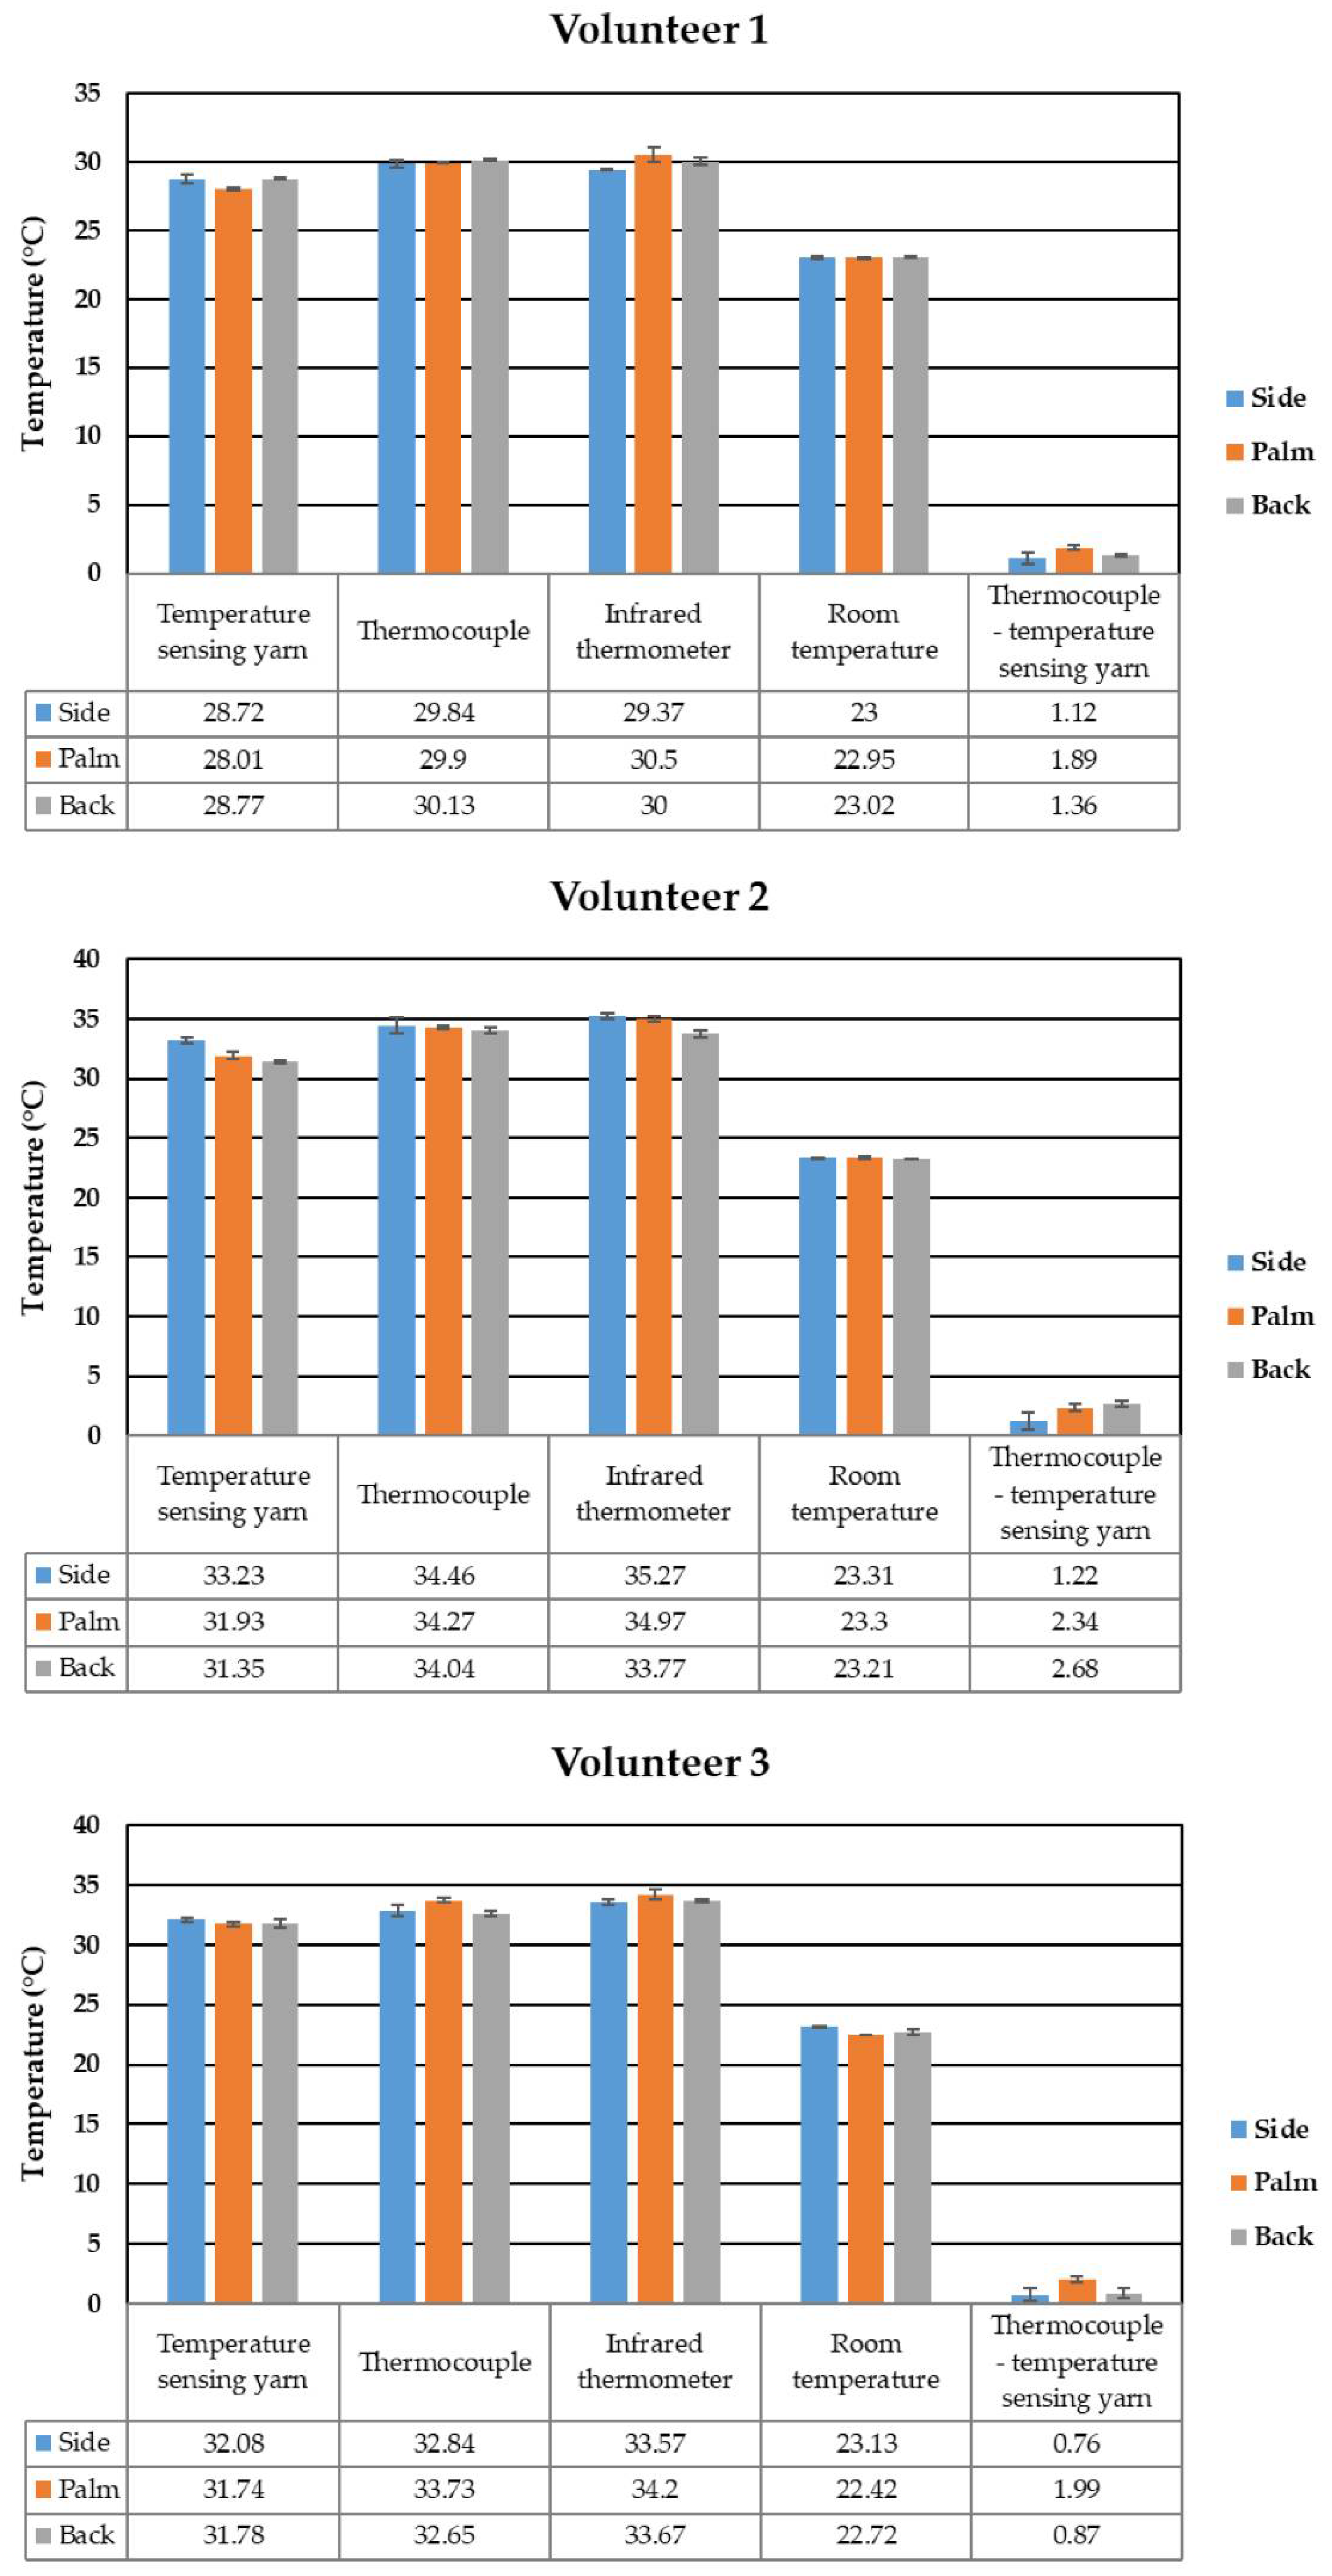
It was important to understand the behavior of the temperature sensing yarn when taking skin contact temperature measurements and to validate that the temperature sensing yarn still operated correctly. Therefore, a preliminary experiment was performed using healthy volunteers from the research team to observe the effects of using the temperature sensing yarn for temperature measurements at different points on the hand.
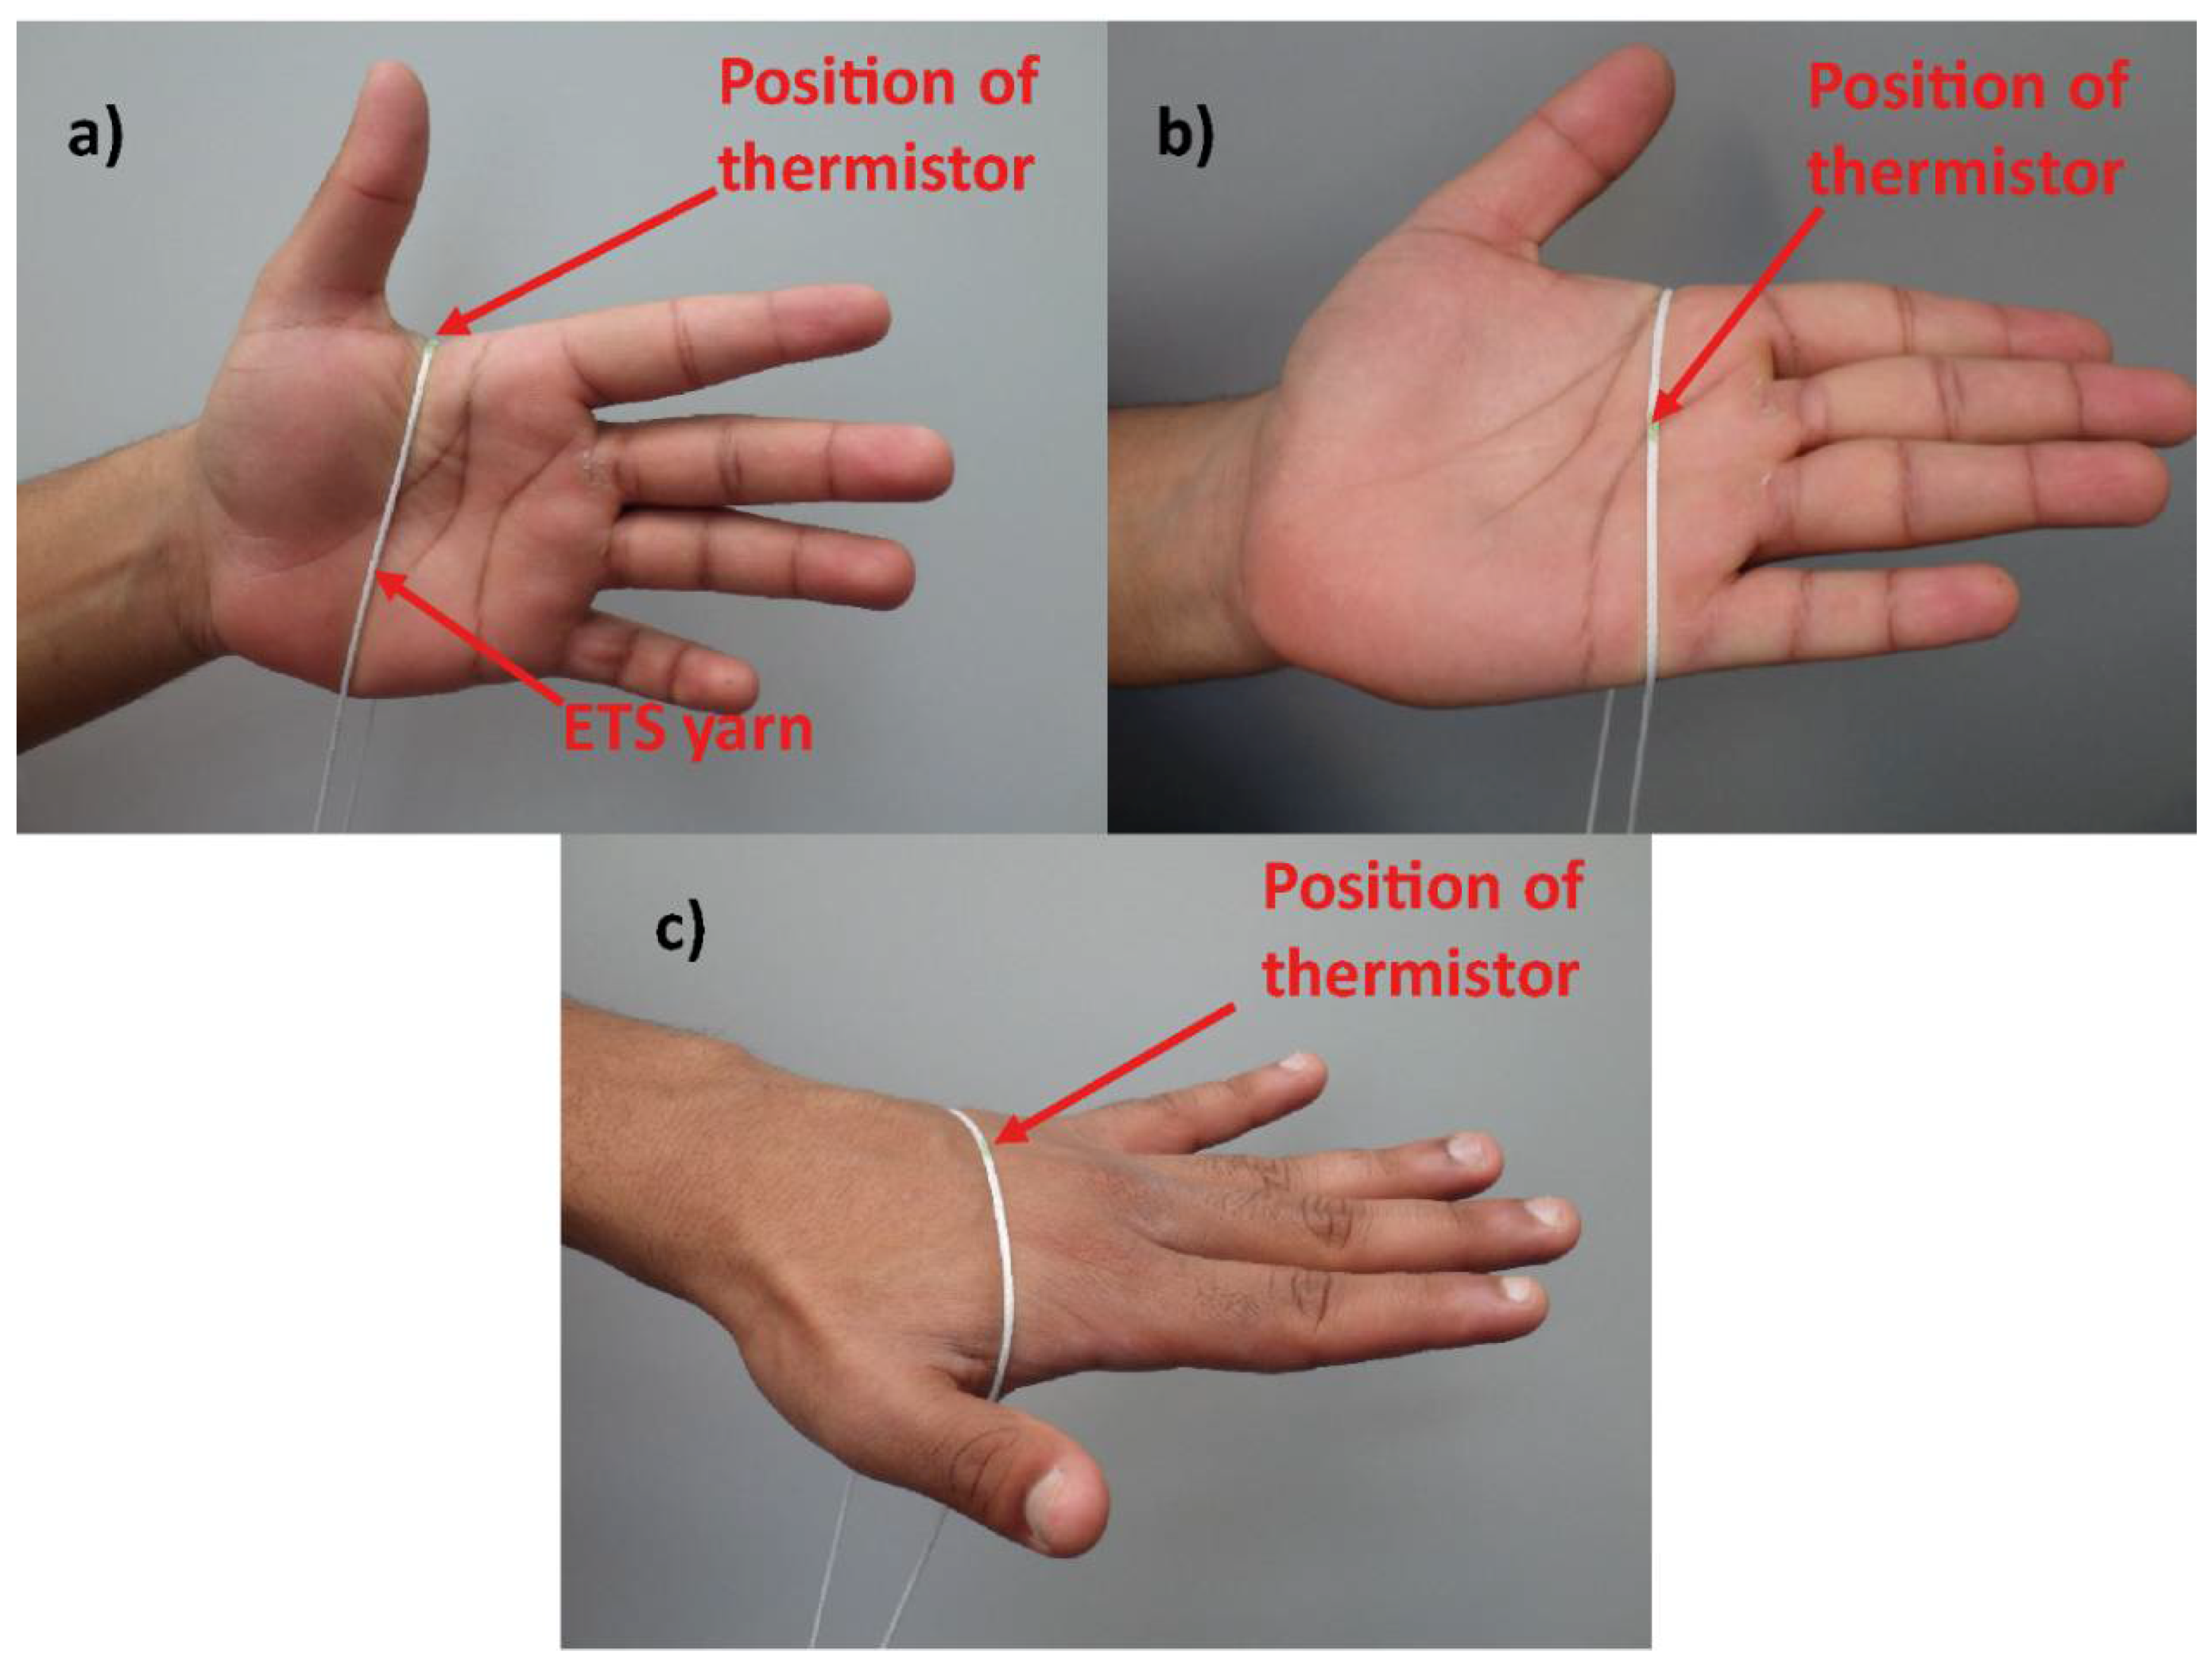
The temperature sensing yarn was placed at different positions on the hand (side, palm, back) as shown in Figure 3. Two 100 g weights were attached to the temperature sensing yarn to create uniform tension. The resulting tension on the yarn (Thold) can be calculated using the Capstan equation [29]:
T l o a d = T h o l d e μ β
where Tload is the tension applied by the weights, µ is the coefficient of friction between the temperature sensing yarn and the skin, and β is the total angle swept by all turns of the temperature sensing yarn.
Three positions on the hand were investigated, with each of these positions providing different contact surfaces for the temperature sensing yarn. In order to validate the measurements, two k-type thermocouples (Pico Technology, St Neots, UK) were positioned on the skin at either side of the temperature sensing yarn. Additionally, a Raytek Raynger MX Infrared Thermometer (Raytek® Fluke Process Instruments, Santa Cruz, CA, USA) was also used to obtain non-contact temperature measurements. This system had an accuracy of ±1 °C.
Experiments were conducted on three separate healthy volunteers from the research team. For each volunteer, measurements were recorded using three different temperature sensing yarns, with each yarn placed at the three positions on the hand, as shown in Figure 3. The temperature sensing yarn was maintained in each position for two minutes (44 measurements were obtained each minute) and the average temperature measurements during the last 30 s were used as the final temperature. This was done to ensure that a steady state was reached before the measurements were taken. Previous work has shown that a temperature sensing yarn has a step-response time of 0.17 ± 0.07 s while heating [1].
To record the temperature measurements, the temperature sensing yarns were connected to a potential divider circuit as described earlier, which was then connected to a data acquisition system (NI DAQ USB 6008, National Instruments). The resistance values recorded using the DAQ were converted to temperature values using the conversion equation provided by the thermistor manufacturer. The thermocouples were connected to a thermocouple data logger (PICO-TC08, Pico Technology, St Neots, UK). LabVIEW was used to capture the temperature from the temperature sensing yarns and the thermocouples.

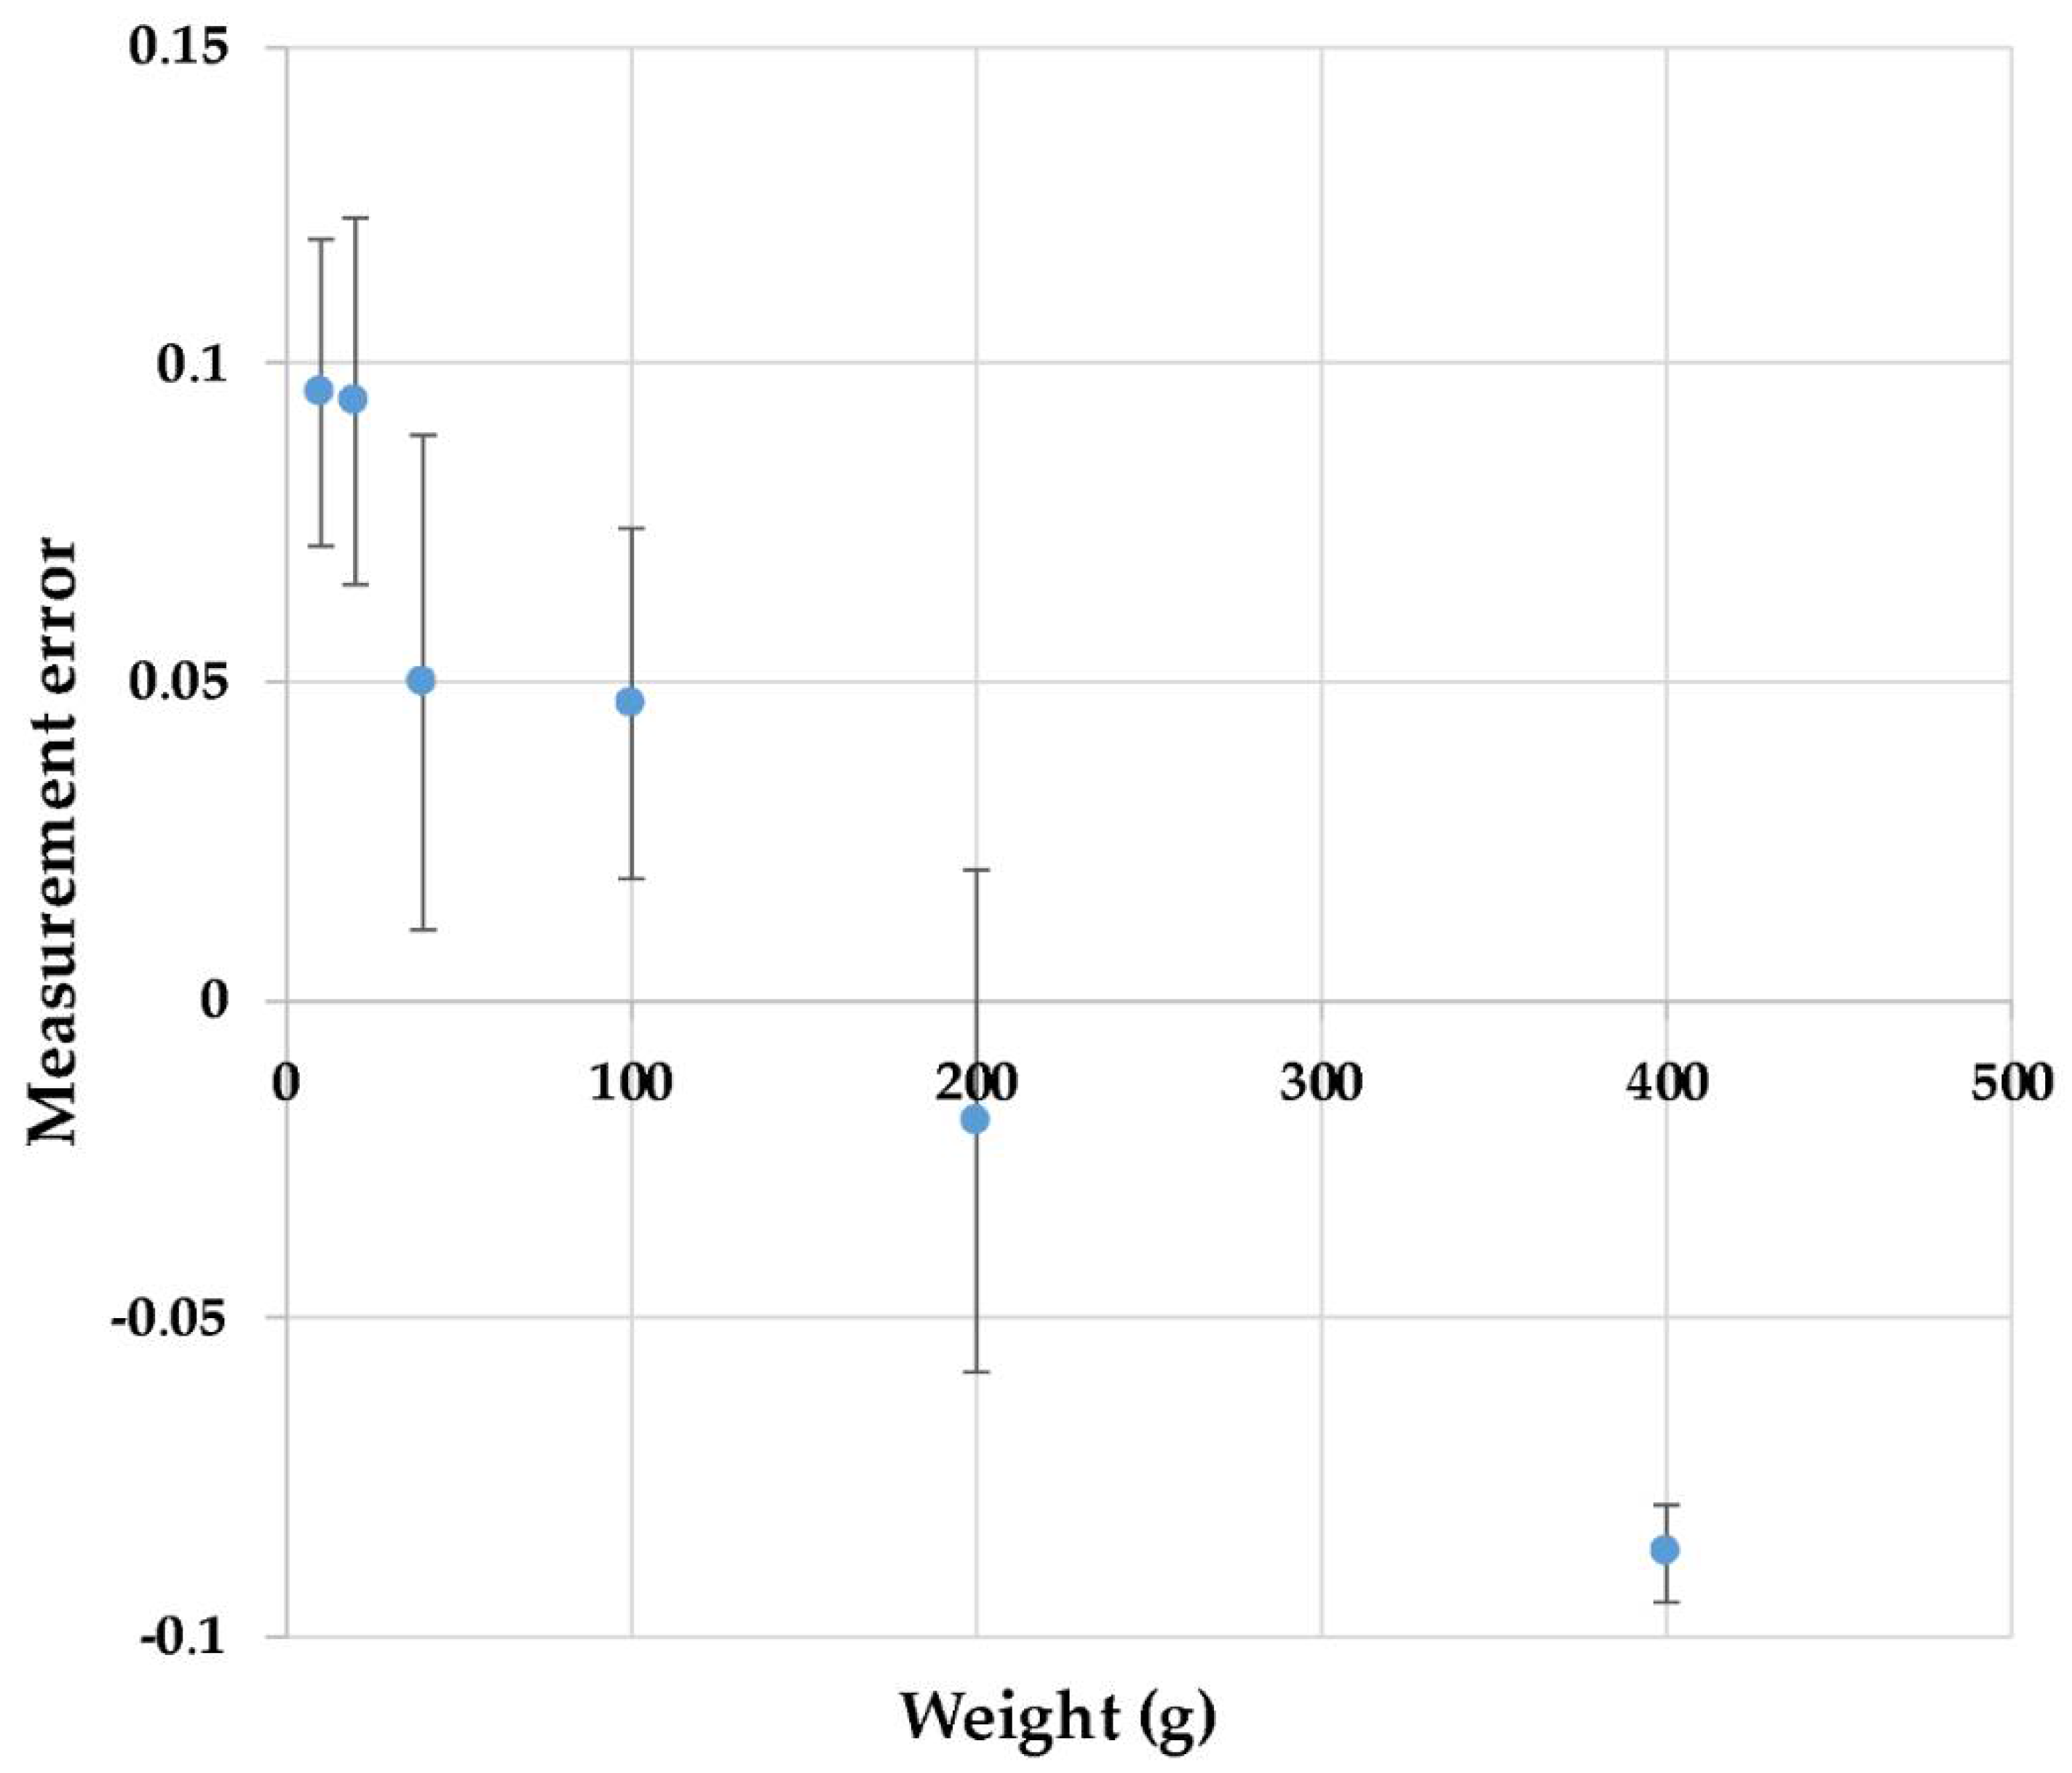
2.5.1. Effects of Increasing Contact Pressure on Measurements Recorded Using the Temperature Sensing Yarns

The temperature sensing yarn and the hand are both 3D structures that deform under pressure. Therefore, identifying the effects of contact pressure on measurements recorded using the temperature sensing yarns was important. In order to achieve this, the same experimental procedure mentioned above was used. However, the temperature sensing yarn was only positioned at the side of the hand (as shown in Figure 3a) and the two weights attached to the temperature sensing yarn were varied (10, 20, 40, 100, 200, and 400 g), changing the contact pressure between the yarn and the hand. Readings from the temperature sensing yarns, the thermocouples measuring skin temperature, and a thermocouple measuring room temperature were recorded, as previously discussed.
The data are presented as a measurement error. The measurement error is the difference between the surface temperature and the temperature indicated by the sensor. For these experiments, the true surface temperature was assumed to be the temperature captured by the thermocouples positioned on either side of the hand. The relationship between the true surface temperature and the indicated temperature can be defined using Equation (2) [30]:
Z = ( T s T i ) ( T s T a )
where Z is the measurement error, Ts is the true surface temperature, Ti is the indicated temperature, and Ta is the room temperature.

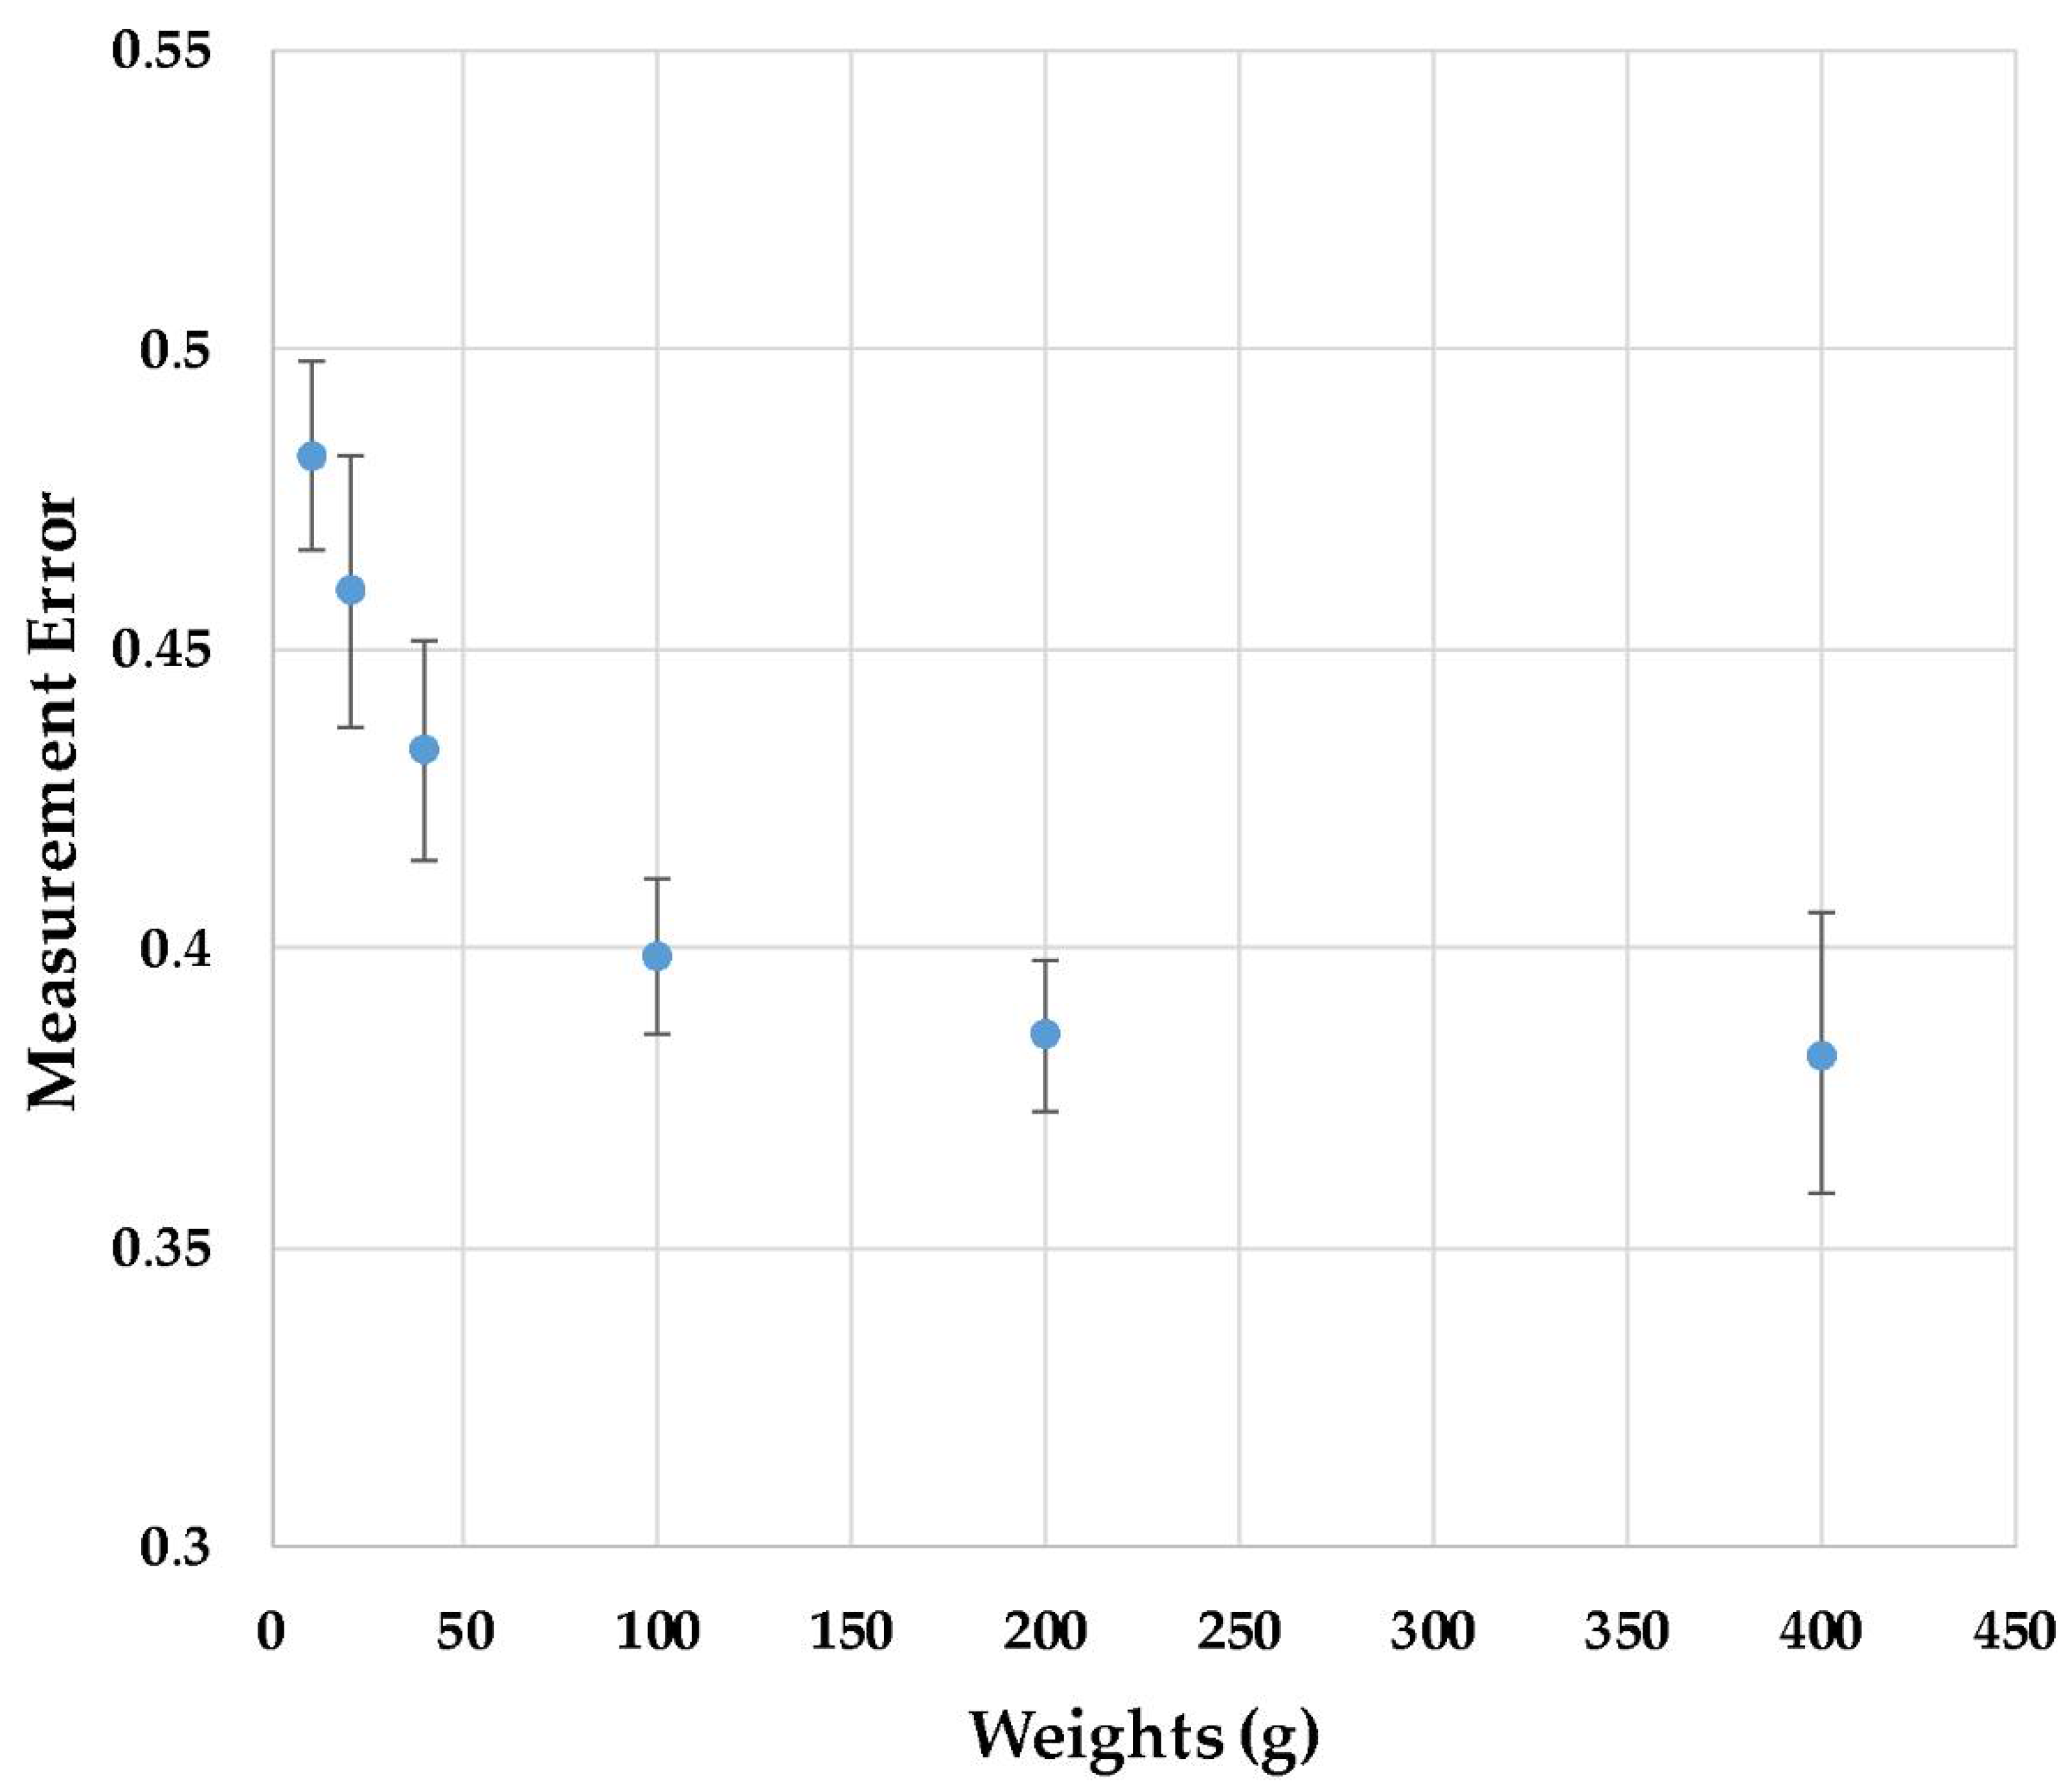
2.5.2. Measuring the Temperature of a Rigid Surface Using the Temperature Sensing Yarn

It was crucial to identify the effects of contact pressure on the temperature sensing yarn measurements when it was used to measure a rigid surface as, unlike the hand, the rigid surface does not deform with increasing contact pressure. The following experiments were conducted using the temperature sensing yarns and a Weller WS 81 (Mfr. Part No. T0053250699N, Weller®, Besigheim, Germany) soldering station. The temperature sensing yarn was placed over the shaft containing the solder tip (henceforth referred to as the shaft; diameter 6.77 mm) of the soldering iron with the soldering tip removed. Two weights were hung from either end of the temperature sensing yarn. The soldering iron was set to 150 °C with the shaft temperature at the point of measurement being recorded at 65.32 ± 3.80 °C using a k-type thermocouple (Pico Technology). Six weights (10, 20, 40, 100, 200, and 400 g) were used for these experiments. A k-type thermocouple (Pico Technology) was held onto the shaft using 3M™ Temflex™ 1300 vinyl electrical tape (3M, Maplewood, MN, USA), which was positioned about 1 mm away from the temperature sensing yarn. The room temperature was obtained using another k-type thermocouple (Pico Technology). Temperatures were captured and recorded using the method discussed in Section 2.5.

2.6. Preliminary User Trials Conducted on the Prototype Temperature Sensing Sock

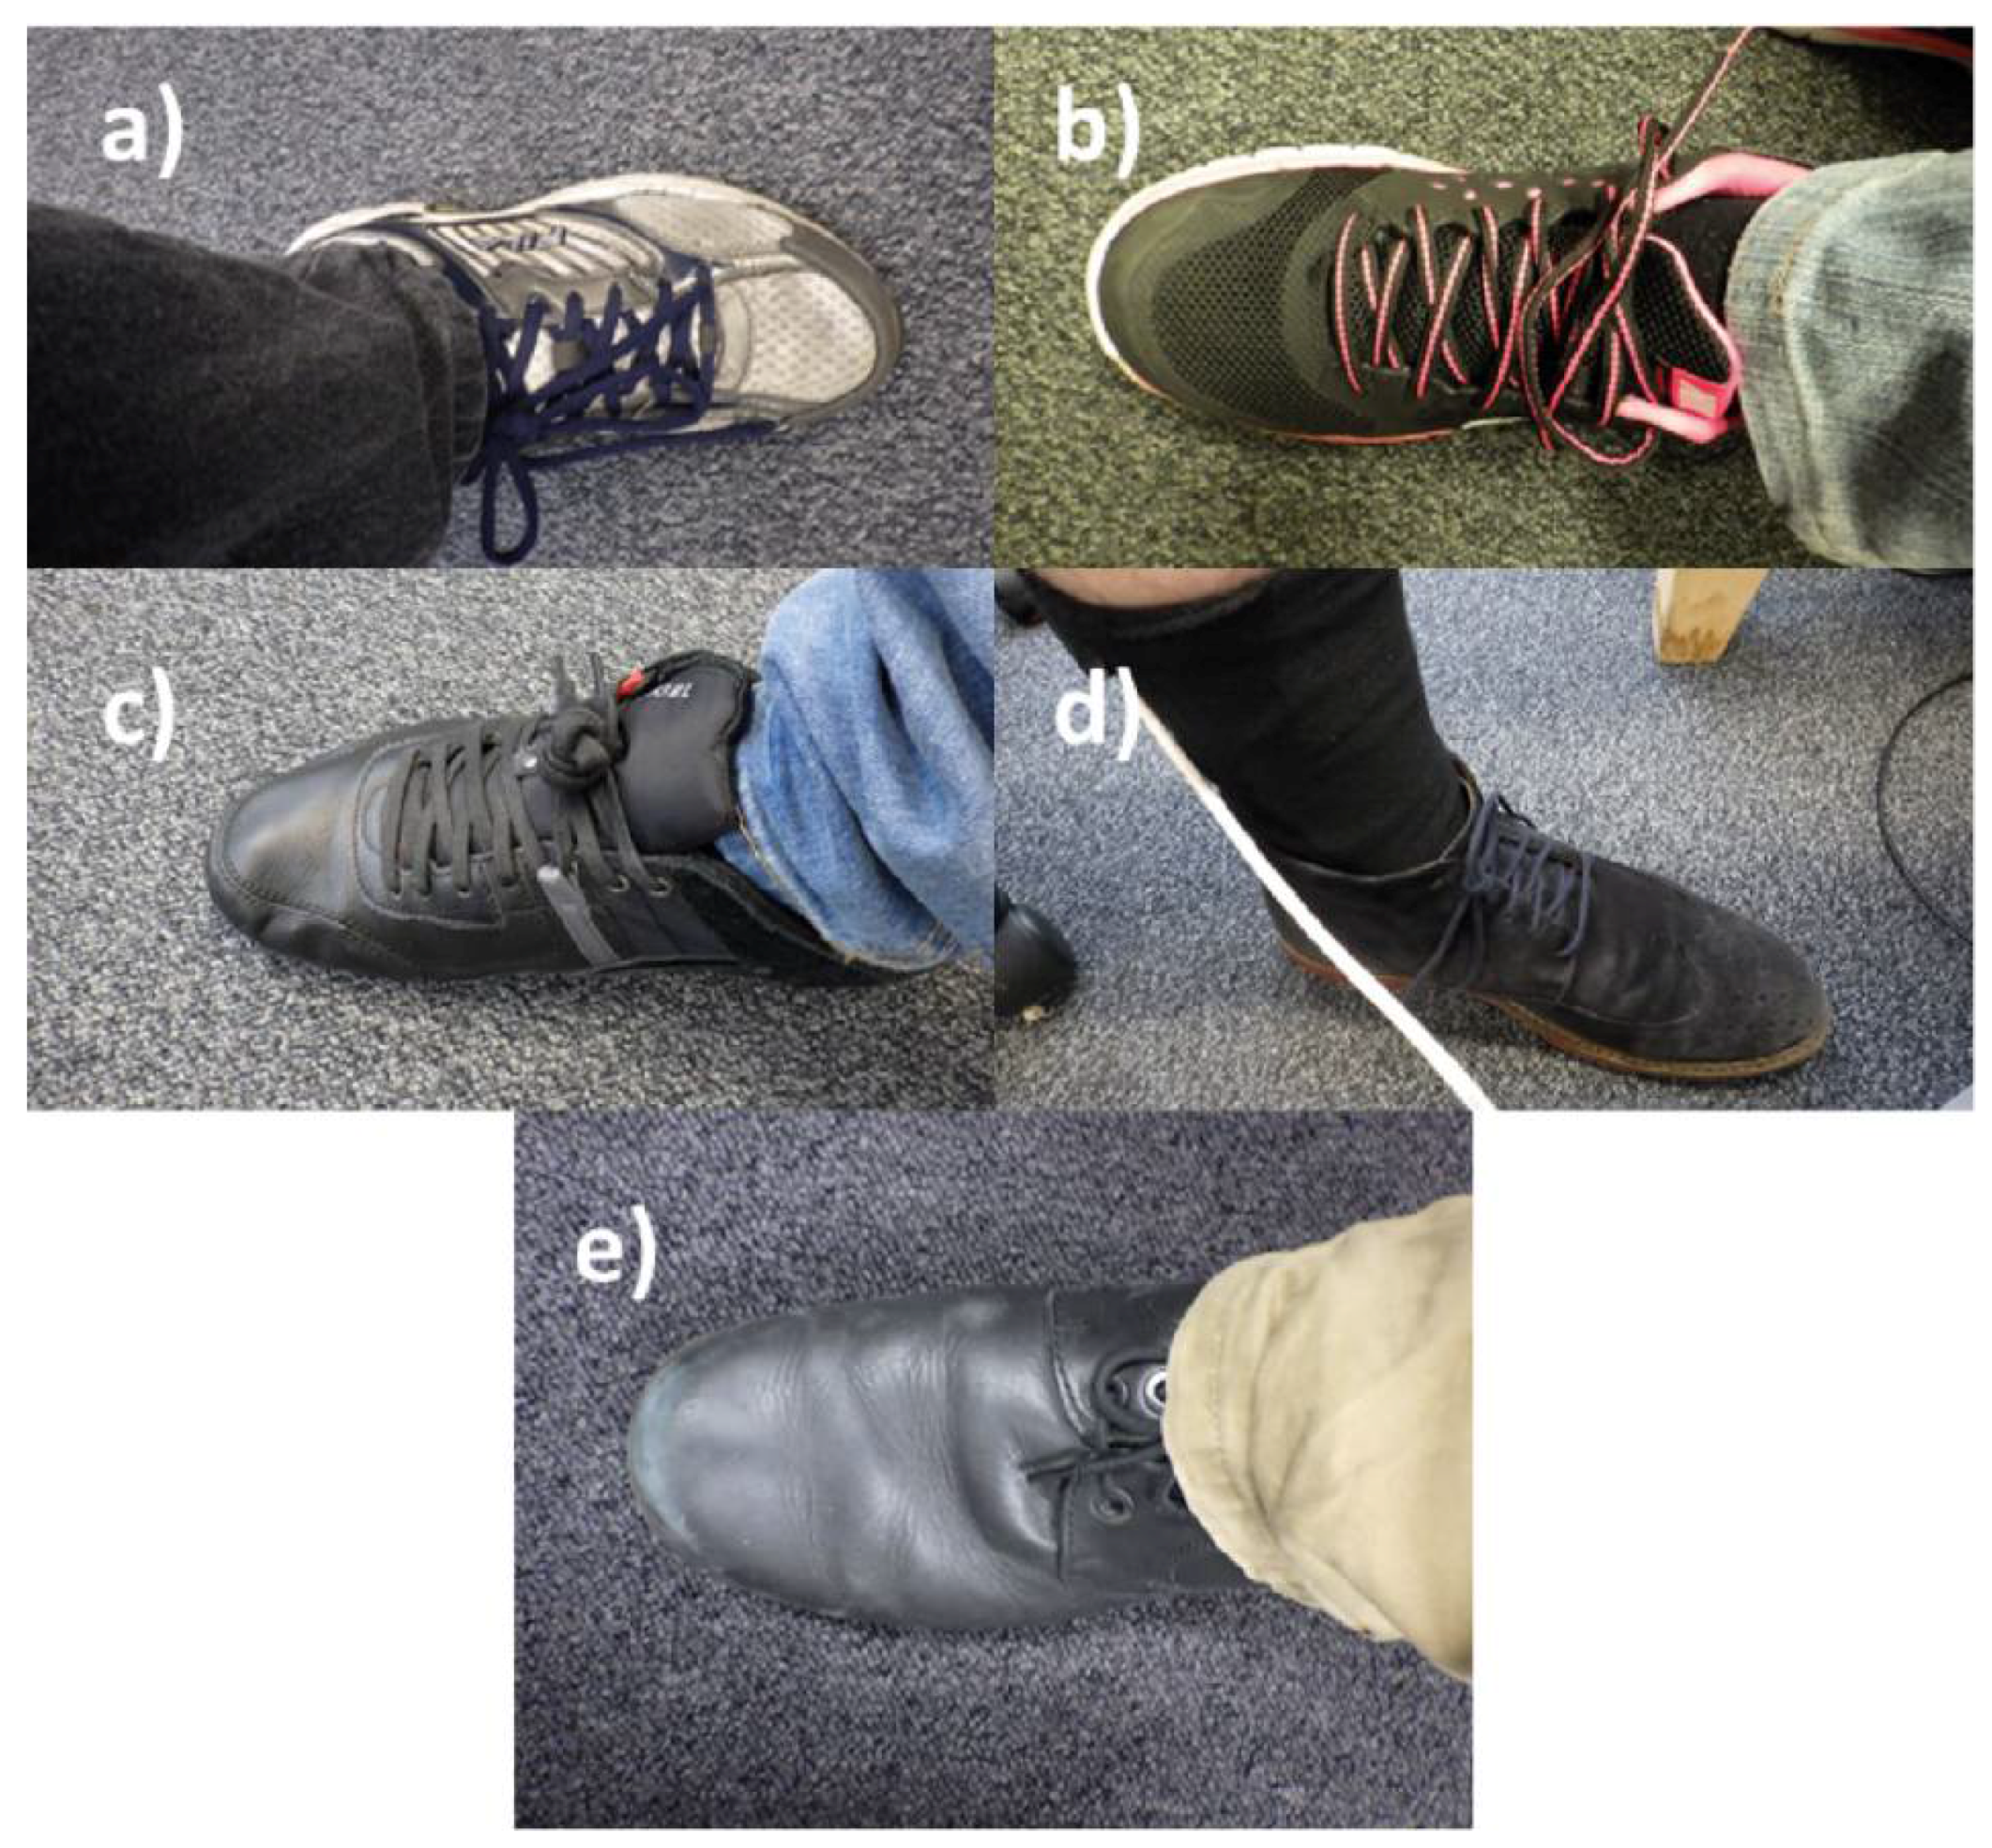
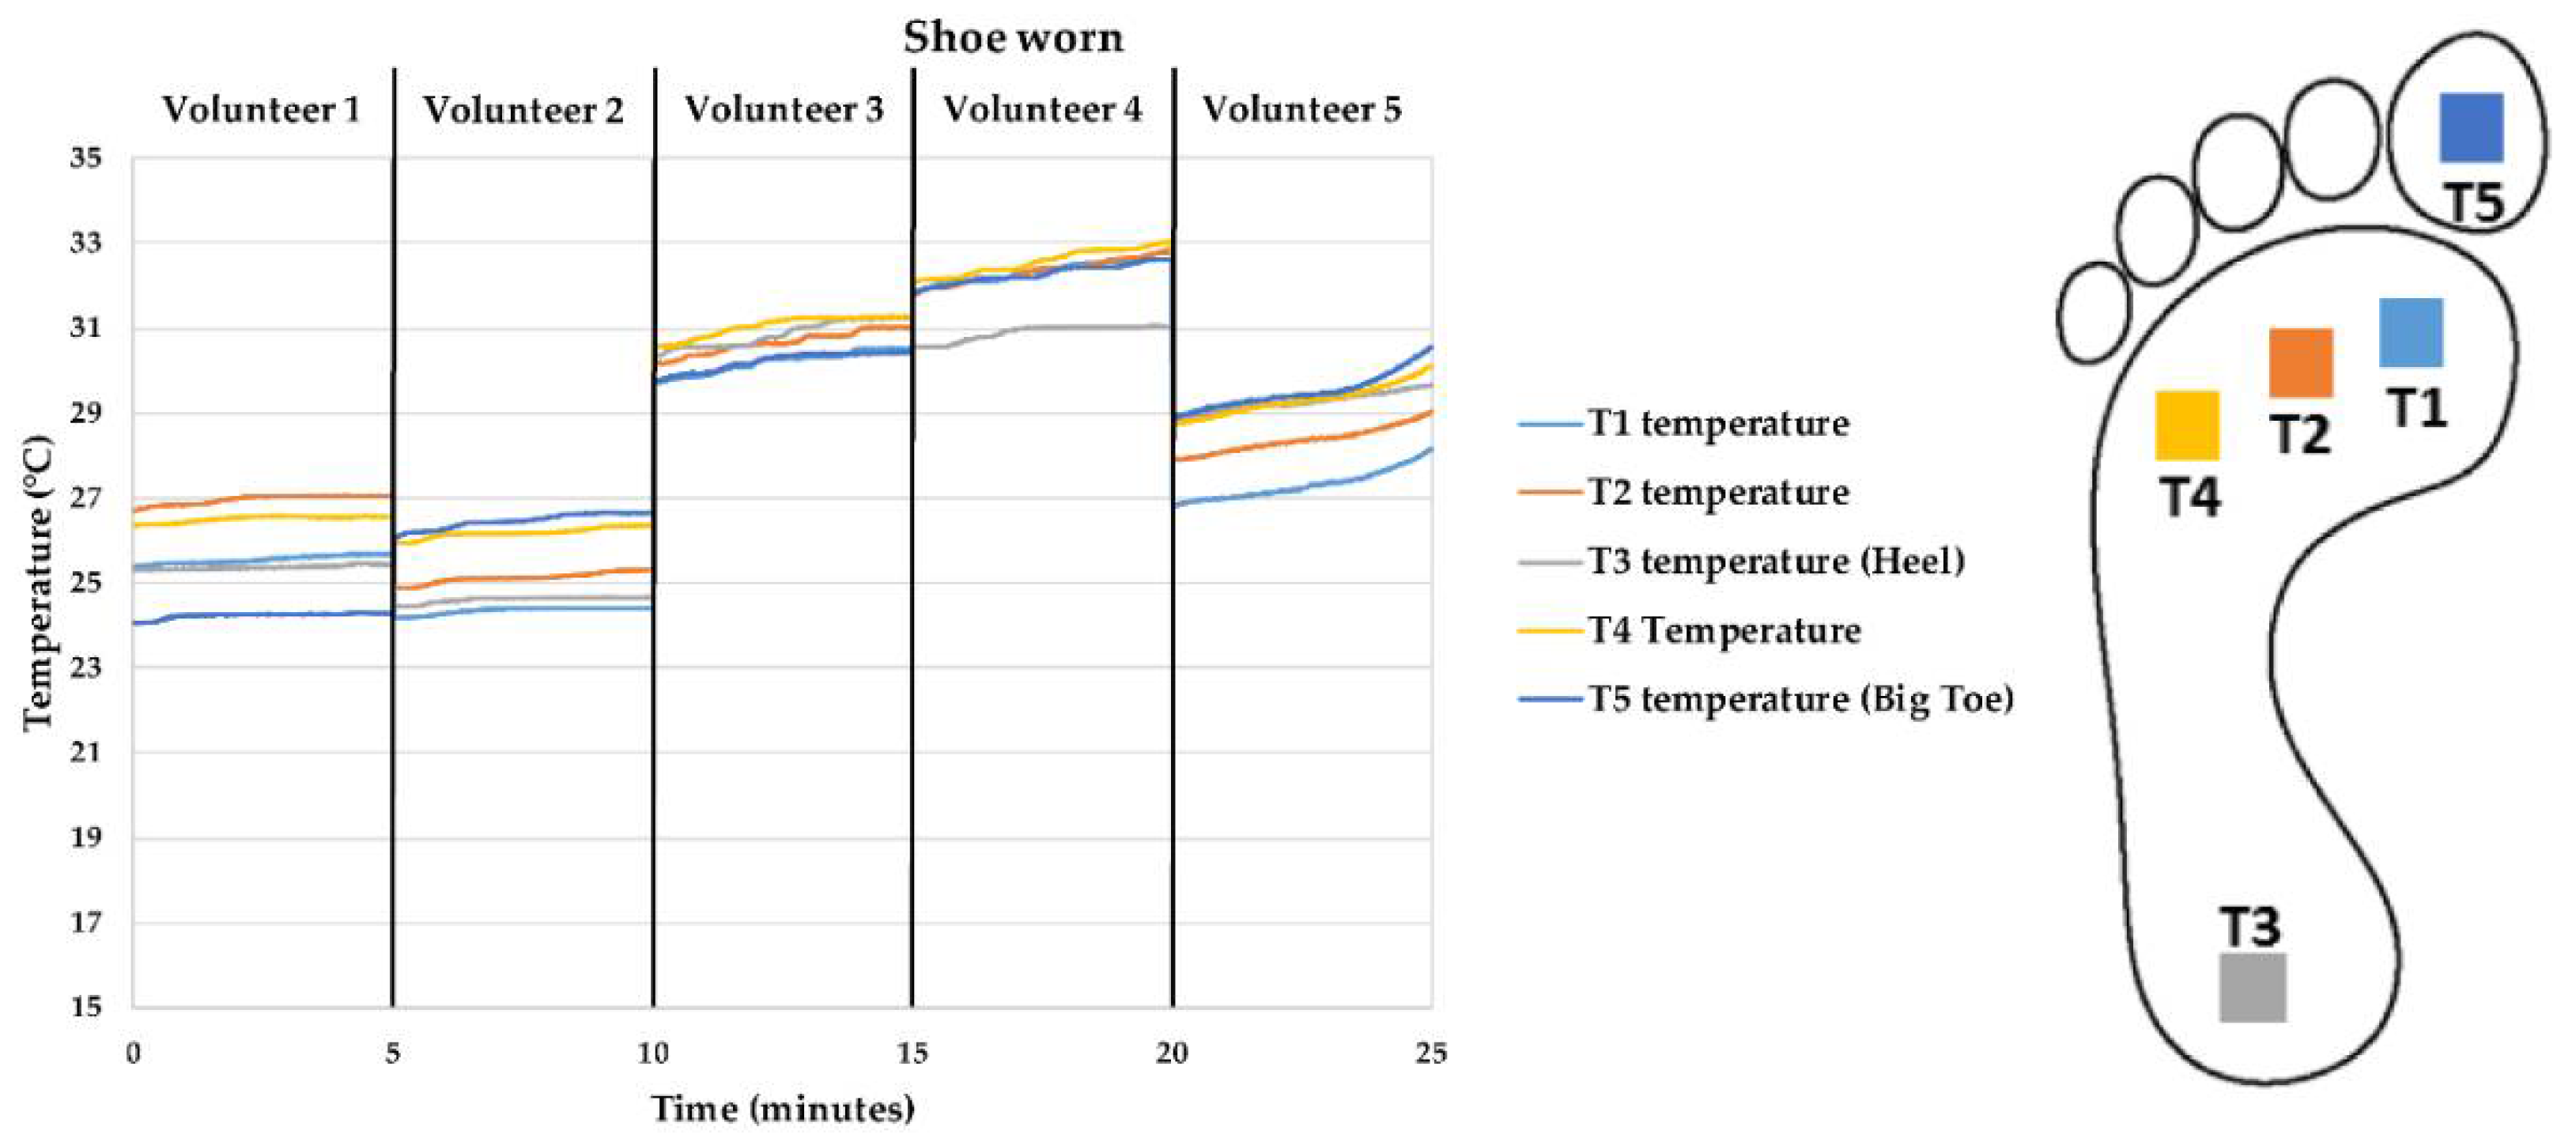
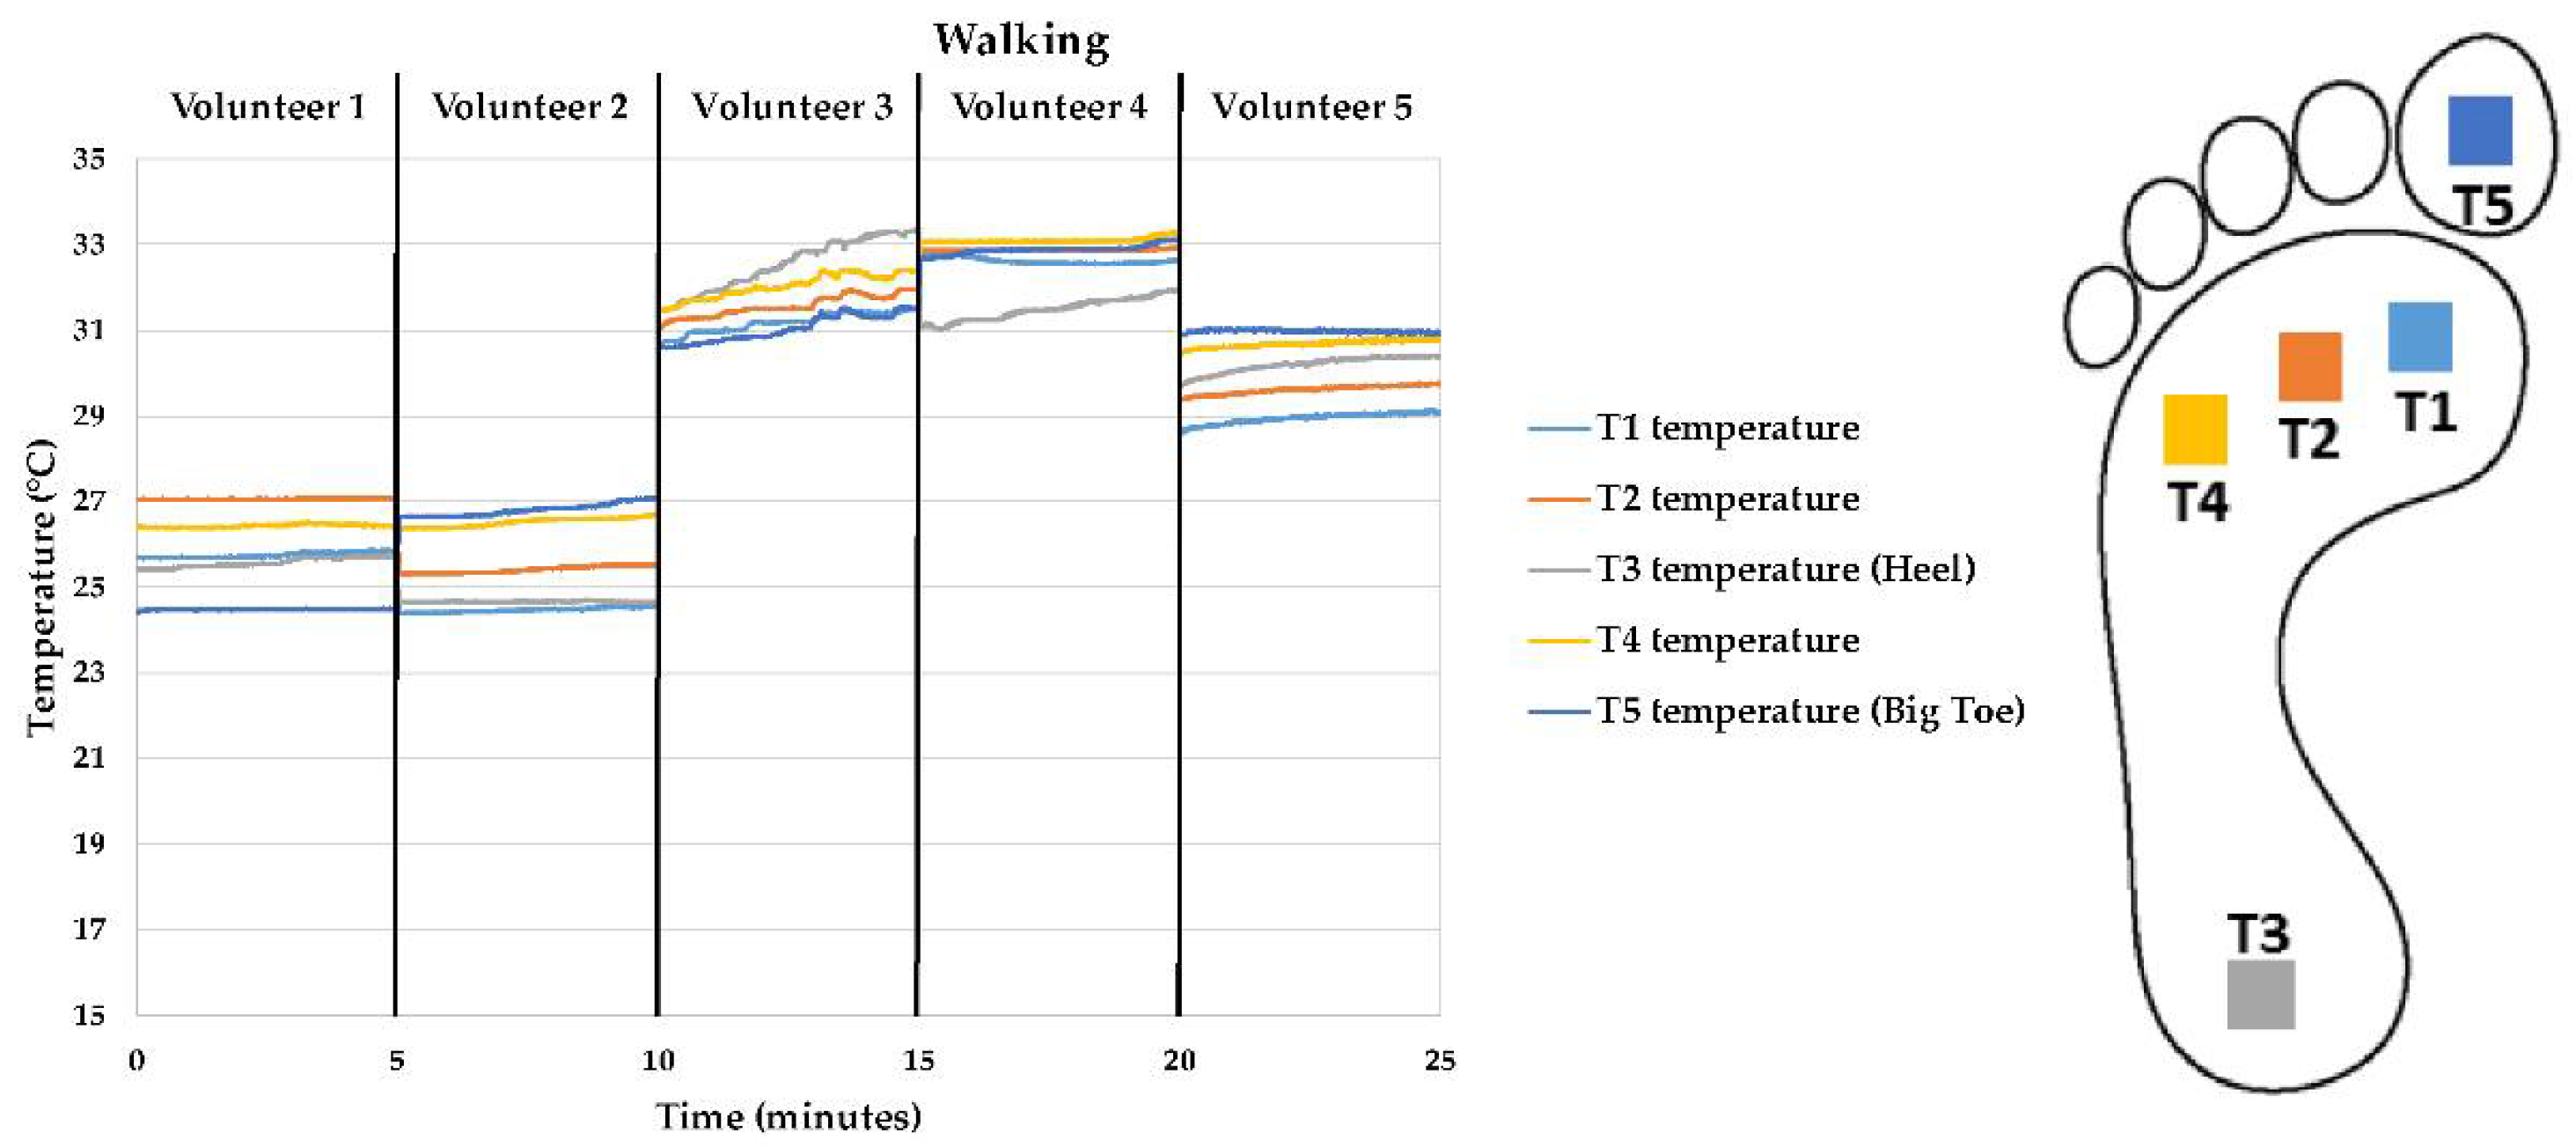
In order to test the prototype temperature sensing sock, it was decided to evaluate how the temperature measurement from the sock varied under different operational conditions. When the sock was not worn, the sock was worn, when a shoe is put on, and when stepping while wearing a shoe were all investigated. These tests were conducted using five healthy volunteers from within the research team. Initially the socks were put on to the simulated foot for five minutes. This ensured that all five temperature sensing yarns were placed in the same environmental conditions and enabled a baseline reading to be recorded. Thereafter, the socks were worn by the volunteers and the temperature measurements were obtained over a period of five minutes. Next, a shoe was worn by the user and the temperature was obtained for another five minutes. Finally, the two feet were moved up and down on a step to simulate the effects of walking, during which time temperature measurements were recorded. Images of the shoes worn by the volunteers are shown in Figure 4.
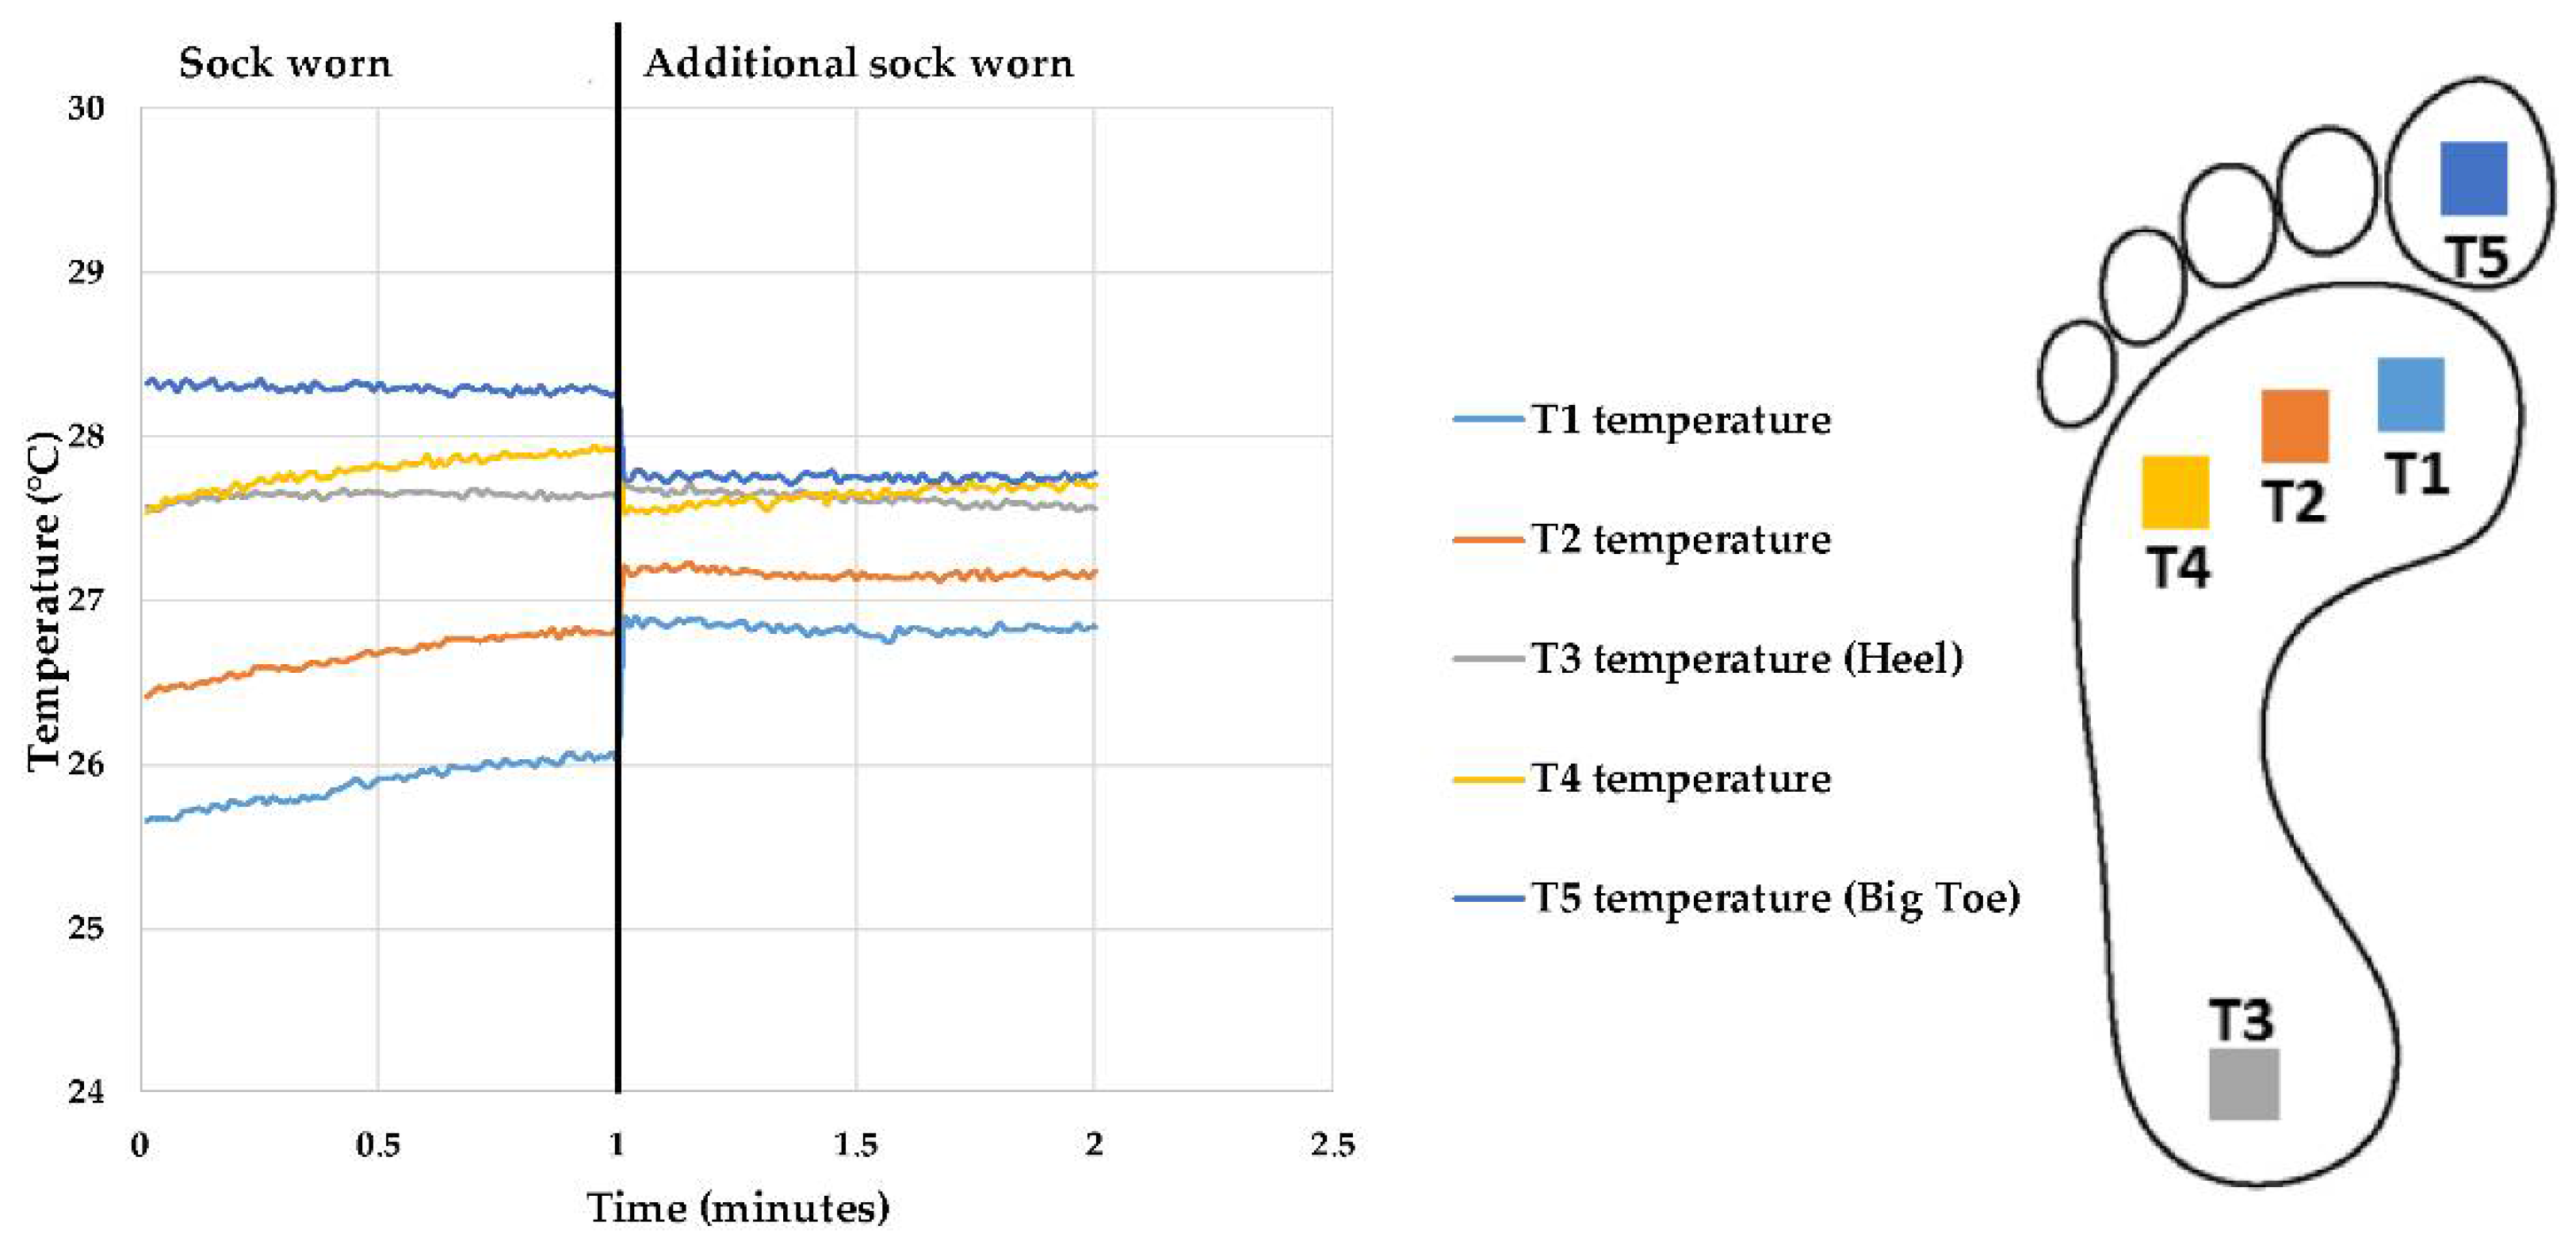
An additional experiment was conducted on Volunteer 5, where a second cotton sock that was made using the same material as the first sock was worn on top of the sock containing temperature sensing yarns. This was done to better understand if an additional sock would enhance the contact between the temperature sensing sock and the skin, or if the additional layer of insulation would dramatically affect the results. Initially, measurements for when the temperature sensing sock was worn were captured. Then temperature measurements after the additional sock was worn on top of it were recorded.

3. Results and Discussion

3.1. Hand Temperature Sensing Yarn Measurements

Experiments were initially performed to validate the use of the temperature sensing yarns for skin contact measurements. Measurements were recorded with three volunteers using three different temperature sensing yarns at three different positions on the hand: side, palm, and back. The measurements from the three temperature sensing yarns were averaged and the standard deviation was calculated at each position for each of the volunteers. The average temperature measurements captured by the thermocouples and the infrared thermometer were also recorded. The difference between the thermocouple temperature measurements and that of the temperature sensing yarns were calculated and are shown in Figure 5. The recorded room temperatures (the room temperature was recorded using another k-type thermocouple) are also presented.
From the results shown in Figure 5, the average temperature difference between the temperature sensing yarn measurements and the thermocouple measurements for each position from all of the three volunteers were observed to be 2.1, 1.6, and 1.0 °C for the palm, back, and side of the hand, respectively. These results illustrated that the difference between the temperature sensing yarn measurements and the thermocouple measurements were the largest when the temperature sensing yarns were positioned on the palm of the hand. This difference was minimized when the temperature sensing yarns were positioned on the side of the hand. This was potentially due to the lower radius of curvature at the side of the hand when compared with the other positions, which provided a higher surface contact pressure between the temperature sensing yarn and skin. According to the Laplace pressure equation in Equation (3) [31], when taking temperature measurements:
p = 2 σ / r
where p is the pressure, σ is the surface tension, and r is the radius of curvature.
The temperature sensing yarn had a minimal contact pressure with the skin when it was placed on the palm of the hand, since the palm had the largest radius of curvature, which produced the largest difference in temperature readings as expected.

3.1.1. Effects on Measurements by the Temperature Sensing Yarn with Changing Contact Pressure

Temperature measurements of the hand were recorded for different contact pressure between the yarn and the hand. This was achieved by changing the weights attached to the yarn. The yarn was positioned on the side of the hand (as shown in Figure 3a) for all experiments. The measurement error was calculated between the surface contact temperature measurement using thermocouples and the temperature sensing yarn, as shown in Figure 6.
As illustrated in Figure 6, the measurement error decreased with increasing weight and therefore the contact pressure. Relatively high experimental errors were observed mainly due to the difficulty of repositioning the yarns on the hand between experiments. The decrease in measurement error with an increase in contact pressure was due to the contact pressure deforming the 3D shape of the hand as well as the temperature sensing yarn. We also observed in the experiment where the 200 g and 400 g weights were used that the measurement error became negative (−0.047 and −0.090, respectively). Notably, the true surface temperature was obtained using the thermocouples that were just positioned on the surface of the skin. When the weight on the temperature sensing yarn was increased, the yarn began to sink into the skin. This increased the contact surface area between the skin and the yarn, which would increase heat transfer from the hand and restrict heat flow out of the yarn.
As the effect of contact pressure instigated the deformation of both the yarn and the hand, additional experiments were conducted using a rigid surface to better understand the effects of contact pressure on only the yarn.

3.1.2. Effects of Contact Pressure on the Measurements when Measuring a Rigid Surface

A measurement error was calculated between the surface contact temperature measurement of a rigid object (soldering iron shaft) and the temperature sensing yarn. Measurements were recorded for different weights attached to the temperature sensing yarn, varying the contact pressure between the yarn and the shaft, as shown in Figure 7.
From Figure 7, increasing the weight (and therefore contact pressure) decreased the measurement error between the soldering iron shaft’s surface temperature measured using a thermocouple and the temperature sensing yarn reading. However, unlike the previous experiment (Figure 6), the values did not become negative. This was a result of the hard metal surface of the shaft not deforming as a consequence of the increasing contact pressure. The decrease in the measurement error with increasing weights was likely due to the compression of the packing fibers and the fibers of the warp knitted tube with the increase in contact pressure. This would expel the air in the gaps between the knitted loops and increase the heat transfer from the soldering iron shaft and the temperature sensing yarn. The sensing element in the temperature sensing yarn would also be positioned closer to the shaft surface, further increasing heat transfer.

3.1.3. Discussion

Investigating temperature measurements using a temperature sensing yarn on the hand showed that the contact pressure had an effect on the measurements. When the temperature sensing yarn was used to capture temperature, contact pressure and the radius of curvature would be important factors in some cases. It is highly unlikely that these temperature sensing yarns would be used on their own to measure temperature; they would be inserted into a textile garment and then used as a tool to measure temperature. In certain situations, the effects of contact pressure would be less relevant. If the temperature sensing yarns were used as a tool to compare the skin temperature at discrete points on two different feet, for example, the radius of curvature would most likely remain similar. Hence, this effect could be ignored. In other cases, the garment and the fabric could be engineered to control the radius of curvature or to generate a known pressure, further minimizing this effect. Once these fabrics are engineered, a larger user trial should be conducted on these fabrics to understand the effects of contact pressure.

3.2. Measurements with the Prototype Temperature Sensing Sock

Experiments were conducted with the temperature sensing sock on five volunteers in three different scenarios: worn, worn under a shoe, and worn under a shoe while walking. The sock was also tested on a simulated foot before the experiments. An additional condition was also evaluated on Volunteer 5, where a second cotton sock was worn on top of the temperature sensing sock. These experiments were completed to understand the limitations of obtaining foot skin temperature measurements with a textile-based temperature sensors. Results from each of the test conditions are detailed below.

3.2.1. Sock Worn on the Simulated Foot

The results for when the sock was not worn by the volunteers but instead worn on a simulated foot are presented in Figure 8. Capturing and presenting the ambient temperature was essential, since ambient temperature has an impact on skin contact temperature measurements as shown in the literature [32]. These experiments were not conducted in a climate controlled room and therefore daily variations had to be understood when comparing volunteer data.
Figure 8 shows the minor variations of >1 °C between the temperature measurements of the five temperature sensing yarns. This variation falls within the ±1.37 °C accuracy of the thermistor, which has been specified by the thermistor manufacturer. Notably, the user trials were not performed on the same day; therefore, as seen in Figure 8, the ambient temperatures recorded prior to testing on each volunteer were different. Regardless, in the cases of the second, third, and fourth volunteers, the ambient temperatures captured were within a ±1 °C and this provided similar test conditions for these three volunteers.

3.2.2. Sock When Worn by Volunteers

Trials were subsequently performed with the temperature sensing sock worn by volunteers. The temperatures captured by the temperature sensing yarns in the sock when the sock was worn by each of the volunteers are presented in Figure 9.
From Figure 9, when the sock was worn, the temperature increased for all the volunteers. For all volunteers except for Volunteer 1, the foot temperature measurements gradually decreased with time, which may have been caused due to cooling bought about by the room temperature.
For the first two volunteers, the temperature measurements were below 28 °C, which was outside of the standard deviation of the mean measured foot temperatures presented in the literature (30.6 ± 2.6 °C) [33]. This may have been due to poor contact between the sock and the foot. The socks were made for a UK size 9 foot but the feet size of the first two volunteers were size 7 and 5, respectively. The temperature recorded from the next two volunteers were within the mean measured foot temperatures presented in the literature. This was most likely due to the sock fitting well on the wearer’s feet. The foot size of the third and fourth volunteers were 8.5 and 9, respectively. For the fourth volunteer, the heel temperature (T3) was notably lower during the first three minutes compared with the other temperature sensing yarns. This may have been caused by improper contact between the temperature sensing yarn and the heel. We also observed a significant fall in the temperature readings after the first three minutes for the fourth volunteer. This might have been due to the volunteer changing the position of their foot during the experiment.
The fifth volunteer had size 11 feet, implying that the temperature sensing sock would have had a close fit. The temperatures obtained from the fifth volunteer were not within the expected range (30.6 ± 2.6 °C). The fit of the sock might have affected the positioning of the thermistors in the temperature sensing yarns (especially in the cases of T1 and T2) and this could have led to improper contact between the foot and the temperature sensing yarns. The lower ambient temperature observed in the case of the fifth volunteer (Figure 8) would have also lowered the temperatures captured by the temperature sensing yarns in the sock.
Therefore, in order to obtain highly accurate or relative measurements, the socks have to be well fitted to the wearer’s feet.

3.2.3. Sock Worn with a Shoe

Temperature measurements recorded by the temperature sensing yarns from all the volunteers when a shoe was worn on top of the sock are provided in Figure 10.
The temperatures recorded increased for all the volunteers when a shoe was worn with the sock. The shoes provided insulation against the lower ambient temperature and reduced the heat flow from the foot to the atmosphere. The most significant rise in the temperature measurements was observed in the fourth volunteer who wore a boot, where the temperature rose by 1.5 °C in four of the five sensors (T1, T2, T4, and T5). This may have been caused by the extra insulation provided by the boot.
The data clearly showed that the shoe anatomy also impacted the temperatures captured by the temperature sensing yarns in the sock. Therefore, it can be concluded that wearing a shoe over the sock alters the temperature measurements captured by the sock and that the anatomy of the shoe may also have an impact on the measurements.

3.2.4. Shoe and Sock Worn While Walking

The results from walking while wearing the temperature sensing sock and a shoe for all the volunteers is presented in Figure 11.
As illustrated in Figure 11, walking caused dissimilar changes in the temperatures recorded for each of the volunteers. For Volunteer 1, the temperature measurements were the same when the feet were moving compared to when they were stationary. For Volunteer 2, a minimal increase occurred in the temperature recorded by four temperature sensing yarns (T1, T2, T4, and T5) when the user started walking. The temperature of the foot rose the most for Volunteer 3. This may have been due to the fact that the volunteer moved their feet faster than the rest of the volunteers. This resulted in a difference up to 3 °C compared to when only the sock was worn (i.e., no movement and no shoe worn). In the case of Volunteer 4, motion resulted in a small increase in temperature. For Volunteer 5, the temperature recorded by four of the temperature sensing yarns (except for the sensor on the big toe, T5) increased slightly. Therefore it was concluded that walking with these temperature sensing socks caused changes in the temperatures recorded. The changes in temperature depend on the individual wearing the sock as well as the walking speed; however, further experiments are needed to fully quantify this effect.

3.2.5. Wearing an Additional Sock over the Temperature Sensing Sock

The results for when Volunteer 5 wore the temperature sensing sock and when an additional sock was worn on top of the temperature sensing sock were recorded and are shown in Figure 12.
Figure 12 shows that wearing another sock on top of the temperature sensing sock reduced the difference between the temperature captured by the five temperature sensing yarns significantly. Wearing an additional sock provided insulation to external environmental conditions and also enhanced the contact between the skin and the temperature sensing sock.

3.2.6. Discussion

Foot temperature measurements were successfully captured for all the volunteers at five points on the feet. It was observed that the temperatures captured from the first two volunteers were significantly lower than for the last three volunteers. This could be a result of the socks being too large for the feet of the first two volunteers, leading to poor contact between the sock and the skin. The temperature readings from Volunteers 1 and 2 were outside the expected range for foot skin temperature, whereas the temperature readings from the last three volunteers were closer to this value. This proved that the fit of the sock is critical to obtaining meaningful and realistic absolute temperature measurements. This supports the earlier experiments in this paper showing the importance of contact pressure between the temperature sensing yarn and the skin. Therefore, to ensure that the temperature sensing yarn provides precise temperature measurements, the socks should be made to fit the users’ feet, guaranteeing good contact between the sock and the skin surface.
It was also observed that critical factors external to the sock, such as the type of footwear worn or movement of the feet, had an effect on the absolute temperature readings. Work by Reddy et al. showed that walking increases the foot temperature and highlighted the importance of creating evidence-based healthcare guidelines for managing diabetic foot ulcerations [34].
The temperature changes recorded in this paper were not necessarily relative. For example, in the case of Volunteer 3, walking induce a –1 °C between points T3 and T4, when they had been in agreement when the foot was static. This would have also had an effect on relative temperature measurements.
For the last three volunteers (Volunteers 3, 4, and 5), the measurements demonstrated that the temperatures recorded for the five temperature sensing yarns varied compared with each other by about ± 2 °C when the socks were worn.
Wearing another sock on top of the temperature sensing sock enhanced the contact between the temperature sensing sock and the skin, acting as an insulating layer between the sock and the external environment. The results showed that the additional sock reduced the recorded temperature differences between points on the foot. The differences between the points were still present when a shoe was worn, which would have provided some degree of thermal insulation. Therefore, the change was likely due to better contact between the foot and the thermistors in the sock. This again highlighted the importance of the fit of the sock on the viability of obtaining foot skin temperature measurements.
Ultimately, highly accurate temperature measurements were only achieved when the sock had a very close fit to the foot. Wearing a shoe and walking also caused dissimilar changes in the temperature measurements from the volunteers (this resulted in an average change of 1.23 °C in the five temperature sensing yarns in Volunteer 3). To obtain highly accurate and statistically relevant measurements, the socks have to be well fitted and calibrated depending on the individual and anatomy of the wearer’s shoe. The fit of the sock could be improved by custom knitting socks using scan-to-knit technology [35].
For applications such as non-freezing cold injury detection, where large temperature changes may be observed, and the exposure time to the lower temperatures is regarded important [4], these socks may provide an ideal solution. Currently, no tools are available that are capable of remotely monitoring foot temperature over a prolonged period of time in operational conditions. These socks would provide a powerful tool for the UK military to monitor, record, and analyze the development of non-freezing cold injury in soldiers.

4. Conclusions

Temperature sensing yarns have been successfully used to create a number of temperature sensing garments. The temperature sensing yarns did not impact the textile characteristics of the garments to bend, sheer, and drape. The packing fibers and the warp knitted tube that covered the micro-pod in the temperature sensing yarn ensured that the electronics remained invisible to the wearer and did not affect the feel of the textile garment. Details for producing these garments have been provided along with thorough design considerations. The experiments conducted on hands and a rigid surface showed that contact pressure affects the measurements taken by the temperature sensing yarn due to the deformation of the yarn structure. In terms of the temperature sensing yarn, this is an important result since other temperature sensors that are not textile-based do not deform in this fashion. The experiments highlighted an important limitation in temperature sensing yarn technology; therefore, any fabric made using these yarns would have to be engineered with regard to the contact pressure at the point of the temperature measurement. Once these fabrics are engineered, user trials need to be conducted on a larger scale and this will be completed in the future. This will also be an important design consideration that would have to be taken into account when developing other textile-based temperature sensors.
A trial was conducted with the temperature sensing sock. It was observed that the accuracy of the temperature measurements were heavily dependent on the fit of the sock. Although this might be acceptable for some applications (e.g., non-freezing cold injury), for applications where highly accurate measurements are required, a close fitting of the sock is necessary. This would ensure proper contact between the temperature sensing yarns and the feet of the user. It was also demonstrated that wearing a shoe and an additional sock created a microclimate, which changed the recorded temperature measurements. To better classify the operational limitations of obtaining foot skin temperature measurements with a textile sensor, larger user trials would have to be completed. Identifying the best textile structure to ensure contact between the temperature sensing yarns and the skin is also required. Compression socks, which have already been used for other medical conditions [36], may prove to be an appropriate solution and this will be explored in future work.

Author Contributions

P.L., T.D. conceived and designed the prototypes and the experiments; P.L. performed the experiments and developed the prototype samples; C.O. knitted the prototype garments; P.L. and T.H.-R. analyzed the prototype samples and the experimental data; R.M. contributed specialist expertise in measurement science and interfacing; P.L., T.D. and T.H.-R. wrote the paper.

Funding

This research received funding from the Defence Science and Technology Laboratory through the Centre for Defence Enterprise.

Acknowledgments

Pasindu Lugoda gratefully acknowledges Nottingham Trent University for funding under the Vice Chancellors Bursary Award. The authors would like to thank Richard Arm for fabricating the simulated foot with metal studs. The authors would also like to thank Dorothy Hardy for proofreading the manuscript.

Conflicts of Interest

The authors declare no conflict of interest.

References

  1. Hughes-Riley, T.; Lugoda, P.; Dias, T.; Trabi, C.L.; Morris, R.H. A Study of Thermistor Performance within a Textile Structure. Sensors 2017, 17, 1804. [Google Scholar] [CrossRef] [PubMed]
  2. Chen, W.; Dols, S.; Oetomo, S.B.; Feijs, L. Monitoring Body Temperature of Newborn Infants at Neonatal Intensive Care Units Using Wearable Sensors. In Proceedings of the Fifth International Conference on Body Area Networks, New York, NY, USA, 19–21 June 2010; pp. 188–194. [Google Scholar]
  3. McCallum, L.; Higgins, D. Body temperature is a vital sign and it is important to measure it accurately. This article reviews and compares the various methods available to nurses measuring body temperature. Nurs. Times 2012, 108, 20–22. [Google Scholar] [PubMed]
  4. Hope, K.; Eglin, C.; Golden, F.; Tipton, M. Sublingual glyceryl trinitrate and the peripheral thermal responses in normal and cold-sensitive individuals. Microvasc. Res. 2014, 91, 84–89. [Google Scholar] [CrossRef] [PubMed]
  5. Imray, C.; Grieve, A.; Dhillon, S. Caudwell Xtreme Everest Research Group. Cold damage to the extremities: Frostbite and non-freezing cold injuries. Postgrad. Med. J. 2009, 85, 481–488. [Google Scholar] [CrossRef] [PubMed]
  6. Armstrong, D.G.; Holtz-Neiderer, K.; Wendel, C.; Mohler, M.J.; Kimbriel, H.R.; Lavery, L.A. Skin Temperature Monitoring Reduces the Risk for Diabetic Foot Ulceration in High-risk Patients. Am. J. Med. 2007, 120, 1042–1046. [Google Scholar] [CrossRef] [PubMed]
  7. Yusuf, S.; Okuwa, M.; Shigeta, Y.; Dai, M.; Iuchi, T.; Rahman, S.; Usman, A.; Kasim, S.; Sugama, J.; Nakatani, T.; et al. Microclimate and development of pressure ulcers and superficial skin changes. Int. Wound J. 2015, 12, 40–46. [Google Scholar] [CrossRef] [PubMed]
  8. Ring, E.F.J.; Ammer, K. Infrared thermal imaging in medicine. Physiol. Meas. 2012, 33, R33. [Google Scholar] [CrossRef] [PubMed]
  9. University of Tokyo. Fever Alarm Armband: A Wearable, Printable, Temperature Sensor—ScienceDaily. ScienceDaily. 23 February 2015. Available online: http://www.sciencedaily.com/releases/2015/02/150223084343.htm (accessed on 25 February 2015).
  10. Nasir Mehmood, A.H. A flexible and low power telemetric sensing and monitoring system for chronic wound diagnostics. Biomed. Eng. OnLine 2015, 14. [Google Scholar] [CrossRef]
  11. Giansanti, D.; Maccioni, G.; Bernhardt, P. Toward the design of a wearable system for contact thermography in telemedicine. Telemed. J. E-Health Off. J. Am. Telemed. Assoc. 2009, 15, 290–295. [Google Scholar] [CrossRef] [PubMed]
  12. Klien, T. Spanish Researchers Test Patient Reactions to Wearables for Parkinson Monitoring|EMDT—European Medical Device Technology. European Medical Device Technology. 2 November 2015. Available online: http://www.emdt.co.uk/daily-buzz/spanish-researchers-test-patient-reactions-wearables-parkinson-monitoring (accessed on 4 March 2015).
  13. Hughes-Riley, T.; Dias, T.; Cork, C. A historical review of the development of electronic textiles. Fibers 2018, 6, 34. [Google Scholar] [CrossRef]
  14. Husain, M.D.; Kennon, R.; Dias, T. Design and fabrication of Temperature Sensing Fabric. J. Ind. Text. 2013, 44, 398–417. [Google Scholar] [CrossRef]
  15. Roh, J.S.; Kim, S. All-fabric intelligent temperature regulation system for smart clothing applications. J. Intell. Mater. Syst. Struct. 2015, 27, 1165–1175. [Google Scholar] [CrossRef]
  16. Ziegler, S.; Frydrysiak, M. Initial Research into the Structure and Working Conditions of Textile Thermocouples. Fibres Text. East. Eur. 2009, 17, 84–88. [Google Scholar]
  17. Soukup, R.; Hamacek, A.; Mracek, L.; Reboun, J. Textile-based temperature and humidity sensor elements for healthcare applications. In Proceedings of the 2014 37th International Spring Seminar on Electronics Technology, Dresden, Germany, 7–11 May 2014; pp. 407–411. [Google Scholar]
  18. Lavery, L.A.; Higgins, K.R.; Lanctot, D.R.; Constantinides, G.P.; Zamorano, R.G.; Athanasiou, K.A.; Armstrong, D.G.; Agrawal, C.M. Preventing diabetic foot ulcer recurrence in high-risk patients: Use of temperature monitoring as a self-assessment tool. Diabetes Care 2007, 30, 14–20. [Google Scholar] [CrossRef] [PubMed]
  19. Lavery, L.A.; Higgins, K.R.; Lanctot, D.R.; Constantinides, G.P.; Zamorano, R.G.; Armstrong, D.G.; Athanasiou, K.A.; Agrawal, C.M. Home monitoring of foot skin temperatures to prevent ulceration. Diabetes Care 2004, 27, 2642–2647. [Google Scholar] [CrossRef] [PubMed]
  20. Cherenack, K.; Zysset, C.; Kinkeldei, T.; Münzenrieder, N.; Tröster, G. Woven Electronic Fibers with Sensing and Display Functions for Smart Textiles. Adv. Mater. 2010, 22, 5178–5182. [Google Scholar] [CrossRef] [PubMed]
  21. Dias, T.K.; Rathnayake, A. Electronically Functional Yarns. Patent WO 2016038342 A1, 17 March 2016. [Google Scholar]
  22. Dias, T.; Hughes-Riley, T. Electronically Functional Yarns Transform Wearable Device Industry. R&D Magazine. 8 January 2017. Available online: https://www.rdmag.com/article/2017/06/electronically-functional-yarns-transform-wearable-device-industry (accessed on 9 September 2017).
  23. Lugoda, P.; Dias, T.; Morris, R. Electronic temperature sensing yarn. J. Multidiscip. Eng. Sci. Stud. 2015, 1, 100–103. [Google Scholar]
  24. Lugoda, P.; Dias, T.; Hughes-Riley, T.; Morris, R. Refinement of temperature sensing yarns. Proceedings 2018, 2, 123. [Google Scholar] [CrossRef]
  25. Dias, T.; Lugoda, P.; Cork, C.R. Microchip technology used in textile materials. In High-Performance Apparel, 1st ed.; McLoughlin, J., Sabir, T., Eds.; Woodhead Publishing Ltd.: Cambridge, UK, 2017. [Google Scholar]
  26. Hardy, D.A.; Anastasopoulos, I.; Nashed, M.N.; Oliveira, C.; Hughes-Riley, T.; Komolafe, A.; Tudor, J.; Torah, R.; Beeby, S.; Dias, T. An Automated Process for Inclusion of Package Dies and Circuitry within a Textile Yarn. In Proceedings of the Design, Test, Integration & Packaging of MEMS/MOEMS, Rome, Italy, 22–25 May 2018. [Google Scholar]
  27. Gould, P. Textiles gain intelligence. Mater. Today 2003, 6, 38–43. [Google Scholar] [CrossRef]
  28. Munro, B.J.; Campbell, T.E.; Wallace, G.G.; Steele, J.R. The intelligent knee sleeve: A wearable biofeedback device. Sens. Actuators B Chem. 2008, 131, 541–547. [Google Scholar] [CrossRef]
  29. Stuart, I.M. Capstan equation for strings with rigidity. Br. J. Appl. Phys. 1961, 12, 559. [Google Scholar] [CrossRef]
  30. ASTM International. Manual on the Use of Thermocouples in Temperature Measurement; ASTM International: West Conshohocken, PA, USA, 1993; p. 175. Available online: https://drive.google.com/file/d/0B7YMfVp35H91NTU0Y2QwZWYtYjA3Yy00NTJiLWJiYzEtZjQ3ZjljNjhhNWIy/view?hl=en (accessed on 3 March 2015).
  31. KRUSS. Laplace Pressure. 2018. Available online: https://www.kruss-scientific.com/services/education-theory/glossary/laplace-pressure/ (accessed on 23 February 2018).
  32. Psikuta, A.; Niedermann, R.; Rossi, R.M. Effect of ambient temperature and attachment method on surface temperature measurements. Int. J. Biometeorol. 2013, 58, 877–885. [Google Scholar] [CrossRef] [PubMed]
  33. Nardin, R.A.; Fogerson, P.M.; Nie, R.; Rutkove, S.B. Foot temperature in healthy individuals: Effects of ambient temperature and age. J. Am. Podiatr. Med. Assoc. 2010, 100, 258–264. [Google Scholar] [CrossRef] [PubMed]
  34. Reddy, P.N.; Cooper, G.; Weightman, A.; Hodson-Tole, E.; Reeves, N.D. Walking cadence affects rate of plantar foot temperature change but not final temperature in younger and older adults. Gait Posture 2017, 52, 272–279. [Google Scholar] [CrossRef] [PubMed]
  35. Power, E.J. Chapter 12—Yarn to Fabric: Knitting. In Textiles and Fashion; Sinclair, R., Ed.; Woodhead Publishing: Cambridge, UK, 2015; pp. 289–305. [Google Scholar]
  36. Raju, S.; Kathryn, H.; Neglen, P. Use of Compression Stockings in Chronic Venous Disease: Patient Compliance and Efficacy. Presented at the Nineteenth American Venous Forum Meeting, San Diego, CA, USA, 14–17 February 2007. [Google Scholar]
Figure 1. Annotated photographs of the three prototype armbands where (a) first armband prototype, (b) second armband prototype and (c) third armband prototype. The armbands were knitted with tubes to incorporate the temperature sensing yarns.
Fibers 06 00046 g001
Figure 2. Prototype temperature sensing glove. (a) The LabVIEW software user interface for the glove. (b) A photograph of the prototype glove.
Fibers 06 00046 g002
Figure 3. Positioning the temperature sensing yarn: (a) side, (b) palm, and (c) back of the hand.
Fibers 06 00046 g003
Figure 4. The shoes worn by the five volunteers for the trial. Different types of common footwear were used. The shoes worn by (a) Volunteer 1, (b) Volunteer 2, (c) Volunteer 3, (d) Volunteer 4 and (e) Volunteer 5.
Fibers 06 00046 g004
Figure 5. The measurements from the temperature sensing yarn, thermocouple, and infrared thermometer at different positions on the hand for the three different volunteers. The room temperature and difference between the thermocouple and yarn measurements are also presented. (Top) On the palm. (Middle) On the back of the hand. (Bottom) On the side of the hand.
Fibers 06 00046 g005
Figure 6. The change in the measurement error between the surface skin temperature and temperature sensing yarn when different weights were attached to the temperature sensing yarn, varying the contact pressure between the yarn and the hand.
Fibers 06 00046 g006
Figure 7. The change in the measurement error between the rigid surface (soldering iron shaft) temperature and the temperature sensing yarn when different weights were attached to the temperature sensing yarn, varying the contact pressure between the yarn and the shaft.
Fibers 06 00046 g007
Figure 8. Temperature measurements from the temperature sensing sock when the sock was not worn by a volunteer. Temperatures were recorded prior to testing on all the volunteers.
Fibers 06 00046 g008
Figure 9. Temperature measurements from the temperature sensing sock when the sock was worn by each of the volunteers.
Fibers 06 00046 g009
Figure 10. Temperature measurement from the temperature sensing sock when the sock was worn under a shoe for all of the volunteers.
Fibers 06 00046 g010
Figure 11. Temperature measurement from the temperature sensing sock when the sock worn under a shoe while walking for all the volunteers.
Fibers 06 00046 g011
Figure 12. Temperature captured when the temperature sensing sock was worn (presented in the 1st minute) and when an additional sock was worn on top of it (presented in the 2nd minute).
Fibers 06 00046 g012

