Body Size Shifts in Philippine Reef Fishes: Interfamilial Variation in Responses to Protection

Abstract
:1. Introduction
- The body size frequency distributions of all fishes censused will be significantly different between MPAs and fished reefs.
- The body size frequency distributions of fishes between individual MPAs and fished reefs will be significantly different.
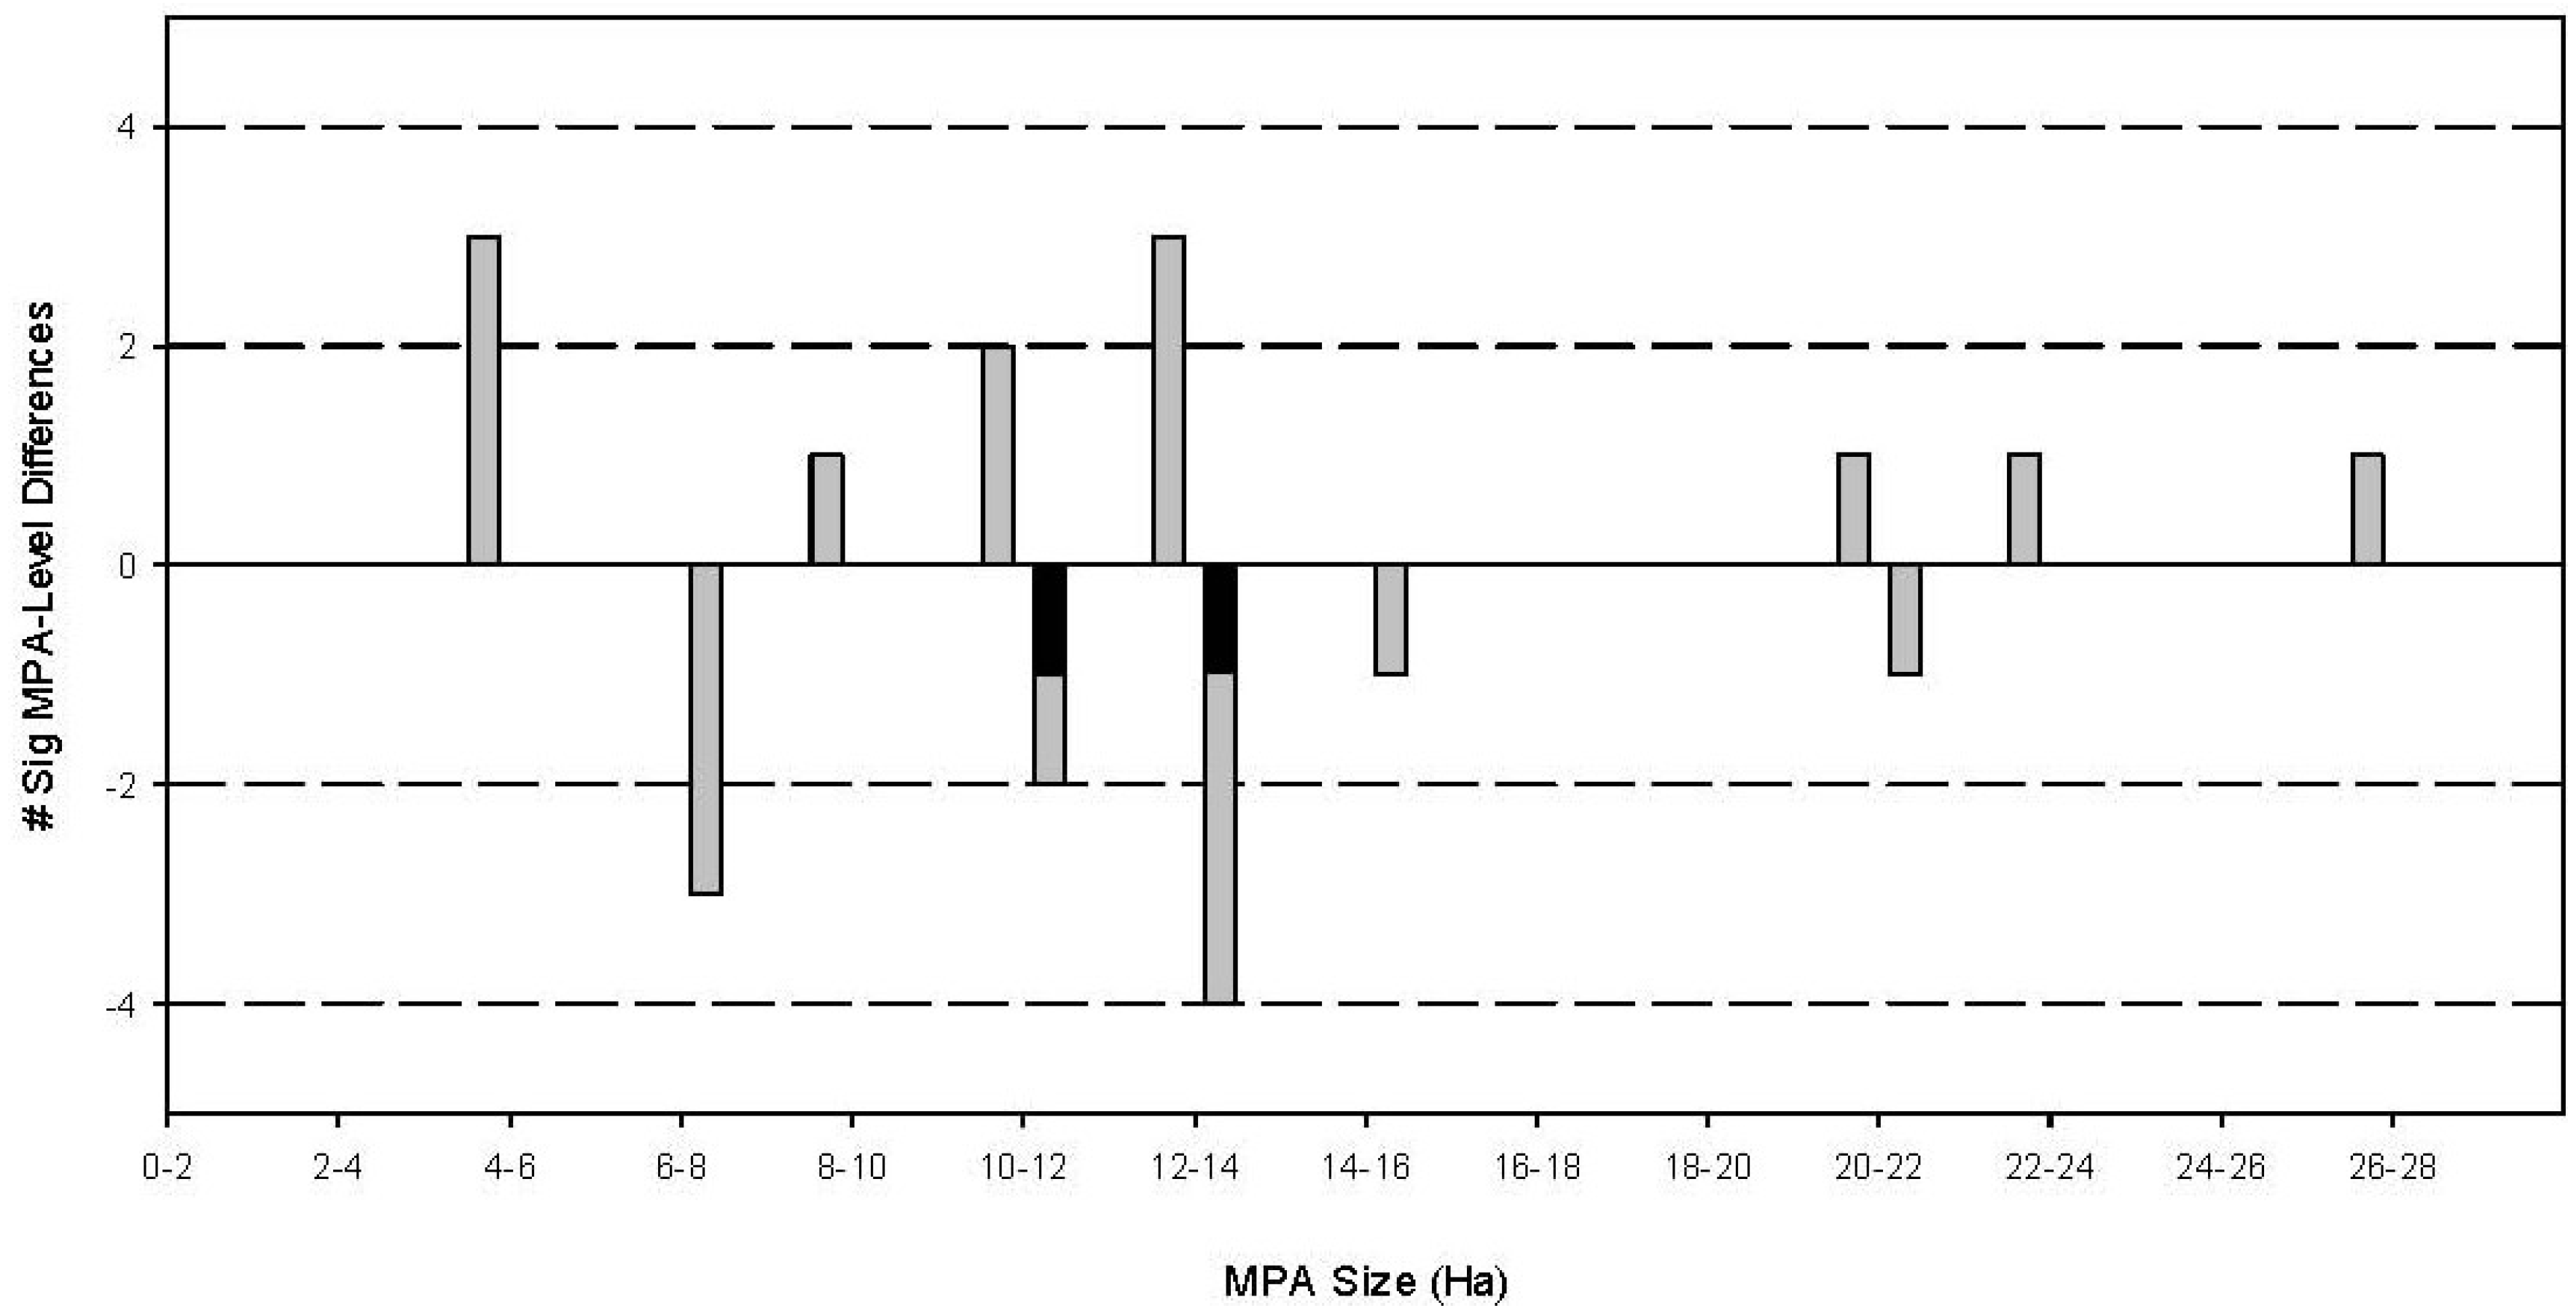
- The occurrence of significant differences in fish body size frequency distributions between MPAs and fished reefs will be associated with MPA size.
- The occurrence of significant differences in fish body size frequency distributions between MPAs and fished reefs will be associated with MPA age.
- Fish censused within individual fish families will demonstrate significantly different densities between MPAs and fished reefs.
- The body size frequency distributions of individual reef fish families will be significantly different between individual MPAs and fished reefs.
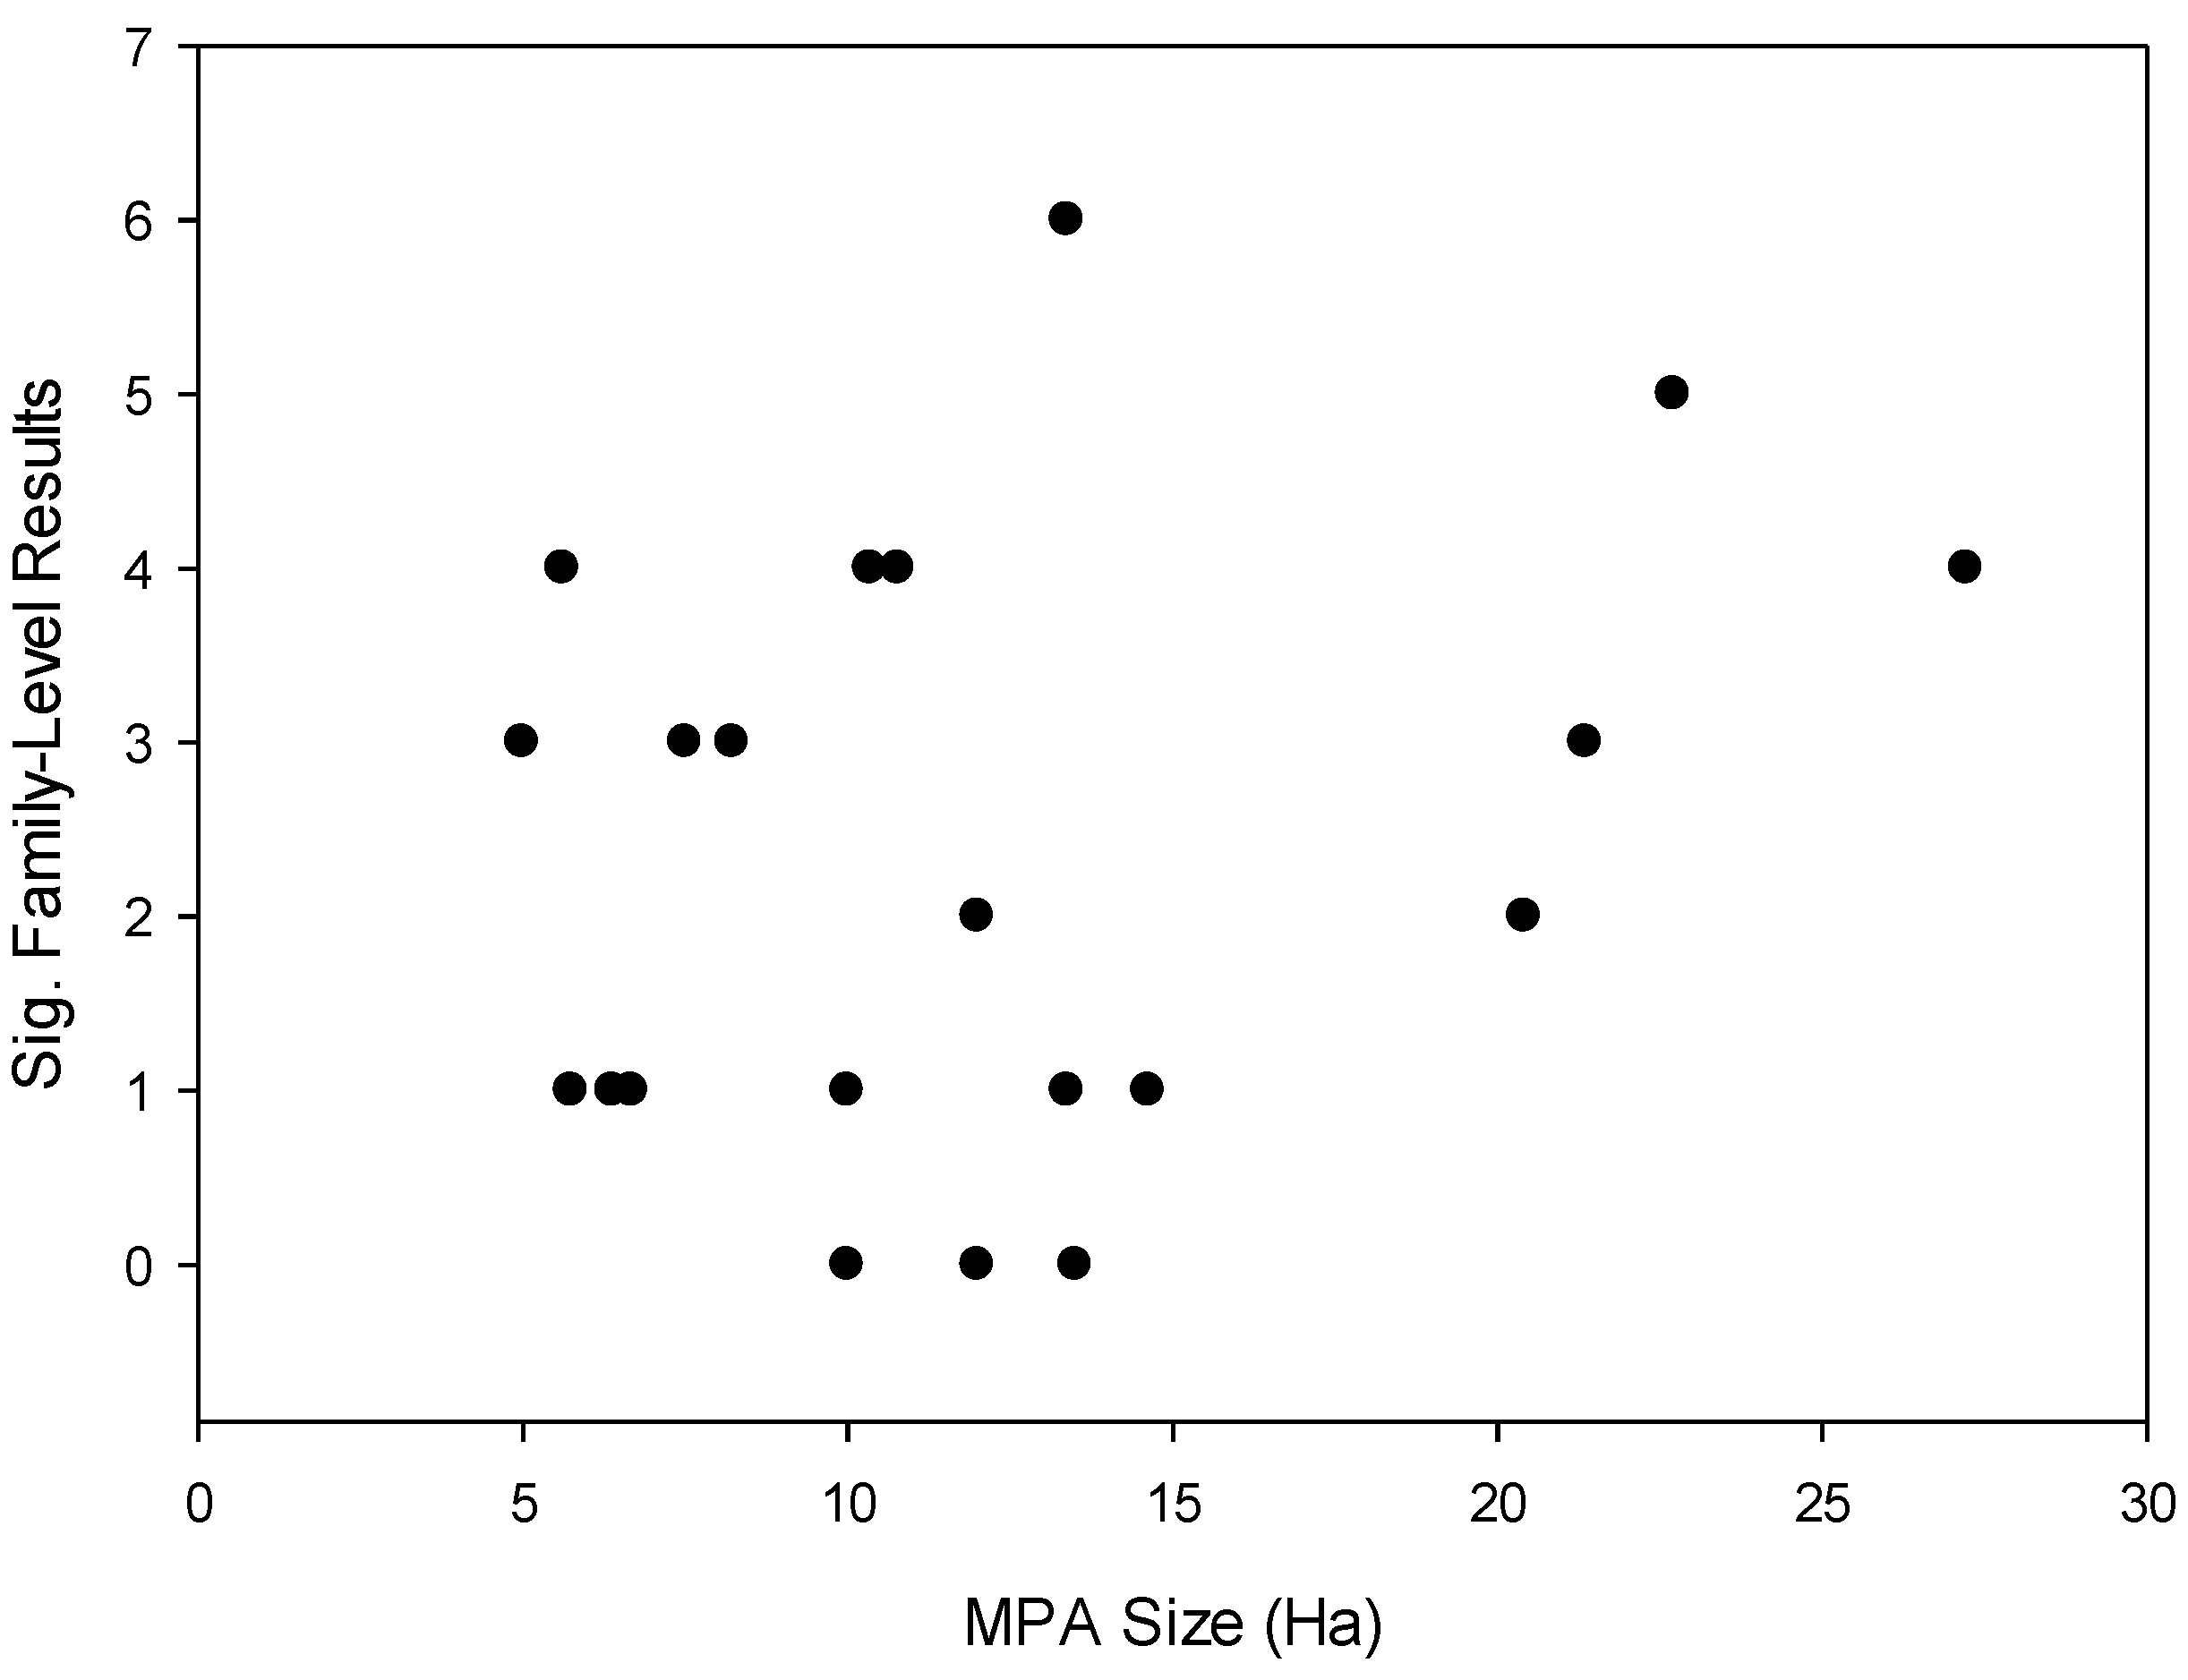
- The size of MPAs will be correlated with the number of fish families demonstrating significant differences in body size frequency distribution between MPAs and fished reefs.
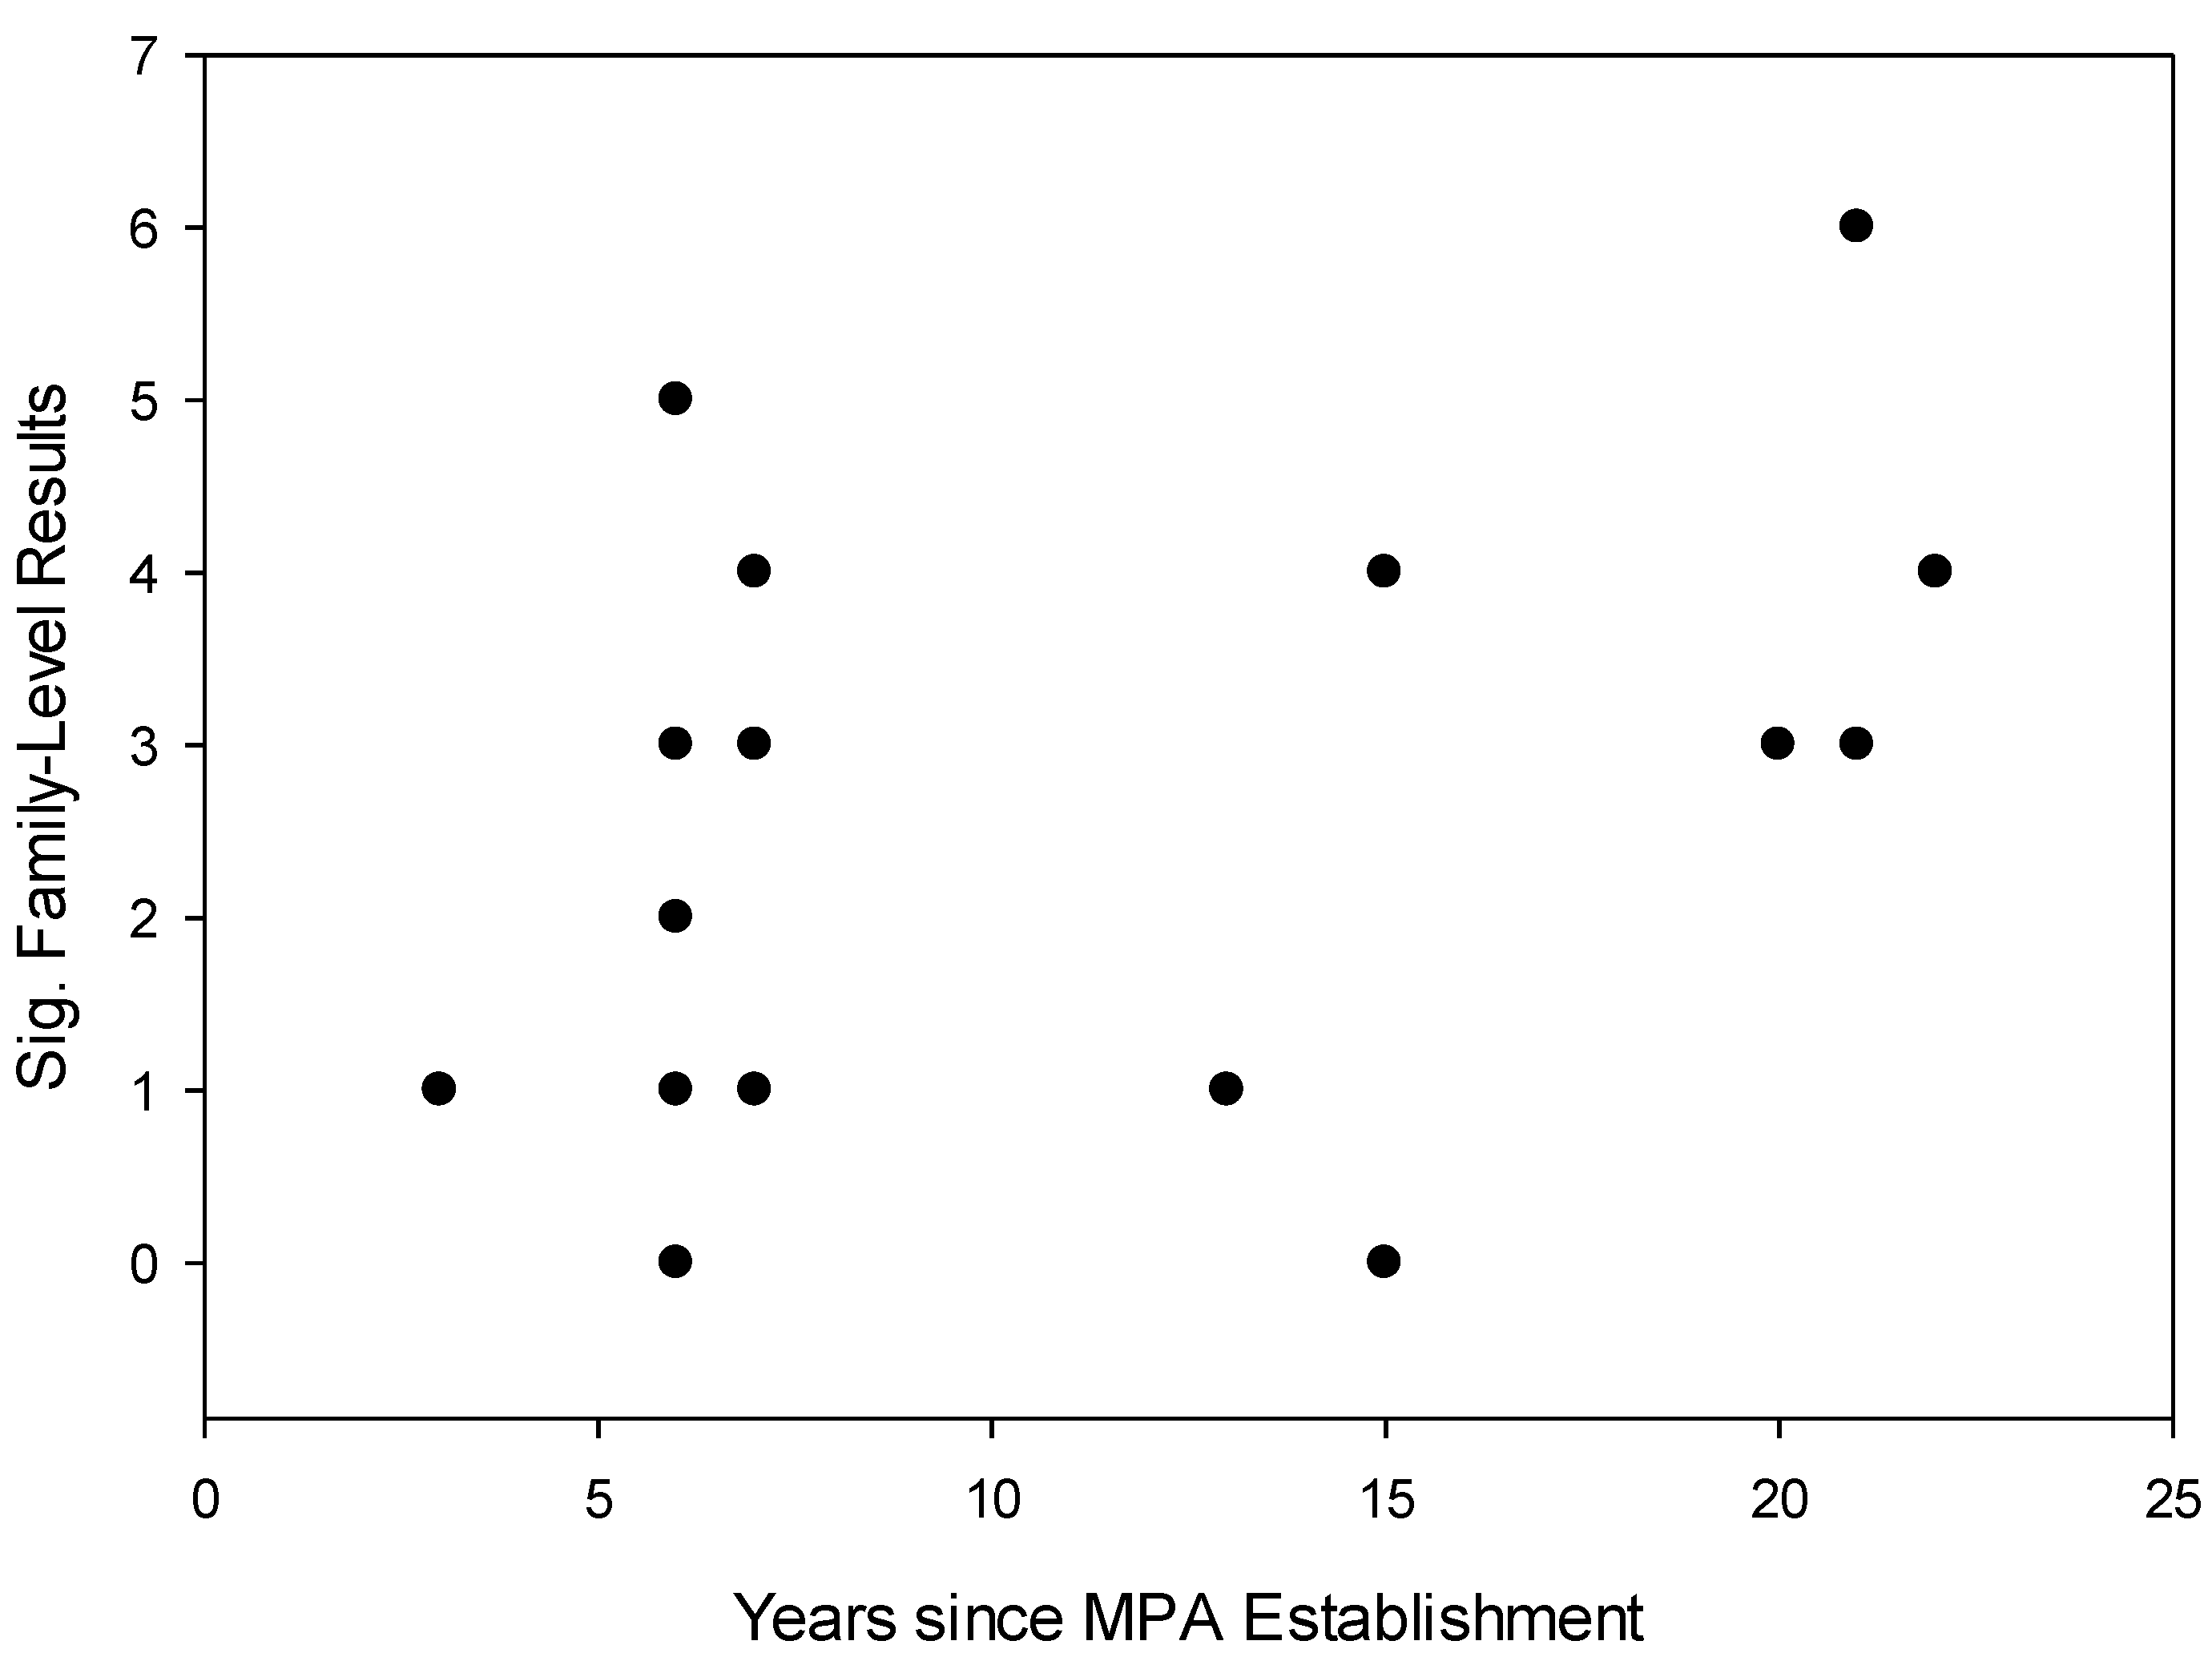
- The age of MPAs will be correlated with the number of fish families demonstrating significant differences in body size frequency distribution between MPAs and fished reefs.
2. Experimental Section
2.1. Overall Effects of MPA Protection

| Taxon | Common Name |
|---|---|
| Acanthuridae | Surgeonfish, Tangs |
| Balistidae | Triggerfish |
| Bumphead | Bumphead Parrotfish |
| Caesionidae | Fusiliers |
| Carangidae | Jacks |
| Chaetodontidae | Butterfly Fish |
| Haemulidae | Grunts |
| Kyphosidae | Chubs, Rudderfish |
| Labridae | Wrasses |
| Lethrinidae | Emperor Breams |
| Lutjanidae | Snappers |
| Mullidae | Goatfishes |
| Napoleon | Humphead Wrasses |
| Nemipteridae | Threadfin Breams |
| Pomacanthidae | Angelfish |
| Pomacentridae | Damselfish, Clownfish |
| Scaridae | Parrotfish |
| Serranidae | Groupers, Basses, Basslets |
| Epinephelinae | Serranid Sub-family |
| Anthiinae | Serranid Sub-family |
| Siganidae | Rabbitfish |
| Zanclidae | Moorish Idol |
2.2. Effects of Individual MPAs
2.3. Effects of Protection on Fish Families across MPAs
2.4. Effects on Individual Fish Families
3. Results and Discussion
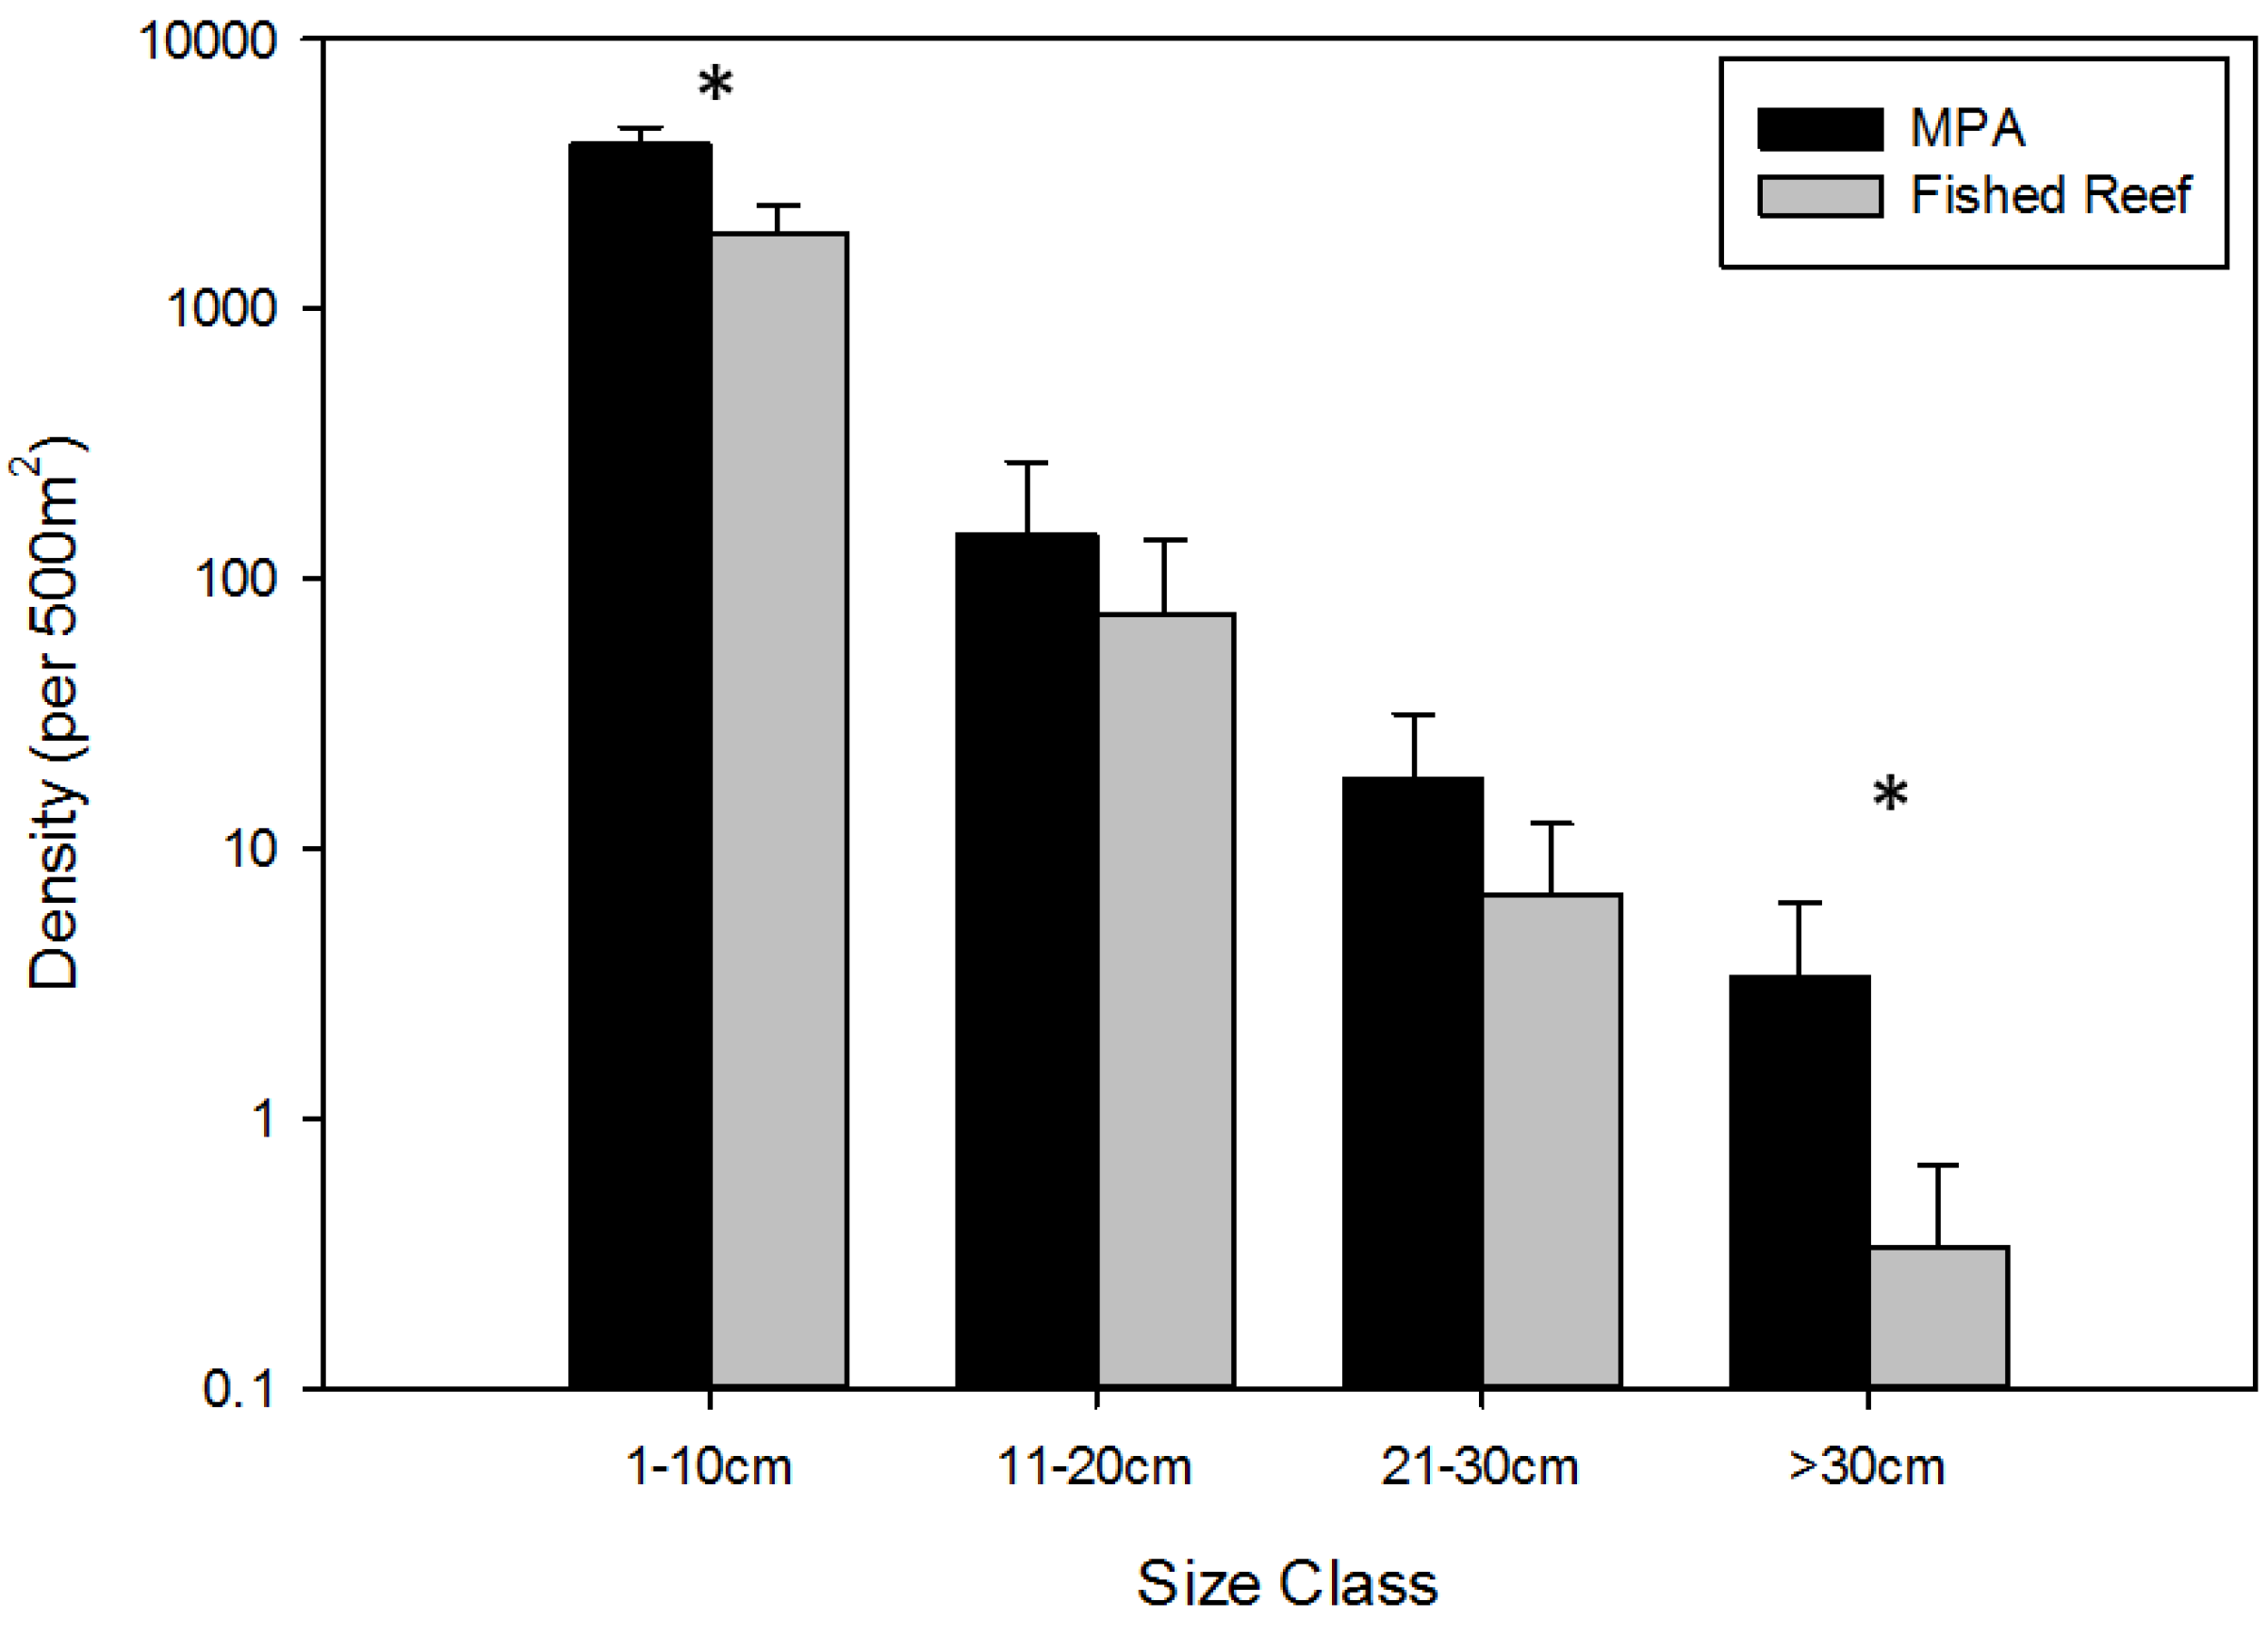
3.1. Overall Effects of MPA Protection
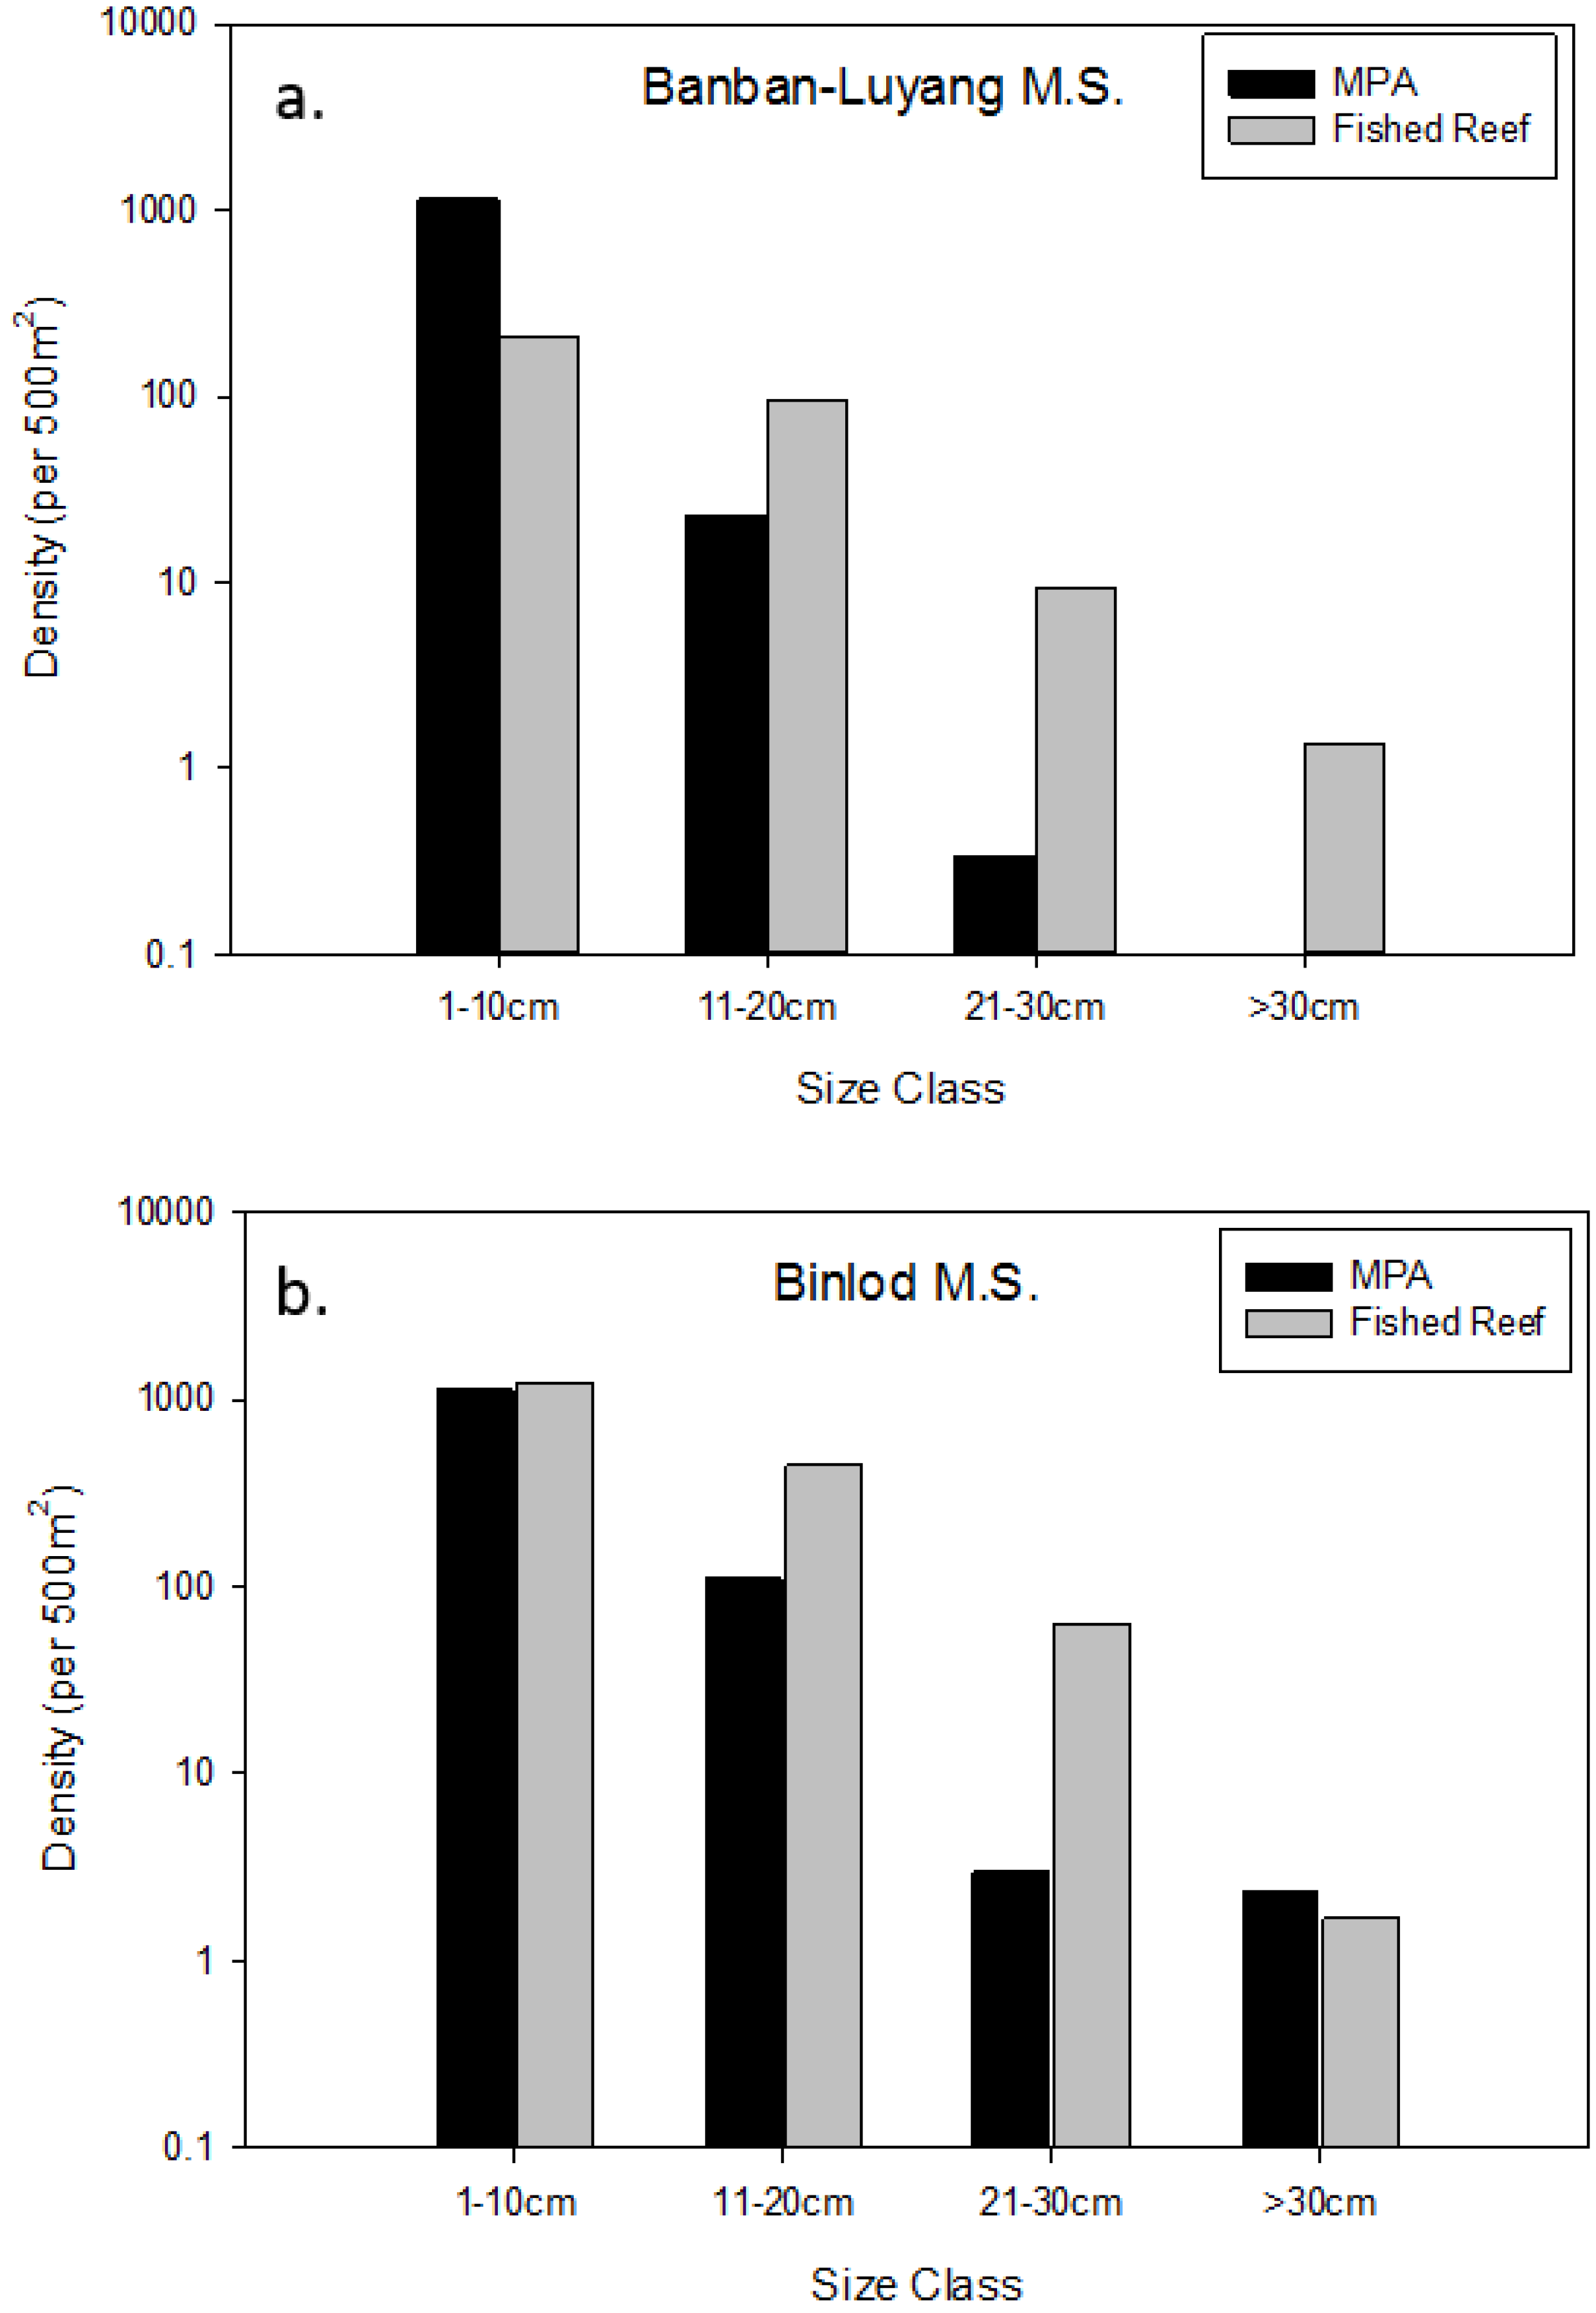
3.2. Effects of Individual MPAs
| Marine Protected Area (Associated Province) | Year Established | Size (ha) | Dα | D | Significance (D > Dα) |
|---|---|---|---|---|---|
| Tulapos (Siquijor) | 1987 | 27.22 | 0.0416 | 0.2489 | YES |
| Taculing-Cangmalalag (Siquijor) | 1988 | 13.38 | 0.0840 | 0.1964 | YES |
| Olang (Siquijor) | 1988 | 21.36 | 0.0406 | 0.0680 | YES |
| Tobod (Siquijor) | 1989 | 7.5 | 0.0329 | 0.0096 | NO |
| Caticugan (Siquijor) | 1994 | 13.51 | 0.0511 | 0.0907 | YES |
| Madridejos (Cebu) | 1994 | 10.78 | 0.0474 | 0.0947 | YES |
| Sta Filomena (Cebu) | 1994 | 5.62 | 0.0389 | 0.0391 | YES |
| Nonoc (Siquijor) | 1996 | 5.75 | 0.0417 | 0.1327 | YES |
| Poblacion Alcoy (Cebu) | 2002 | 6.38 | 0.0492 | 0.0102 | NO |
| Legaspi (Cebu) | 2002 | 10.35 | 0.0578 | 0.1916 | YES |
| Casay Shoal (Cebu) | 2002 | 5 | 0.0345 | 0.0636 | YES |
| Sandugan (Siquijor) | 2003 | 13.38 | 0.0413 | 0.0879 | YES |
| Lower-Cabangcalan (Siquijor) | 2003 | 8.23 | 0.0493 | 0.1021 | YES |
| Talayong (Siquijor) | 2003 | 6.68 | 0.0425 | 0.0133 | NO |
| Bogo (Siquijor) | 2003 | 10 | 0.0503 | 0.0238 | NO |
| Candaping B (Siquijor) | 2003 | 20.42 | 0.0529 | 0.0210 | NO |
| Minalulan (Siquijor) | 2003 | 14.63 | 0.1630 | 0.0511 | NO |
| Daang-Lungsod (Cebu) | 2003 | 22.71 | 0.0272 | 0.1018 | YES |
| Binlod (Cebu) | 2003 | 12 | 0.0507 | 0.1996 | YES * |
| Bogo (Cebu) | 2003 | 12 | 0.0468 | 0.0216 | NO |
| Bulasa (Cebu) | 2003 | 12 | 0.0484 | 0.0427 | NO |
| Guiwanon (Cebu) | 2003 | 12 | 0.0740 | 0.0035 | NO |
| Banban-Luyang (Siquijor) | 2006 | 10 | 0.0494 | 0.3175 | YES * |


3.3. Effects of Protection on Fish Families across MPAs
| Family | 1–10 cm | 11–20 cm | 21–30 cm | >30 cm | ||||||||
|---|---|---|---|---|---|---|---|---|---|---|---|---|
| N | U | p | N | U | p | N | U | p | N | U | p | |
| Lutjanidae | 46 | 151 | 0.006 | 46 | 156.5 | 0.014 | 46 | 178 | 0.038 | 46 | 213.5 | 0.09 |
| Haemulidae | 46 | 212 | 0.211 | 46 | 190 | 0.076 | 46 | 181 | 0.014 | 46 | 218.5 | 0.039 |
| Scaridae | 46 | 240.5 | 0.598 | 46 | 160 | 0.022 | 46 | 178 | 0.057 | 46 | 147.5 | 0.008 |
| Acanthuridae | 46 | 236.5 | 0.538 | 46 | 162.5 | 0.025 | 46 | 172 | 0.031 | 46 | 161 | 0.001 |
| Epinephelinae | 46 | 217 | 0.294 | 46 | 181.5 | 0.62 | 46 | 217.5 | 0.193 | 46 | 187 | 0.014 |
3.4. Effects on Individual Fish Families
4. Conclusions
Acknowledgments
Author Contributions
Conflicts of Interest
References
- Dayton, P.K.; Thrush, S.F.; Agardy, M.T.; Hofman, R.J. Environmental effects of marine fishing. Aquat. Conserv. Mar. Freshw. Ecosyst. 1995, 5, 205–232. [Google Scholar] [CrossRef]
- Botsford, L.W.; Castilla, J.C.; Peterson, C.H. The management of fisheries and marine ecosystems. Science 1997, 277, 509–515. [Google Scholar] [CrossRef]
- Lauck, T.; Clark, C.W.; Mangel, M.; Munro, G.R. Implementing the precautionary principle in fisheries management through marine reserves. Ecol. Appl. 1998, 8, 72–78. [Google Scholar]
- Pauly, D.; Christensen, V.; Dalsgaard, J.; Froese, R.; Torres, F., Jr. Fishing down marine food webs. Science 1998, 279, 860–863. [Google Scholar] [CrossRef]
- Hodgson, G. A global assessment of human effects on coral reefs. Mar. Pollut. Bull. 1999, 38, 2–8. [Google Scholar]
- Gaines, S.D.; White, C.; Carr, M.H.; Palumbi, S.R. Designing marine reserve networks for both conservation and fisheries management. Proc. Natl. Acad. Sci. USA 2010, 107, 18286–18293. [Google Scholar]
- Pomeroy, R.; Parks, J.; Pollnac, R.; Campson, T.; Genio, E.; Marlessy, C.; Holle, E.; Pido, M.; Nissapa, A.; Boromthanarat, S.; et al. Fish wars: Conflict and collaboration in fisheries management in southeast Asia. Mar. Policy 2007, 31, 645–656. [Google Scholar] [CrossRef]
- Gell, F.R.; Roberts, C.M. Benefits beyond boundaries: The fishery effects of marine reserves. Trends Ecol. Evol. 2003, 18, 448–455. [Google Scholar] [CrossRef]
- Christie, P.; White, A.T. Best practices for improved governance of coral reef marine protected areas. Coral Reefs 2007, 26, 1047–1056. [Google Scholar] [CrossRef]
- Roberts, C.M.; Bohnsack, J.A.; Gell, F.; Hawkins, J.P.; Goodridge, R. Effects of marine reserves on adjacent fisheries. Science 2001, 294, 1920–1923. [Google Scholar] [CrossRef]
- Jennings, S. The role of marine protected areas in environmental management. ICES J. Mar. Sci. 2009, 66, 16–21. [Google Scholar] [CrossRef]
- Russ, G.R. Marine reserves as reef fisheries management tools: Yet another review. In Coral Reef Fishes. Dynamics and Diversity in a Complex Ecosystem; Academic Press: New York, NY, USA, 2002; pp. 421–444. [Google Scholar]
- Sale, P.F.; Cowen, R.K.; Danilowicz, B.S.; Jones, G.P.; Kritzer, J.P.; Lindeman, K.C.; Planes, S.; Polunin, N.V.C.; Russ, G.R.; Sadovy, Y.J.; et al. Critical science gaps impede use of no-take fishery reserves. Trends Ecol. Evol. 2005, 20, 74–80. [Google Scholar] [CrossRef]
- Babcock, R.C.; Shears, N.T.; Alcala, A.C.; Barrett, N.S.; Edgar, G.J.; Lafferty, K.D.; McClanahan, T.R.; Russ, G.R. Decadal trends in marine reserves reveal differential rates of change in direct and indirect effects. Proc. Natl. Acad. Sci. USA 2010, 107, 18256–18261. [Google Scholar] [CrossRef]
- Halpern, B.S.; Lester, S.E.; Kellner, J.B. Spillover from marine reserves and the replenishment of fished stocks. Environ. Conserv. 2010, 36, 268–276. [Google Scholar] [CrossRef]
- Lester, S.E.; Halpern, B.S.; Grorud-Colvert, K.; Lubchenco, J.; Ruttenberg, B.I.; Gaines, S.D.; Airamé, S.; Warner, R.R. Biological effects within no-take marine reserves: A global synthesis. Mar. Ecol. Prog. Ser. 2009, 384, 33–46. [Google Scholar] [CrossRef]
- White, A.; Deguit, E.; Jatular, W.; Eisma-Osorio, L. Integrated coastal management in Philippine local governance: Evolution and benefits. Coast. Manag. 2006, 34, 287–302. [Google Scholar] [CrossRef]
- Reznick, D.A.; Bryga, H.; Endler, J.A. Experimentally induced life-history evolution in a natural population. Nature 1990, 346, 357–359. [Google Scholar] [CrossRef]
- De Roos, A.M.; Boukal, D.S.; Persson, L. Evolutionary regime shifts in age and size at maturation of exploited fish stocks. Proc. R. Soc. B Biol. Sci. 2006, 273, 1873–1880. [Google Scholar] [CrossRef]
- Jørgensen, C.; Enberg, K.; Dunlop, E.S.; Arlinghaus, R.; David, S.; Brander, K.; Ernande, B.; Gœrdmark, A.; Johnston, F. Managing evolving fish stocks. Science 2007, 318, 1247–1248. [Google Scholar] [CrossRef]
- Conover, D.O.; Munch, S.B. Sustaining fisheries yields over evolutionary time scales. Science 2002, 297, 94–96. [Google Scholar]
- Myers, R.A.; Hoenig, J.M. Direct estimates of gear selectivity from multiple tagging experiments. Can. J. Fish. Aquat. Sci. 1997, 54, 1–9. [Google Scholar]
- Birkeland, C.; Dayton, P.K. The importance in fishery management of leaving the big ones. Trends Ecol. Evol. 2005, 20, 356–358. [Google Scholar] [CrossRef]
- Fukuwaka, M.A.; Morita, K. Increase in maturation size after the closure of a high seas gillnet fishery on hatchery-reared chum salmon Oncorhynchus keta. Evol. Appl. 2008, 1, 376–387. [Google Scholar] [CrossRef]
- Law, R. Fishing, selection, and phenotypic evolution. ICES J. Mar. Sci. 2000, 57, 659–669. [Google Scholar] [CrossRef]
- Law, R. Fisheries-induced evolution: Present status and future directions. Mar. Ecol. Prog. Ser. 2007, 335, 271–277. [Google Scholar] [CrossRef]
- Swain, D.P.; Sinclair, A.F.; Hanson, M.J. Evolutionary response to size-selective mortality in an exploited fish population. Proc. R. Soc. B Biol. Sci. 2007, 274, 1015–1022. [Google Scholar] [CrossRef]
- Heino, M.; Dieckmann, U. Fisheries-induced evolution. In Encyclopedia of Life Sciences (ELS); John Wiley & Sons: Chincester, West Sussex, UK, 2009. [Google Scholar]
- Heino, M.; Godø, O.R. Fisheries-induced selection pressures in the context of sustainable fisheries. Bull. Mar. Sci. 2002, 70, 639–656. [Google Scholar]
- Grift, R.E.; Rijnsdorp, A.D.; Barot, S.; Heino, M.; Dieckmann, U. Fisheries-induced trends in reaction norms for maturation in North Sea plaice. Mar. Ecol. Prog. Ser. 2003, 257, 247–257. [Google Scholar] [CrossRef]
- Taborsky, B.; Dieckmann, U.; Heino, M. Unexpected discontinuities in life-history evolution under size-dependent mortality. Proc. R. Soc. B Biol. Sci. 2003, 270, 713–721. [Google Scholar] [CrossRef]
- Ernande, B.; Dieckmann, U.; Heino, M. Adaptive changes in harvested populations: Plasticity and evolution of age and size at maturation. Proc. R. Soc. B Biol. Sci. 2004, 271, 415–423. [Google Scholar] [CrossRef]
- Trippel, E.A. Age at maturity as a stress indicator. BioScience 1995, 45, 759–771. [Google Scholar] [CrossRef]
- Bobko, S.J.; Berkeley, S.A. Maturity, ovarian cycle, fecundity, and age-specific parturition off black rockfish (Sebastes melanops). Fish Bull. 2003, 102, 418–429. [Google Scholar]
- Berkeley, S.A.; Chapman, C.; Sogard, S.M. Maternal age as a determinant of larval growth and survival in a marine fish, Sebastes melanops. Ecology 2004, 85, 1258–1264. [Google Scholar] [CrossRef]
- Haugen, T.O.; Vøllestad, L.A. A century of life-history evolution in grayling. Genetica 2001, 112–113, 475–491. [Google Scholar] [CrossRef]
- Walsh, M.R.; Munch, S.B.; Chiba, S.; Conover, D.O. Maladaptive changes in multiple traits caused by fishing: Impediments to population recovery. Ecol. Lett. 2006, 9, 142–148. [Google Scholar] [CrossRef]
- Olsen, E.M.; Heino, M.; Lilly, G.R.; Morgan, M.J.; Brattey, J.; Ernande, B.; Dieckmann, U. Maturation trends indicative of rapid evolution preceded the collapse of northern cod. Nature 2004, 428, 932–935. [Google Scholar] [CrossRef]
- Olsen, E.M.; Lilly, G.R.; Heino, M.; Morgan, M.J.; Brattey, J.; Dieckmann, U. Assessing changes in age and size at maturation in collapsing populations of Atlantic cod (Gadus morhua). Can. J. Fish. Aquat. Sci. 2005, 62, 811–823. [Google Scholar] [CrossRef]
- Stokes, K.; Law, R. Fishing as an evolutionary force. Mar. Ecol. Prog. Ser. 2000, 208, 307–309. [Google Scholar]
- Stockwell, C.A.; Hendry, A.P.; Kinnison, M.T. Contemporary evolution meets conservation biology. Evolution 2003, 18, 94–101. [Google Scholar]
- Trexler, J.C.; Travis, J. Can marine protected areas restore and restore stock attributes of reef fishes? Bull. Mar. Sci. 2000, 66, 853–873. [Google Scholar]
- Baskett, M.L.; Levin, S.A.; Gaines, S.D.; Dushoff, J. Marine reserve design and the evolution of size at maturation in harvested fish. Ecol. Appl. 2005, 15, 882–901. [Google Scholar] [CrossRef]
- Miethe, T.; Dytham, C.; Dieckmann, U.; Pitchford, J.W. Marine reserves and the evolutionary effects of fishing on size at maturation. ICES J. Mar. Sci. 2009, 67, 412–425. [Google Scholar]
- Dunlop, E.S.; Baskett, M.L.; Heino, M.; Dieckmann, U. Propensity of marine reserves to reduce the evolutionary effects of fishing in a migratory species. Evol. Appl. 2009, 3, 371–393. [Google Scholar]
- Conover, D.O.; Munch, S.B.; Arnott, S.A. Reversal of evolutionary downsizing caused by selective harvest of large fish. Proc. R. Soc. B Biol. Sci. 2009, 276, 2015–2020. [Google Scholar] [CrossRef]
- English, S.A.; Baker, V.J.; Wilkinson, C.R. Survey Manual for Tropical Marine Resources; Townsville, Qld.: Australian Institute of Marine Science, Townsville, Australian, 1994. [Google Scholar]
- Zar, J.H. Biostatistical Analysis; Pearson Prentice Hall: Upper Saddle River, NJ, USA, 2010. [Google Scholar]
- Veron, J.E.N.; Devantier, L.M.; Turak, E.; Green, A.L.; Kininmonth, S.; Stafford-Smith, M.; Peterson, N. Delineating the coral triangle. Galaxea. J. Coral Reef Stud. 2009, 11, 91–100. [Google Scholar]
- Goreau, T.J. Coral reef and fisheries habitat restoration in the Coral Triangle: The key to sustainable reef management. In Proceedings of the Coral Reef Management Symposium on the Coral Triangle Area, Manado, Sulawesi, Indonesia, 11–16 May 2010; pp. 244–253.
- Paddack, M.J.; Estes, J.A. Kelp forest fish populations in marine reserves and adjacent exploited areas of central California. Ecol. Appl. 2000, 10, 855–870. [Google Scholar] [CrossRef]
- Russ, G.R.; Alcala, A.C. Natural fishing experiments in marine reserves 1983–1993: Roles of life history and fishing intensity in family responses. Coral Reefs 1998, 4, 399–416. [Google Scholar] [CrossRef]
- Jennings, S. Patterns and prediction of population recovery in marine reserves. Rev. Fish Biol. Fish. 2001, 10, 209–231. [Google Scholar] [CrossRef]
- Halpern, B.S. The impact of marine reserves: Do reserves work and does reserve size matter? Ecol. Appl. 2003, 13, 117–137. [Google Scholar] [CrossRef]
- Kritzer, J.P. Effects of noncompliance on the success of alternative designs of marine protected-area networks for conservation and fisheries management. Conserv. Biol. 2004, 18, 1021–1031. [Google Scholar] [CrossRef]
- Bendijo, R.G.; Alcala, A.; Dolumbal, E.R.Z.; Amor, A.K. Coastal Environment Profile of Siquijor, Philippines; Siquijor Coastal Resource Enhancement Project: Siquijor, Philippines, 2004; p. 104. [Google Scholar]
- Maypa, A.P.; Apistar, D.; Canares, E.; Diaz, R.; Delizo, D.; Sabonsolin, A.; Raymundo, D. Marine Protected Areas in Siquijor Province: 2005–2008; Municipality Report No. 15SIQ08; The Coastal Conservation and Education Foundation, Inc. and the Local Governance for Coastal Management Project (LGCMP): Cebu, Philippines, 2009. [Google Scholar]
- Russ, G.R.; Alcala, A.C. Do marine reserves export adult fish biomass? Evidence from Apo Island, central Philippines. Mar. Ecol. Prog. Ser. 1996, 132, 1–9. [Google Scholar] [CrossRef]
- Russ, G.R.; Alcala, A.C.; Maypa, A.P. Spillover from marine reserves: The case of Naso vlamingii at Apo Island, the Philippines. Mar. Ecol. Prog. Ser. 2003, 264, 15–20. [Google Scholar] [CrossRef]
- Russ, G.R.; Alacala, A.C.; Maypa, A.P.; Calumpong, H.P.; White, A.T. Marine reserve benefits local fisheries. Ecol. Appl. 2004, 14, 597–606. [Google Scholar] [CrossRef]
- Abesamis, R.A.; Russ, G.R. Density-dependent spillover from a marine reserve: Long-term evidence. Ecol. Appl. 2005, 15, 1798–1812. [Google Scholar] [CrossRef]
- Maypa, A.P. Mechanisms by Which Marine Protected Areas Enhance Fisheries Benefits in Neighboring Areas. Ph.D. Thesis, University of Hawai’i at Mānoa, Honolulu, HI, USA, 2012; p. 147. [Google Scholar]
- Roberts, C.M.; Andelman, S.; Branch, G.; Bustamante, R.H.; Castilla, J.C.; Dugan, J.; Halpern, B.S.; Lafferty, K.D.; Leslie, H.; Lubchenco, J.; et al. Ecological criteria for evaluating candidate sites for marine reserves. Ecol. Appl. 2003, 13, S199–S214. [Google Scholar] [CrossRef]
- Allison, G.W.; Lubchenco, J.; Carr, M.H. Marine reserves are necessary but not sufficient for marine conservation. Ecol. Appl. 1998, 8, 79–92. [Google Scholar]
- Jameson, S.C.; Tupper, M.H.; Ridley, J.M. The three screen doors: Can marine ‘protected’ areas be effective? Mar. Pollut. Bull. 2002, 44, 1177–1183. [Google Scholar] [CrossRef]
- Boersma, P.D.; Parrish, J.K. Limiting Abuse: Marine protected areas, a limited solution. Ecol. Econ. 1999, 31, 287–304. [Google Scholar] [CrossRef]
© 2014 by the authors; licensee MDPI, Basel, Switzerland. This article is an open access article distributed under the terms and conditions of the Creative Commons Attribution license (http://creativecommons.org/licenses/by/3.0/).
Share and Cite
Fidler, R.Y.; Maypa, A.; Apistar, D.; White, A.; Turingan, R.G. Body Size Shifts in Philippine Reef Fishes: Interfamilial Variation in Responses to Protection. Biology 2014, 3, 264-280. https://doi.org/10.3390/biology3020264
Fidler RY, Maypa A, Apistar D, White A, Turingan RG. Body Size Shifts in Philippine Reef Fishes: Interfamilial Variation in Responses to Protection. Biology. 2014; 3(2):264-280. https://doi.org/10.3390/biology3020264
Chicago/Turabian StyleFidler, Robert Y., Aileen Maypa, Dean Apistar, Alan White, and Ralph G. Turingan. 2014. "Body Size Shifts in Philippine Reef Fishes: Interfamilial Variation in Responses to Protection" Biology 3, no. 2: 264-280. https://doi.org/10.3390/biology3020264