Myogenic Differential Methylation: Diverse Associations with Chromatin Structure

Abstract
:
1. Introduction
2. Experimental Section
2.1. Determination of DMRs
2.2. Chromatin and Expression Data Sources
3. Results and Discussion
3.1. Genome-Wide Analysis of Associations between Myogenic Differential Methylation, Chromatin States, and Transcription Start Sites
3.1.1. Determination of Myogenic DMRs
3.1.2. Association of Transcription with Myogenic Hypomethylation vs. Hypermethylation
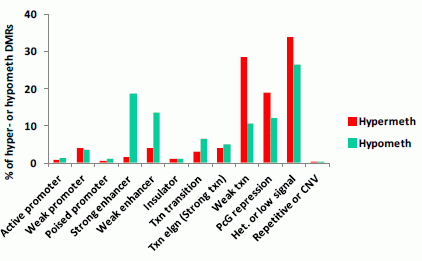
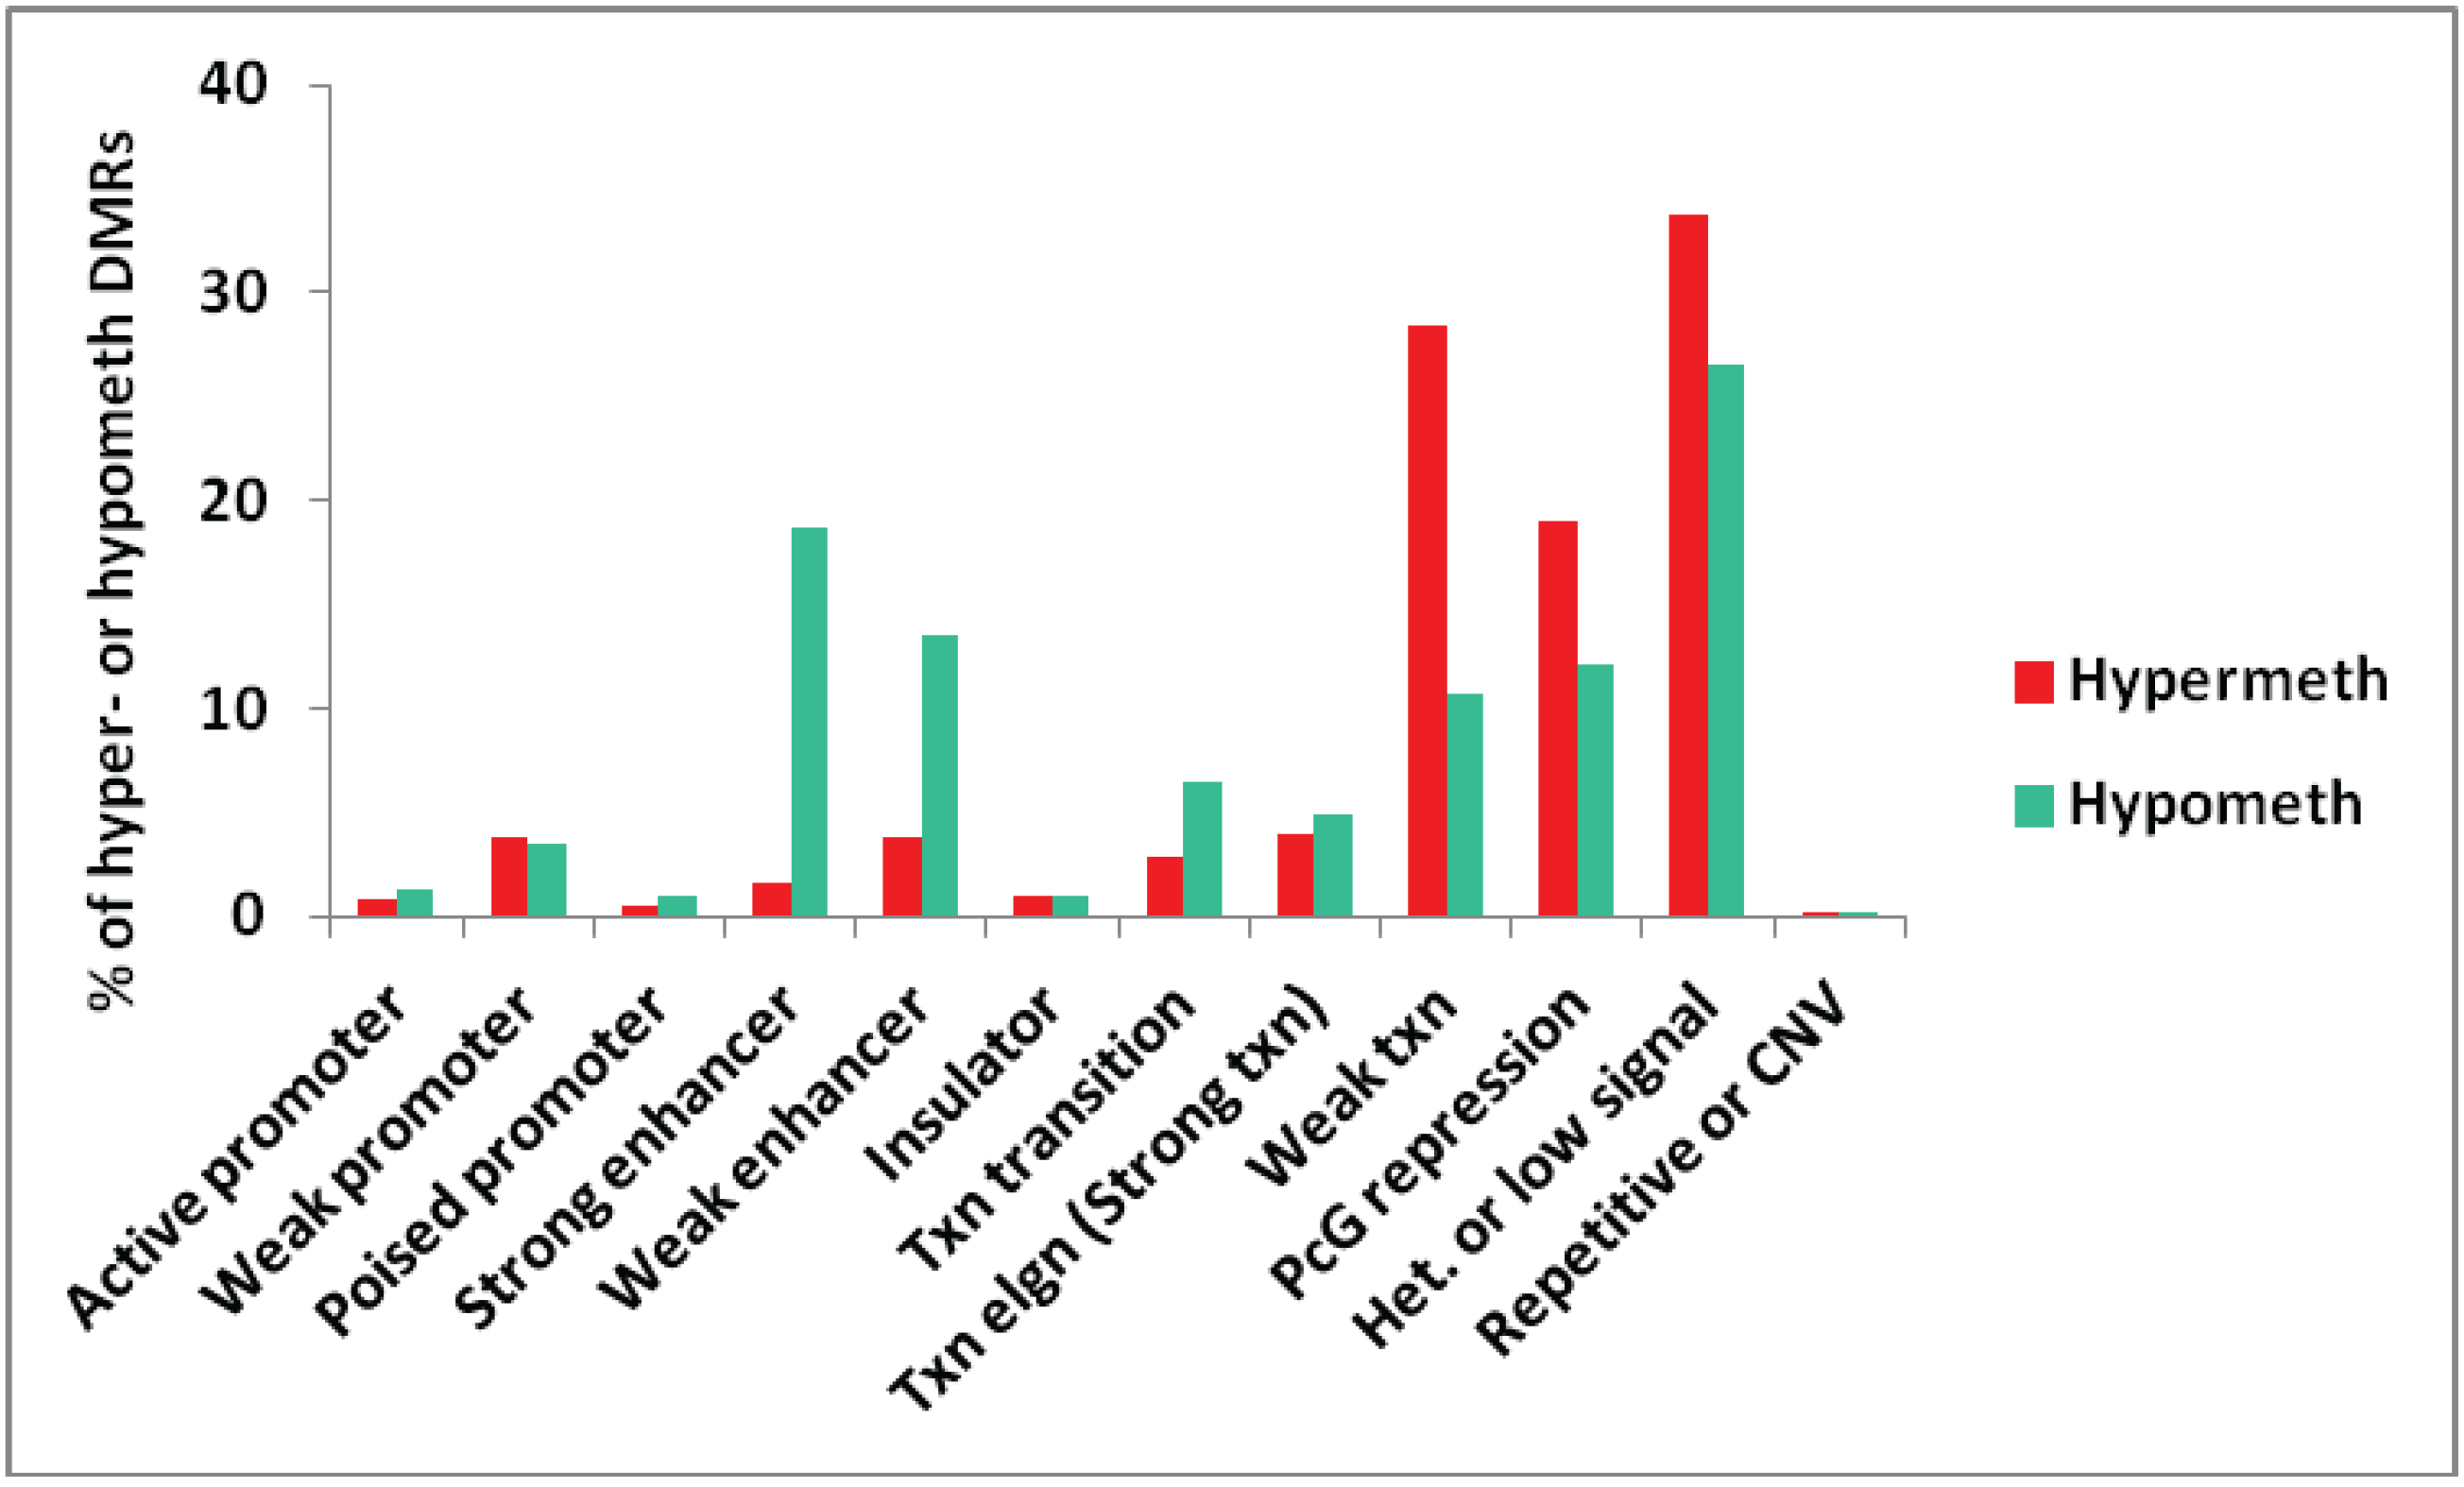
3.1.3. Association of Myogenic Hypomethylation vs. Hypermethylation with Chromatin Status


| Location of Myogenic Differential Methylation | MbMt DMR | Muscle DMR | Gene Product | Previous Relationship to Muscle? | Txn in Mb | Type of Chromatin at the Mb DMR | Figure (Region #) |
|---|---|---|---|---|---|---|---|
| Hypermethylated DMRs | |||||||
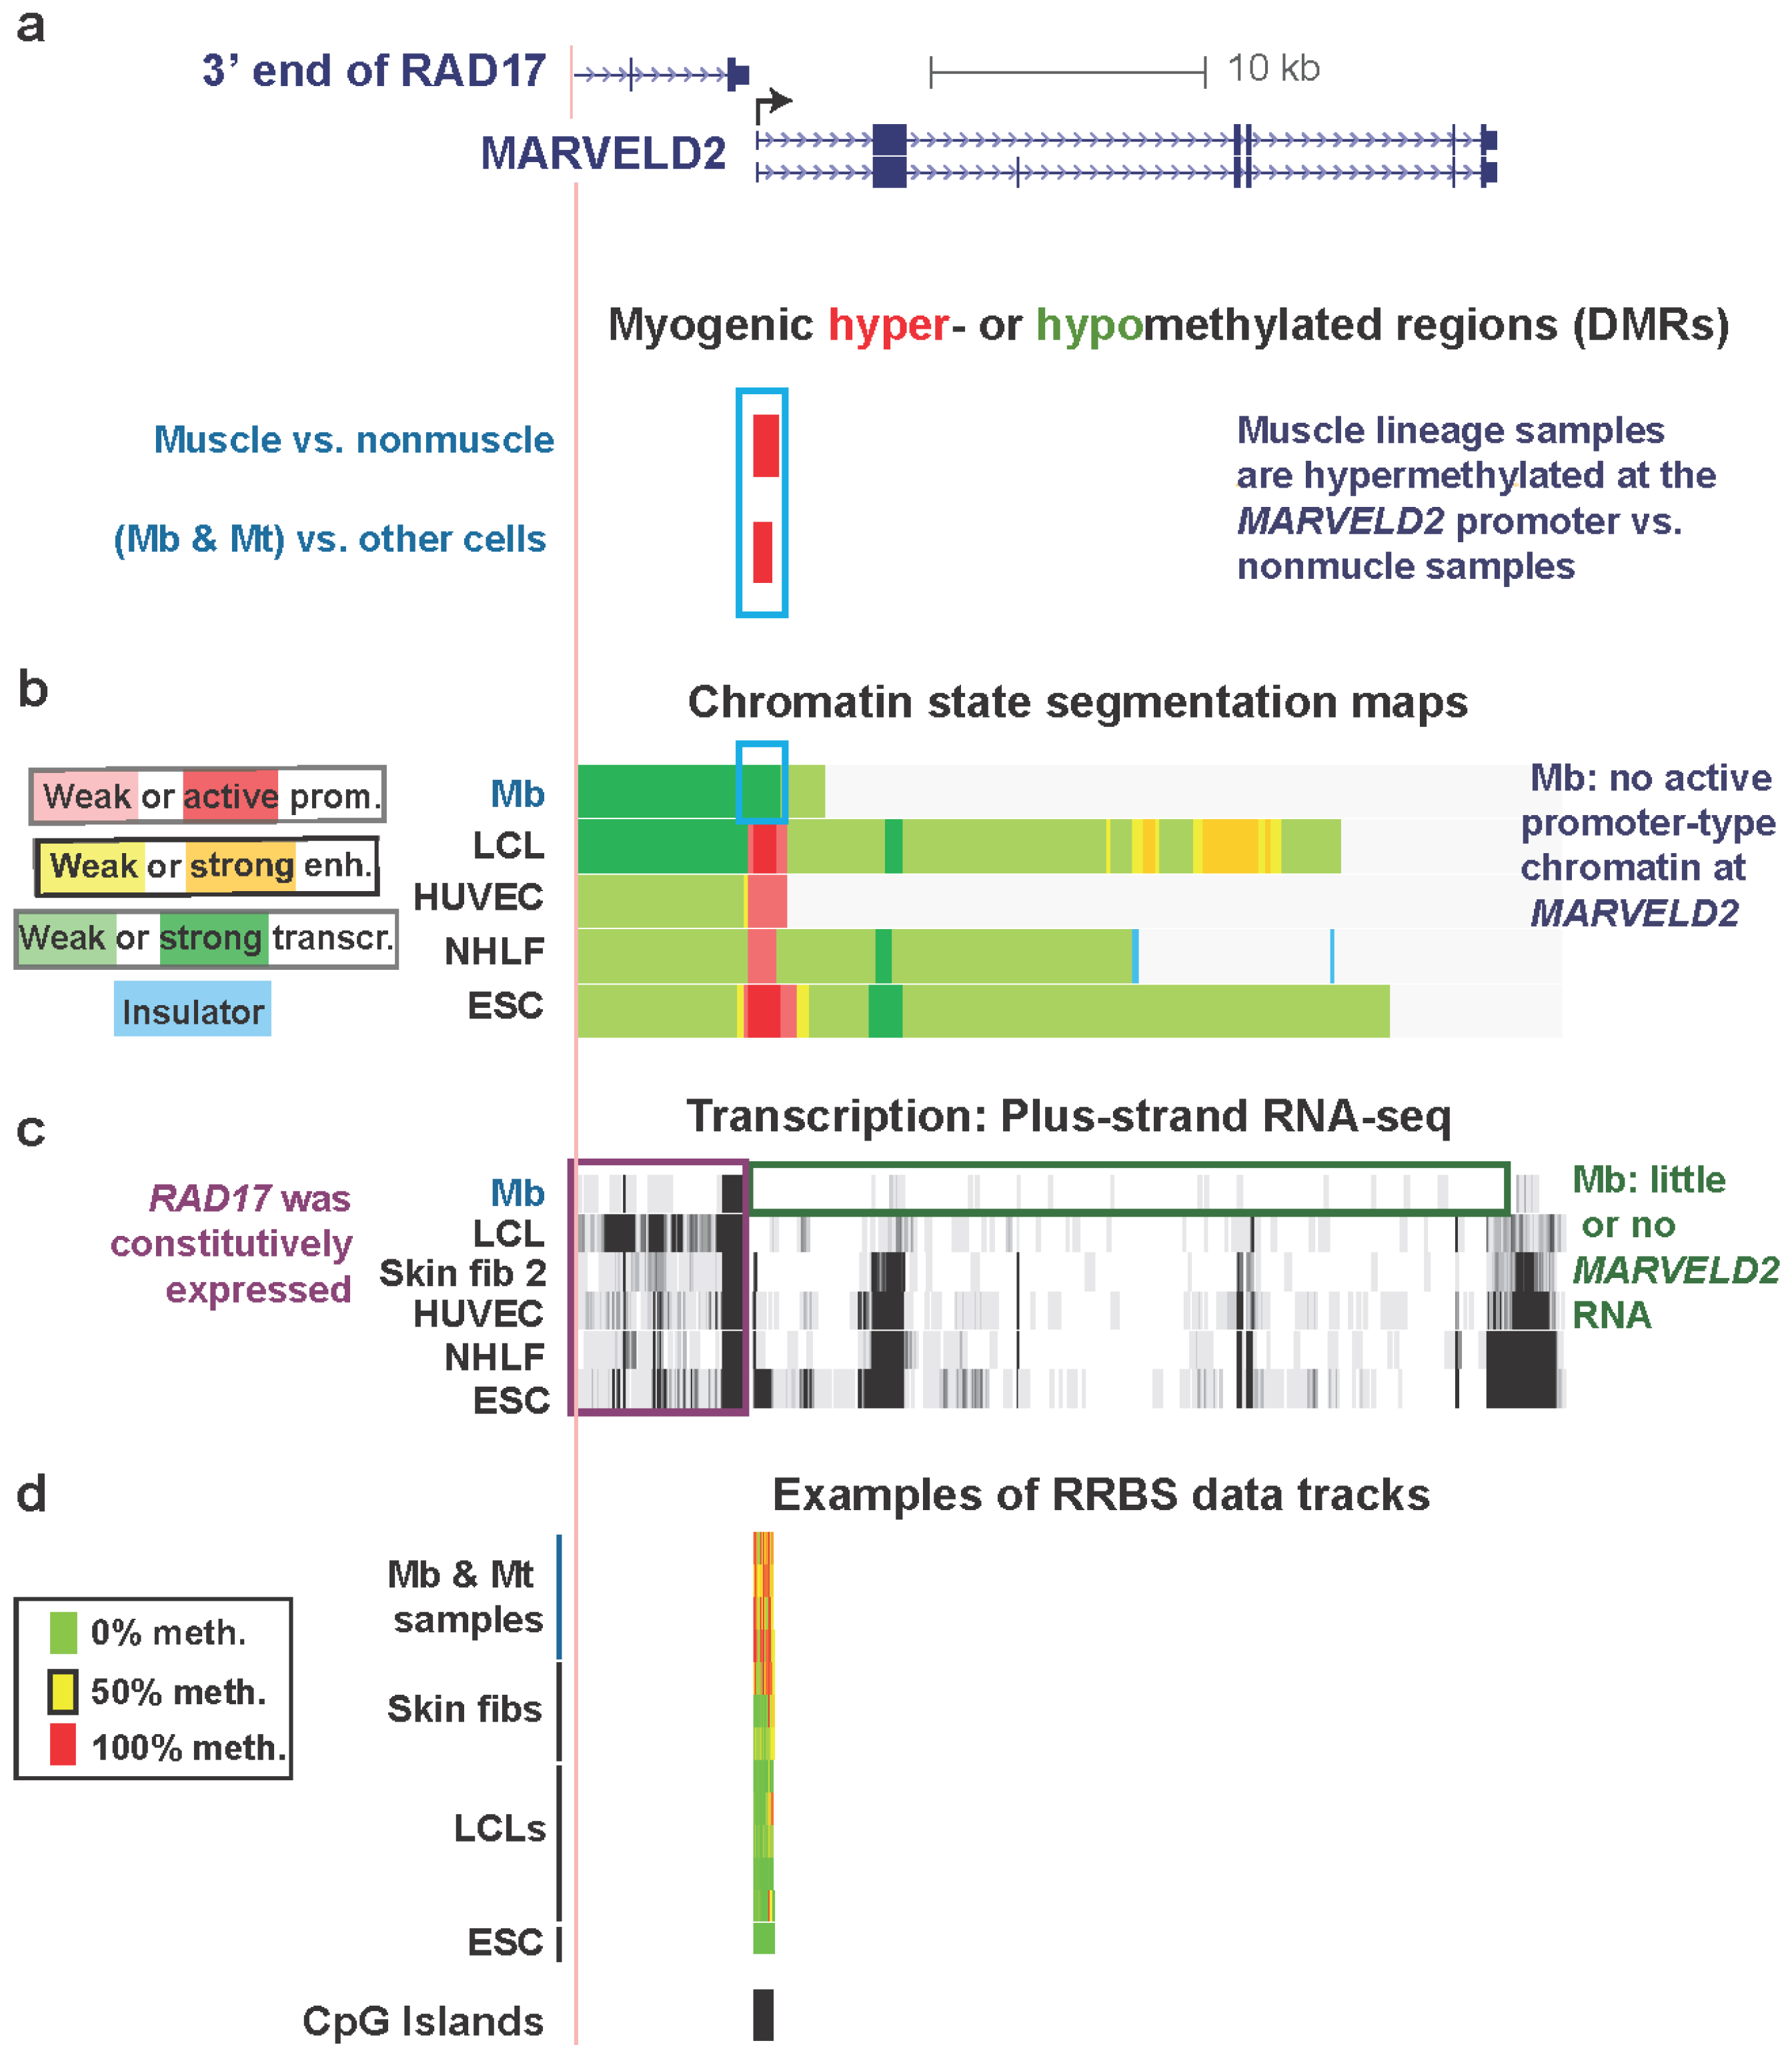
| MARVELD2 , promoter, exon 1, intron 1 chr5:68710817-68711681 | yes | yes | epithelial membrane protein | no | little or none | txn elongn | Figure 2, Figure S1 & Figure S2 |
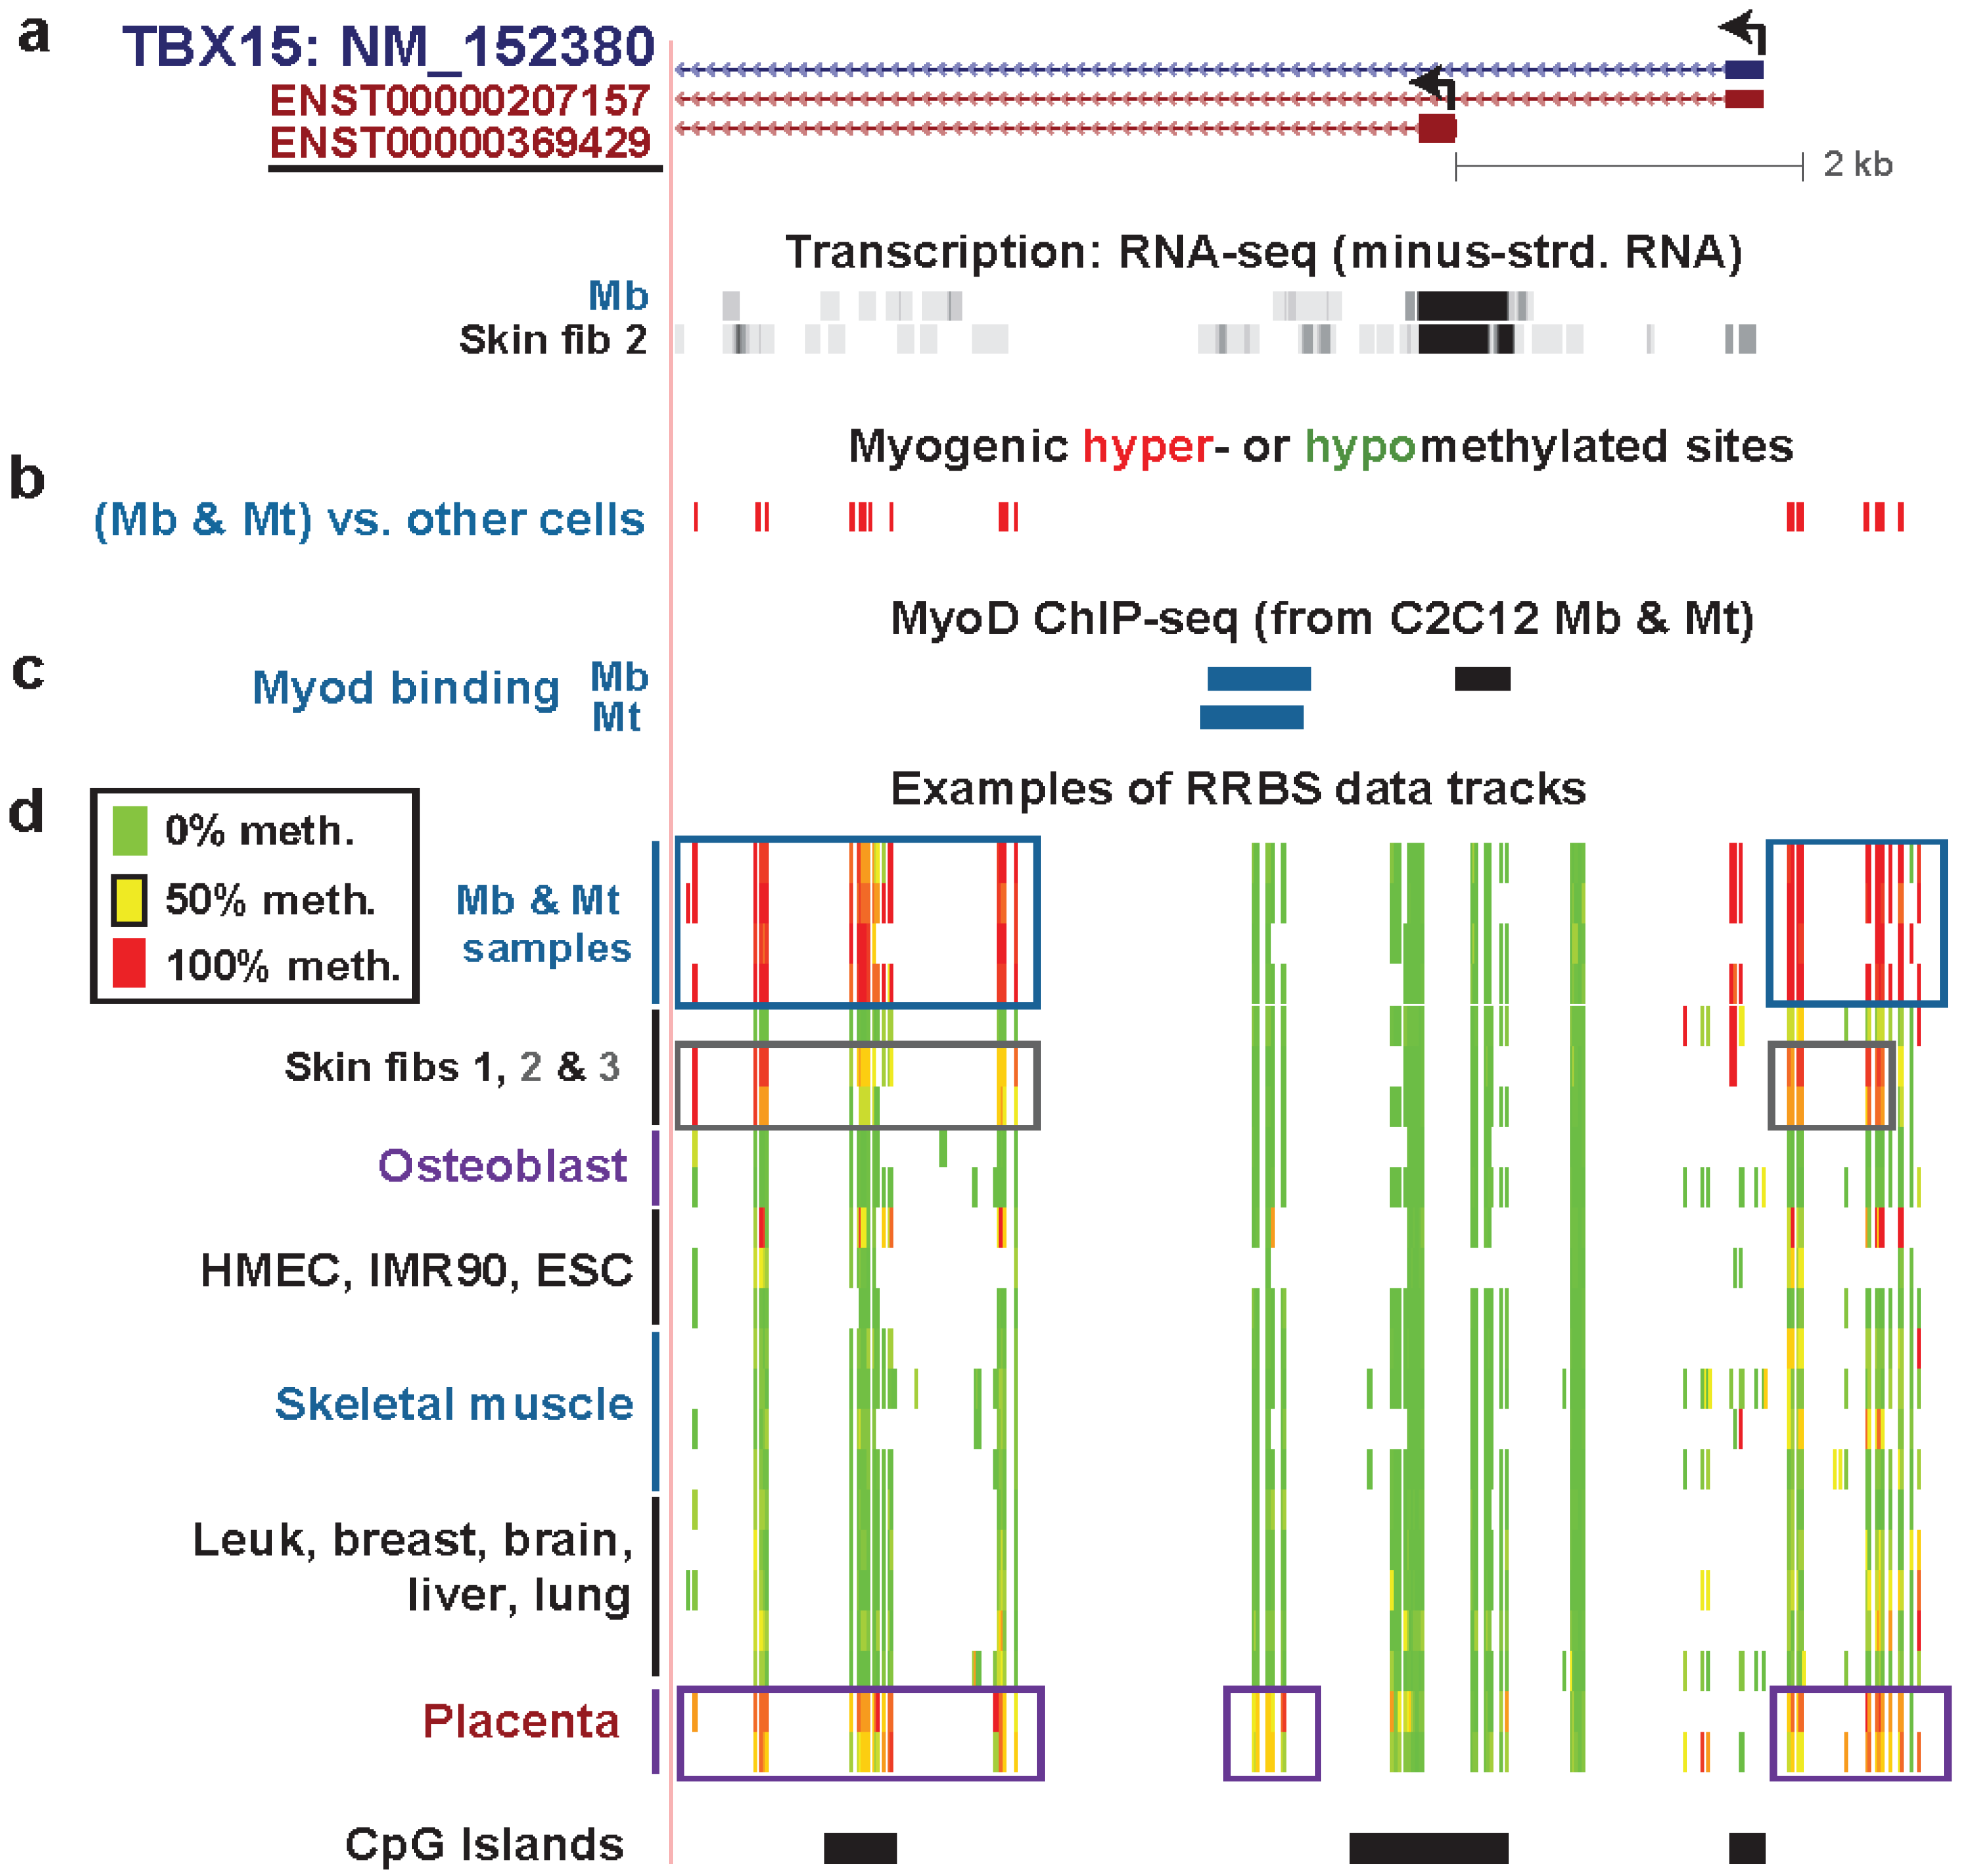
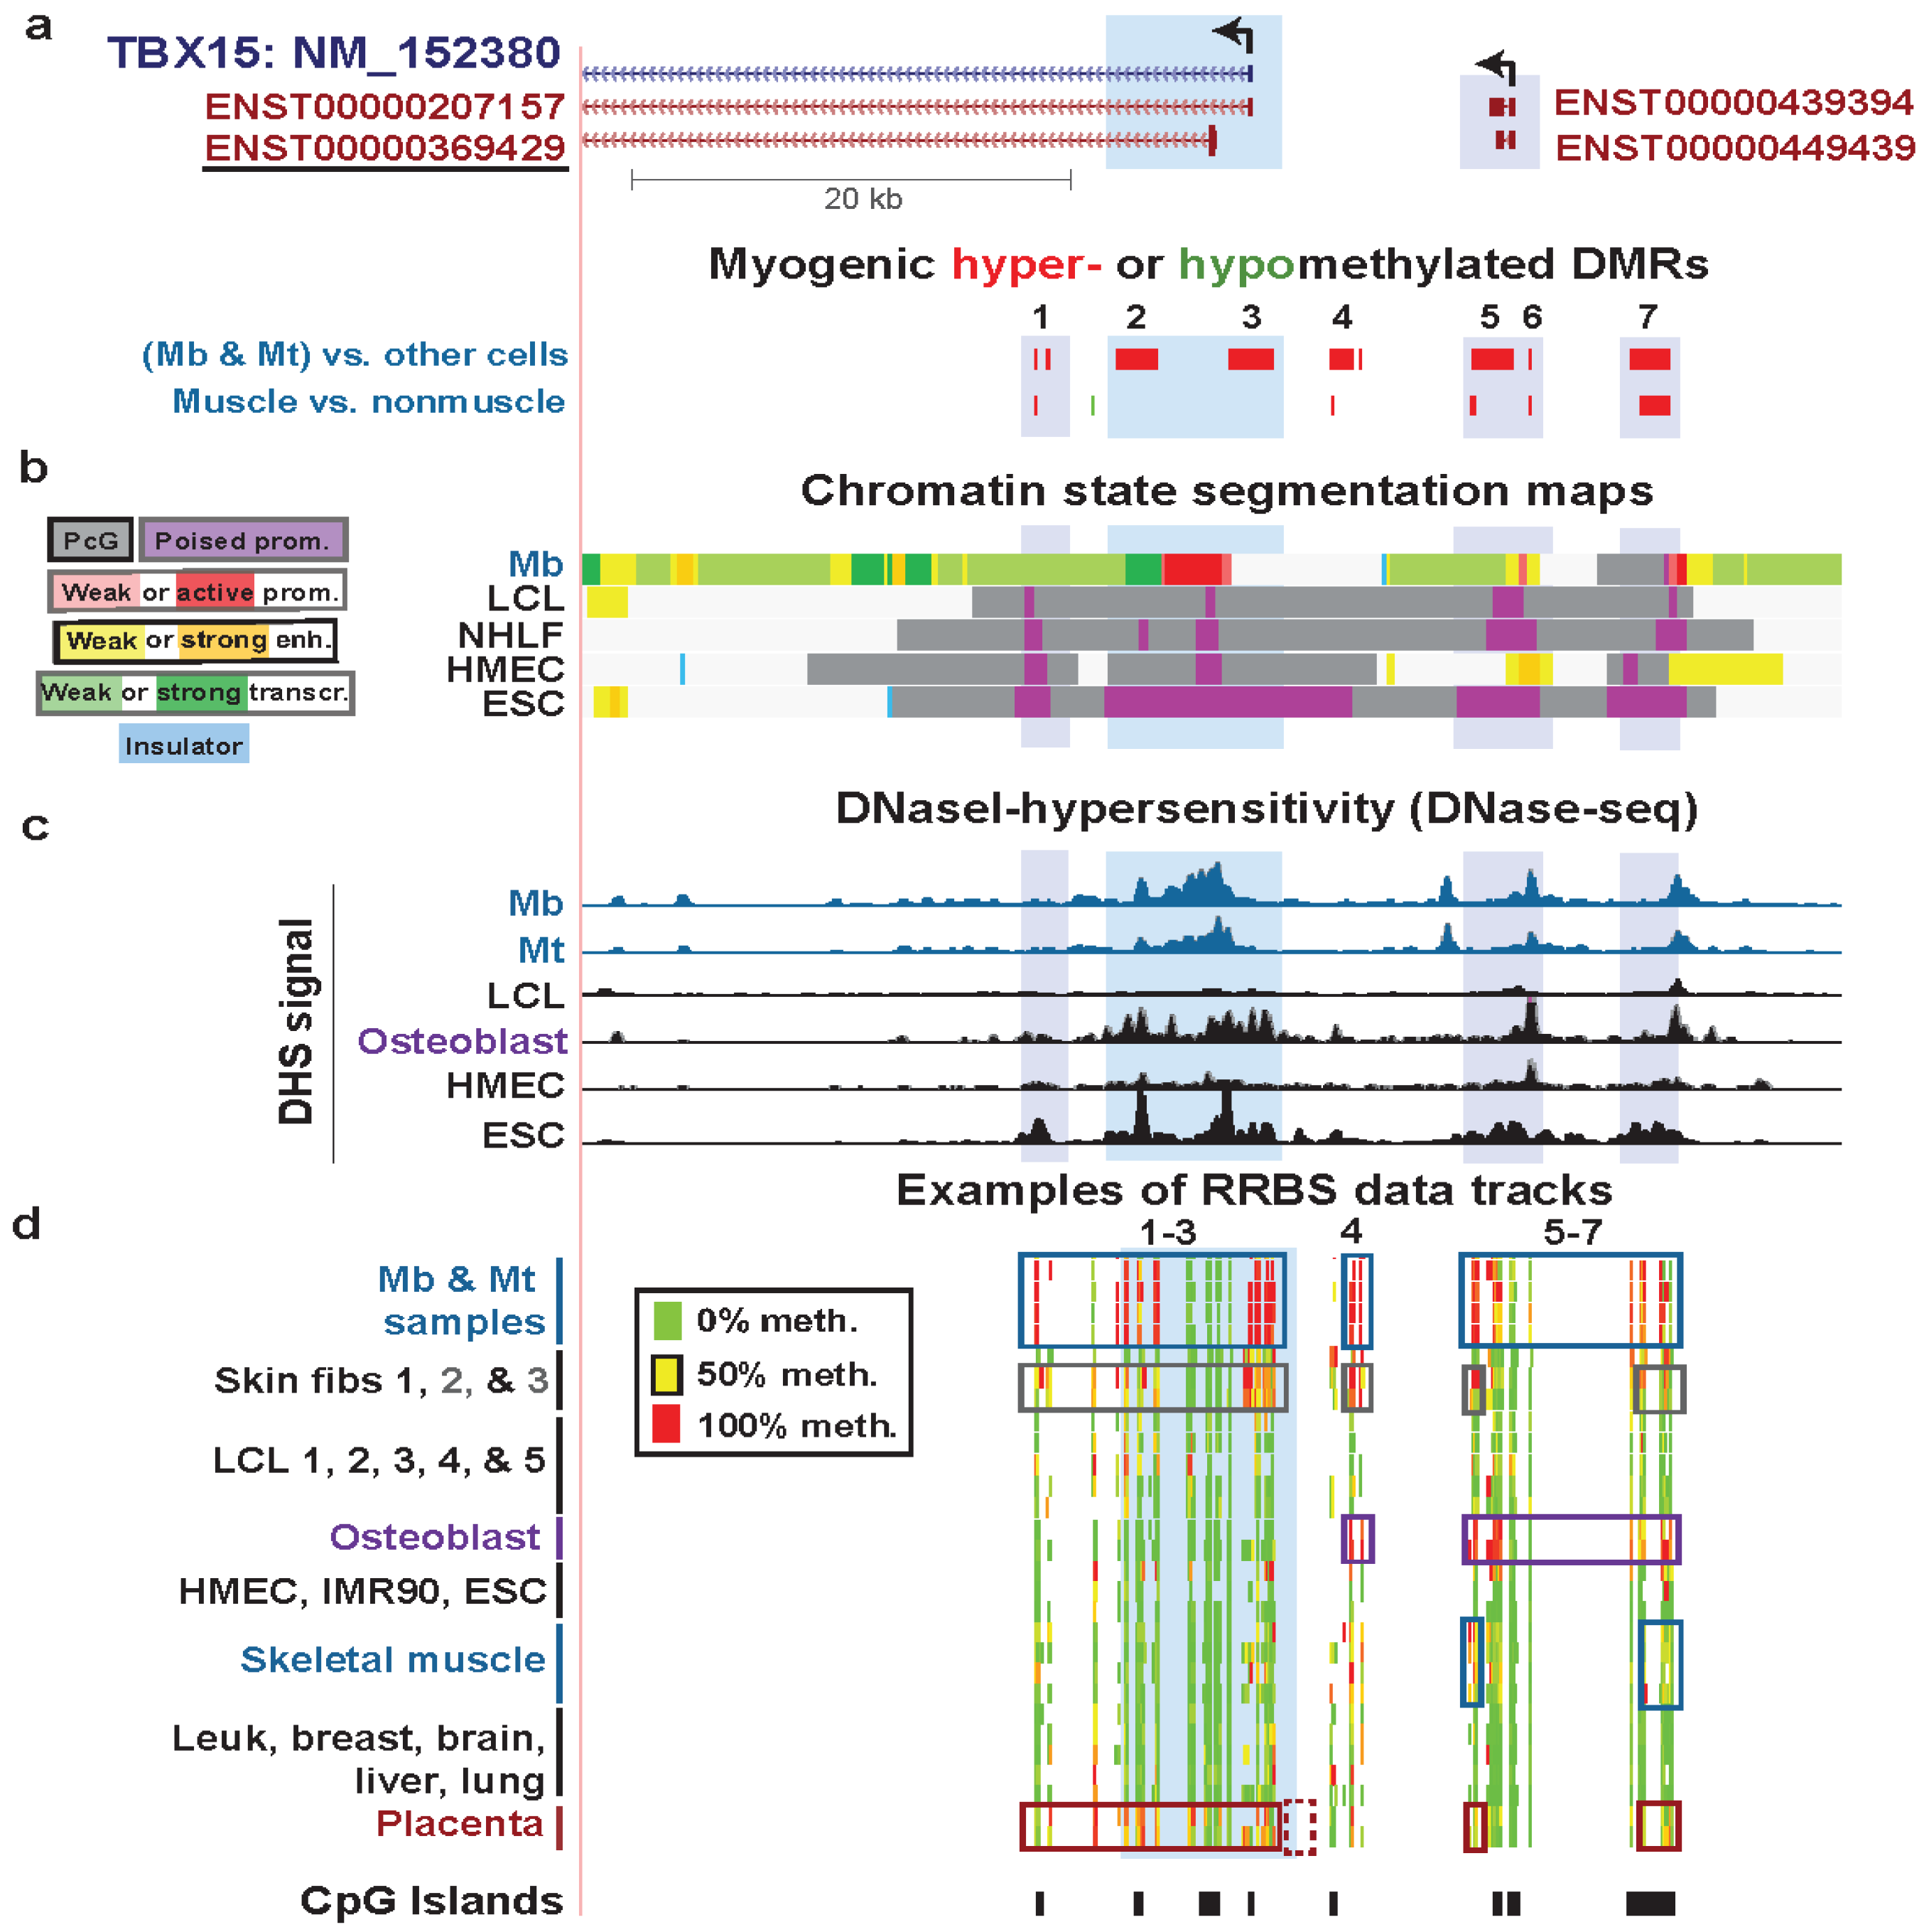
| TBX15 intron 1 | yes | yes | T-box txn factor; directs devel. fates | only from txn | strong | weak txn | Figure 4 (1) |
| TBX15 intron 1 | yes | no | txn elongn | Figure 4 (2) | |||
| TBX15 Mb promoter | yes | no | low signal | Figure 4 (3) | |||
| TBX15 upstream | yes | yes | low signal | Figure 4 (4) | |||
| TBX15 upstream | yes | yes | weak txn & weak enhancer | Figure 4 (5) | |||
| TBX15 upstream | yes | yes | weak enhancer | Figure 4 (6) | |||
| TBX15 upstream | yes | yes | PcG-repressed | Figure 4 (7) | |||
| Hypomethylated DMRs | |||||||
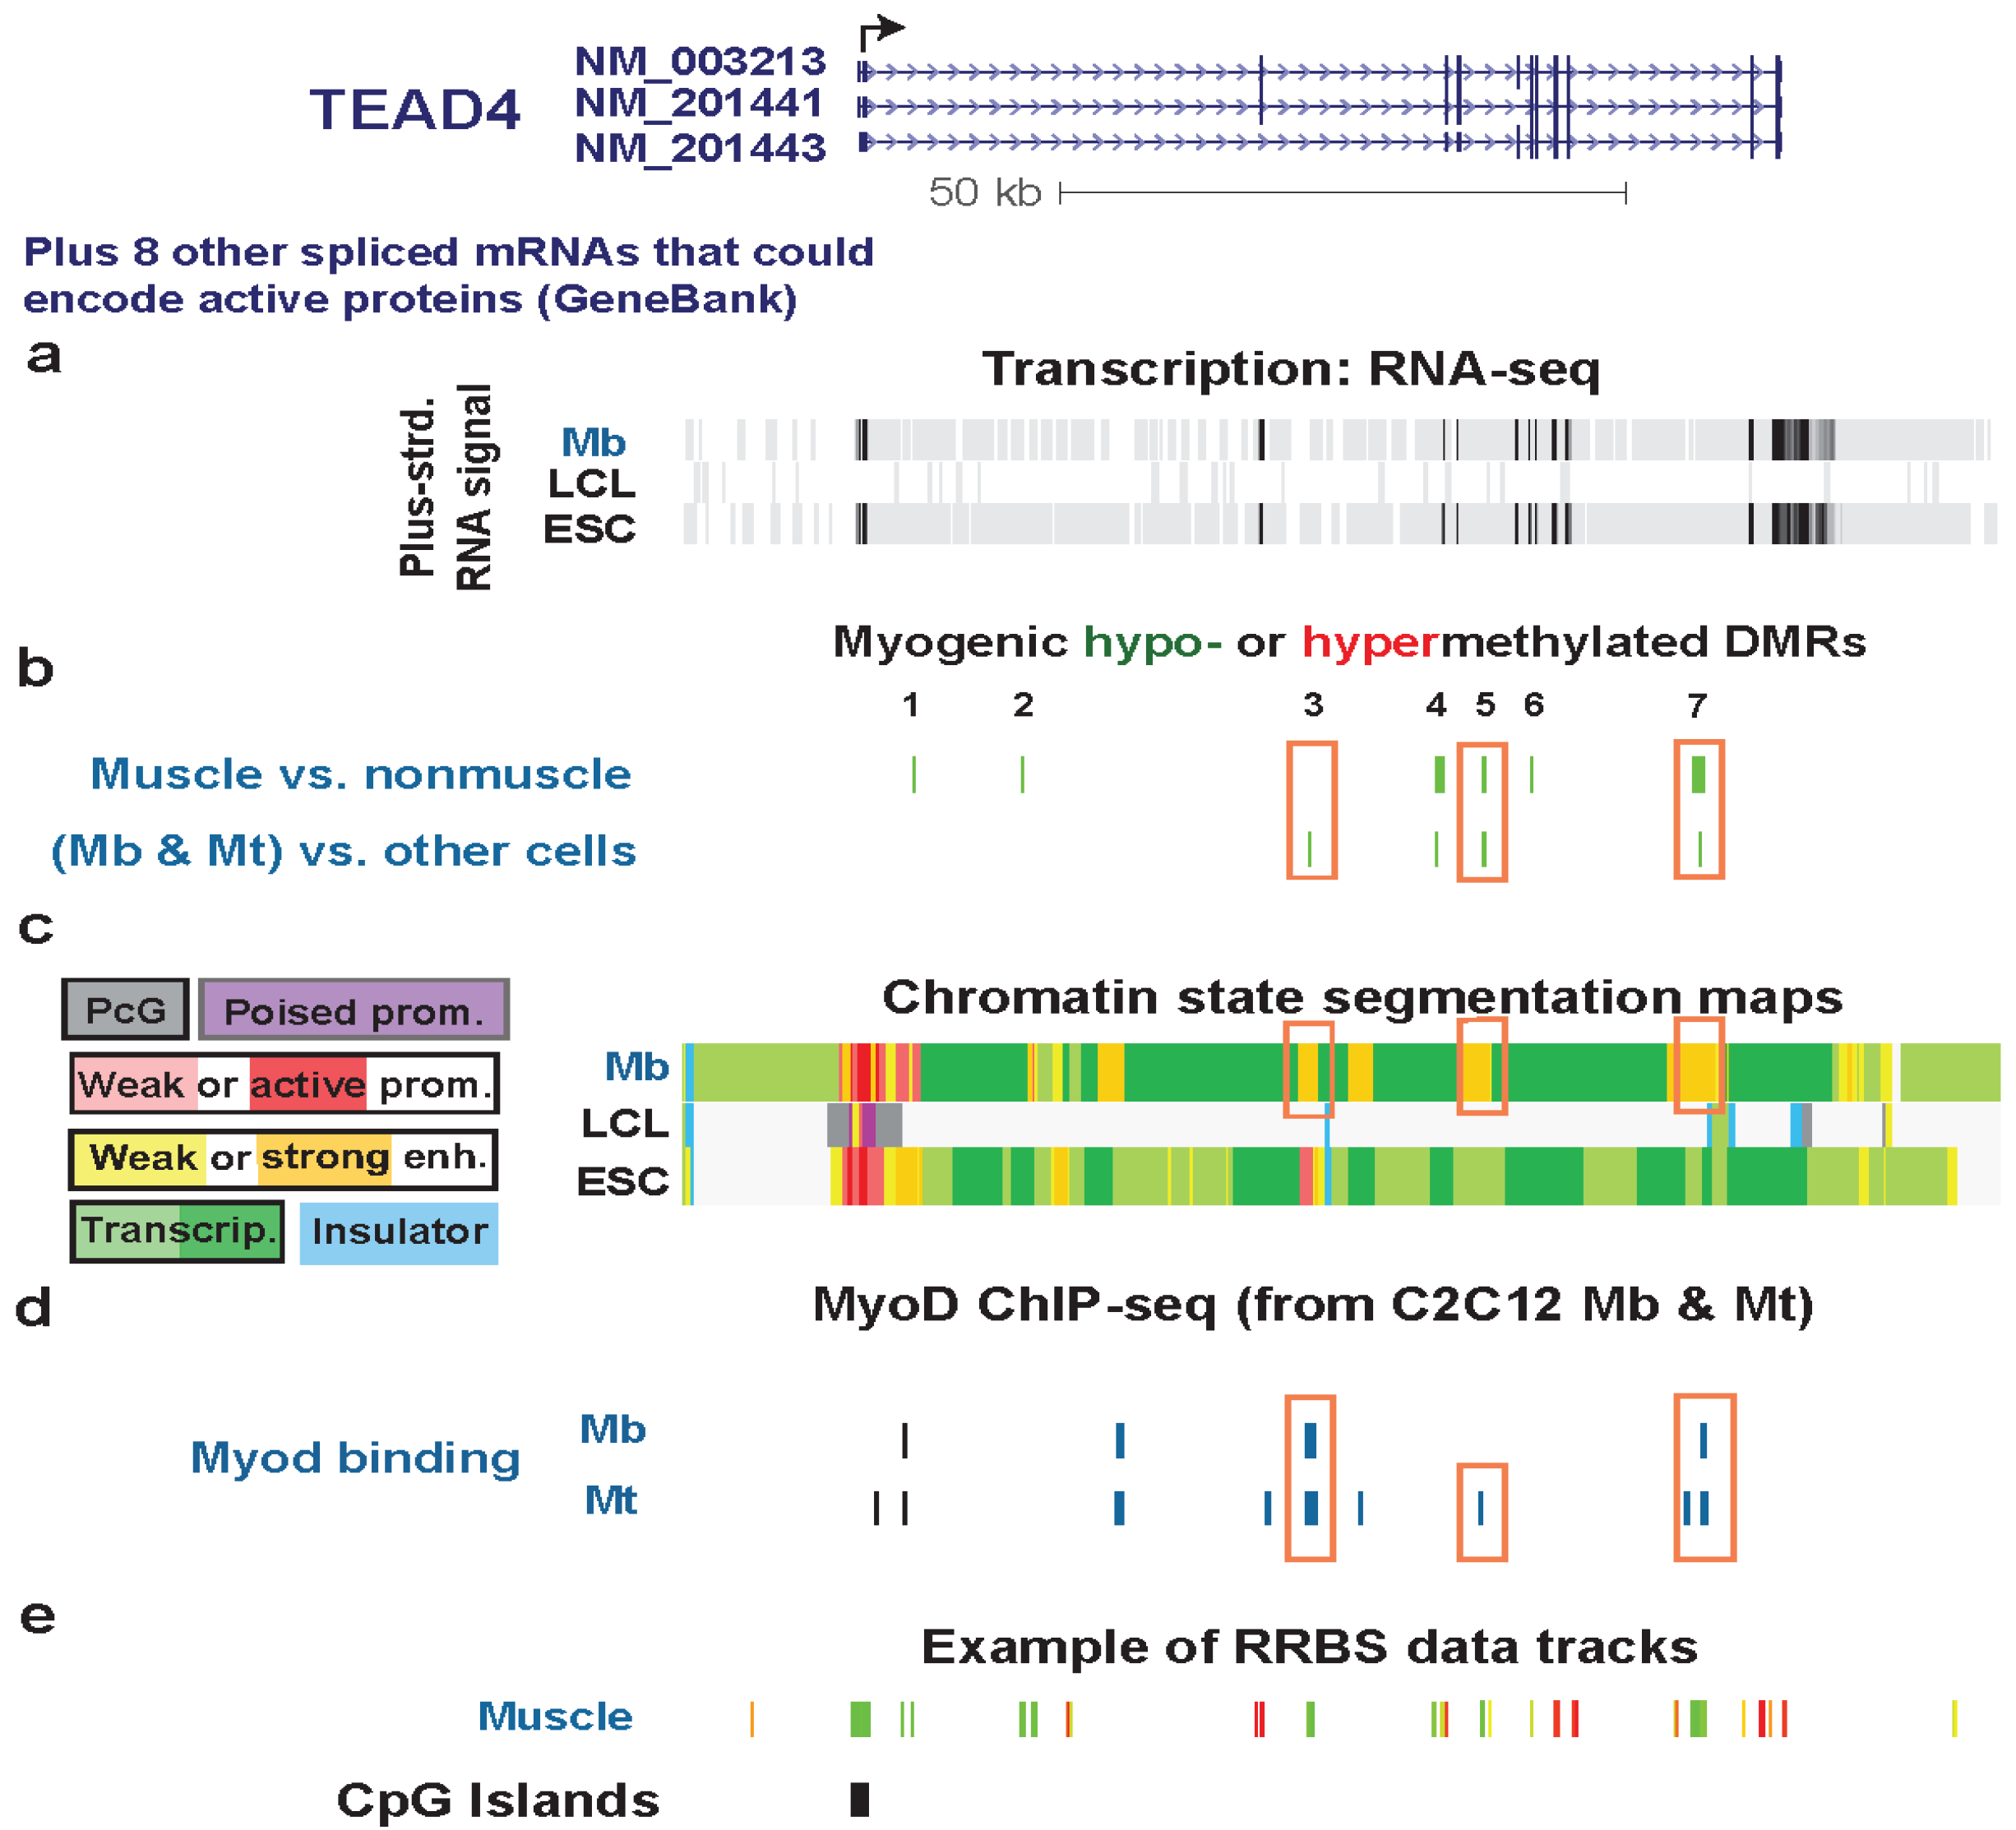
| TEAD4 intron2 | no | yes | txn factor binding the M-CAT element in promoters or enhancer of muscle genes | yes | strong | weak enhancer | Figure 5 (1) |
| TEAD4 intron2 | no | yes | txn transition | Figure 5 (2) | |||
| TEAD4 5' end of intron 3 | yes | no | strong enhancer | Figure S6 (3) | |||
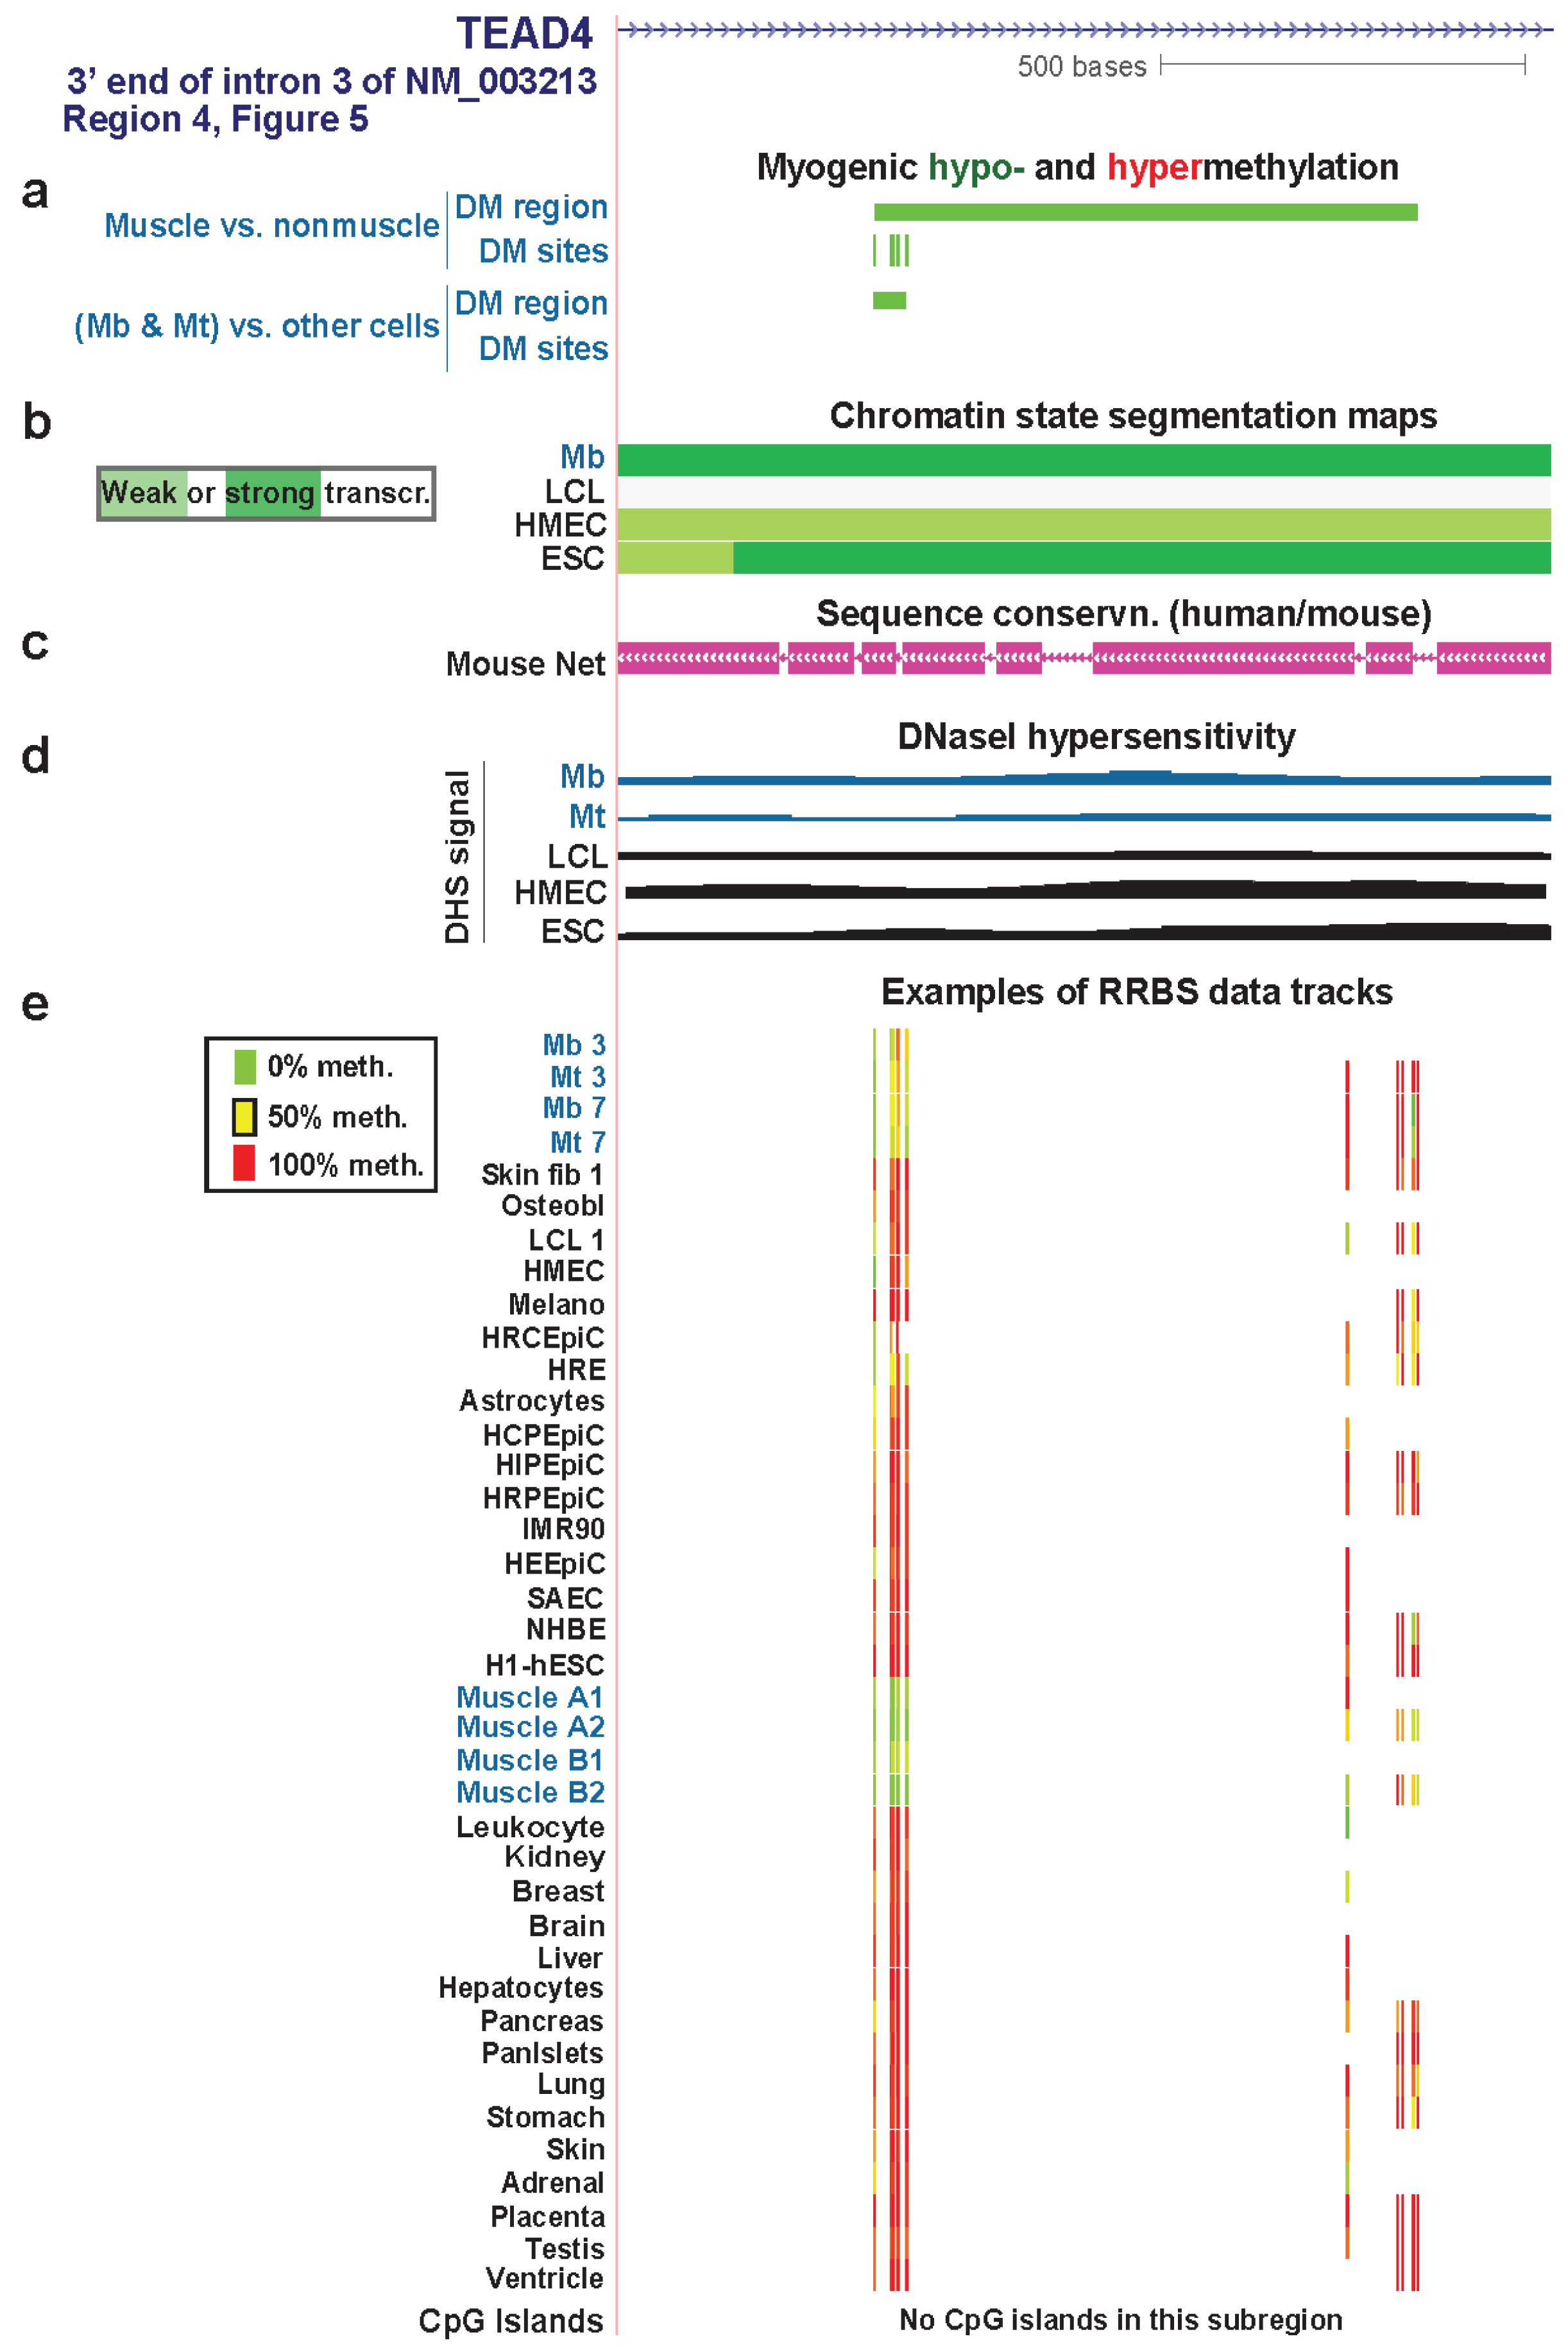
| TEAD4 3' end of intron 3 | yes | yes | txn elongn | Figure 7 (4) | |||
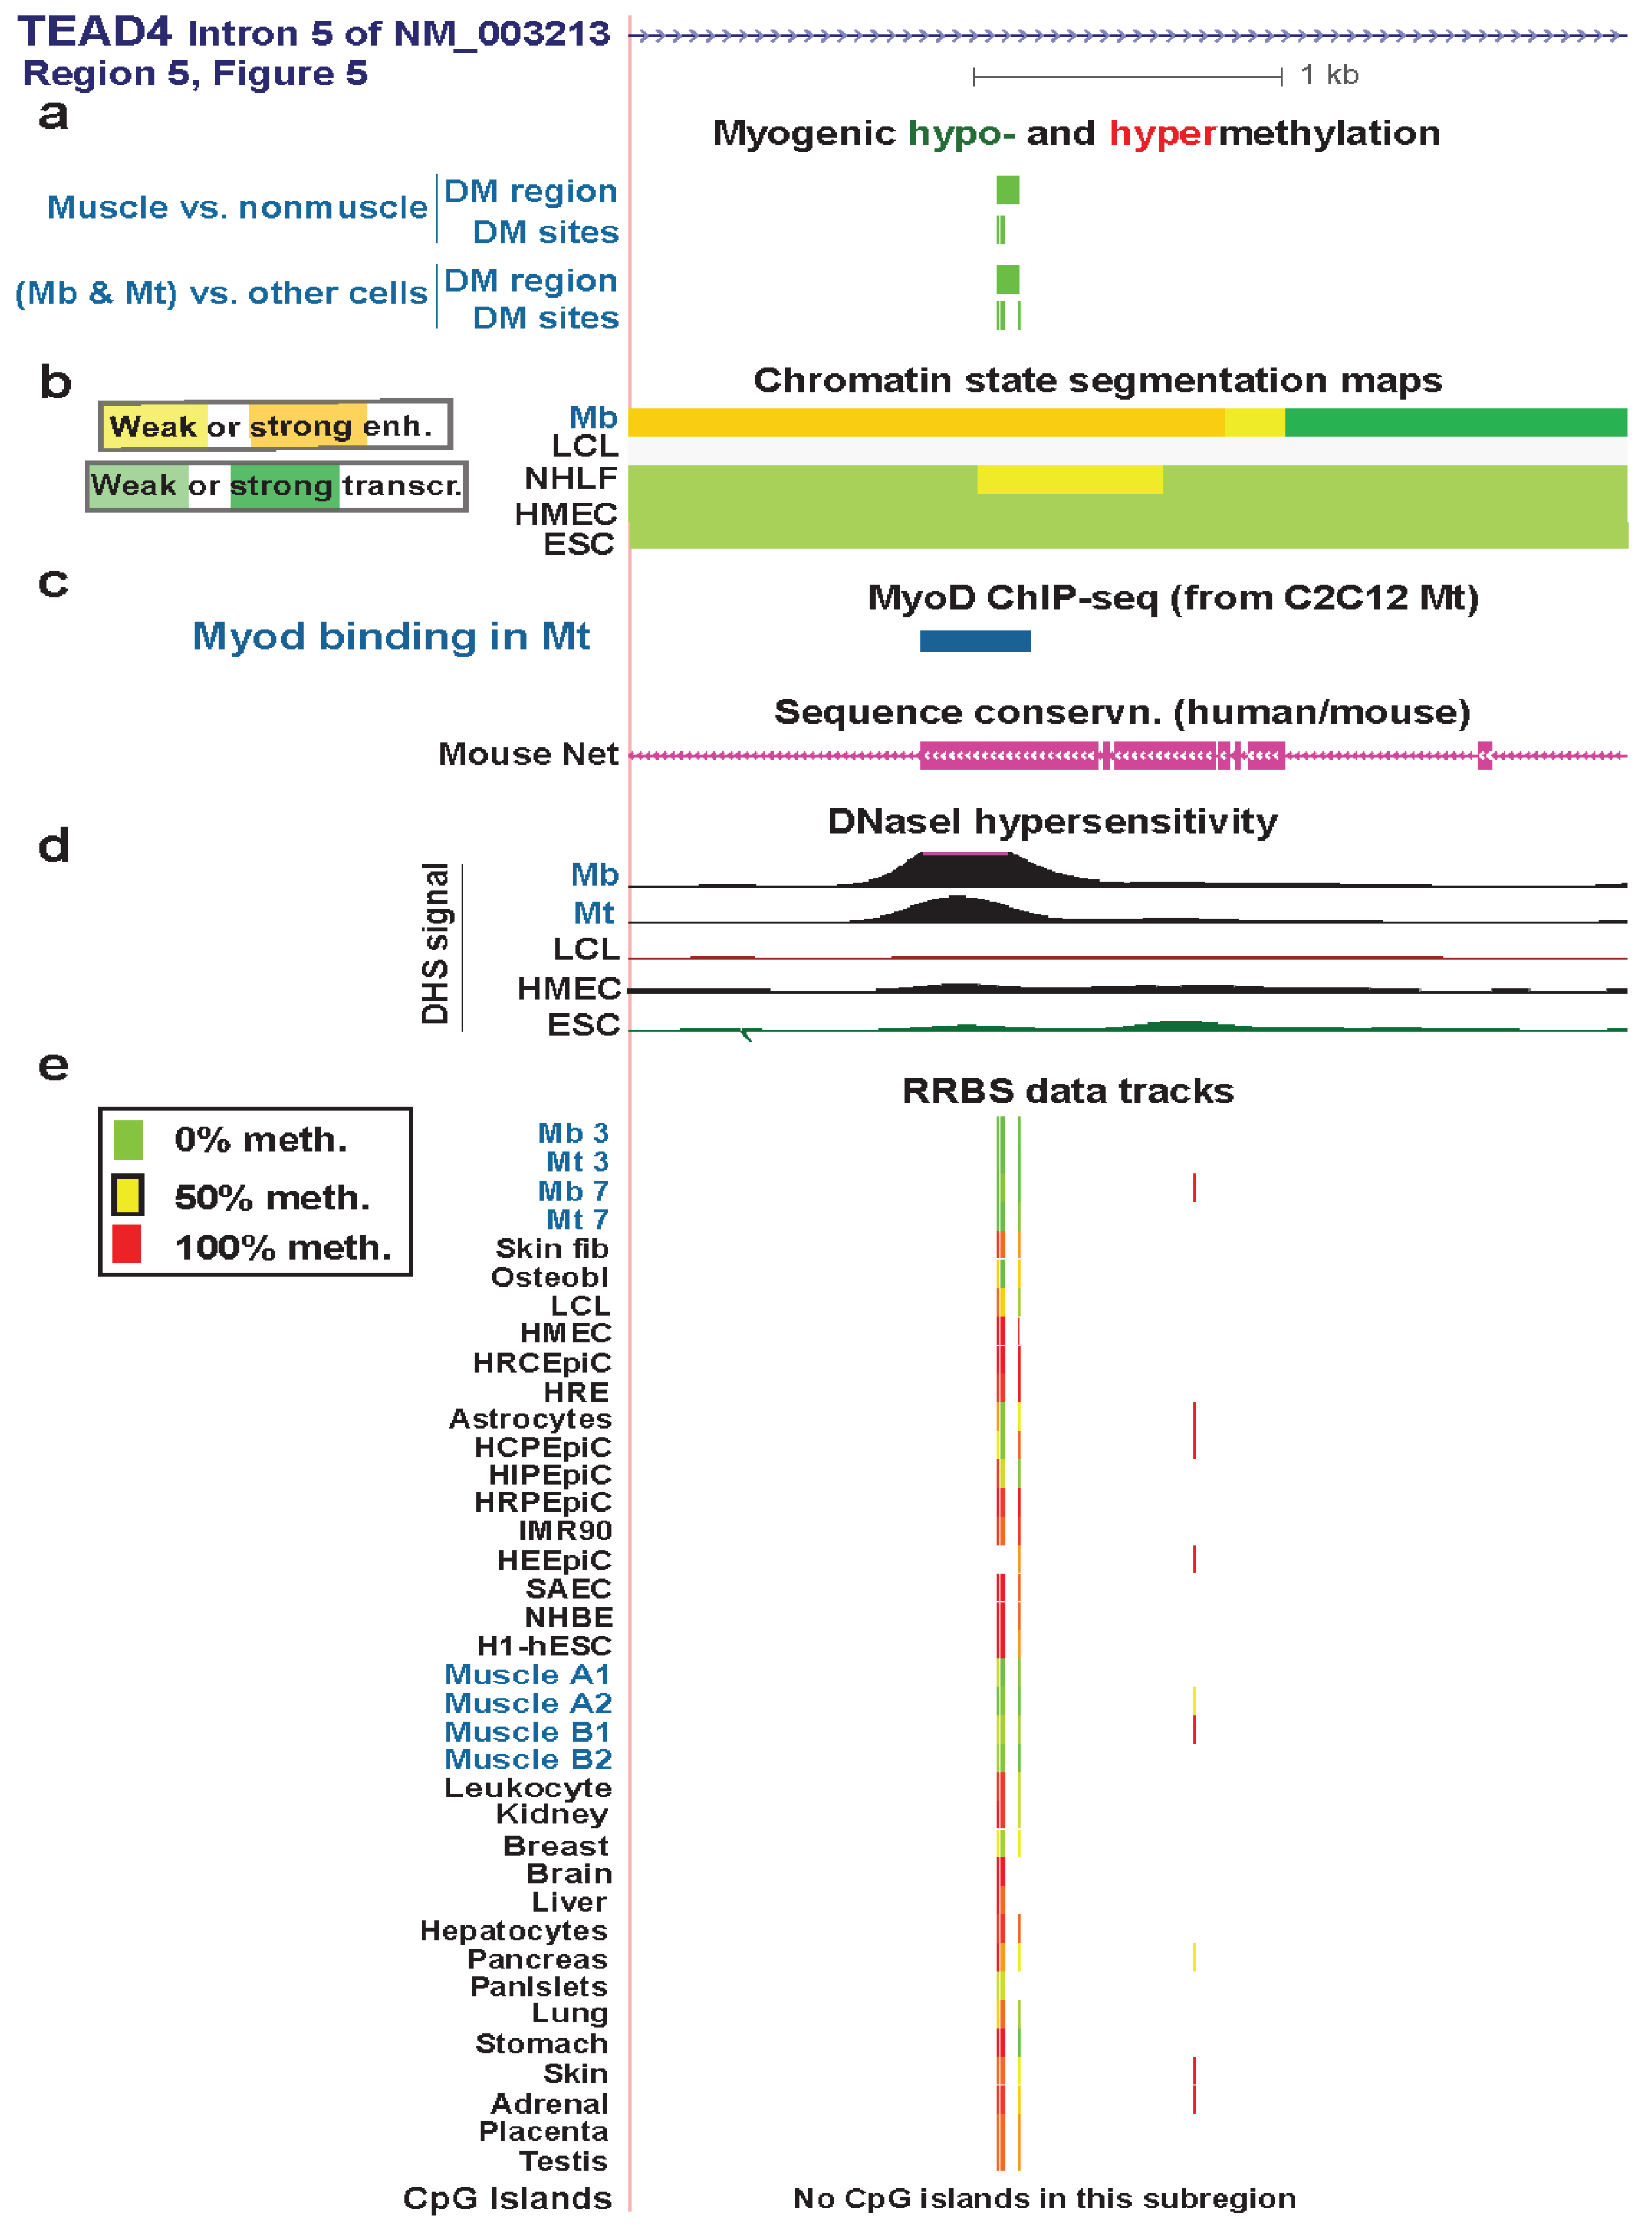
| TEAD4 intron 5 | yes | yes | strong enhancer | Figure 6 (5) | |||
| TEAD4 exon 7 | 1 DM site | yes | txn elongn | Figure S7 (6) | |||
| TEAD4 intron 10 | yes | yes | strong enhancer | Figure S5 (7) | |||
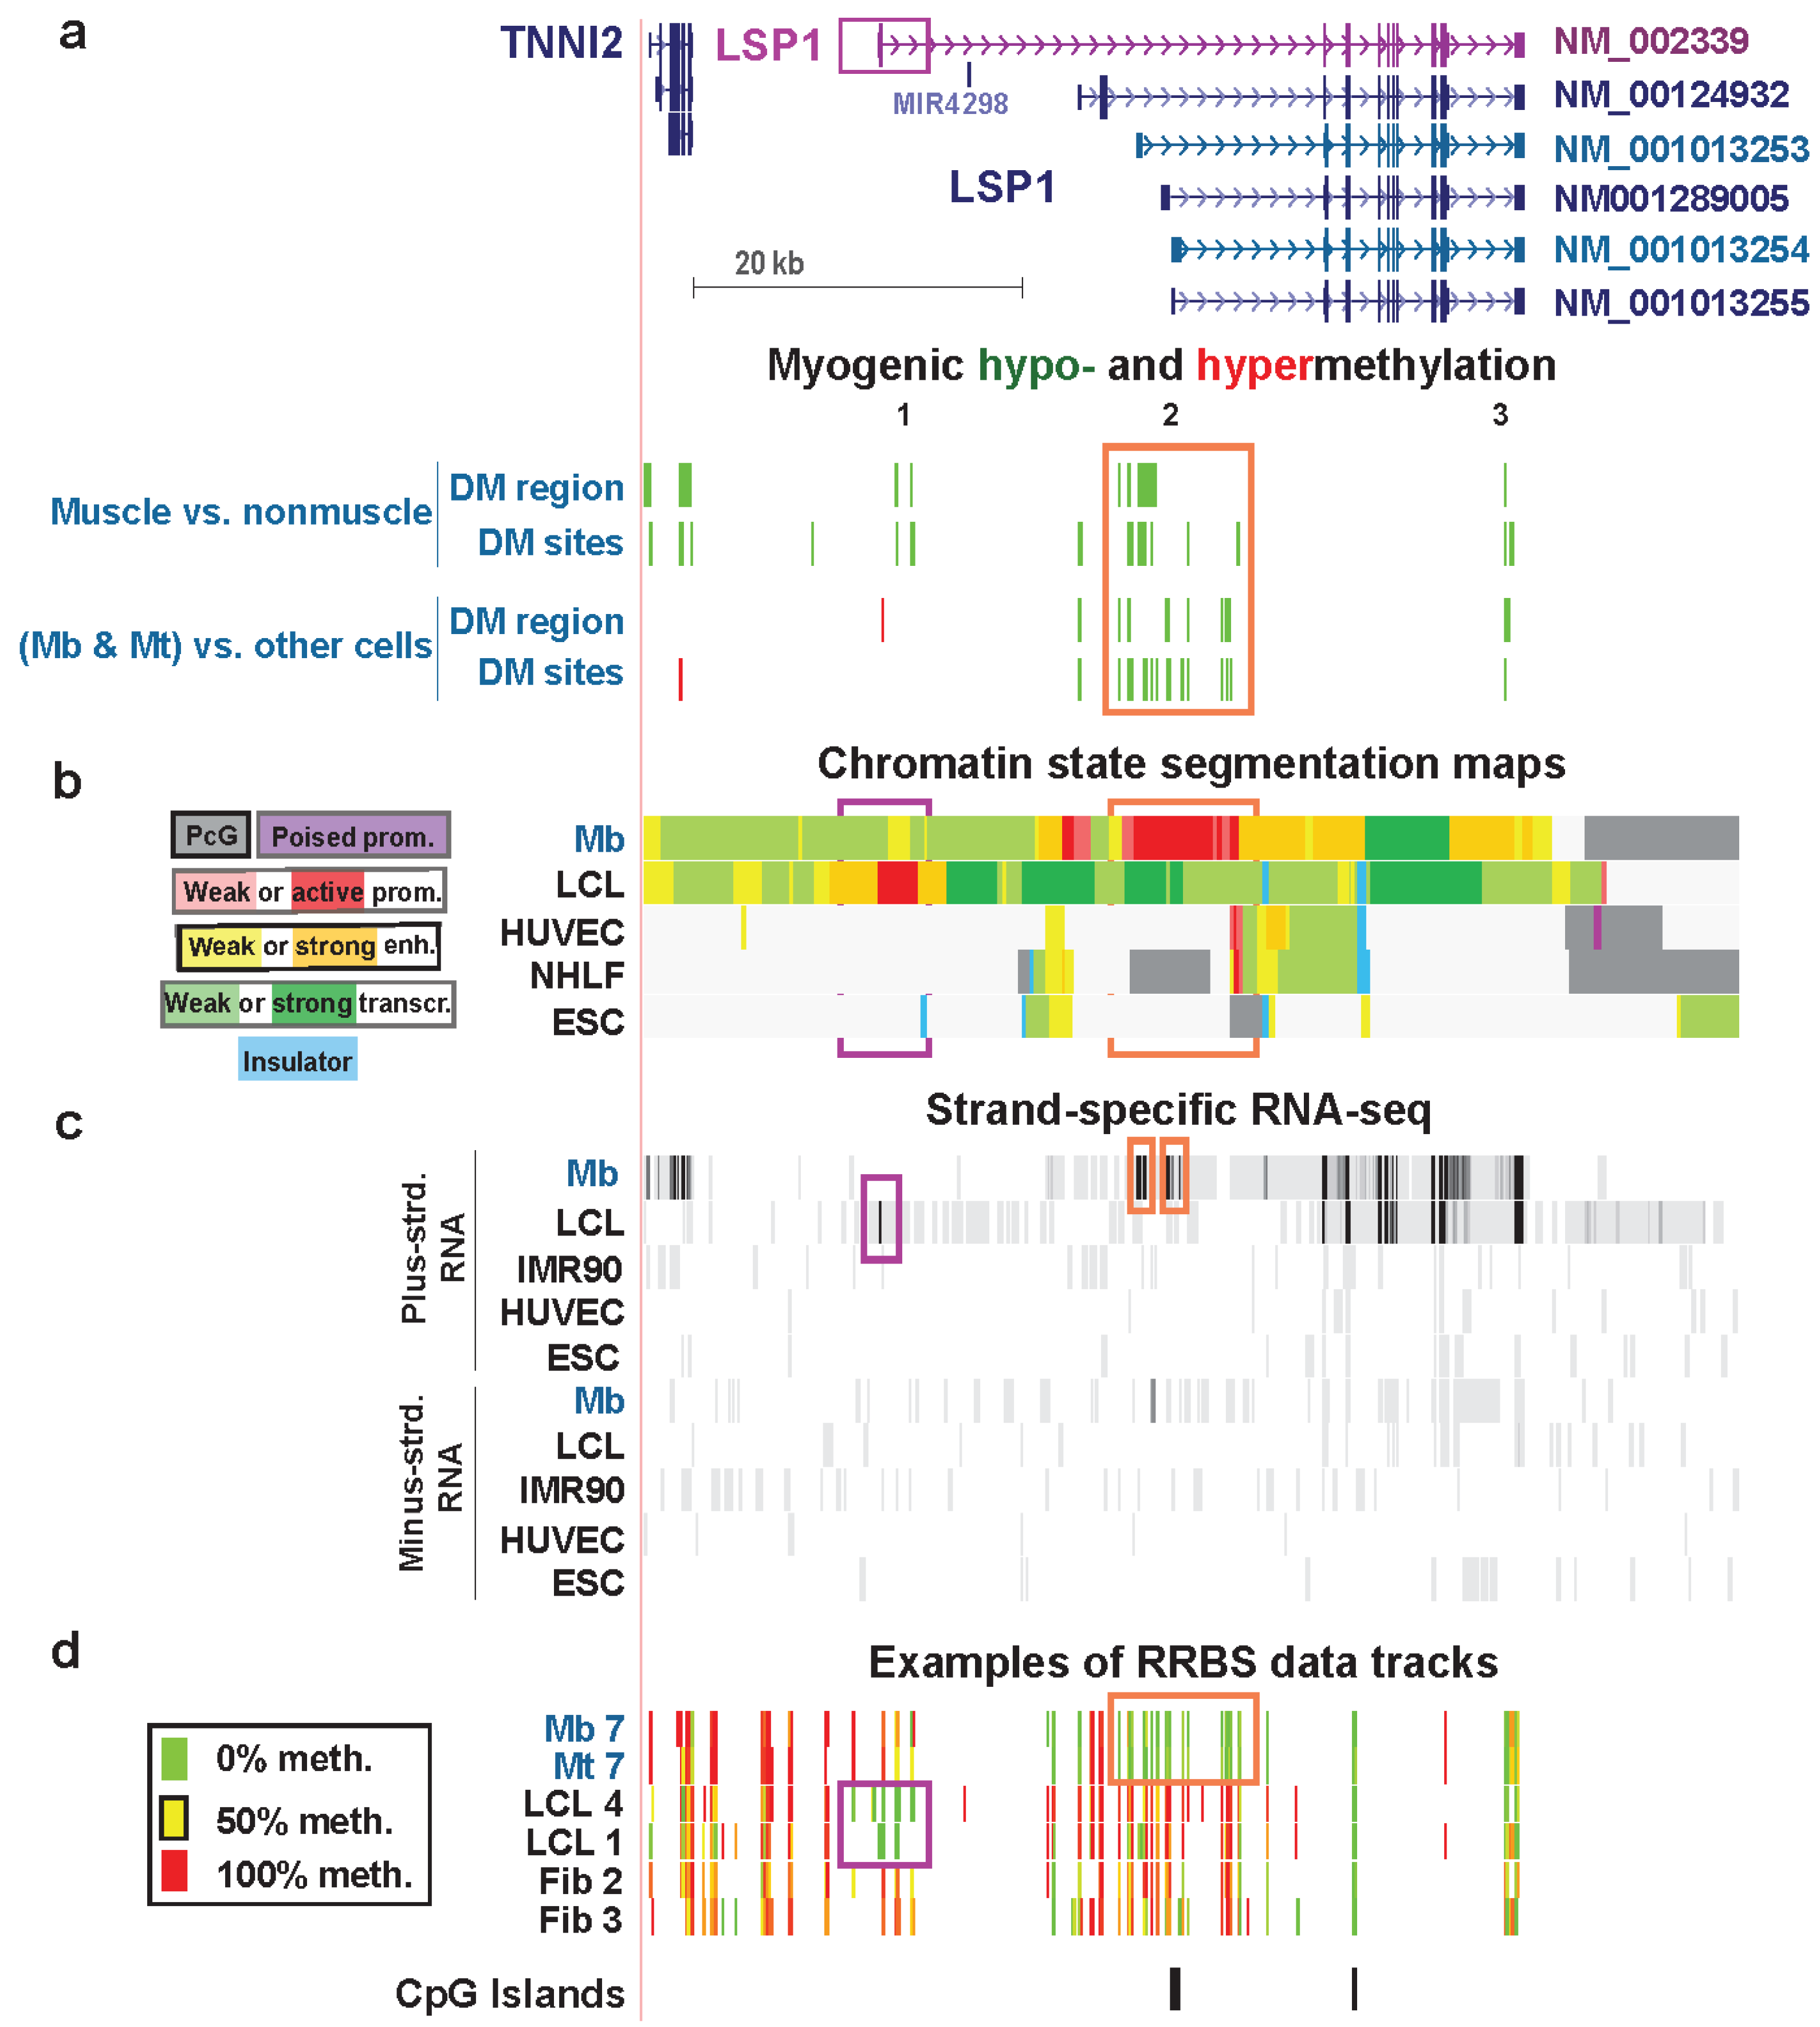
| LSP1 lymphoid extended promoter, exon 1, intron 1 (muscle only) | no | yes | F-actin binding | no | strong | weak enhancer & weak txn | Figure 8 (1) |
| LSP1 Mb extended promoter | yes | yes | weak promoter, strong promoter & strong enhancer | Figure 8 (2) | |||
| LSP1 last intron | yes | yes | strong enhancer | Figure 8 (3) |
3.2. MARVELD2 0.3 kb Upstream of Constitutively Expressed RAD17: Myogenic Hypermethylated DMR at a Promoter Strongly Repressed in Myoblasts but without Repressive Histone Modifications
3.3. TBX15: Myogenic Hypermethylation Surrounding the 5' End of a Gene that Is Moderately Expressed in Myoblasts

3.4. TEAD4: Many Myogenic Hypomethylated DMRs in the Body of a Gene that Is Highly Transcribed in Myoblasts


3.5. LSP1: Hypomethylation at Tissue-Specific Promoter Chromatin in Myoblasts and Lymphoblasts
4. Conclusions
Supplementary Files
Acknowledgments
Author Contributions
Conflicts of Interest
References
- Lister, R.; Pelizzola, M.; Dowen, R.H.; Hawkins, R.D.; Hon, G.; Tonti-Filippini, J.; Nery, J.R.; Lee, L.; Ye, Z.; Ngo, Q.M.; et al. Human DNA methylomes at base resolution show widespread epigenomic differences. Nature 2009, 462, 315–322. [Google Scholar] [CrossRef]
- Meissner, A.; Mikkelsen, T.S.; Gu, H.; Wernig, M.; Hanna, J.; Sivachenko, A.; Zhang, X.; Bernstein, B.E.; Nusbaum, C.; Jaffe, D.B.; et al. Genome-scale DNA methylation maps of pluripotent and differentiated cells. Nature 2008, 454, 766–770. [Google Scholar]
- Laurent, L.; Wong, E.; Li, G.; Huynh, T.; Tsirigos, A.; Ong, C.T.; Low, H.M.; Kin Sung, K.W.; Rigoutsos, I.; Loring, J.; et al. Dynamic changes in the human methylome during differentiation. Genome Res. 2010, 20, 320–331. [Google Scholar] [CrossRef]
- Wu, H.; Coskun, V.; Tao, J.; Xie, W.; Ge, W.; Yoshikawa, K.; Li, E.; Zhang, Y.; Sun, Y.E. Dnmt3a-dependent nonpromoter DNA methylation facilitates transcription of neurogenic genes. Science 2010, 329, 444–448. [Google Scholar] [CrossRef]
- Reddington, J.P.; Perricone, S.M.; Nestor, C.E.; Reichmann, J.; Youngson, N.A.; Suzuki, M.; Reinhardt, D.; Dunican, D.S.; Prendegast, J.G.; Mjoseng, H.; et al. Redistribution of H3K27me3 upon DNA hypomethylation results in de-repression of Polycomb-target genes. Genome Biol. 2013, 14, R25. [Google Scholar] [CrossRef]
- Sati, S.; Ghosh, S.; Jain, V.; Scaria, V.; Sengupta, S. Genome-wide analysis reveals distinct patterns of epigenetic features in long non-coding RNA loci. Nucleic Acids Res. 2012, 40, 10018–10031. [Google Scholar]
- Ziller, M.J.; Gu, H.; Muller, F.; Donaghey, J.; Tsai, L.T.; Kohlbacher, O.; de Jager, P.L.; Rosen, E.D.; Bennett, D.A.; Bernstein, B.E.; et al. Charting a dynamic DNA methylation landscape of the human genome. Nature 2013, 500, 477–481. [Google Scholar] [CrossRef]
- Maunakea, A.K.; Nagarajan, R.P.; Bilenky, M.; Ballinger, T.J.; D'Souza, C.; Fouse, S.D.; Johnson, B.E.; Hong, C.; Nielsen, C.; Zhao, Y.; et al. Conserved role of intragenic DNA methylation in regulating alternative promoters. Nature 2010, 466, 253–257. [Google Scholar] [CrossRef]
- Varley, K.E.; Gertz, J.; Bowling, K.M.; Parker, S.L.; Reddy, T.E.; Pauli-Behn, F.; Cross, M.K.; Williams, B.A.; Stamatoyannopoulos, J.A.; Crawford, G.E.; et al. Dynamic DNA methylation across diverse human cell lines and tissues. Genome Res. 2013, 23, 555–567. [Google Scholar] [CrossRef]
- Ehrlich, M.; Lacey, M. DNA methylation and differentiation: silencing, upregulation and modulation of gene expression. Epigenomics 2013, 5, 553–568. [Google Scholar] [CrossRef]
- Hartung, T.; Zhang, L.; Kanwar, R.; Khrebtukova, I.; Reinhardt, M.; Wang, C.; Therneau, T.M.; Banck, M.S.; Schroth, G.P.; Beutler, A.S. Diametrically opposite methylome-transcriptome relationships in high- and low-CpG promoter genes in postmitotic neural rat tissue. Epigenetics 2012, 7, 421–428. [Google Scholar] [CrossRef]
- Hawkins, R.D.; Hon, G.C.; Lee, L.K.; Ngo, Q.; Lister, R.; Pelizzola, M.; Edsall, L.E.; Kuan, S.; Luu, Y.; Klugman, S.; et al. Distinct epigenomic landscapes of pluripotent and lineage-committed human cells. Cell Stem Cell 2010, 6, 479–491. [Google Scholar]
- Brenet, F.; Moh, M.; Funk, P.; Feierstein, E.; Viale, A.J.; Socci, N.D.; Scandura, J.M. DNA methylation of the first exon is tightly linked to transcriptional silencing. PLoS One 2011, 6, e14524. [Google Scholar]
- Hoivik, E.A.; Bjanesoy, T.E.; Mai, O.; Okamoto, S.; Minokoshi, Y.; Shima, Y.; Morohashi, K.; Boehm, U.; Bakke, M. DNA methylation of intronic enhancers directs tissue-specific expression of steroidogenic factor 1/adrenal 4 binding protein (SF-1/Ad4BP). Endocrinology 2012, 152, 2100–2112. [Google Scholar]
- Schor, I.E.; Fiszbein, A.; Petrillo, E.; Kornblihtt, A.R. Intragenic epigenetic changes modulate NCAM alternative splicing in neuronal differentiation. EMBO J. 2013, 32, 2264–2274. [Google Scholar] [CrossRef]
- Terragni, J.; Zhang, G.; Sun, Z.; Pradhan, S.; Song, L.; Crawford, G.E.; Lacey, M.; Ehrlich, M. Notch signaling genes: Myogenic DNA hypomethylation and 5-hydroxymethylcytosine. Epigenetics 2014, 9, 842–850. [Google Scholar] [CrossRef]
- Tsumagari, K.; Baribault, C.; Terragni, J.; Chandra, S.; Renshaw, C.; Sun, Z.; Song, L.; Crawford, G.E.; Pradhan, S.; Lacey, M.; et al. DNA methylation and differentiation: HOX genes in muscle cells. Epigen. Chromatin 2013, 6, 25. [Google Scholar] [CrossRef]
- Tsumagari, K.; Baribault, C.; Terragni, J.; Varley, K.E.; Gertz, J.; Pradhan, S.; Baddoo, M.; Crain, C.M.; Song, L.; Crawford, G.E.; et al. Early de novo DNA methylation and prolonged demethylation in the muscle lineage. Epigenetics 2013, 8, 317–332. [Google Scholar] [CrossRef]
- Lacey, M.R.; Baribault, C.; Ehrlich, M. Modeling, simulation and analysis of methylation profiles from reduced representation bisulfite sequencing experiments. Stat. Appl. Genet. Mol. Biol. 2013, 12, 723–742. [Google Scholar]
- Venza, I.; Visalli, M.; Fortunato, C.; Ruggeri, M.; Ratone, S.; Caffo, M.; Caruso, G.; Alafaci, C.; Tomasello, F.; Teti, D.; et al. PGE2 induces interleukin-8 derepression in human astrocytoma through coordinated DNA demethylation and histone hyperacetylation. Epigenetics 2012, 7, 1315–1330. [Google Scholar] [CrossRef]
- Wang, T.; Chen, M.; Liu, L.; Cheng, H.; Yan, Y.E.; Feng, Y.H.; Wang, H. Nicotine induced CpG methylation of Pax6 binding motif in StAR promoter reduces the gene expression and cortisol production. Toxicol. Appl. Pharmacol. 2011, 257, 328–337. [Google Scholar] [CrossRef]
- Wang, R.Y.-H.; Zhang, X.-Y.; Ehrlich, M. A human DNA-binding protein is methylation-specific and sequence-specific. Nucleic Acids Res. 1986, 14, 1599–1614. [Google Scholar] [CrossRef]
- Lacey, M.R.; Ehrlich, M. Modeling dependence in methylation patterns with application to ovarian carcinomas. Stat. Appl. Genet. Mol. Biol. 2009, 8. Article 40. [Google Scholar]
- Chen, Z.X.; Riggs, A.D. Maintenance and regulation of DNA methylation patterns in mammals. Biochem. Cell Biol. 2005, 83, 438–448. [Google Scholar] [CrossRef]
- Brunner, A.L.; Johnson, D.S.; Kim, S.W.; Valouev, A.; Reddy, T.E.; Neff, N.F.; Anton, E.; Medina, C.; Nguyen, L.; Chiao, E.; et al. Distinct DNA methylation patterns characterize differentiated human embryonic stem cells and developing human fetal liver. Genome Res. 2009, 19, 1044–1056. [Google Scholar]
- Song, F.; Mahmood, S.; Ghosh, S.; Liang, P.; Smiraglia, D.J.; Nagase, H.; Held, W.A. Tissue specific differentially methylated regions (TDMR): Changes in DNA methylation during development. Genomics 2009, 93, 130–139. [Google Scholar] [CrossRef]
- Myers, R.M.; Stamatoyannopoulos, J.; Snyder, M.; Dunham, I.; Hardison, R.C.; Bernstein, B.E.; Gingeras, T.R.; Kent, W.J.; Birney, E.; Wold, B.; et al. A user’s guide to the encyclopedia of DNA elements (ENCODE). PLoS Biol. 2011, 9, e1001046. [Google Scholar] [CrossRef] [Green Version]
- Ernst, J.; Kheradpour, P.; Mikkelsen, T.S.; Shoresh, N.; Ward, L.D.; Epstein, C.B.; Zhang, X.; Wang, L.; Issner, R.; Coyne, M.; et al. Mapping and analysis of chromatin state dynamics in nine human cell types. Nature 2011, 473, 43–49. [Google Scholar] [CrossRef]
- Kent, W.J.; Sugnet, C.W.; Furey, T.S.; Roskin, K.M.; Pringle, T.H.; Zahler, A.M.; Haussler, D. UCSC Genome Browser. Available online: http://ucsc.genome.edu/ (accessed on 17 April 2014).
- Lacey, M. RRBS Simulation, Modeling and Analysis Project. Available online: http://rrbs-sim.r-forge.r-project.org/ (accessed on 17 April 2014).
- Lawrence, M.; Gentleman, R.; Carey, V. rtracklayer: An R package for interfacing with genome browsers. Bioinformatics 2009, 25, 1841–1842. [Google Scholar] [CrossRef]
- Song, L.; Zhang, Z.; Grasfeder, L.L.; Boyle, A.P.; Giresi, P.G.; Lee, B.K.; Sheffield, N.C.; Graf, S.; Huss, M.; Keefe, D.; et al. Open chromatin defined by DNaseI and FAIRE identifies regulatory elements that shape cell-type identity. Genome Res. 2011, 21, 1757–1767. [Google Scholar] [CrossRef]
- Trapnell, C.; Roberts, A.; Goff, L.; Pertea, G.; Kim, D.; Kelley, D.R.; Pimentel, H.; Salzberg, S.L.; Rinn, J.L.; Pachter, L. Differential gene and transcript expression analysis of RNA-seq experiments with TopHat and Cufflinks. Nat. Protoc. 2012, 7, 562–578. [Google Scholar] [CrossRef]
- Toth, M.; Lichtenberg, U.; Doerfler, W. Genomic sequencing reveals a 5-methylcytosine-free domain in active promoters and the spreading of preimposed methylation patterns. Proc. Natl. Acad. Sci. USA 1989, 86, 3728–3732. [Google Scholar] [CrossRef]
- Nguyen, C.; Liang, G.; Nguyen, T.T.; Tsao-Wei, D.; Groshen, S.; Lubbert, M.; Zhou, J.H.; Benedict, W.F.; Jones, P.A. Susceptibility of nonpromoter CpG islands to de novo methylation in normal and neoplastic cells. J. Natl. Cancer Inst. 2001, 93, 1465–1472. [Google Scholar] [CrossRef]
- Tsumagari, K.; Chang, S.-C.; Lacey, M.; Baribault, C.; Chittur, S.V.; Sowden, J.; Tawil, R.; Crawford, G.E.; Ehrlich, M. Gene expression during normal and FSHD myogenesis. BMC Med. Genomics 2011, 4, 67. [Google Scholar] [CrossRef]
- Ernst, J.; Kellis, M. Discovery and characterization of chromatin states for systematic annotation of the human genome. Nat. Biotechnol. 2010, 28, 817–825. [Google Scholar] [CrossRef] [Green Version]
- Hagarman, J.A.; Motley, M.P.; Kristjansdottir, K.; Soloway, P.D. Coordinate regulation of DNA methylation and H3K27me3 in mouse embryonic stem cells. PLoS One 2012, 8, e53880. [Google Scholar]
- Mohn, F.; Weber, M.; Rebhan, M.; Roloff, T.C.; Richter, J.; Stadler, M.B.; Bibel, M.; Schubeler, D. Lineage-specific polycomb targets and de novo DNA methylation define restriction and potential of neuronal progenitors. Mol. Cell 2008, 30, 755–766. [Google Scholar] [CrossRef]
- McLean, C.Y.; Bristor, D.; Hiller, M.; Clarke, S.L.; Schaar, B.T.; Lowe, C.B.; Wenger, A.M.; Bejerano, G. GREAT improves functional interpretation of cis-regulatory regions. Nat. Biotechnol. 2010, 28, 495–501. [Google Scholar] [CrossRef]
- Riazuddin, S.; Ahmed, Z.M.; Fanning, A.S.; Lagziel, A.; Kitajiri, S.; Ramzan, K.; Khan, S.N.; Chattaraj, P.; Friedman, P.L.; Anderson, J.M.; et al. Tricellulin is a tight-junction protein necessary for hearing. Am. J. Hum. Genet. 2006, 79, 1040–1051. [Google Scholar] [CrossRef]
- Globisch, D.; Munzel, M.; Muller, M.; Michalakis, S.; Wagner, M.; Koch, S.; Bruckl, T.; Biel, M.; Carell, T. Tissue distribution of 5-hydroxymethylcytosine and search for active demethylation intermediates. PLoS One 2011, 5, e15367. [Google Scholar]
- Koch, C.M.; Suschek, C.V.; Lin, Q.; Bork, S.; Goergens, M.; Joussen, S.; Pallua, N.; Ho, A.D.; Zenke, M.; Wagner, W. Specific age-associated DNA methylation changes in human dermal fibroblasts. PLoS One 2011, 6, e16679. [Google Scholar] [CrossRef]
- Rothbart, S.B.; Krajewski, K.; Nady, N.; Tempel, W.; Xue, S.; Badeaux, A.I.; Barsyte-Lovejoy, D.; Martinez, J.Y.; Bedford, M.T.; Fuchs, S.M.; et al. Association of UHRF1 with methylated H3K9 directs the maintenance of DNA methylation. Nat. Struct. Mol. Biol. 2012, 19, 1155–1160. [Google Scholar] [CrossRef]
- Liang, P.; Song, F.; Ghosh, S.; Morien, E.; Qin, M.; Mahmood, S.; Fujiwara, K.; Igarashi, J.; Nagase, H.; Held, W.A. Genome-wide survey reveals dynamic widespread tissue-specific changes in DNA methylation during development. BMC Genomics 2011, 12, 231. [Google Scholar] [CrossRef]
- Okitsu, C.Y.; Hsieh, C.L. DNA methylation dictates histone H3K4 methylation. Mol. Cell. Biol. 2007, 27, 2746–2757. [Google Scholar] [CrossRef]
- Chen, Y.; Wang, K.; Qian, C.N.; Leach, R. DNA methylation is associated with transcription of Snail and Slug genes. Biochem. Biophys. Res. Commun. 2012, 430, 1083–1090. [Google Scholar]
- De Andres, M.C.; Imagawa, K.; Hashimoto, K.; Gonzalez, A.; Roach, H.I.; Goldring, M.B.; Oreffo, R.O. Loss of methylation in CpG sites in the NF-kappaB enhancer elements of iNOS is responsible for gene induction in human articular chondrocytes. Arthritis Rheum. 2013, 65, 732–742. [Google Scholar] [CrossRef]
- Liang, Y.; Wang, P.; Zhao, M.; Liang, G.; Yin, H.; Zhang, G.; Wen, H.; Lu, Q. Demethylation of the FCER1G promoter leads to FcepsilonRI overexpression on monocytes of patients with atopic dermatitis. Allergy 2012, 67, 424–430. [Google Scholar] [CrossRef]
- Singh, M.K.; Petry, M.; Haenig, B.; Lescher, B.; Leitges, M.; Kispert, A. The T-box transcription factor Tbx15 is required for skeletal development. Mech. Dev. 2005, 122, 131–144. [Google Scholar] [CrossRef]
- Schleinitz, D.; Bottcher, Y.; Bluher, M.; Kovacs, P. The genetics of fat distribution. Diabetologia 2014, 57, 1276–1286. [Google Scholar]
- De Wilde, J.; Hulshof, M.F.; Boekschoten, M.V.; de Groot, P.; Smit, E.; Mariman, E.C. The embryonic genes Dkk3, Hoxd8, Hoxd9 and Tbx1 identify muscle types in a diet-independent and fiber-type unrelated way. BMC Genomics 2010, 11, 176. [Google Scholar] [CrossRef]
- Walden, T.B.; Petrovic, N.; Nedergaard, J. PPARalpha does not suppress muscle-associated gene expression in brown adipocytes but does influence expression of factors that fingerprint the brown adipocyte. Biochem. Biophys. Res. Commun. 2010, 397, 146–151. [Google Scholar] [CrossRef]
- Cao, Y.; Yao, Z.; Sarkar, D.; Lawrence, M.; Sanchez, G.J.; Parker, M.H.; MacQuarrie, K.L.; Davison, J.; Morgan, M.T.; Ruzzo, W.L.; et al. Genome-wide MyoD binding in skeletal muscle cells: a potential for broad cellular reprogramming. Dev. Cell 2010, 18, 662–674. [Google Scholar] [CrossRef]
- Chelbi, S.T.; Doridot, L.; Mondon, F.; Dussour, C.; Rebourcet, R.; Busato, F.; Gascoin-Lachambre, G.; Barbaux, S.; Rigourd, V.; Mignot, T.M.; et al. Combination of promoter hypomethylation and PDX1 overexpression leads to TBX15 decrease in vascular IUGR placentas. Epigenetics 2011, 6, 247–255. [Google Scholar] [CrossRef]
- Hume, D.A.; Summers, K.M.; Raza, S.; Baillie, J.K.; Freeman, T.C. Functional clustering and lineage markers: Insights into cellular differentiation and gene function from large-scale microarray studies of purified primary cell populations. Genomics 2010, 95, 328–338. [Google Scholar] [CrossRef]
- Wagner, E.J.; Carpenter, P.B. Understanding the language of Lys36 methylation at histone H3. Nat. Rev. Mol. Cell. Biol. 2012, 13, 115–126. [Google Scholar] [CrossRef]
- Ho, L.L.; Sinha, A.; Verzi, M.; Bernt, K.M.; Armstrong, S.A.; Shivdasani, R.A. DOT1L-mediated H3K79 methylation in chromatin is dispensable for Wnt pathway-specific and other intestinal epithelial functions. Mol. Cell. Biol. 2013, 33, 1735–1745. [Google Scholar] [CrossRef]
- Steger, D.J.; Lefterova, M.I.; Ying, L.; Stonestrom, A.J.; Schupp, M.; Zhuo, D.; Vakoc, A.L.; Kim, J.E.; Chen, J.; Lazar, M.A.; et al. DOT1L/KMT4 recruitment and H3K79 methylation are ubiquitously coupled with gene transcription in mammalian cells. Mol Cell Biol 2008, 28, 2825–2839. [Google Scholar] [CrossRef]
- Geyh, S.; Oz, S.; Cadeddu, R.P.; Frobel, J.; Bruckner, B.; Kundgen, A.; Fenk, R.; Bruns, I.; Zilkens, C.; Hermsen, D.; et al. Insufficient stromal support in MDS results from molecular and functional deficits of mesenchymal stromal cells. Leukemia 2013, 27, 1841–1851. [Google Scholar] [CrossRef]
- Paylor, R.; Glaser, B.; Mupo, A.; Ataliotis, P.; Spencer, C.; Sobotka, A.; Sparks, C.; Choi, C.H.; Oghalai, J.; Curran, S.; et al. Tbx1 haploinsufficiency is linked to behavioral disorders in mice and humans: Implications for 22q11 deletion syndrome. Proc. Natl. Acad. Sci. USA 2006, 103, 7729–7734. [Google Scholar] [CrossRef]
- Lausch, E.; Hermanns, P.; Farin, H.F.; Alanay, Y.; Unger, S.; Nikkel, S.; Steinwender, C.; Scherer, G.; Spranger, J.; Zabel, B.; et al. TBX15 mutations cause craniofacial dysmorphism, hypoplasia of scapula and pelvis, and short stature in Cousin syndrome. Am. J. Hum. Genet. 2008, 83, 649–655. [Google Scholar] [CrossRef]
- Jacquemin, P.; Hwang, J.J.; Martial, J.A.; Dolle, P.; Davidson, I. A novel family of developmentally regulated mammalian transcription factors containing the TEA/ATTS DNA binding domain. J. Biol. Chem. 1996, 271, 21775–21785. [Google Scholar]
- Benhaddou, A.; Keime, C.; Ye, T.; Morlon, A.; Michel, I.; Jost, B.; Mengus, G.; Davidson, I. Transcription factor TEAD4 regulates expression of myogenin and the unfolded protein response genes during C2C12 cell differentiation. Cell Death Differ. 2012, 19, 220–231. [Google Scholar] [CrossRef]
- Rebhan, M.; Chalifa-Caspi, V.; Prilusky, J.; Lancet, D. GeneCards. Available online: http://www.genecards.org/ (accessed on 17 April 2014).
- Thierry-Mieg, D.; Thierry-Mieg, J. AceView: A comprehensive cDNA-supported gene and transcripts annotation. Genome Biol. 2006, 7, S12.11–S12.14. [Google Scholar]
- Jongstra-Bilen, J.; Jongstra, J. Leukocyte-specific protein 1 (LSP1): A regulator of leukocyte emigration in inflammation. Immunol. Res. 2006, 35, 65–74. [Google Scholar] [CrossRef]
© 2014 by the authors; licensee MDPI, Basel, Switzerland. This article is an open access article distributed under the terms and conditions of the Creative Commons Attribution license (http://creativecommons.org/licenses/by/3.0/).
Share and Cite
Chandra, S.; Baribault, C.; Lacey, M.; Ehrlich, M. Myogenic Differential Methylation: Diverse Associations with Chromatin Structure. Biology 2014, 3, 426-451. https://doi.org/10.3390/biology3020426
Chandra S, Baribault C, Lacey M, Ehrlich M. Myogenic Differential Methylation: Diverse Associations with Chromatin Structure. Biology. 2014; 3(2):426-451. https://doi.org/10.3390/biology3020426
Chicago/Turabian StyleChandra, Sruti, Carl Baribault, Michelle Lacey, and Melanie Ehrlich. 2014. "Myogenic Differential Methylation: Diverse Associations with Chromatin Structure" Biology 3, no. 2: 426-451. https://doi.org/10.3390/biology3020426