
Assessing Risks in Dairy Supply Chain Systems: A System Dynamics Approach
by
 , ,
, ,
Maryam Azizsafaei
1,*, 
Amin Hosseinian-Far
1,* ,
,
Rasoul Khandan
2,
Dilshad Sarwar
1 and
Alireza Daneshkhah
3 1
Centre for Sustainable Business Practices (CSBP), Faculty of Business and Law, University of Northampton, Northampton NN1 5PH, UK
2
College of Engineering and Physical Sciences, Aston University, Birmingham B4 7ET, UK
3
Research Centre for Computational Science and Mathematical Modelling, Coventry University, Coventry CV1 5FB, UK
*
Authors to whom correspondence should be addressed.
Systems 2022, 10(4), 114; https://doi.org/10.3390/systems10040114
Submission received: 19 June 2022
/
Revised: 29 July 2022
/
Accepted: 31 July 2022
/
Published: 4 August 2022
(This article belongs to the Section Supply Chain Management)
Abstract
:Due to the dynamic nature of the food supply chain system, food supply management could suffer because of, and be interrupted by, unforeseen events. Considering the perishable nature of fresh food products and their short life cycle, fresh food companies feel immense pressure to adopt an efficient and proactive risk management system. The risk management aspects within the food supply chains have been addressed in several studies. However, only a few studies focus on the complex interactions between the various types of risks impacting food supply chain functionality and dynamic feedback effects, which can generate a reliable risk management system. This paper strives to contribute to this evident research gap by adopting a system dynamics modelling approach to generate a systemic risk management model. The system dynamics model serves as the basis for the simulation of risk index values and can be explored in future work to further analyse the dynamic risk’s effect on the food supply chain system’s behaviour. According to a literature review of published research from 2017 to 2021, nine different risks across the food supply chain were identified as a subsection of the major risk categories: macro-level and operational risks. Following this stage, two of the risk groups identified first were integrated with a developed system dynamics model to conduct this research and to evaluate the interaction between the risks and the functionality of the three main dairy supply chain processes: production, logistics, and retailing. The key findings drawn from this paper can be beneficial for enhancing managerial discernment regarding the critical role of system dynamics models for analysing various types of risks across the food supply chain process and improving its efficiency.
1. Introduction
Supply chains can face general risks and their own unique vulnerabilities in the light of disruptive events caused by human beings and natural causes [1,2,3,4]. Aligned with significant food affordability, considering various income rates and a growing disconnection between consumers and food supplies, food is considered to be a vital and infinite commodity for meeting basic human requirements [3,5]. Due to the perishable nature of food products within food supply chains (FSCs), their specific characteristics, such as a short shelf, the considerable variation in availability, and the importance of accessibility to the right amount of quality raw materials, make them more complicated than other supply chains [5,6,7,8,9]. Perishable food products, including fruits, vegetables, dairy products, and meat, could be more likely to suffer the most among FSCs. As the perishable products require reliable, accurate, and quick harvesting, procurement, processing, and marketing, any problem in this process could cause a considerable amount of food waste, financial and economic crisis, and societal impairment across the marketplace [10]. To have greater control over food insecurity, having access to real-time and reliable information about the potential risks and their possible impact on consumer behaviour is essential for food supply chain managers [11]. In response to the vulnerabilities and risks of FSCs, various literature works and studies have pointed out the necessity of developing an efficient risk management system [12,13].
Within this study a review of prior literature over the past five years has been conducted, which indicates a growing attention to the modelling of the dynamic interplay of risks in FSCs, particularly with regard to perishable and dairy products. The critical review of the literature shows two important research gaps. First, most of these studies have covered only the logical modelling phase, while other phases, have been ignored. Second, the present literature has explored limited or some specific types of risks. This study has not concentrated on the limited traditional risks such as the bullwhip effect or inventory risks. To fill this gap, four top-risk groups, operational-related risks, market-related risks, managerial level risks, and external environment risks, were extracted and are evaluated in Section 4, and as a result, two main groups have been addressed as the main problems in this research.
The contribution of this paper is to evaluate the effects of a broader range of risks on dairy FSCs. This research aims to understand the dynamics of dairy FSCs affected by the different risks and to provide insights for supply chain managers in the context of FSCs. Evaluating different combinations of risks related to the main dairy supply chain process, including production, logistics, and retail, can help practitioners and managers improve the performance of dairy supply chains. Different analytical tools, such as statistical modelling methods, are applied to support decision makers with the required evidence to make decisions regarding complex problems. However, these techniques are unable to provide feedback regarding complex system behaviour due to the non-linear interactions between the system’s components. Subsequently, decision makers require the sort of tools that are more appropriate for complex environmental issues [14]. To evaluate a complex food supply chain system, simulation is considered an effective approach as it incorporates multi-level decision-making criteria in relation to the various types of risks within food supply chain systems and their sub-systems. Three common approaches to systems modelling and simulation include system dynamics (SD), which is applied at the macro-level, agent-based modelling (ABM), which is useful at a micro-level [15], and discrete event simulation (DES), with considerable emphasis on resource utilisation and wait time [16]. These three models are employed in the various fields of application ranging from ecology to economics [14] to explain dynamic phenomena in complex networks [17]. Although both SD and AB models are applicable to complex and dynamic systems such as the food industry [18], the SD approach follows the aggregation philosophy, considering causal relations between system components and feedback loops. In contrast, AB modelling is not based on aggregation philosophy, and its main focus is on the micro-level dynamic actions among individual constituent agents [14,16,19,20]. On the other hand, the DES model has a microscopic view and discovers more minor details of the relevant system, whereas SD has a top-down macroscopic perspective. In addition, DES is a stochastic modelling technique; therefore, to achieve a complete understanding of the system, it should be run multiple times to deal with randomness, whereas the SD model, due to its deterministic characteristics, will provide the same results in all runs; so, there is no need for the SD model to run more than once [21]. Considering the advantages of system dynamics as one of the most widely used simulation approaches, this model was adopted in this study, and through simulation, it can improve the discriminatory power of the decision making by predicting and analysing the dynamic behaviour of various controlled and uncontrolled risks with a negative impact on food supply chain functionality [22]. Such a modelling approach can be very helpful for supply chain managers within long-term and management strategies and planning [23]. In addition, by aligning with simulation modelling objectives which capture the dynamic interactions of the risks associated with the different processes across the dairy FSC, SD modelling can help this study to achieve these objectives by generating the conceptual model using a computer-based simulation model [24].
The rest of the paper is structured as follows: Section 2 summarises the current literature in supply chain risk management over the last five years to set and define the problem. Section 3 explains the research method for this study. In Section 4, the main four top-risk categories are evaluated in detail, and as a result, two risk categories were selected for this study. Section 5 and Section 6 include the developed causal loop diagram (CLD) and the stock and flow diagram (SFD) models, respectively. In Section 7, the verification of the model is conducted, and in Section 8, the verified SFD model is integrated with risk factors. Section 9 and Section 10 include the simulation results and a discussion based on defined scenarios. Finally, the paper is concluded in Section 11.
2. Literature Review
Due to the ever-growing complexity of supply network relationships, in addition to significant uncertainty over the years, FSCs have faced many challenges emerging from multiple sources, such as volatility in food prices, variability in weather and climate, food wastages, food insecurity, restricted food trade policies and quality and safety standards, and COVID-19 and Brexit-related impacts on the labour market and trading [25,26,27,28,29]. In terms of the coronavirus pandemic, the executive director of the UN’s World Food Programme has warned that as a result of the pandemic, countries around the world could be headed toward food crises, such as global food catastrophes, starvation, food insecurity, and potentially devastating famines of biblical proportions [30]. Many types of risks can cause significant interruptions in the efficiency of supply chain operations. For FSCs in particular, evaluating risks can positively affect other areas, including sustainability and performance [4].
Identifying the complex interactions among the various types of risks impacting food supply chain functionality and the dynamic feedback effects throughout this process is essential. This interaction is considered complex because it includes many system components and continually changes over time. Therefore, identifying and managing the risks and uncertainty play crucial roles in different businesses [31]. Subsequently, supply chain managers in different industries should apply an effective method to approach these risks, and this describes the acceleration of the research that focuses on supply chain risk management (SCRM) after 2000 [32].
System Dynamics Modeling on Food Supply Chain Risk Management
As listed in Table 1, some of the published research from 2017 to 2021 has been reviewed to identify the main risk factors that have been evaluated in recent years. Bashiri et al. [18] examined the sustainability risks for the Indonesia–UK coffee supply chain with regard to the two different perspectives of farmers and exporters using SD models. In this research, in the scenario selection part, they applied the TOPSIS approach to select the most preferred scenarios in their study. Accordingly, Bashiri et al. [18] reported climate change, area increasing rate, price, compliance with regulations, exchange rate, transportation distribution, trade policy, market demand, and unavailability of facilities as the greatest potential sustainability risks from the viewpoints of the farmers and the exporters. In a review study by Estay et al. [33], the authors focused on research works that have addressed the various challenges to FSCs using SD methods. The main challenges identified in this review study include strategic problems such as variability in demand and operational problems such as packaging issues or transportation inefficiency.
Rathore et al. [34] used the SD technique to evaluate the interactions among the food grain transportation variables, such as inventory level, labour availability, transportation capacity, and backlog order, in the presence of key significant risks, such as inappropriate transportation route selection, delay in information sharing, theft, labour strikes, and other risk factors. It is clear that based on the FSC types and characteristics, the risks reported in the different research works vary. Zhu and Krikke [35] conducted a piece of research addressing those sorts of risk factors that can occur after an outbreak such as COVID-19. Zhu and Krikke [35] argue that product shortage due to capacity distributions for producers and logistics service providers, which can lead to post-disaster hoarding, could be considered the possible outcomes of an outbreak for dairy products such as milk, butter, and cheese. They have applied SD to identify the dominant loops promoting domestic-demand generation. Arwani et al. [36] also examined the impact of the contamination risk in the milk-processing industry in Indonesia. In this study, the impact of adulteration risks on different factors, such as quality of products, shipping price, supply chain transparency, and raw materials prices, is considered. Arwani et al. [36] used SD modelling for the risks associated with the milk-processing supply chain and evaluated the complex problems for the variables considered in their model. However, two important simulation and sensitivity analysis phases are missing in the study by Arwani et al. [36]. In addition, Orjuela-Castro et al. [37] examined a case study of the mango supply chain in Cundinamarca-Bogotá using the SD method. Their research investigated the impact of seasonality and demand discrepancy on the mango supply chain, particularly with regard to logistics performance. Other risk factors that have been covered in the recent literature include food quality, price, lack of transparency, production capacity, seasonality problems, operational costs, supply and demand risks, macro-level risks, and food security issues, as represented in Table 1. The following studies and identified risk factors are the basis for the problem articulation section in this study. In this research, SD modelling has been applied to analyse the dynamic interplay of the risks in a cheese supply chain over three different main processes (i.e., productions, transportation, and retail), and a wider range of risks is considered, including internal and external risk factors.

Table 1.
Summary of the supply chain risk management assessment literature adapted from [38].
Table 1.
Summary of the supply chain risk management assessment literature adapted from [38].
| Author (s) | Year | Methodology | Risks Involve |
|---|---|---|---|
| Bashiri et al. [18] | 2021 | SD and TOPSIS |
|
| Estay et al. [33] | 2021 | Review paper for research used SD |
|
| Rathore et al. [34] | 2020 | SD and AHP-Grey TOPSIS |
|
| Puertas et al. [39] | 2020 | TOPSIS, Elimination et Choix Traduisant la Realité (ELECTRE), Cross-Efficiency (CE) |
|
| Zhu and Krikke [35] | 2020 | SD |
|
| Mithun Ali et al. [3] | 2019 | Pareto analysis and DEMATEL |
|
| Behzadi et al. [40] | 2018 | Review paper |
|
| Arwani et al. [36] | 2018 | SD |
|
| Liu et al. [41] | 2018 | SD |
|
| Orjuela-Castro et al. [37] | 2017 | SD |
|
| Nakandala et al. [42] | 2017 | Fuzzy logic and hierarchical holographic modelling |
|
| Prakash et al. [43] | 2017 | ISM |
|
| Tsolakis and Srai [44] | 2017 | SD |
|
The typical process for the application of SD is presented in Figure 1. Further details on the application of SD is outlined within the research method section of this paper.
3. Research Method
The SD approach was introduced by Forrester [45]. The SD method is an effective quantitative modelling tool and simulation technique to study complex system structures and gain perceptions for long-term decision-making in different industries [46]. In many research works, system dynamics has been applied in wide range of areas and problems [47]. SD can provide a holistic view of various supply chain systems to analyse the linkage between system components and generate feedback. The system dynamics approach applied in this study focuses on dairy supply chain systems to measure their functionality under different unforeseen negative events and to understand the dynamic behaviour in such a complex system. As the dairy supply chain is dynamic and includes feedback, SD is considered to be an appropriate modelling tool for this study. Garbolino et al. [48], Morecroft [49], and Gonçalves et al. [50] have broadly adopted the SD technique to analyse and mitigate various risk types. Rathore et al. [34] have extended these efforts by adding essential steps in SD modelling [51]. The SD model developed in this work has been validated and verified through proposed tests provided by Sterman [52] and Arwani et al. [36], such as model structural tests, sensitivity tests, and extreme condition tests.
The problem and boundaries of the system must be described in the first phase. The analysis will begin with the logical modelling in order to identify the variables that cause undesirable system behaviour. In this phase, along with the problem definition and the development of the causal loop diagram (CLD), great insights can be obtained to support the system’s main aim, i.e., improvement. Following the first phase, in the second phase, after creating the stock and flow diagram (SFD), the relevant equations of the level and rate of the system dynamics model will be formulated using the initially described system. This formulation step is essential for simulating and developing an explicit system using the incomplete description in the previous stage. This dynamic back-and-forth movement between the stages occurs at every level. Some identified gaps and inconsistencies in the initial model can be corrected through the formulation process. Once the formulation has been completed, the verification and validation of the simulation models will examine the developed model with a view to generating an accurate and credible simulation. In the third phase, the selected risks should be integrated with the main SFD model, and after defining individual scenarios for each defined risk, the system should be simulated to examine the system behaviour changes regarding the integrated model affected by the added risk.
4. Problem Articulation
4.1. Risk
Considering what the existing literature has discussed in the following sections, the risks can be classified into four top-risk groups: operational-related risks, market-related risks, managerial level risks, and external environment risks. Each top-risk group and its characteristics are detailed along with a taxonomic diagram to provide the risk sources in the examined literature.
4.1.1. Operational Risks
According to Ali and Gurd [53] and Xiaoping [54], operational inefficiencies in different aspects, such as process, system, people, and operational risks, are the leading cause of economic losses. These operational risks can also lead to final product damage, delay in product delivery, or reputation risk [55]. In addition, lack of traceability, according to Aung and Chang [56], can lower the capability of trace-back and trace-forward throughout the food supply chain systems. Due to quality or safety standard breaches, it can also adversely affect the monitoring and identifying of product recall. In order to mitigate the risks associated with various food supply chain processes, holistic control of the entire chain, from farm to fork, is essential [57]. The essential risks associated with the examined literature’s operational processes include supply-related risks, inventory-related risks, logistical- and infrastructural-related risks, demand-related risks, management-related risks, capacity risks, lead-time, and security problems. Figure 2 provides a diagrammatic view of these operational risks identified in the literature.
4.1.2. Market Risks
One of the most globally dynamic and rapidly evolving industries is the food industry. Due to the challenging climate and special characteristics of the food industry, identifying and managing the related risks, events, and uncertainties across various supply chain processes is vital. Market risks include a broad classification of the market variations that impact the supply chain performance and behavioural operations across the industry [58]. The food supply chain deals with significant market-related risks across inputs and outputs that can have short-term effects such as a single growing season or long-term impacts over the production cycle. Within the FSCRM context, market risks are emphasised with price fluctuation, quality, exchange rate, accessibility, and availability of the essential products and services required by customers [59]. One of the critical approaches for the managing of the market risk associated with the food supply chain is supply chain flexibility; this is an essential ability for all supply chain members (i.e., internally and externally). This approach supports food supply chain members in responding quickly to increasing market changes and customer expectations within budget and on time and at a tremendous organisational performance level [60]. Figure 3 provides a diagrammatic view of these market-related risks identified in the literature.
4.1.3. Managerial Level Risks
The preliminary studies represent a considerable focus on food supply chain risk management, which has shifted from operational level risks to more managerial and strategic level risks due to various phenomena such as globalisation and complexity (e.g., [3,25,36]). Different studies propose the following second-order themes as the subsets of the managerial level risk: lack of skilled personnel, poor leadership, lack of coordination and inappropriate network design, and lack of information sharing. Figure 4 illustrates a schematic view of the managerial level risks proposed by the selected studies in this research project.
4.1.4. External Environment Risks
According to the literature, supply chain efficiency in any industry is significantly affected by various external environment elements, including the political, economic, socio-cultural, legislative, ecological, and technological conditions [61]. When conducting risk planning and management, it is crucial to identify the external risks along with the internal ones. In this study, the following risks are selected as the main sub-risks in the external environment risks category: political instability, regulation changes, climate change, natural disasters, advanced technology, economic factors, spreading diseases, and social challenges. Figure 5 represents a schematic view of the external environment risks proposed by the selected studies in this study. In addition, from the public perspective, there are many concerns regarding the modern food system that can negatively impact natural resources, including soil degradation, which is the main cause of inefficient land use, loss of biodiversity, and water pollution. Moreover, increasing food production and consumption levels as a significant contributor to greenhouse gas emissions is another public concern. In addition, food safety and security, animal welfare, ethical risks of food production, and fair trade, particularly in developing countries, are frequent consumer expectations, and neglecting these aspects can put FSCs under high pressure [62].
In this study, as illustrated in Figure 6, the main potential risks involved in the fresh food supply chain system are selected based on the existing research (e.g., [2,12,36,43,61,62]) and the literature review presented in Table 1. Macro-level and operational risk categories can cover the most important risks in the above categories. In addition, this study has used secondary data; however, one of the most challenging issues in pertinent research is data scarcity when looking for relevant and appropriate secondary data. Therefore, this study concentrates on only two risk groups, based on the data availability. The definitions of the selected risks are presented in Table 2.
Disruptions as a result of each risk mentioned above can occur at any stage of the FSCs [66]. However, disruptions caused by natural disaster events have a high chance of involving the entire FSC system [67]. The disruption of FSCs triggered by natural disasters can cause extensive breakdowns in transportation and production parameters, particularly in rural areas where there is insufficient infrastructure [68]. Concerning disease risks, the main focus of this research is the COVID-19 pandemic’s impact on FSCs. Hobbs [69] stated that the COVID-19 pandemic could have had a disrupting effect on both the demand side (e.g., consumer panic behaviour and damaging service sectors) and the supply side (e.g., labour shortages and disruption in supply network). Applying an agile approach in FSCs to adjust promptly to demand-side shocks and supply-side disruptions is essential during and after a pandemic crisis. In terms of labour strikes as one of the important hazards in FSCs, as shown in Figure 7, according to the Office for National Statistics [70] the median number of working days lost per stoppage in the UK as a result of labour strike events has significantly increased since 2015. The labour strike is the major cause of financial crisis for different type of supply chains, particularly the FSCs that heavily depend on labour activities.
Accurate demand prediction can support FSC managers in determining the right amount of inventory and in decreasing the level of waste and loss due to overstocking. In addition, more accurate demand prediction can decrease the shipping lead time and inventory holding cost [71]. However, due to the unique features of FSCs, such as the high complexity level, dynamic nature, perishability, and multi-metrics trade-off, it is not always possible for FSC managers to predict the accurate amount of demand which is the major cause of demand fluctuation events [71]. Regarding supply quality risks, supply chain members heavily rely on inspections such as ISO standards and the Hazard Analysis and Critical Control Point (HACCP) system regarding food quality demand. Such standards and systems cannot provide an accurate and effective procedure to manage quality-related risks for the food supply chain due to different limitations such as the bureaucratic processes and many complex documents required in these systems [65].
4.2. Risk Dimensions
Ren et al. [72], Mokhtari et al. [73], and Rausand [74] argue that to determine the risk, three key dimensions should be quantified: the relative likelihood/probability of risk occurrence, the consequence/impact of occurrence, and the extent/severity of risk occurrence. The probability is a measure of the relative frequency of the occurrence of a risk event. Consequence/impact describes the environmental impact if an undesired risk event occurs. Extent/severity concerns the extent of the possible adverse consequences when a specific unpleasant event does occur. The severity is generally evaluated based on expert or practitioner judgement and statistical analysis of the historical data [75]. As illustrated in Figure 8, the following three dimensions of risk are considered in this research:
- Probability/likelihood of a risk occurrence.
- Impact/consequence of a risk event.
- The severity of an adverse risk when that risk does occur, which is calculated by multiplying the probability by the impact.
5. Developing Causal Loop Diagram for Cheese Products System
5.1. The CLD for Risk Factors
The main feedback mechanisms will be represented using a causal loop diagram [76]. In this section, a CLD for the risk factors is explained. As presented in Figure 8, the arrows represent the direction of a causal influence between the system components. The origin of the arrows indicates the causative variable that ends with the affected variable. The positive and negative relationship between these variables is described by the “+” or “-” symbol inside or outside the arrow.
A risk assessment matrix, as represented in Table 3, enables this research to calculate the project risk index value by identifying an equivalent value for each likelihood and impact level. In addition, In order to calculate the risk index value, the likelihood and impact value of each risk, as shown in Table 4, are extracted from [42]. Nakandala [42] collected risk index values from managers in various fresh food companies. However, for risk events depending on the system’s recovery rate, risk damage can reduce and recover over time and on a step-by-step basis.
5.2. The Dynamic Productions System
Defra [77], in the Defra Family Food dataset, report that the consumption of liquid milk in the UK (per capita consumption) has decreased by less than 50% since 1974. The annual average per capita consumption dropped from 140 to 70 litres between 1974 and 2018. However, dairy product consumption, such as cheese, has had significant growth and continues to see the highest demand among the other dairy manufactured products. The increasing demand for dairy products directly affects how processors order the raw milk delivered from farms. Over the past century, the volume of raw milk used by cheese manufacturers has increased by 1.09 billion litres [78]. Developing the processing capacity of the dairy supply chain and applying a proactive approach to predicting the undesired risks is essential in the current shifts in dairy consumption in order to have an agile response to consumer demand. Factors from downstream customers and constraints such as time and schedule should be considered significant for production process operations [79]. To determine the volume of dairy products required to meet consumer demand, the three following essential variables need to be involved: the raw material inventory [80], the labour productivity [81], and the processing equipment capacity [82]. Figure 9 outlines the major feedback mechanisms for determining production capability and describes the interactions between the various components in the production system for the cheese supply chain. In the developed CLD model, the production capacity is in line with the combination of the equipment capacity, labour productivity, and downstream demand to manage the system efficiently. According to the previous literature, different models have been established with a specific concentration on production capacity and the causal interactions and feedback mechanisms between the aforementioned components [18,34,44,79].
5.3. The Dynamic Transportation System
The capacity of the transportation systems is influenced and disturbed by undesirable events, such as congestion problems, natural disasters, demand uncertainty, terrorism, transportation costs, or other disturbances [80,81,82]. The variables that describe transportation capacity are outlined in the CLD, shown in Figure 10. The transportation capacity system is calculated by taking into the account both transporter’s and infrastructure’s capacities [83,84]. According to Gonçalves [85], desired shipments are calculated by considering the backlog ratio and the likely delivery delay. On the other hand, the inventory level for logistics service providers is measured by the inflow of products from the processors and the outflow of products shipped to fulfill retailers’ orders during a certain period of time. Backlog orders need to be considered in the CLD transportation system when shipped orders are further than the shipped dairy products or if the shipped orders cannot keep pace with the retailer or customer demand. The order fulfilment rate is calculated by dividing the orders processed by the total number of customer orders placed. The retailer should determine the ordering policy. The inventory level will be determined using the combination of the ordering policy by the retailer and the volume of production pushed by the processor.
5.4. The Dynamic Retail System
Sales rate depletes the inventory level. The time required for responding to the customers’ demands is known as retailer sales time [86]. Some factors, such as customer demand rate, the economic status of the consumers, and new technologies, have a considerable impact on selling units to consumers. Decreasing the logistics service provider (LSP) shipment rate, the shipment time, and poor product quality can lower the retailer’s inventory and sales rate [34]. Another variable that can improve the accuracy and efficiency of meeting customer orders is order forecast stock, determined based on the historical data on the customer’s orders and the depletion of the retailer inventory [87,88]. However, this variable is out of the scope of this study. The CLD model of the retailer system is shown in Figure 11.
6. SFD Model Development
In this stage, the developed CLD shown in Figure 13 is converted to a stock flow diagram (SFD) using Vensim© software to calculate and indicate the causal relations among the cheese supply chain system variables. The SFD model provides more detailed quantitative information compared to CLD. According to Sterman [52], the SFD categorises the variables into three separate groups: stock, flow, and control variables. The stock/level variables related to the flows are represented as a box icon and utilised to calculate an accumulation/depletion effect on the order products, such as the inventory level [89]. Auxiliary/control variables are defined as variables that influence the flow rate variables to improve the system’s transparency without changing the mathematical structure and are represented in a box with no border. In response to changes in the levels or exogenous influences, the value of the auxiliary changes immediately [90]. Flows/rates perform the change level in the stock/level, such as the flow of materials, product delivery, and capacity recovery through the sales process, and they are drawn as an arrow with a valve [91]. Morecroft [49] stated that feedback loops could be generated through the interaction of stock and flow networks, and factors such as inflows and outflows of one stock can determine the state of other stocks’ values. Table 6 represents the key variables’ major roles in building this research’s cheese supply chain SFD model. In addition, the stock and flow diagram of the cheese supply chain system and the risk-affected system are constructed. Table 7 lists the main equations applied to develop the SFD model in this research. For instance, when a customer orders dairy products as a new order, this order should go into the order backlog before shipping to potential customers. Thus, the order backlog rate is calculated by subtracting the order fulfilment rate from the order rate. Retailer inventory is another example, as listed in Table 7. To calculate the total retail inventory, the total amount of sales should be subtracted from the total value of products shipped by the logistics service provider to the retailer inventory.
Initial Operating Conditions
Some critical initial values need to be determined before developing the SFD model under different scenarios. The model time step for the simulation process in this research was set as a week. The simulation period has been considered as 52 weeks (1 year). Due to the uncertain real customer demand for FSC products [92], the real customer order has been assumed to be a random normal distribution number with 9.8 × 10⁵ as a minimum, 1.58 × 10⁶ as maximum, 1.28 × 10⁶ as mean, and a standard deviation of 1.00 × 10⁵ that needs to be placed weekly. The other initial values for the leading stocks in this research, such as “product order backlog”, “retailer inventory”, “LSP inventory”, “order backlog”, and other simulation inputs, are represented in Table 8. The initial values have been reported in E notation. The initial values are listed in Table 8. The initial variable values in Table 8 are retrieved from relevant research by Zhu et al. [93] and Zhu et al. [35] and other sources. In this research, milk as the primary inbound resource for producing cheese and other ingredients is considered infinite for the cheese producers in the processing phase.
As shown in Figure 14, cheese processing starts with pasteurisation, and in the next stage, acidification should be conducted. In this stage, by adding starter culture and changing the acidity level of the milk, it will start to convert from a liquid to a solid form. As a result of adding acid to the milk, it will turn to a solid mass called “gel” or “coagulum”, and this phase is known as the coagulation process. After separating the curds and whey and processing the curds, the cheese production process is followed by the shaping and salting stages. Finally, the formed and salted cheese is kept in room storage to ripen for three weeks. All of the processes related to cheese production take about 5–6 weeks. The order backlog volume of the production process is demand-driven by retailer orders. Considering the type of cheese and its desired quality level, the cheese maturation period can be between 2 to 16 weeks. Although the ripening period of different types of cheese can be so long, cheese has been categorised as a perishable food product [94]. Retailers should sell the final cheese products in one week. In addition, this research assumed that there is no delivery delay for transporting the cheese products. These initial values have been set as a baseline for the current situation of the system performance.
7. Model Validation and Verification
In order to check the model robustness and verify the model structure, applying the verification and validation process is essential before starting to simulate the risk scenarios. According to Forrester and Senge [96], the verification of an SD model can be confirmed using structural and parameter tests. On the other hand, the validation of the model should be confirmed using two important tests, such as the extreme condition and the dimensional consistency tests. The structural and parameter verification test for this research can be confirmed as the equations and the cause-and-effect relationship between the parameters, which have already been defined using the existing literature (i.e., [18,34,35,44,75,83,93,97,98]).
An extreme condition is another important test that can be performed to check whether the SFD model effectively coincides with the expected behaviour that is assumed for the system. Applying this analysis, by changing some of the parameter values in the developed model and comparing their impact with the expected values of the dynamic variables in the SFD model, the validation of the model can be confirmed. For instance, by decreasing the initial value of the producer order backlog to zero, the product shipment rate should also be equal to zero, as shown in Figure 15. The model can be validated in extreme condition analysis by obtaining a logical outcome [96]. In Figure 15, the red line indicates the initial condition of the product order backlog and the product shipment rate, and the blue line represents the system’s behaviour after decreasing the product order backlog to zero. As is shown in this figure, it can be observed that by decreasing the product order backlog to zero, the value of the product shipment rate has been changed to zero as well, as was expected before, which reconfirms the logical behaviour of the model as part of the validation process.
8. Risk Integration
The risk sub-model, as shown in Figure 17, is generated according to the CLD model presented in Figure 8. The probability and impact values for the relevant variables are extracted from the study of Nakandala et al. [42] and will be entered as input for the SFD model simulation. The risk value of the event is calculated by multiplying the probability and the impact. Regarding assessing the risk effects, this value is determined by examining the system’s behaviour changes stemming from the variation of the risk inputs. However, depending on the system’s recovery rate, the risk damage can reduce and recover over time and on a step-by-step basis. The identified risks in Table 4 are added to the SFD cheese supply chain model. Figure 18 represents the SFD cheese supply chain model after adding the risks. Separate scenarios will develop for each of these identified risks, and in the next stage, the system’s behaviour changes and parameter values will be measured. In reality, the cheese supply chain dynamic system is running along with these types of risks. The identified risks in this study will be considered key independent risks, and the simultaneous effect of two or more independent risks will not be taken into consideration. The interactions between the risks and the supply chain loops are illustrated in Table 9.
Oliva [99] argues that most system dynamics modelling, in terms of the essential feedback loops and the external effects on the system as the main reasons for the salient features of the behaviour, could be presented by a simple explanation. For uncomplicated and simple systems that include few variables, deriving the explanation and interpretation of the simulation experiment results by focusing on the dynamic behaviour of particular feedback loops is feasible. However, for complex systems, the risk of inaccurate justifications or explanations can be increased. Subsequently, an analytical method for improving consistency and rigour across the system is essential for accurate analysis of the final dynamic behaviour results. Selecting an appropriate analytical model is another task that needs to be conducted through future research after the simulation process.
9. Simulation and Results
After validating and verifying the model as outlined in the previous steps, five risk scenarios have been established in two groups. The SD approach is a scenario-based technique and can be applied to observe the impact of changes in different parameters on other variables [51]. These five scenarios include “Natural disaster” (Scenario 1), “Diseases” (Scenario 2), “Labour strikes” (Scenario 3)—these three scenarios are categorised as a macro-level risk group—“Demand fluctuation” (Scenario 4), and “Supply quality risk” (Scenario 5)—these two scenarios are categorised as an operational risk group. The extracted scenarios have been established based on the predicted changes in system behaviour in response to these eight risk scenarios and the existing literature review on FSCs. The input values of the risk scenarios, including probability and impact, have been extracted from the research of Nakandala et al. [42]. The risk sub-model is shown in Figure 8. These risk scenarios can determine the impact of defined risks on the model parameters. The predicted implications of each risk scenario on the model parameter are listed in Table 10. For instance, it indicates that the implication of “Scenario 1” should positively impact the “LSP shipment rate”.
Table 11 represents the performance of the SFD model associated with each risk scenario along with the base value. Each risk scenario includes the maximum, minimum, and average values across the simulation period. The system performance should be compared with the base value after simulating the SFD model using different scenarios. In order to depict this comparison, the following equation has been applied. The extracted results of this comparison, as listed in Table 12, will support decision makers in identifying significant risks in the dynamic and complex FSC system.
9.1. Scenario 1: Natural Disaster
In various research works (e.g., [66,67,100,101]), natural disaster events, such as flooding, climate change, earthquake, snowfall, and volcanic eruptions, have been identified as the key negative risks that can damage the efficiency of transportation systems and the mobility rate of products. For the first risk with a 10% probability and a 0.8 impact as the initial value, it can be predicted that the LSP transportation rate will decrease due to the occurrence of natural disaster events. Moreover, other parameters, such as the LSP inventory level, order fulfilment rate, order backlog, sales rate, and retailer inventory, can be affected due to the occurrence of natural disaster events. As represented in Table 12 and shown in Figure 19, the simulation results proved the effect of natural disasters on the different parameters of the SFD model. For instance, the average LSP shipment rate decreased by approximately 24% from the base value. Subsequently, due to the average transportation disruption, the order fulfilment rate dropped by 24% as well. Following the inability to meet the customer demand, as shown in Figure 19 and Table 12, significant rises are observed in the LSP inventory level and backlog orders. In addition, as a result of the reduction in the LSP shipment rate as an input for the retailer sub-system, the retailer inventory and sales rate dropped by 26% and 23%, respectively.
9.2. Scenario 2: Diseases
In this scenario, the COVID-19 pandemic was considered as an example of a disease event to evaluate its impact on the UK cheese supply chain. Although resource shortage and disruption in the processing phase due to labour strikes are other consequences of pandemic conditions because the demand for food can be affected by COVID-19 and the resulting shock [102,103], the main hypothesis for the second risk scenario with a 10% probability and a 0.4 impact as the initial value predicts a decreasing demand during the pandemic. The simulation results under the COVID-19 pandemic scenario, as presented in Table 12, show a significant decrease in the order rate followed by a decrease in the order backlog, order fulfilment rate, retailer inventory level, and sales rate, as illustrated in Figure 20. In addition, a decrease in order rate can trigger the LSP shipment rate and increase the stock level in the LSP inventory, as represented in Table 12.
9.3. Scenario 3: Labour Strikes
Due to the post-pandemic, the labour strike frequency has experienced significant growth as labourers have to meet their families’ expenses because of rising inflation around the world [104,105]. As the FSC is highly reliant on labour in most phases, such as the processing, transportation, and retailer sectors, the labour strike can seriously hamper supply chain operation efficiency [104]. This scenario evaluates the impact of the labour strike risk with a probability of 30% and an impact level of 0.2 on the production process in the FSC. The labour strike risk is predicted to impact the production rate level negatively. After running the model under the labour strike scenario, as reported in Table 12 and shown in Figure 21, the production rate decreased by 94%. As the production inventory level pushed the other processes in the cheese supply change by reducing the production rate, except for order backlog and the desired shipment rate, the other parameters decreased due to the occurrence of this risk, as reported in Table 12.
9.4. Scenario 4: Demand Fluctuation
In the light of the complex nature of the FSC, demand fluctuation is considered as one of the most frequent challenges that supply chain managers should address to improve supply chain performance [106]. Market and price uncertainty as well as unpredictable market expectations are significant factors that cause demand fluctuation risks [40,107,108,109]. On the other hand, other factors such as market/brand failure or supply-side disruption such as food safety can be the major reason for demand risk [40]. In this scenario, the impact of the demand risk with a probability of 70% and an impact level of 0.2 on the sales rate in FSC is considered. It is predicted that the demand fluctuation risk can decrease the sales rate, which can increase the retailer’s inventory level. As outlined in Table 12 and Figure 22, the simulation results have confirmed this prediction, and the sales rate decreased by 84%. In addition, the inventory level shows significant growth after running the model.
9.5. Scenario 5: Supply Quality Risk
Product quality risk is one of the main vulnerabilities in the FSC. Due to these vulnerabilities, the food market requires strict regulation regarding food safety [110]. A minor non-compliance with food quality can cause a cumulative effect across the whole FSC network [40,65]. In this scenario, the impact of a supply quality risk with a probability of 50% and an impact level of 0.2 on the production rate is investigated. It is hypothesised that the supply quality risk can trigger disruptions in the production process and reduce its rate. As reported in Table 12, the simulation results supported this hypothesis, and the production rate declined by 80%. As with Scenario 3, as the production inventory level pushed other processes in the cheese supply change by reducing the production rate, except for the order backlog and the desired shipment rate, other parameters decreased due to the occurrence of this risk.
10. Discussion
This paper investigates the impact of two top-risk categories, including macro-level risks and operational risks, on the dairy food supply chain using five different scenarios: Natural disaster risk (Scenario 1), Disease, particularly the COVID-19 pandemic (Scenario 2), Labour strikes risk (Scenario 3), Demand fluctuation (Scenario 4), and finally Supply quality risk (Scenario 5). Cheese is selected as the main dairy product in this research. This paper’s supply chain was set to include the upstream and the downstream sides. Procedures and logistics service provider processes are considered as the upstream supply chain, and retailer processes are deemed to be the downstream side of the supply chain. Chen et al. [111] argue that any disruptions in the upstream supply side can affect and involve entire chains. The results in each scenario confirm this chain of reactions. As shown in Figure 19, Figure 20 and Figure 21, all of the parameters over the cheese supply chain are affected by the implications of the different risks mentioned in these scenarios.
The analysis results indicate that the inventory levels of the LSP and the retailer are the parameters highly impacted by the implications of the selected risks in the cheese supply chain. Excessive inventory, particularly for perishable products with a short life cycle, can be damaging and cause food waste and additional costs for the food supply chain [112].
Scenario 1 generates negative impacts on “LSP shipment rate”, “Order fulfilment rate”, “Sales rate”, and “Retailer inventory”. In this scenario, the natural disaster disrupted the LSP shipment rate, which can cause a decreasing of the order fulfilment rate and subsequently, as the lower number of retailer orders can meet in the presence of this risk, the cheese supply chain can face a drop in the retailer inventory level and sales rate. The results of this section are aligned with the results of the studies by Zhu et al. [93] and Van der Vorst et al. [6]. However, both studies focused on shipment time as the dominant factor affecting other parameters and overlooked the combination of complex factors that can negatively impact the food supply chain.
A significant decrease in “Order rate”, “Order backlog”, “Order fulfilment rate”, “Retailer inventory”, and “Sales rate” as a result of the COVID-19 pandemic shock that is described in Scenario 2 confirms the findings in the studies of Höhler et al. [102] and Cardoso et al. [103]. These two studies focused on the importance of the negative impact of the COVID-19 pandemic on the availability of raw materials and workers, as well as the transportation reliability that reduces the number of orders received by retailers. However, none of these research works benefited from the SD approach to visually observe the output changes or other linked factor changes over time. In this scenario, SD modelling is the best method and can conceptualise the system’s behaviour over time because a dynamic problem has arisen in a complex situation. Although Bashiri et al. [18] have covered COVID-19 pandemic risks, their concentration is on the coffee export rate decrease caused by the pandemic.
Once the order is received by the retailers, the production phase will push other processes in the cheese supply chain [35]. Therefore, any disruptions and challenges in this area can transfer to other parameters and entire processes in the FSCs. The results of Scenarios 3 and 5 also confirm this. A significant fall in all the factors is reported by decreasing the production rate level. In these two scenarios, quality of supply and labour strikes were introduced as potential risks that damaged the performance of producers. There is no research in the dairy supply chain examining these two risk factors using SD models.
11. Conclusions and Future Research
This study used the CLD and SFD models to measure the impact of various risk categories on the dynamic relationship among the components of perishable supply chain systems. The present research concentrates on a more holistic view regarding different types of risk associated with dairy supply chain systems that are underexplored in the previous research. In this study, the cheese supply chain is considered to be initiated with the processing/production phase, and the milk and other ingredients are assumed to be infinite for the production section. However, due to some undesired events and delays in delivery or negative risks in the market and the external environment, the raw inventory amount in the production section can exceed the company’s demand. In the next stage, liquid drinking milk and other ingredients were processed into different cheese products and delivered by the logistics service provider to the retailer to meet consumer demand. Therefore, the production, logistics, and retail processes are the main sub-system considered in the SFD model for this research. According to a critical literature review and considering the recent major risks identified in the existing research, exogenous food supply chain risks were identified to integrate with the SFD model to dynamically affect the developed model’s variables. These risks are classified into two key groups: operational and macro-level. The interaction between the risk factors and the cheese supply chain loops was presented to provide great insight regarding the possible risk impact on the overall flow of the food supply chain systems. However, as mentioned before, separate scenarios have been considered for each identified risk to measure the system behaviour change level and the parameter values. The simulation process and its results can help practitioners and decision makers provide proactive risk mitigation strategies and alertness systems.
This research can contribute to the theory and practice by providing a holistic and detailed perspective using a systematic risk management process for evaluating various risk behaviours in the dairy food supply chain. In this study, aligned with systems thinking concepts, multiple models were developed to measure the risk propagation phenomenon. These frameworks were tested using a real case problem mentioned in different literature works. Through analysing different scenarios (i.e., “what-if” analyses) extracted from real case studies, efficient policies and long-term strategies can be proposed to researchers and managers across the supply chain risk management context. Through minor adjustment and contextualisation of the structured models, equations, and initial values for the defined systems’ variables, the proposed risk models in this study will be applicable to various FSC systems regardless of their products and procedures. It would be beneficial for the food industry to take advantage of proactive and reactive risk models such as the one offered through the SD technique to mitigate and manage various internal and external potential risks that can adversely impact and create different challenges for the FSCs through their operation processes. The proposed modelling framework for the dairy food supply chain risks in this study strives to bridge the gap between theory and practice for current and future SCRM areas.
Through the simulation stage in future research, this study provides managers with valuable insights for determining efficient strategies when dealing with the massive complexity within FSCs. In addition, future projects will evaluate the interaction between risk factors, such as regulation changes, security, and political instability, such as war and internal tensions, and excessive inventory with the dairy FSC parameters. Furthermore, this research only concentrated on the dairy industry and, through future research, may consider other industries and show the potential capability and applications of the SD approach for investigating other supply chain sectors. Another possible limitation of the simulation process in the following stages is data unavailability, particularly with regard to the cheese supply chain system. However, this limitation can be addressed by using separate scenarios, as discussed before.
Author Contributions
Conceptualization, M.A., A.H.-F. and A.D.; methodology, M.A., A.H.-F. and A.D.; software, M.A.; validation, M.A. and A.H.-F.; formal analysis, M.A., A.H.-F., R.K. and A.D.; investigation, M.A. and A.H.-F.; resources, M.A.; data curation, M.A.; writing—original draft preparation, M.A., A.H.-F., R.K., D.S. and A.D.; writing—review and editing, M.A., A.H.-F. and R.K.; visualization, M.A.; supervision, A.H.-F., R.K., D.S. and A.D.; project administration, M.A. and A.H.-F.; funding acquisition, A.H.-F. All authors have read and agreed to the published version of the manuscript.
Funding
The authors gratefully acknowledge the funding support received from the University of Northampton, Faculty of Business & Law, and Coventry University, Faculty of Business & Law, for this research.
Institutional Review Board Statement
Not applicable.
Informed Consent Statement
Not applicable.
Data Availability Statement
Not applicable.
Conflicts of Interest
The authors declare no conflict of interest.
References
- Vlajic, J.V.; Van Lokven, S.W.M.; Haijema, R.; Van Der Vorst, J.G.A.J. Using Vulnerability Performance Indicators to Attain Food Supply Chain Robustness. Prod. Plan. Control 2013, 24, 785–799. [Google Scholar] [CrossRef]
- Ali, S.M.; Rahman, M.H.; Tumpa, T.J.; Moghul Rifat, A.A.; Paul, S.K. Examining Price and Service Competition among Retailers in a Supply Chain under Potential Demand Disruption. J. Retail. Consum. Serv. 2018, 40, 40–47. [Google Scholar] [CrossRef]
- Mithun Ali, S.; Moktadir, M.A.; Kabir, G.; Chakma, J.; Rumi, M.J.U.; Islam, M.T. Framework for Evaluating Risks in Food Supply Chain: Implications in Food Wastage Reduction. J. Clean. Prod. 2019, 228, 786–800. [Google Scholar] [CrossRef]
- Govindan, K. Sustainable Consumption and Production in the Food Supply Chain: A Conceptual Framework. Int. J. Prod. Econ. 2018, 195, 419–431. [Google Scholar] [CrossRef]
- Wang, Z.; van der Fels-Klerx, H.J.; Lansink, A.G.J.M.O. Optimization of Sampling for Monitoring Chemicals in the Food Supply Chain Using a Risk-Based Approach: The Case of Aflatoxins and Dioxins in the Dutch Dairy Chain. Risk Anal. 2020, 40, 2539–2560. [Google Scholar] [CrossRef] [PubMed]
- Van Der Vorst, J.G.A.J.; Tromp, S.O.; Van Der Zee, D.J. Simulation Modelling for Food Supply Chain Redesign; Integrated Decision Making on Product Quality, Sustainability and Logistics. Int. J. Prod. Res. 2009, 47, 6611–6631. [Google Scholar] [CrossRef]
- van der Vorst, J.G.A.J.; van Kooten, O.; Luning, P.A. Towards a Diagnostic Instrument to Identify Improvement Opportunities for Quality Controlled Logistics in Agrifood Supply Chain Networks. Int. J. Food Syst. Dyn. 2011, 2, 94–105. [Google Scholar] [CrossRef]
- Ali, S.M.; Nakade, K. Optimal Ordering Policies in a Multi-Sourcing Supply Chain with Supply and Demand Disruptions-a CVaR Approach. Int. J. Logist. Syst. Manag. 2017, 28, 180–199. [Google Scholar] [CrossRef]
- Singh, A.; Shukla, N.; Mishra, N. Social Media Data Analytics to Improve Supply Chain Management in Food Industries. Transp. Res. Part E Logist. Transp. Rev. 2018, 114, 398–415. [Google Scholar] [CrossRef]
- Kumar, A.; Mangla, S.K.; Kumar, P.; Song, M. Mitigate Risks in Perishable Food Supply Chains: Learning from COVID-19. Technol. Forecast. Soc. Chang. 2021, 166, 120643. [Google Scholar] [CrossRef]
- Göbel, C.; Langen, N.; Blumenthal, A.; Teitscheid, P.; Ritter, G. Cutting Food Waste through Cooperation along the Food Supply Chain. Sustainability 2015, 7, 1429–1445. [Google Scholar] [CrossRef] [Green Version]
- Tang, C.; Tomlin, B. The Power of Flexibility for Mitigating Supply Chain Risks. Int. J. Prod. Econ. 2008, 116, 12–27. [Google Scholar] [CrossRef] [Green Version]
- Ge, H.; Nolan, J.; Gray, R.; Goetz, S.; Han, Y. Supply Chain Complexity and Risk Mitigation—A Hybrid Optimization–Simulation Model. Int. J. Prod. Econ. 2016, 179, 228–238. [Google Scholar] [CrossRef] [Green Version]
- Currie, D.J.; Smith, C.; Jagals, P. The Application of System Dynamics Modelling to Environmental Health Decision-Making and Policy—A Scoping Review. BMC Public Health 2018, 18, 402. [Google Scholar] [CrossRef] [PubMed] [Green Version]
- Agius, S.J. Qualitative Research: Its Value and Applicability. Psychiatrist 2013, 37, 204–206. [Google Scholar] [CrossRef] [Green Version]
- Marshall, D.A.; Burgos-Liz, L.; Ijzerman, M.J.; Osgood, N.D.; Padula, W.V.; Higashi, M.K.; Wong, P.K.; Pasupathy, K.S.; Crown, W. Applying Dynamic Simulation Modeling Methods in Health Care Delivery Research—The SIMULATE Checklist: Report of the ISPOR Simulation Modeling Emerging Good Practices Task Force. Value Health 2015, 18, 5–16. [Google Scholar] [CrossRef] [Green Version]
- Kelly, R.A.; Jakeman, A.J.; Barreteau, O.; Borsuk, M.E.; ElSawah, S.; Hamilton, S.H.; Henriksen, H.J.; Kuikka, S.; Maier, H.R.; Rizzoli, A.E.; et al. Selecting among Five Common Modelling Approaches for Integrated Environmental Assessment and Management. Environ. Model. Softw. 2013, 47, 159–181. [Google Scholar] [CrossRef]
- Bashiri, M.; Tjahjono, B.; Lazell, J.; Ferreira, J.; Perdana, T. The Dynamics of Sustainability Risks in the Global Coffee Supply Chain: A Case of Indonesia–UK. Sustainability 2021, 13, 589. [Google Scholar] [CrossRef]
- Demirel, G. Aggregated and Disaggregated Modeling Approaches to Multiple Agent Dynamics. In Proceedings of the 24th International Conference of the System Dynamics Society, Nijmegen, The Netherlands, 23–27 July 2006; Volume 30. [Google Scholar]
- Atkinson, J.A.; Page, A.; Wells, R.; Milat, A.; Wilson, A. A Modelling Tool for Policy Analysis to Support the Design of Efficient and Effective Policy Responses for Complex Public Health Problems. Implement. Sci. 2015, 10, 1–9. [Google Scholar] [CrossRef] [Green Version]
- Maidstone, R. Discrete Event Simulation, System Dynamics and Agent Based Simulation: Discussion and Comparison. System 2012, 1, 1–6. [Google Scholar]
- Mehrjoo, M.; Pasek, Z.J. Risk Assessment for the Supply Chain of Fast Fashion Apparel Industry: A System Dynamics Framework. Int. J. Prod. Res. 2016, 54, 28–48. [Google Scholar] [CrossRef]
- Carías, J.F.; Labaka, L.; Sarriegi, J.M.; Hernantes, J. Defining a Cyber Resilience Investment Strategy in an Industrial Internet of Things Context. Sensors 2019, 19, 138. [Google Scholar] [CrossRef] [PubMed] [Green Version]
- Ghadge, A.; Dani, S.; Kalawsky, R. A Systems Approach for Modelling Supply Chain Risks. Supply Chain Manag. Int. J. 2013, 5, 523–538. [Google Scholar] [CrossRef] [Green Version]
- Zhao, G.; Liu, S.; Lopez, C.; Chen, H.; Lu, H.; Mangla, S.K.; Elgueta, S. Risk Analysis of the Agri-Food Supply Chain: A Multi-Method Approach. Int. J. Prod. Res. 2020, 58, 4851–4876. [Google Scholar] [CrossRef]
- Gokarn, S.; Kuthambalayan, T.S. Analysis of Challenges Inhibiting the Reduction of Waste in Food Supply Chain. J. Clean. Prod. 2017, 168, 595–604. [Google Scholar] [CrossRef]
- Fredriksson, A.; Liljestrand, K. Capturing Food Logistics: A Literature Review and Research Agenda. Int. J. Logist. Res. Appl. 2015, 18, 16–34. [Google Scholar] [CrossRef]
- Baryannis, G.; Validi, S.; Dani, S.; Antoniou, G. Supply Chain Risk Management and Artificial Intelligence: State of the Art and Future Research Directions. Int. J. Prod. Res. 2019, 57, 2179–2202. [Google Scholar] [CrossRef]
- Garnett, P.; Doherty, B.; Heron, T. Vulnerability of the United Kingdom’s Food Supply Chains Exposed by COVID-19. Nat. Food 2020, 1, 315–318. [Google Scholar] [CrossRef]
- Harvey, F. Coronavirus Pandemic Will Cause Famine of Biblical Proportions. Available online: https://www.theguardian.com/global-development/2020/apr/21/coronavirus-pandemic-will-cause-famine-of-biblical-proportions (accessed on 25 July 2022).
- Tavakoli Haji Abadi, Y.; Avakh Darestani, S. Evaluation of Sustainable Supply Chain Risk: Evidence from the Iranian Food Industry. J. Sci. Technol. Policy Manag. 2021. [Google Scholar] [CrossRef]
- Ülkü, M.A.; Akgün, M.; Venkatadri, U.; Diallo, C.; Chadha, S.S. Managing Environmental and Operational Risks for Sustainable Cotton Production Logistics: System Dynamics Modelling for a Textile Company. Logistics 2020, 4, 34. [Google Scholar] [CrossRef]
- Estay, S.; Alberto, D.; Pankaj Daniel Sepulveda Estay, G. Review of the Application of System Dynamics to Problems in Food Supply Chains. In Proceedings of the 38 International Conference of System Dynamics Society, Online, 20–24 July 2020. [Google Scholar]
- Rathore, R.; Thakkar, J.J.; Jha, J.K. Impact of Risks in Foodgrains Transportation System: A System Dynamics Approach. Int. J. Prod. Res. 2020, 59, 1814–1833. [Google Scholar] [CrossRef]
- Zhu, Q.; Krikke, H. Managing a Sustainable and Resilient Perishable Food Supply Chain (PFSC) after an Outbreak. Sustainability 2020, 12, 5004. [Google Scholar] [CrossRef]
- Arwani, M.; Santoso, I.; Rahmatin, N. A Dynamic Model for Managing Adulteration Risks of Dairy Industry Supply Chain in Indonesia. Adv. Food Sci. Sustain. Agric. Agroind. Eng. 2018, 1, 1–8. [Google Scholar] [CrossRef]
- Orjuela-Castro, J.A.; Diaz Gamez, G.L.; Bernal Celemín, M.P. Model for Logistics Capacity in the Perishable Food Supply Chain. Commun. Comput. Inf. Sci. 2017, 742, 225–237. [Google Scholar] [CrossRef]
- Azizsafaei, M.; Sarwar, D.; Fassam, L.; Khandan, R.; Hosseinian-Far, A. A Critical Overview of Food Supply Chain Risk Management. In Proceedings of the Cybersecurity, Privacy and Freedom Protection in the Connected World; Springer: Warsaw, Poland, 2021; pp. 413–429. [Google Scholar]
- Puertas, R.; Marti, L.; Garcia-Alvarez-coque, J.M. Food Supply without Risk: Multicriteria Analysis of Institutional Conditions of Exporters. Int. J. Environ. Res. Public Health 2020, 17, 3432. [Google Scholar] [CrossRef] [PubMed]
- Behzadi, G.; O’Sullivan, M.J.; Olsen, T.L.; Zhang, A. Agribusiness Supply Chain Risk Management: A Review of Quantitative Decision Models. Omega 2018, 79, 21–42. [Google Scholar] [CrossRef]
- Liu, X.; Arthanari, T.; Shi, Y. Making Dairy Supply Chains Robust against Corruption Risk: A Systemic Exploratory Study. Int. J. Logist. Manag. 2019, 30, 1078–1100. [Google Scholar] [CrossRef]
- Nakandala, D.; Lau, H.; Zhao, L. Development of a Hybrid Fresh Food Supply Chain Risk Assessment Model. Int. J. Prod. Res. 2017, 55, 4180–4195. [Google Scholar] [CrossRef]
- Prakash, S.; Soni, G.; Rathore, A.P.S.; Singh, S. Risk Analysis and Mitigation for Perishable Food Supply Chain: A Case of Dairy Industry. Benchmarking 2017, 24, 2–23. [Google Scholar] [CrossRef]
- Tsolakis, N.; Srai, J.S. A System Dynamics Approach to Food Security through Smallholder Farming in the UK. Chem. Eng. Trans. 2017, 57, 2023–2028. [Google Scholar] [CrossRef]
- Forrester, J. Industrial Dynamics; MIT Press: Cambridge, MA, USA, 1961. [Google Scholar]
- Rebs, T.; Brandenburg, M.; Seuring, S. System Dynamics Modeling for Sustainable Supply Chain Management: A Literature Review and Systems Thinking Approach. J. Clean. Prod. 2019, 208, 1265–1280. [Google Scholar] [CrossRef]
- Angerhofer, B.J.; Angelides, M.C. System Dynamics Modelling in Supply Chain Management: Research Review. Winter Simul. Conf. Proc. 2000, 1, 342–351. [Google Scholar] [CrossRef]
- Garbolino, E.; Chery, J.P.; Guarnieri, F. A Simplified Approach to Risk Assessment Based on System Dynamics: An Industrial Case Study. Risk Anal. 2016, 36, 16–29. [Google Scholar] [CrossRef] [PubMed] [Green Version]
- Morecroft John, D.W.A. Strategic Modelling and Business Dynamics: A Feedback Systems Approach, 2nd ed.; Wiley: New York, NY, USA, 2015; ISBN 1-118-84470-X. [Google Scholar]
- Gonçalves, P.; Moshtari, M. The Impact of Information Visibility on Ordering Dynamics in a Supply Chain: A Behavioral Perspective. Syst. Dyn. Rev. 2021, 37, 126–154. [Google Scholar] [CrossRef]
- Yeo, G.T.; Pak, J.Y.; Yang, Z. Analysis of Dynamic Effects on Seaports Adopting Port Security Policy. Transp. Res. Part A Policy Pract. 2013, 49, 285–301. [Google Scholar] [CrossRef]
- Sterman, J. Business Dynamics: Systems Thinking and Modeling for a Complex World. J. Oper. Res. Soc. 2002, 53, 472–473. [Google Scholar]
- Ali, I.; Gurd, B. Managing Operational Risks through Knowledge Sharing in Food Supply Chains. Knowl. Process Manag. 2020, 27, 322–331. [Google Scholar] [CrossRef]
- Xiaoping, W. Food Supply Chain Safety Risk Evaluation Based on AHP Fuzzy Integrated Evaluation Method. Int. J. Secur. Its Appl. 2016, 10, 233–244. [Google Scholar] [CrossRef]
- Marley, K.A.; Ward, P.T.; Hill, J.A. Mitigating Supply Chain Disruptions—A Normal Accident Perspective. Supply Chain Manag. 2014, 19, 142–152. [Google Scholar] [CrossRef]
- Aung, M.M.; Chang, Y.S. Traceability in a Food Supply Chain: Safety and Quality Perspectives. Food Control 2014, 39, 172–184. [Google Scholar] [CrossRef]
- Opara, L.U.; Vol, E.; Opara, L.U.; Vol, E. Traceability in Agriculture and Food Supply Chain: A Review of Basic Concepts, Technological Implications, and Future Prospects. Food Agric. Environ. 2003, 1, 101–106. [Google Scholar]
- Christopher, M.; Lee, H. Mitigating Supply Chain Risk through Improved Confidence. Int. J. Phys. Distrib. Logist. Manag. 2004, 34, 388–396. [Google Scholar] [CrossRef] [Green Version]
- Jaffee, S.; Siegel, P.; Andrews, C. Agriculture and Rural Development Discussion Paper 47 Rapid Agricultural Supply Chain Risk Assessment: A Conceptual Framework; Word Bank: Washington, DC, USA, 2010; Volume 55. [Google Scholar]
- Manders, J.H.M.; Caniëls, M.C.J.; Ghijsen, P.W.T. Exploring Supply Chain Flexibility in a FMCG Food Supply Chain. J. Purch. Supply Manag. 2016, 22, 181–195. [Google Scholar] [CrossRef]
- Stoyanova, A. Impact of External and Internal Circumstances on Food Safety Management. Trakia J. Sci. 2019, 17, 386–394. [Google Scholar] [CrossRef]
- Yakovleva, N. Measuring the Sustainability of the Food Supply Chain: A Case Study of the UK. J. Environ. Policy Plan. 2007, 9, 75–100. [Google Scholar] [CrossRef]
- Gov.UK FAQ—Strikes, Lockout & Picketing. Available online: http://www.alrb.gov.ab.ca/faq_strikes.html (accessed on 31 May 2022).
- Ortiz-Barrios, M.; Miranda-De la Hoz, C.; López-Meza, P.; Petrillo, A.; De Felice, F. A Case of Food Supply Chain Management with AHP, DEMATEL, and TOPSIS. J. Multi-Criteria Decis. Anal. 2020, 27, 104–128. [Google Scholar] [CrossRef]
- Chavez, P.J.A.; Seow, C. Managing Food Quality Risk in Global Supply Chain: A Risk Management Framework. Int. J. Eng. Bus. Manag. 2012, 4, 3. [Google Scholar] [CrossRef]
- Orengo Serra, K.L.; Sanchez-Jauregui, M. Food Supply Chain Resilience Model for Critical Infrastructure Collapses Due to Natural Disasters. Br. Food J. 2021, 124, 14–34. [Google Scholar] [CrossRef]
- Reddy, V.R.; Singh, S.K.; Anbumozhi, V. Food Supply Chain Disruption Due to Natural Disasters: Entities, Risks, and Strategies for Resilience. ERIA Discuss. Pap. 2016, 18, 1–37. [Google Scholar]
- Umar, M.; Wilson, M. Supply Chain Resilience: Unleashing the Power of Collaboration in Disaster Management. Sustainability 2021, 13, 10573. [Google Scholar] [CrossRef]
- Hobbs, J.E. Food Supply Chains during the COVID-19 Pandemic. Can. J. Agric. Econ. 2020, 68, 171–176. [Google Scholar] [CrossRef] [Green Version]
- Clegg, R. Labour Disputes in the UK—Office for National Statistics. Available online: https://www.ons.gov.uk/employmentandlabourmarket/peopleinwork/workplacedisputesandworkingconditions/articles/labourdisputes/2018 (accessed on 31 May 2022).
- Li, H.; Li, D.; Jiang, D. Optimising the Configuration of Food Supply Chains. Int. J. Prod. Res. 2021, 59, 3722–3746. [Google Scholar] [CrossRef]
- Ren, J.; Jenkinson, I.; Wang, J.; Xu, D.L.; Yang, J.B. An Offshore Risk Analysis Method Using Fuzzy Bayesian Network. J. Offshore Mech. Arct. Eng. 2009, 131, 1–12. [Google Scholar] [CrossRef]
- Mokhtari, K.; Ren, J.; Roberts, C.; Wang, J. Decision Support Framework for Risk Management on Sea Ports and Terminals Using Fuzzy Set Theory and Evidential Reasoning Approach. Expert Syst. Appl. 2012, 39, 5087–5103. [Google Scholar] [CrossRef]
- Rausand, M. Risk Assessment Theory, Methods, and Applications, 1st ed.; Statistics in Practice; Wiley: Hoboken, NJ, USA, 2011; ISBN 1-118-28111-X. [Google Scholar]
- Li, C.; Ren, J.; Wang, H. A System Dynamics Simulation Model of Chemical Supply Chain Transportation Risk Management Systems. Comput. Chem. Eng. 2016, 89, 71–83. [Google Scholar] [CrossRef]
- Vlachos, D.; Georgiadis, P.; Iakovou, E. A System Dynamics Model for Dynamic Capacity Planning of Remanufacturing in Closed-Loop Supply Chains. Comput. Oper. Res. 2007, 34, 367–394. [Google Scholar] [CrossRef]
- Department for Environment Food & Rural Affairs of United Kingdom Family Food Datasets—GOV.UK. Available online: https://www.gov.uk/government/statistical-data-sets/family-food-datasets (accessed on 5 September 2021).
- Clarke, H. Change in UK Consumer Preferences Show Need for More Cheese|AHDB. Available online: https://ahdb.org.uk/news/change-in-UK-consumer-preferences-for-more-cheese (accessed on 5 September 2021).
- Ivanova, N.; Gugleva, V.; Dobreva, M.; Pehlivanov, I.; Stefanov, S.; Andonova, V. The Dairy Industry: Process, Monitoring, Standards, and Quality. Intech 2016, i, 13. [Google Scholar]
- Shafiee, F.; Kazemi, A.; Jafarnejad Chaghooshi, A.; Sazvar, Z.; Amoozad Mahdiraji, H. A Robust Multi-Objective Optimization Model for Inventory and Production Management with Environmental and Social Consideration: A Real Case of Dairy Industry. J. Clean. Prod. 2021, 294, 126230. [Google Scholar] [CrossRef]
- Feng, S.; Patton, M. Labour Productivity in the Dairy Sector. Available online: https://www.afbini.gov.uk/sites/afbini.gov.uk/files/publications/Labour%20Productivity%20in%20the%20Dairy%20Sector_0.pdf (accessed on 25 July 2022).
- Giffin, M.; Baker, D.; Eyeson-Annan, M.; Jorm, L. Dairy Processing Equipment Market—Global Forecast To 2020. N. S. W. Public Health Bull. 2005, 16, 7. [Google Scholar] [CrossRef]
- Georgiadis, P.; Vlachos, D.; Iakovou, E. A System Dynamics Modeling Framework for the Strategic Supply Chain Management of Food Chains. J. Food Eng. 2005, 70, 351–364. [Google Scholar] [CrossRef]
- Yoon, J.; Yildiz, H.; Talluri, S.S. Risk Management Strategies in Transportation Capacity Decisions: An Analytical Approach. J. Bus. Logist. 2016, 37, 364–381. [Google Scholar] [CrossRef]
- Gonçalves, P.; Hines, J.; Sterman, J. The Impact of Endogenous Demand on Push-Pull Production System. Syst. Dyn. Rev. 2005, 21, 187–216. [Google Scholar] [CrossRef]
- Elkady, G. A Decision Support Framework to Assess Grocery Retail Supply Chain Collaboration: A System Dynamics Modelling Approach. Int. J. Innov. Manag. Technol. 2014, 5, 232. [Google Scholar] [CrossRef]
- Gastaldi, M.; Rossi, R.; Vescovi, R. Analysing the Capacity of a Transportation Network. A General Theoretical Approach. Eur. Transp.-Trasp. Eur. 2013, 53, 8. [Google Scholar]
- Peng, M.; Peng, Y.; Chen, H. Post-Seismic Supply Chain Risk Management: A System Dynamics Disruption Analysis Approach for Inventory and Logistics Planning. Comput. Oper. Res. 2014, 42, 14–24. [Google Scholar] [CrossRef]
- Barlas, Y. System Dynamics: Systemic Feedback Modeling for Policy Analysis. System 2007, 59, 1–68. [Google Scholar]
- Lin, G.; Palopoli, M.; Dadwal, V. From Causal Loop Diagrams to System Dynamics Models in a Data-Rich Ecosystem BT—Leveraging Data Science for Global Health; Celi, L.A., Majumder, M.S., Ordóñez, P., Osorio, J.S., Paik, K.E., Somai, M., Eds.; Springer International Publishing: Cham, Switzerland, 2020; pp. 77–98. ISBN 978-3-030-47994-7. [Google Scholar]
- Márquez, A.C.; Marquez, A.C. Dynamic Modelling for Supply Chain Management: Dealing with Front-End, Back-End and Integration Issues 1. Aufl.; Springer Verlag London Limited: London, UK, 2010. [Google Scholar]
- Barlas, Y.; Gunduz, B. Demand Forecasting and Sharing Strategies to Reduce Fluctuations and the Bullwhip Effect in Supply Chains. J. Oper. Res. Soc. 2011, 62, 458–473. [Google Scholar] [CrossRef]
- Zhu, Q.; Krikke, H.; Caniëls, M.C.J. The Effects of Different Supply Chain Integration Strategies on Disruption Recovery: A System Dynamics Study on the Cheese Industry. Logistics 2021, 5, 19. [Google Scholar] [CrossRef]
- Nájera, A.I.; Nieto, S.; Barron, L.J.R.; Albisu, M. A Review of the Preservation of Hard and Semi-Hard Cheeses: Quality and Safety. Int. J. Environ. Res. Public Health 2021, 18, 9789. [Google Scholar] [CrossRef] [PubMed]
- Bylund, G.; Tetra Pak Processing Systems AB. CHEESE|Dairy Processing Handbook; Tetra Pak Processing Systems AB: Lund Sweden, 2015. [Google Scholar]
- Forrester, J.W.; Senge, P.M. Tests for Building Confidence in System Dynamics Models. TIMS Stud. Manag. Sci. 1980, 14, 209–228. [Google Scholar]
- Ebrahimi, E.; Shirazi, B.; Mirzagoltabar, H.; Mahdavi, I. 4th A System Dynamics Model for Performance Measurement of a Dairy Supply Chain. In Proceedings of the 4th International Conference on Industrial and Systems Engineering (ICISE 2018)’ Iiec 2018, Mashhad, Iran, 12 September 2018. [Google Scholar]
- Barlas, Y. Formal Aspects of Model Validity and Validation in System Dynamics. Syst. Dyn. Rev. 1996, 12, 183–210. [Google Scholar] [CrossRef]
- Oliva, R. Structural Dominance Analysis of Large and Stochastic Models. Syst. Dyn. Rev. 2016, 32, 26–51. [Google Scholar] [CrossRef]
- Agrawala, S.; Carraro, M.; Kingsmill, N.; Lanzi, E.; Prudent-richard, G. Private Sector Engagement in Adaptation to Climate Change; OECD Environment Working Paper No. 39; OECD Publishing: Paris, France, 2011; 56p. [Google Scholar]
- Pregnolato, M.; Ford, A.; Wilkinson, S.M.; Dawson, R.J. The Impact of Flooding on Road Transport: A Depth-Disruption Function. Transp. Res. Part D Transp. Environ. 2017, 55, 67–81. [Google Scholar] [CrossRef]
- Höhler, J.; Lansink, A.O. Measuring the Impact of COVID-19 on Stock Prices and Profits in the Food Supply Chain. Agribusiness 2021, 37, 171–186. [Google Scholar] [CrossRef] [PubMed]
- Cardoso, B.; Cunha, L.; Leiras, A.; Gonçalves, P.; Yoshizaki, H.; de Brito Junior, I.; Pedroso, F. Causal Impacts of Epidemics and Pandemics on Food Supply Chains: A Systematic Review. Sustainability 2021, 13, 9799. [Google Scholar] [CrossRef]
- Mithun Ali, S.; Kumar Paul, S.; Chowdhury, P.; Agarwal, R.; Fathollahi-Fard, A.M.; Jose Chiappetta Jabbour, C.; Luthra, S. Modelling of Supply Chain Disruption Analytics Using an Integrated Approach: An Emerging Economy Example. Expert Syst. Appl. 2021, 173, 114690. [Google Scholar] [CrossRef]
- Larue, B. Labor Issues and COVID-19. Can. J. Agric. Econ. 2020, 68, 231–237. [Google Scholar] [CrossRef]
- Toffel, M.W. Enhancing the Practical Relevance of Research. Prod. Oper. Manag. 2016, 25, 1493–1505. [Google Scholar] [CrossRef] [Green Version]
- Boyabatli, O.; Kleindorfer, P.R.; Koontz, S.R. Procurement Risk Management in Beef Supply Chains. Handb. Integr. Risk Manag. Glob. Supply Chain. 2011, 465–494. [Google Scholar] [CrossRef]
- Boyabatli, O. Farm-Yield Management When Production Rate Is Yield Dependent Farm-Yield Management When Production Rate Is Yield. Res. Collect. Lee Kong Chian Sch. Bus. 2013. Available online: https://citeseerx.ist.psu.edu/viewdoc/download?doi=10.1.1.491.4724&rep=rep1&type=pdf (accessed on 5 September 2021).
- Vlajic, J.V.; Van der Vorst, J.G.A.J.; Hendrix, E. Food Supply Chain Network Robustness—A Literature Review and Research Agenda; Wageningen University: Wageningen, The Netherlands, 2008. [Google Scholar]
- Ge, H.; Gray, R.; Nolan, J. Agricultural Supply Chain Optimization and Complexity: A Comparison of Analytic vs Simulated Solutions and Policies. Int. J. Prod. Econ. 2015, 159, 208–220. [Google Scholar] [CrossRef]
- Chen, J.; Sohal, A.S.; Prajogo, D.I. Supply Chain Operational Risk Mitigation: A Collaborative Approach. Int. J. Prod. Res. 2013, 51, 2186–2199. [Google Scholar] [CrossRef]
- Pourhejazy, P. Destruction Decisions for Managing Excess Inventory in E-Commerce Logistics. Sustainability 2020, 12, 8365. [Google Scholar] [CrossRef]
Figure 1.
System dynamics (SD) process adapted from Rathore et al. [34].
Figure 1.
System dynamics (SD) process adapted from Rathore et al. [34].
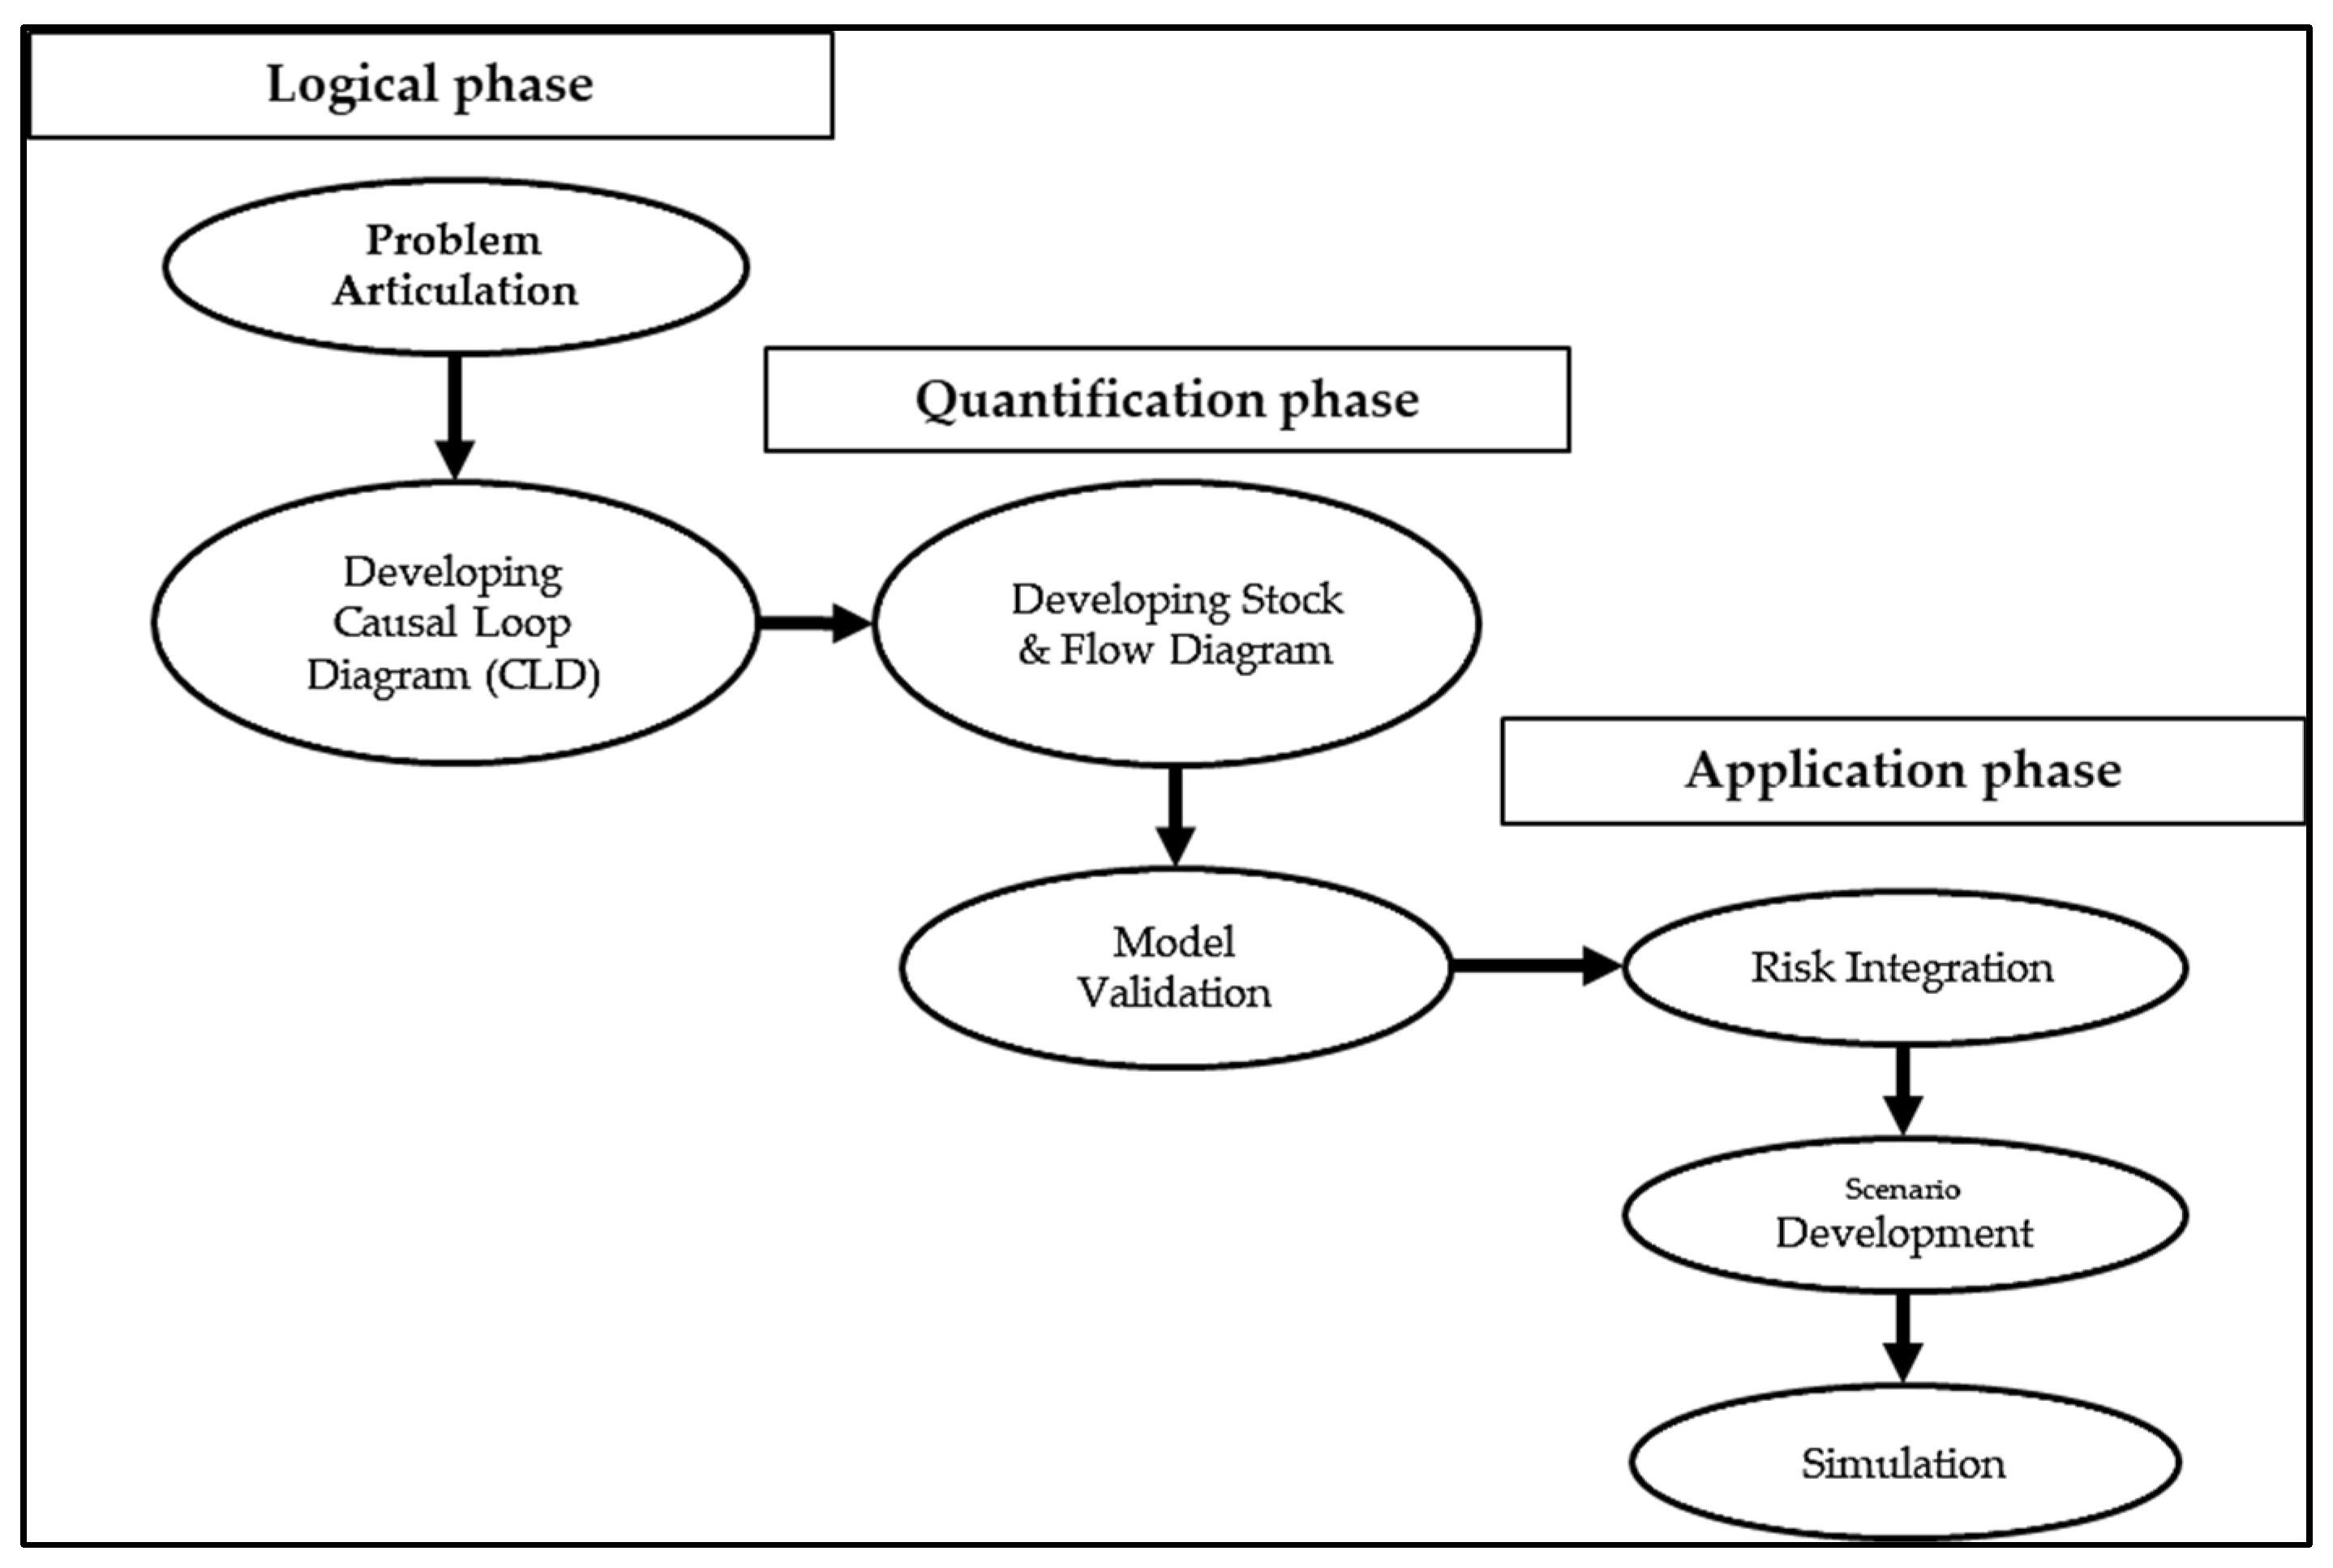
Figure 2.
Operational risks.
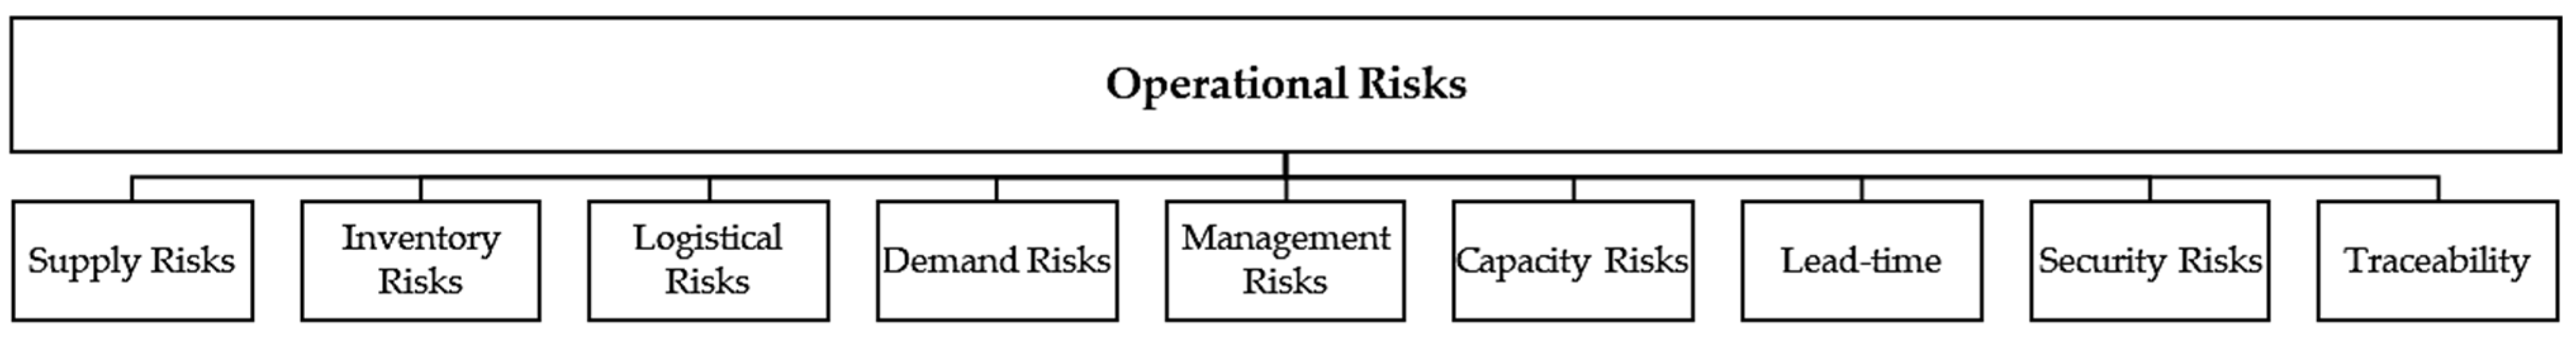
Figure 3.
Market risk.
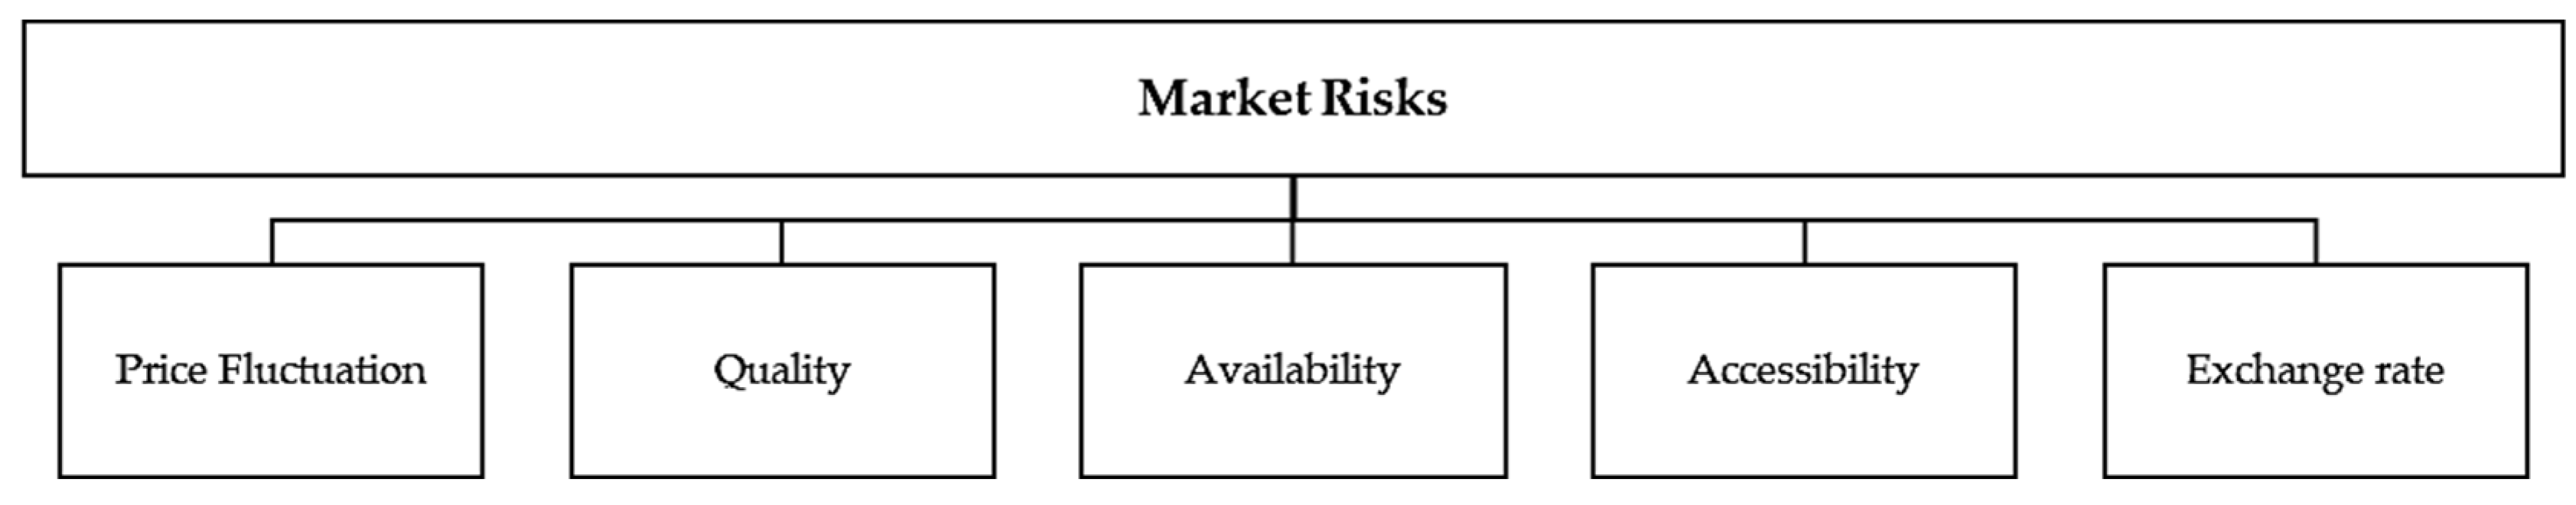
Figure 4.
Managerial level risks.
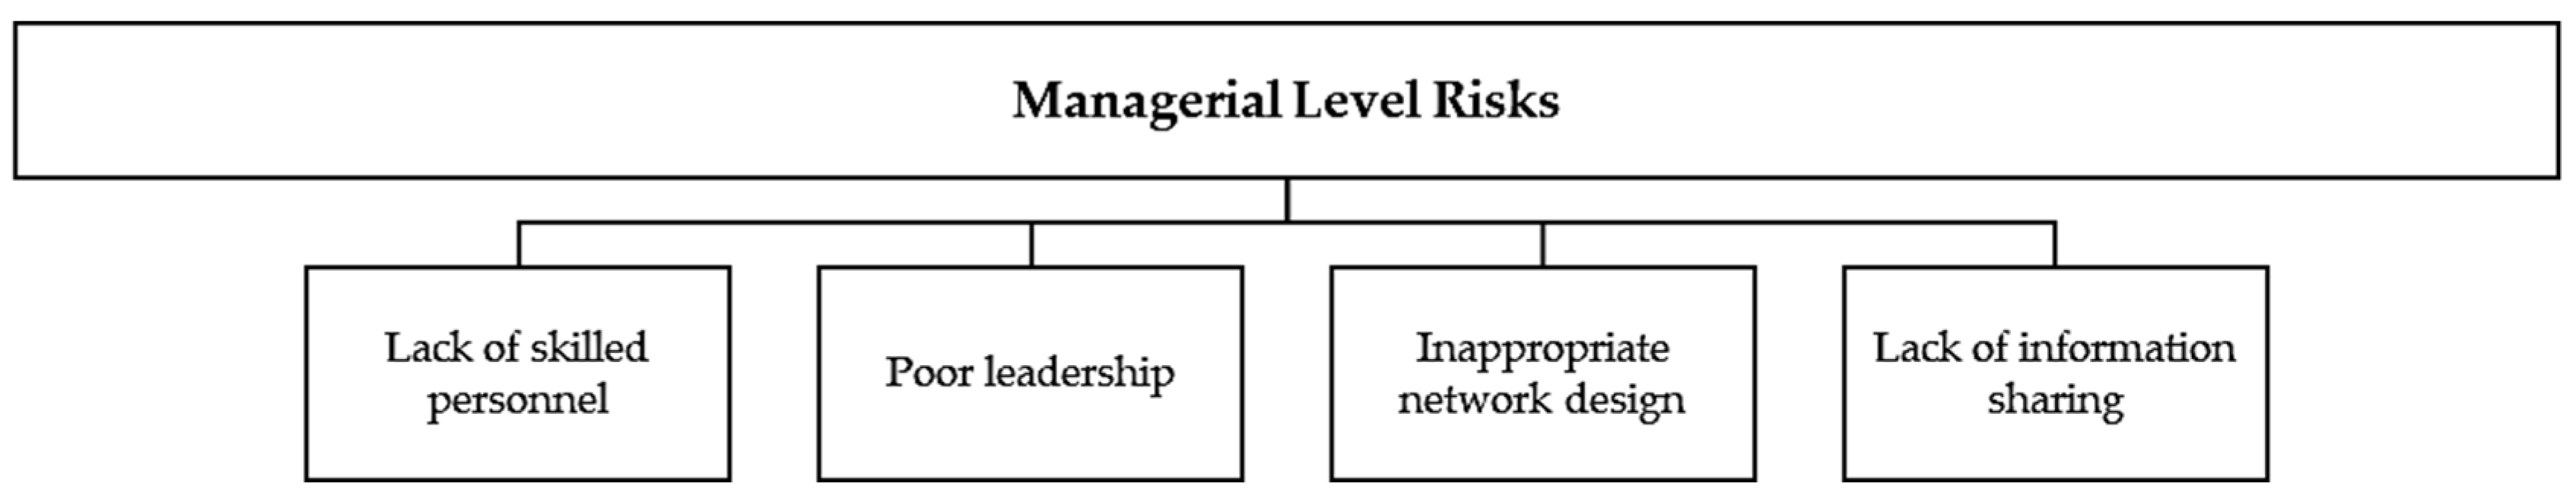
Figure 5.
External environment risks.
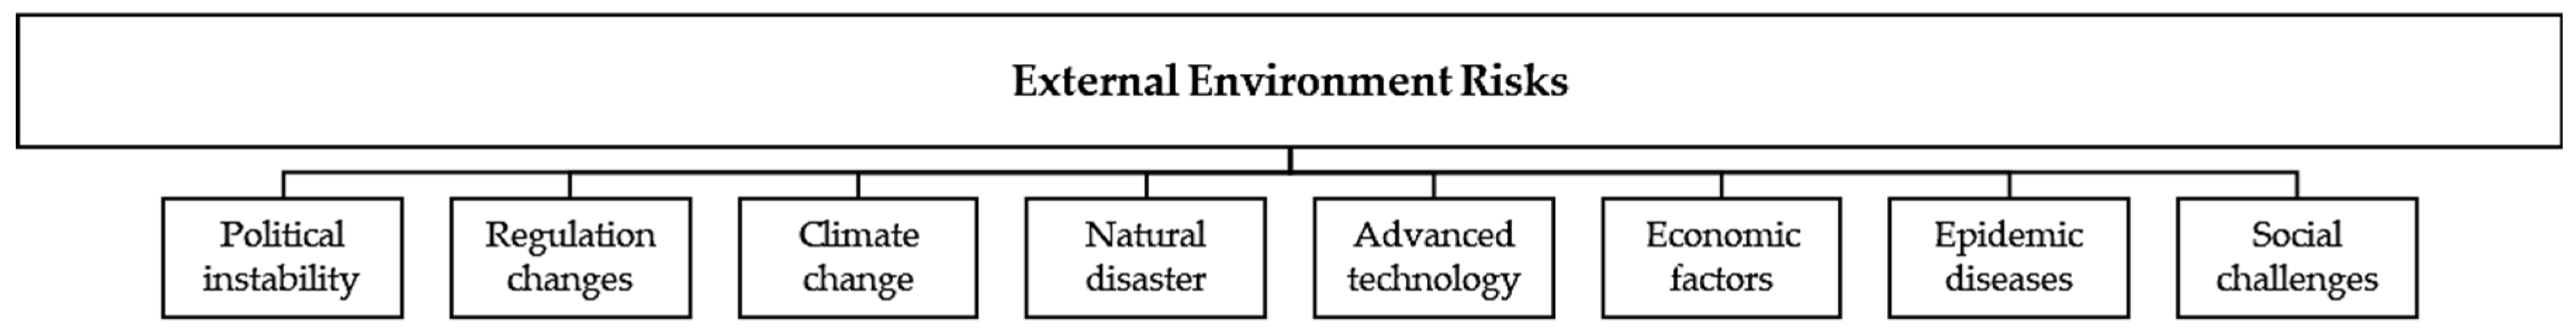
Figure 6.
Main potential risks in fresh food supply chain used in this research.
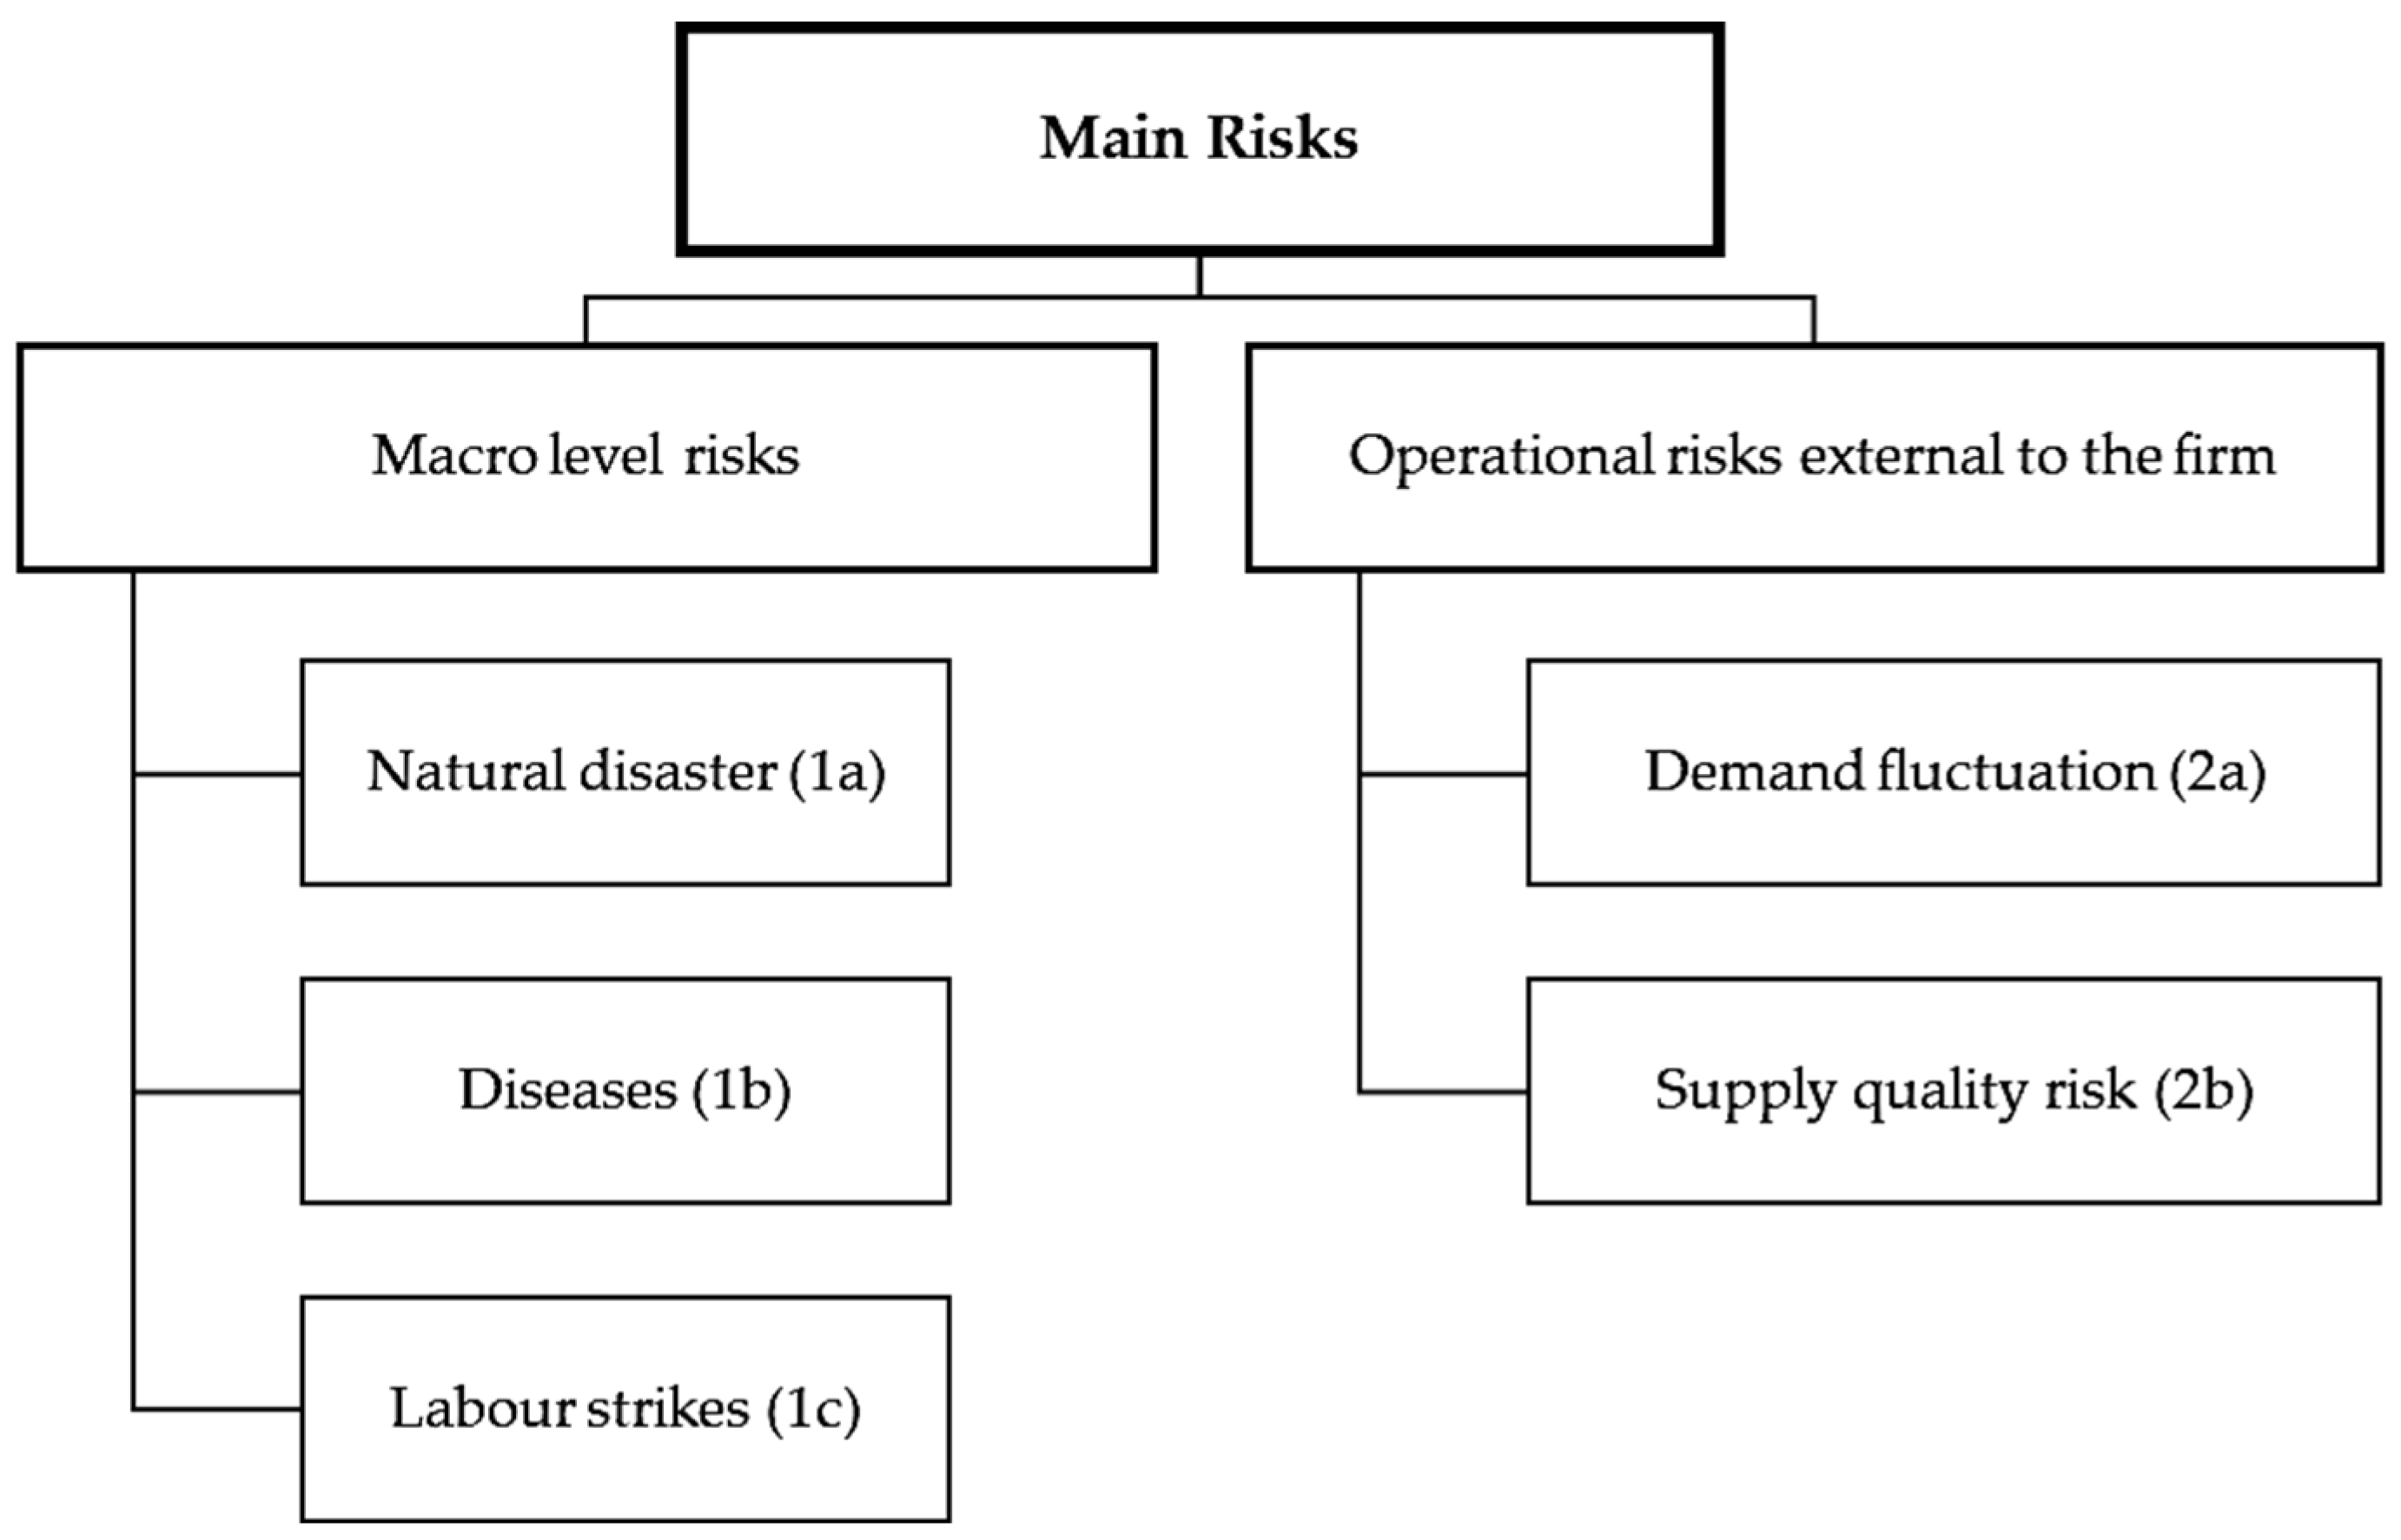
Figure 7.
Median number of working days lost due to labour strike in the UK (2010–2018), data adapted from [70].
Figure 7.
Median number of working days lost due to labour strike in the UK (2010–2018), data adapted from [70].
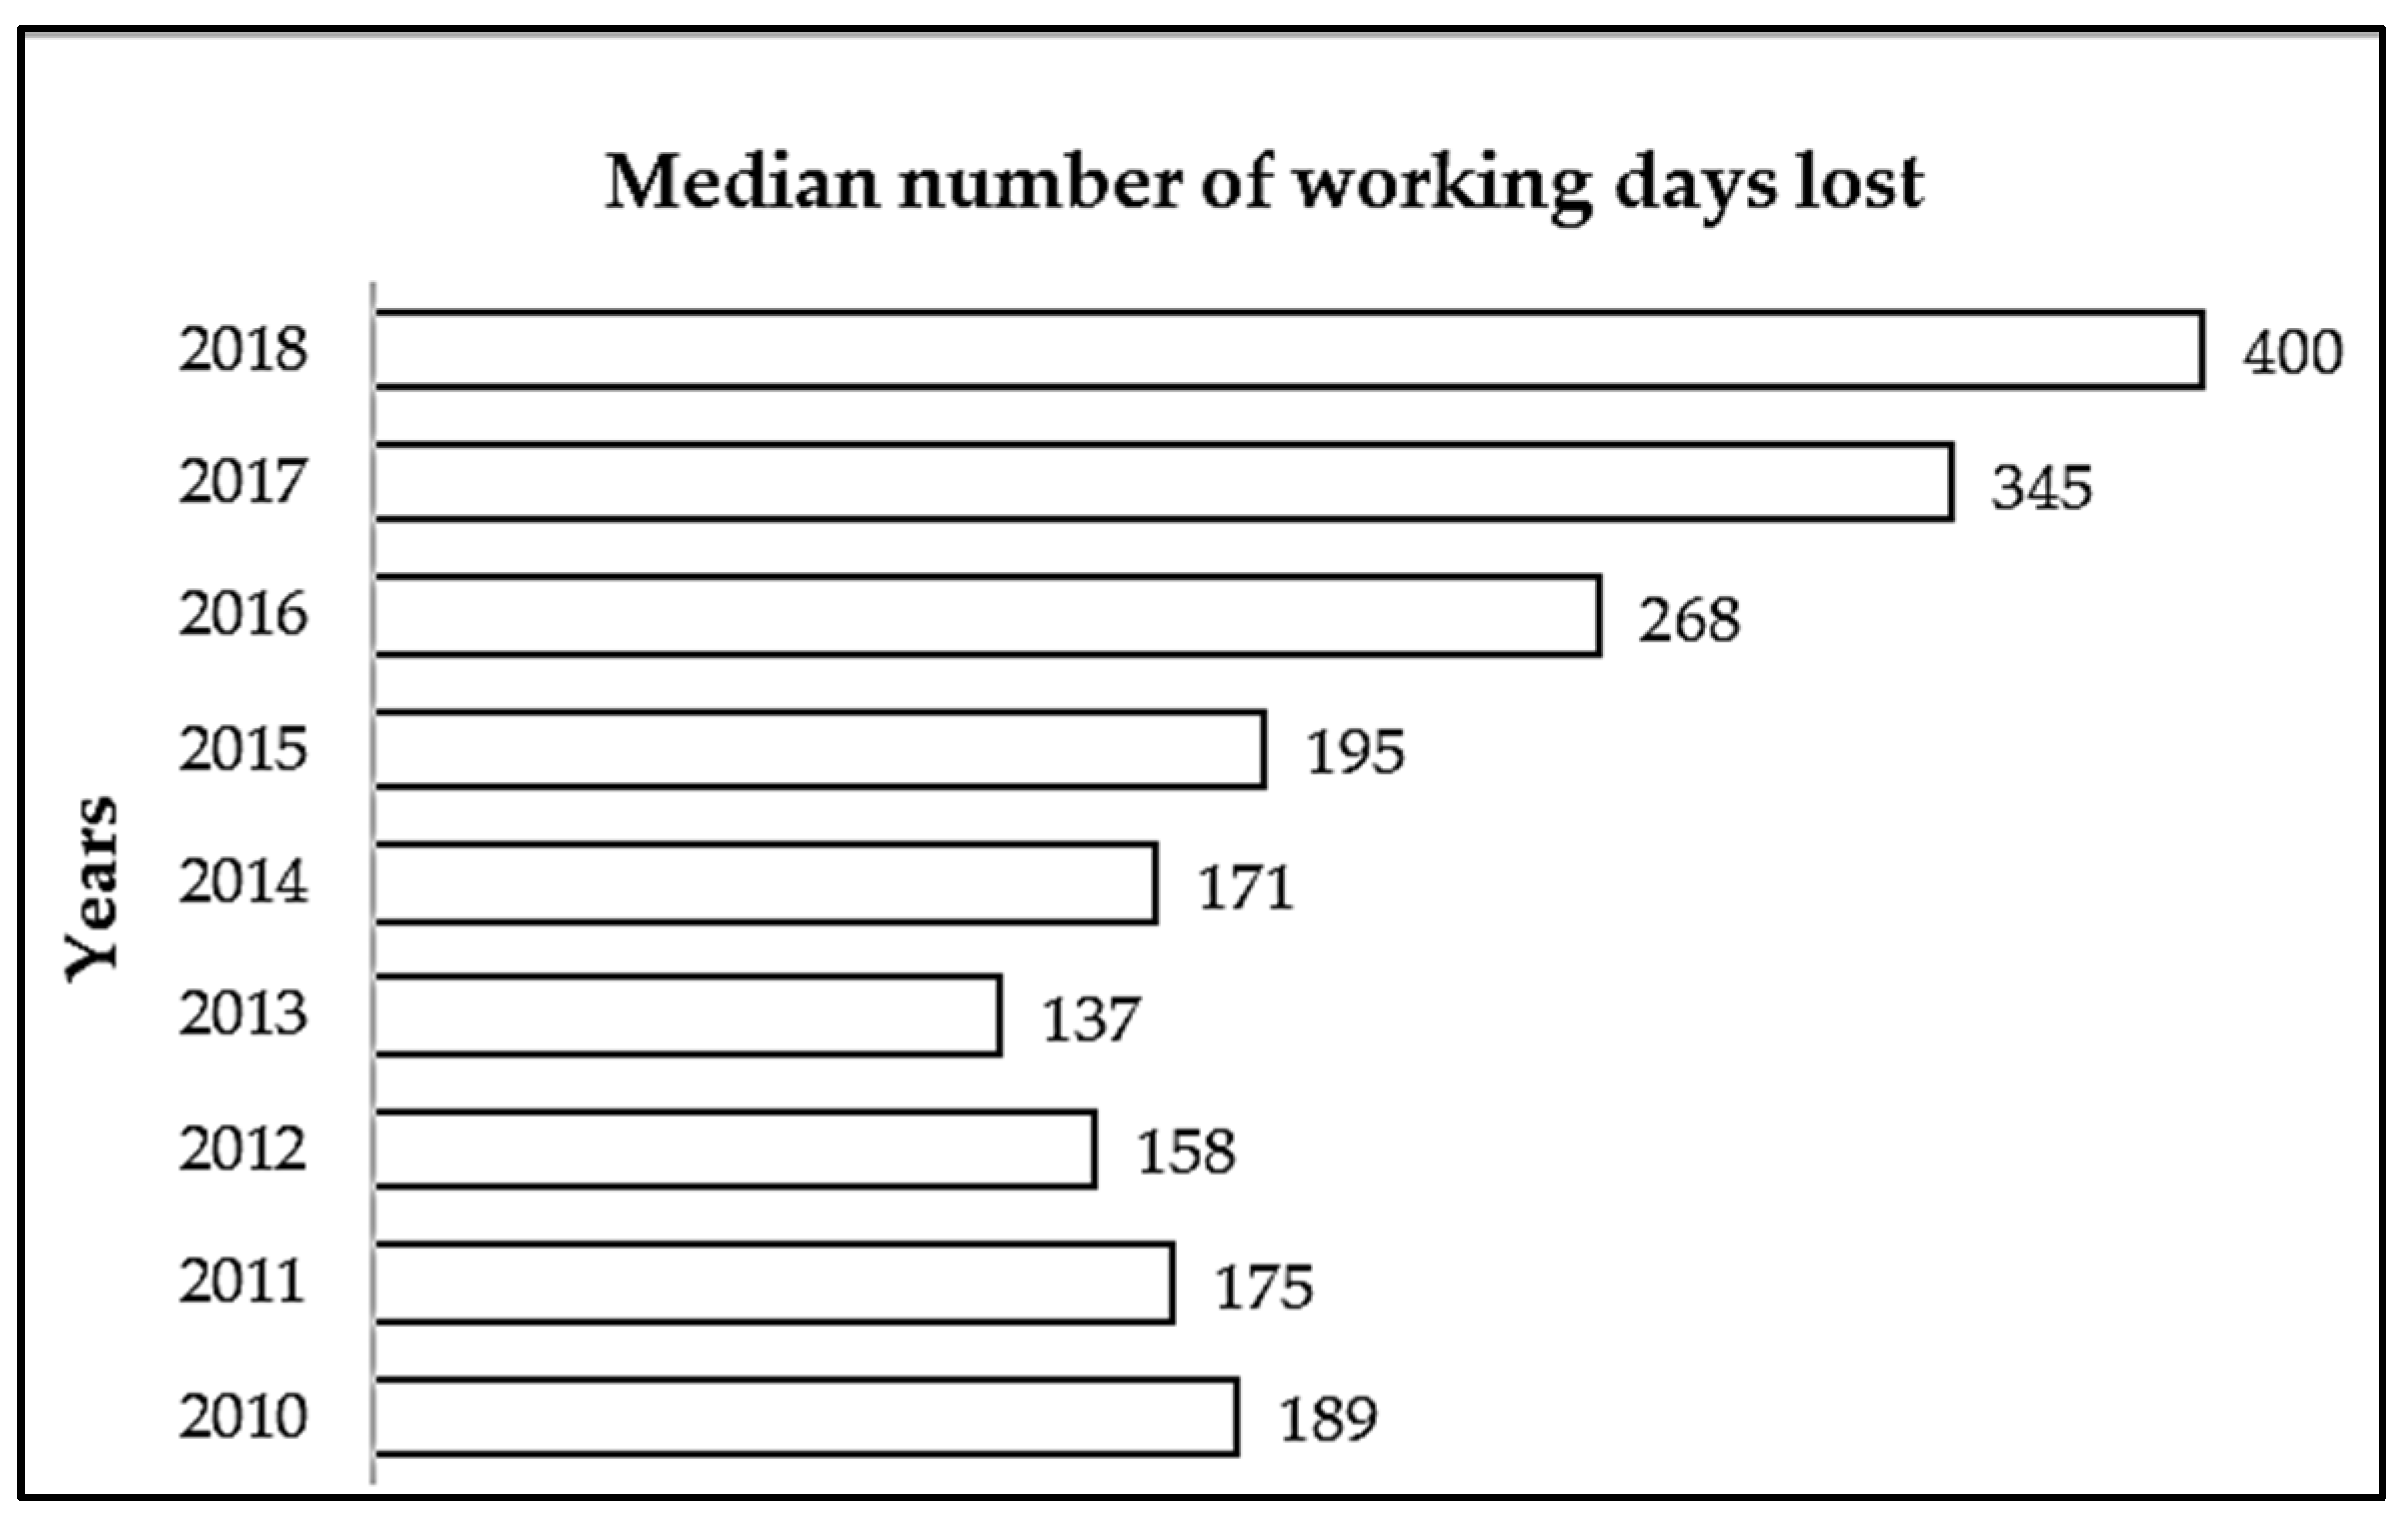
Figure 8.
CLD of the variable affected by risk factor.
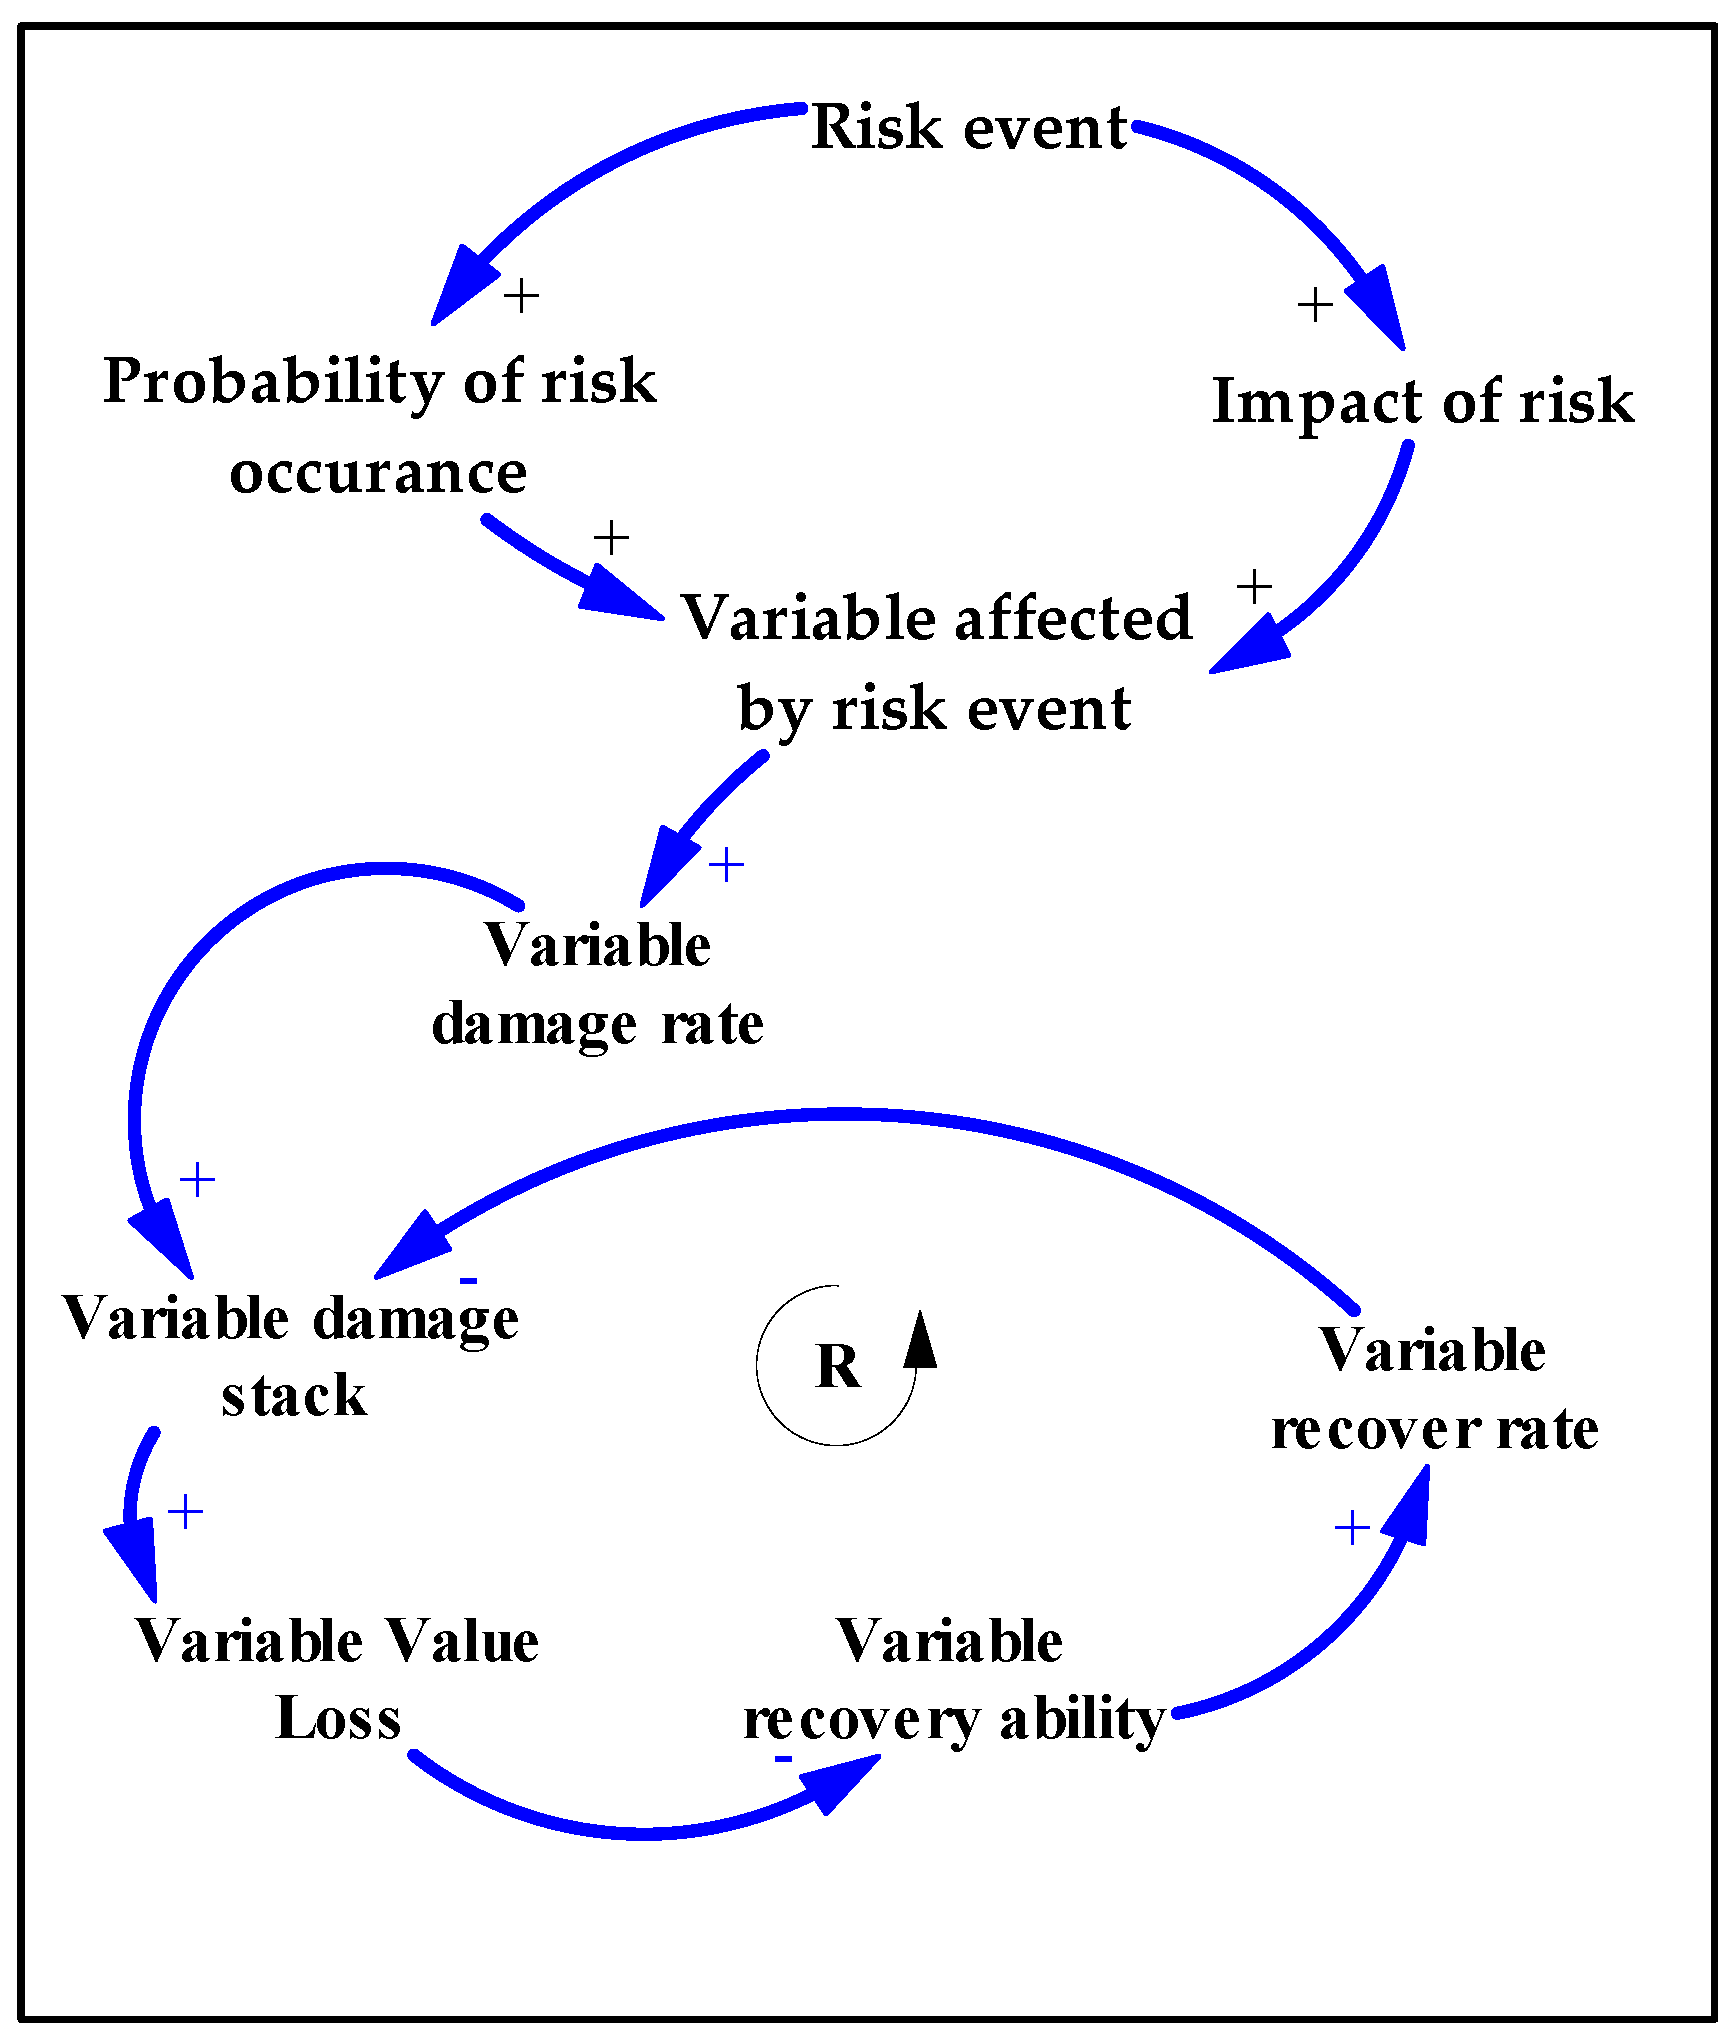
Figure 9.
CLD of production capability.

Figure 10.
CLD of transportation capacity.

Figure 11.
CLD of retailer system.

Figure 12.
CLD model for a cheese supply chain.
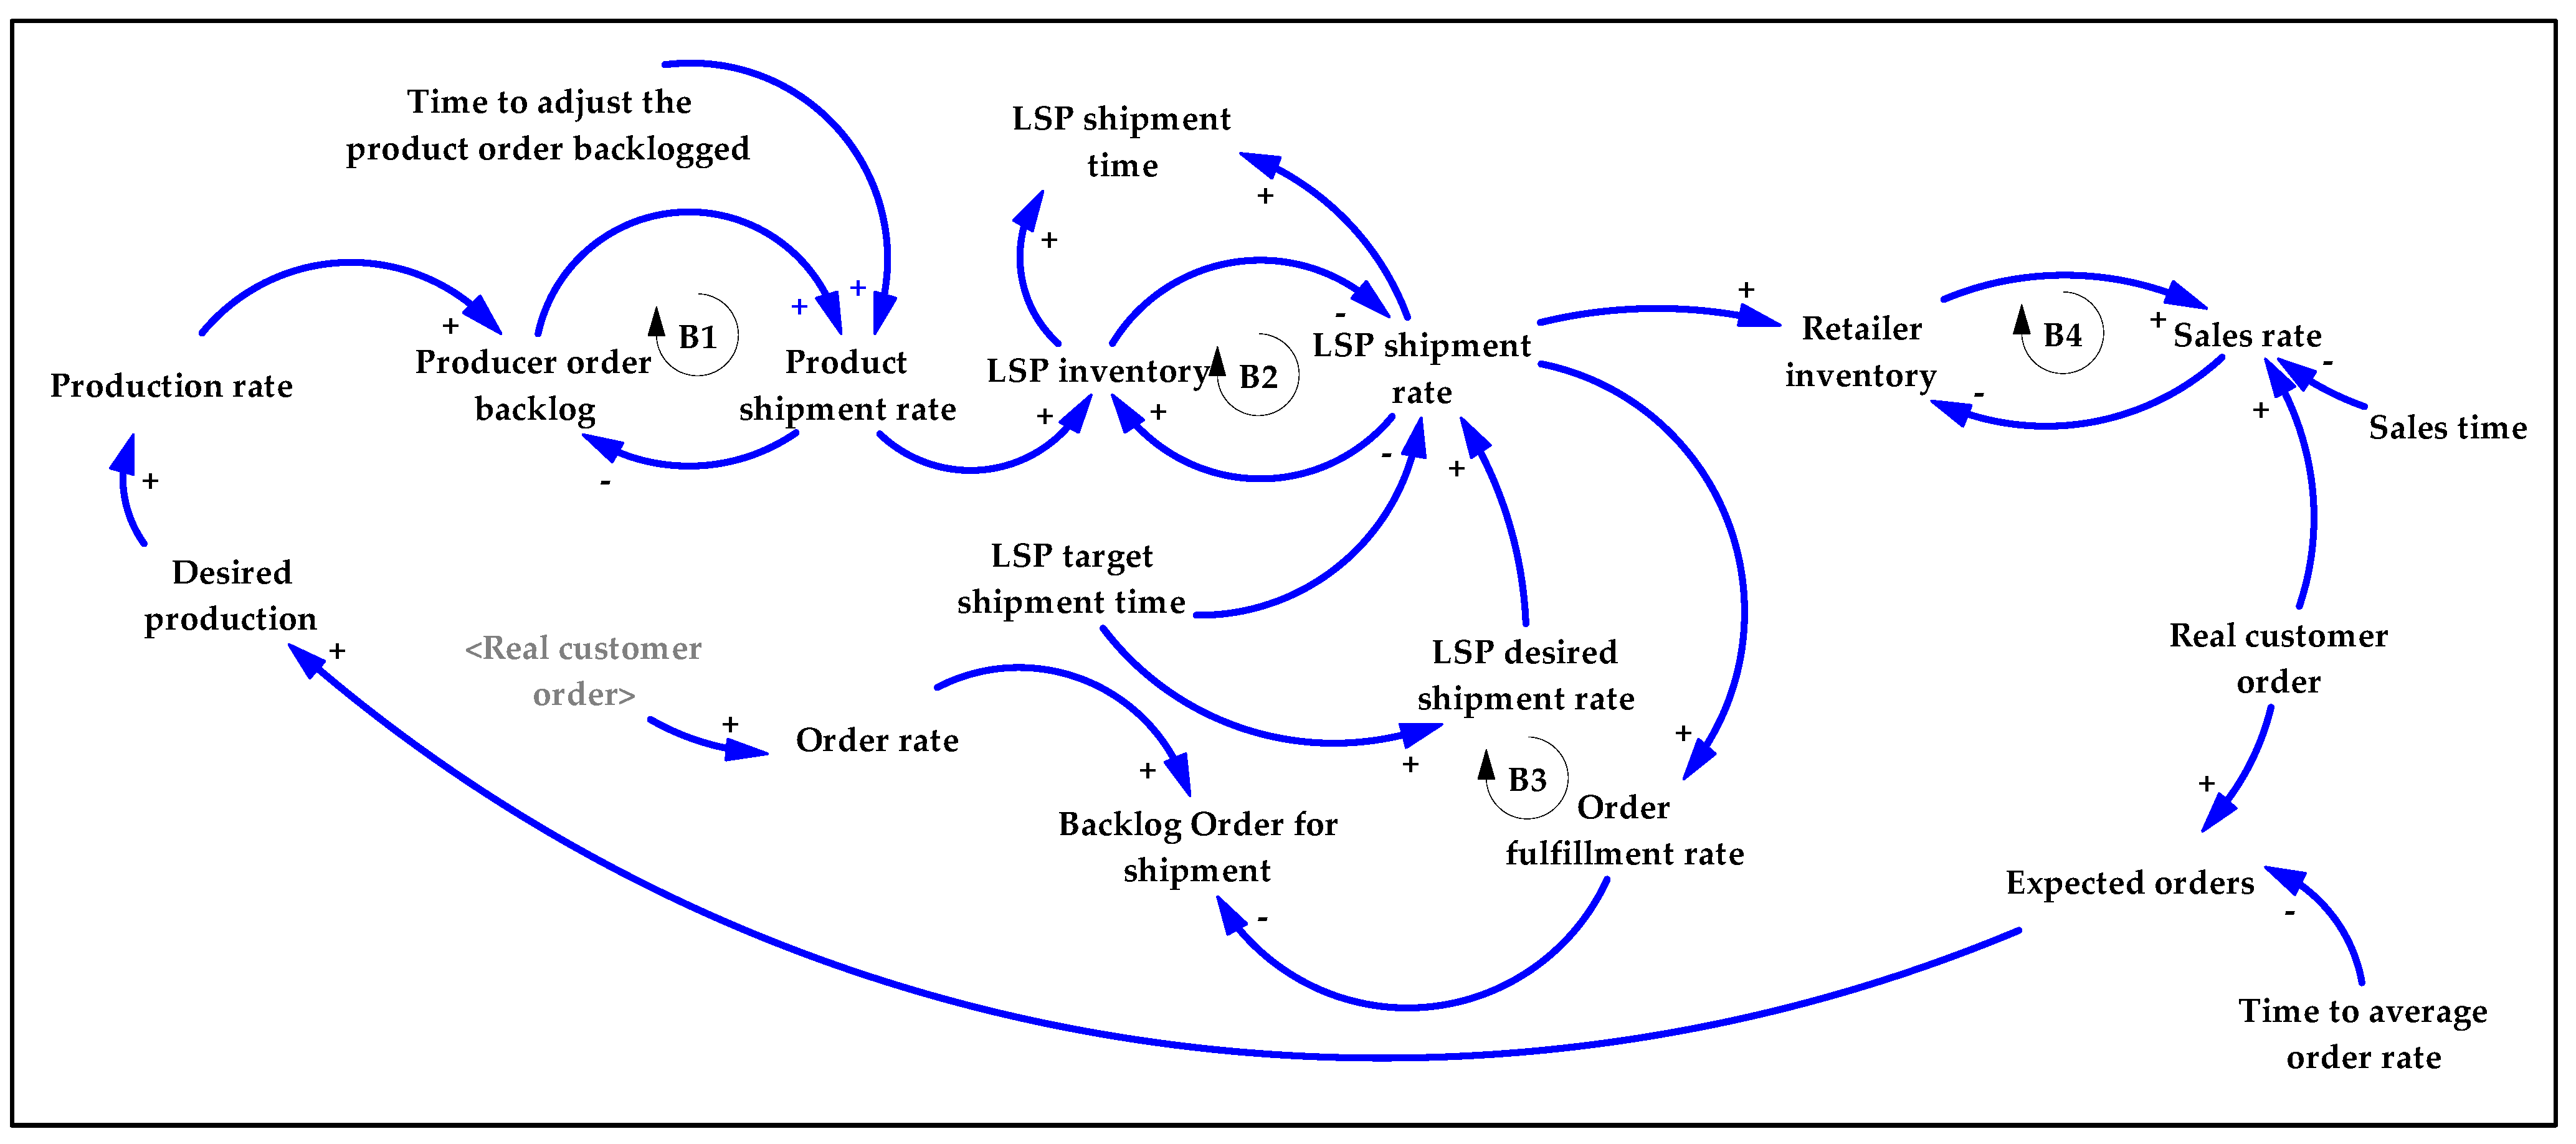
Figure 13.
SFD for cheese supply chain system.

Figure 14.
Cheese processing process, adapted from Bylund and Tetra Pak Processing Systems AB [95].
Figure 14.
Cheese processing process, adapted from Bylund and Tetra Pak Processing Systems AB [95].
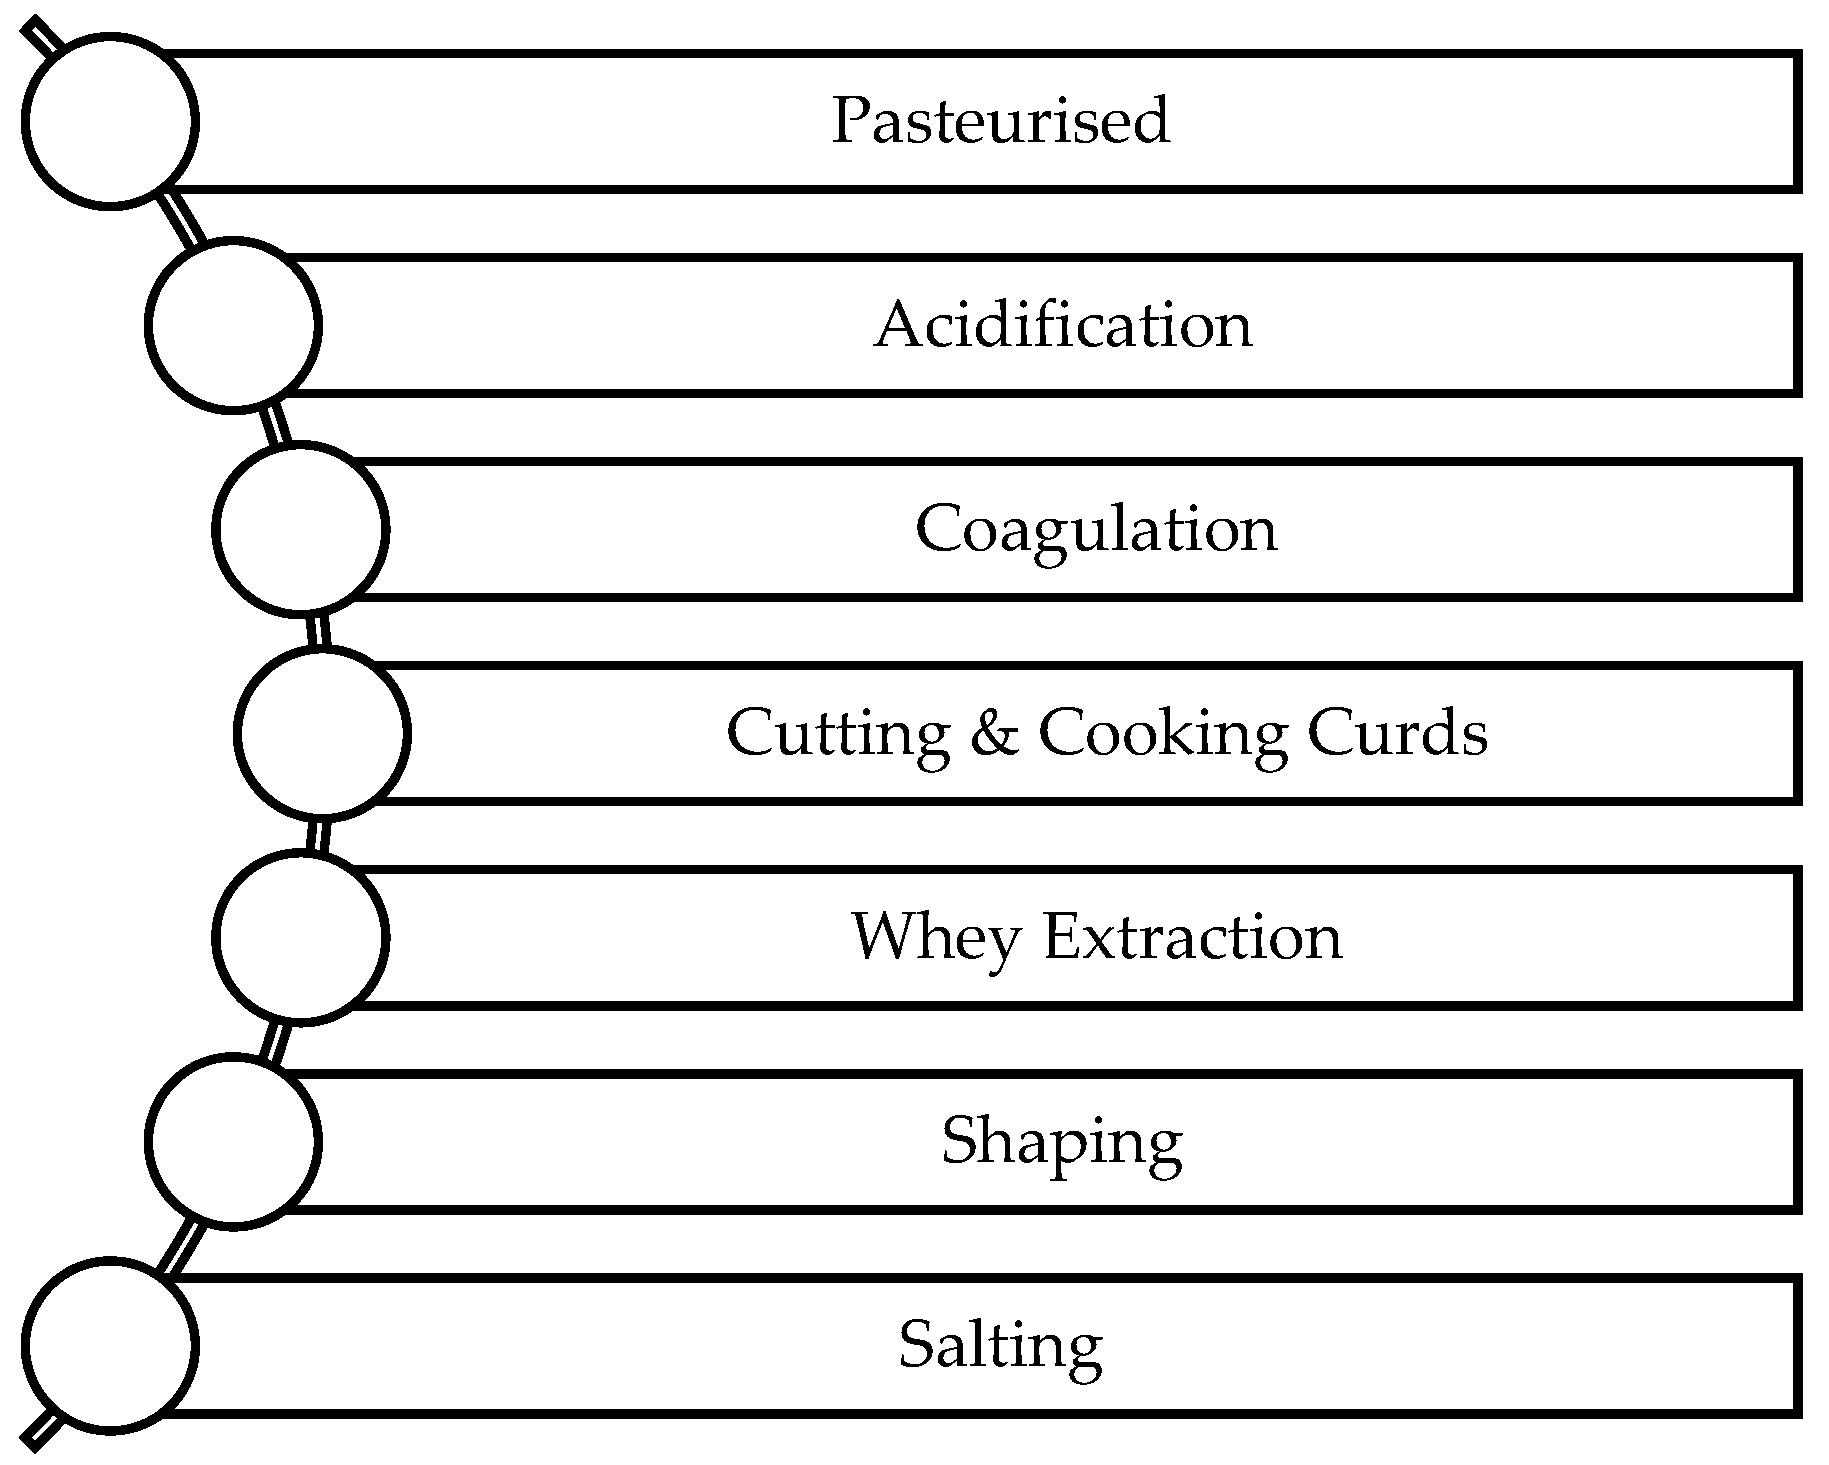
Figure 15.
FSC system performance by decreasing product order backlog to zero.

Figure 16.
Dimensional consistency test using unit check in Vensim.

Figure 17.
Sub-risk SFD model.

Figure 18.
SFD model after adding risks.
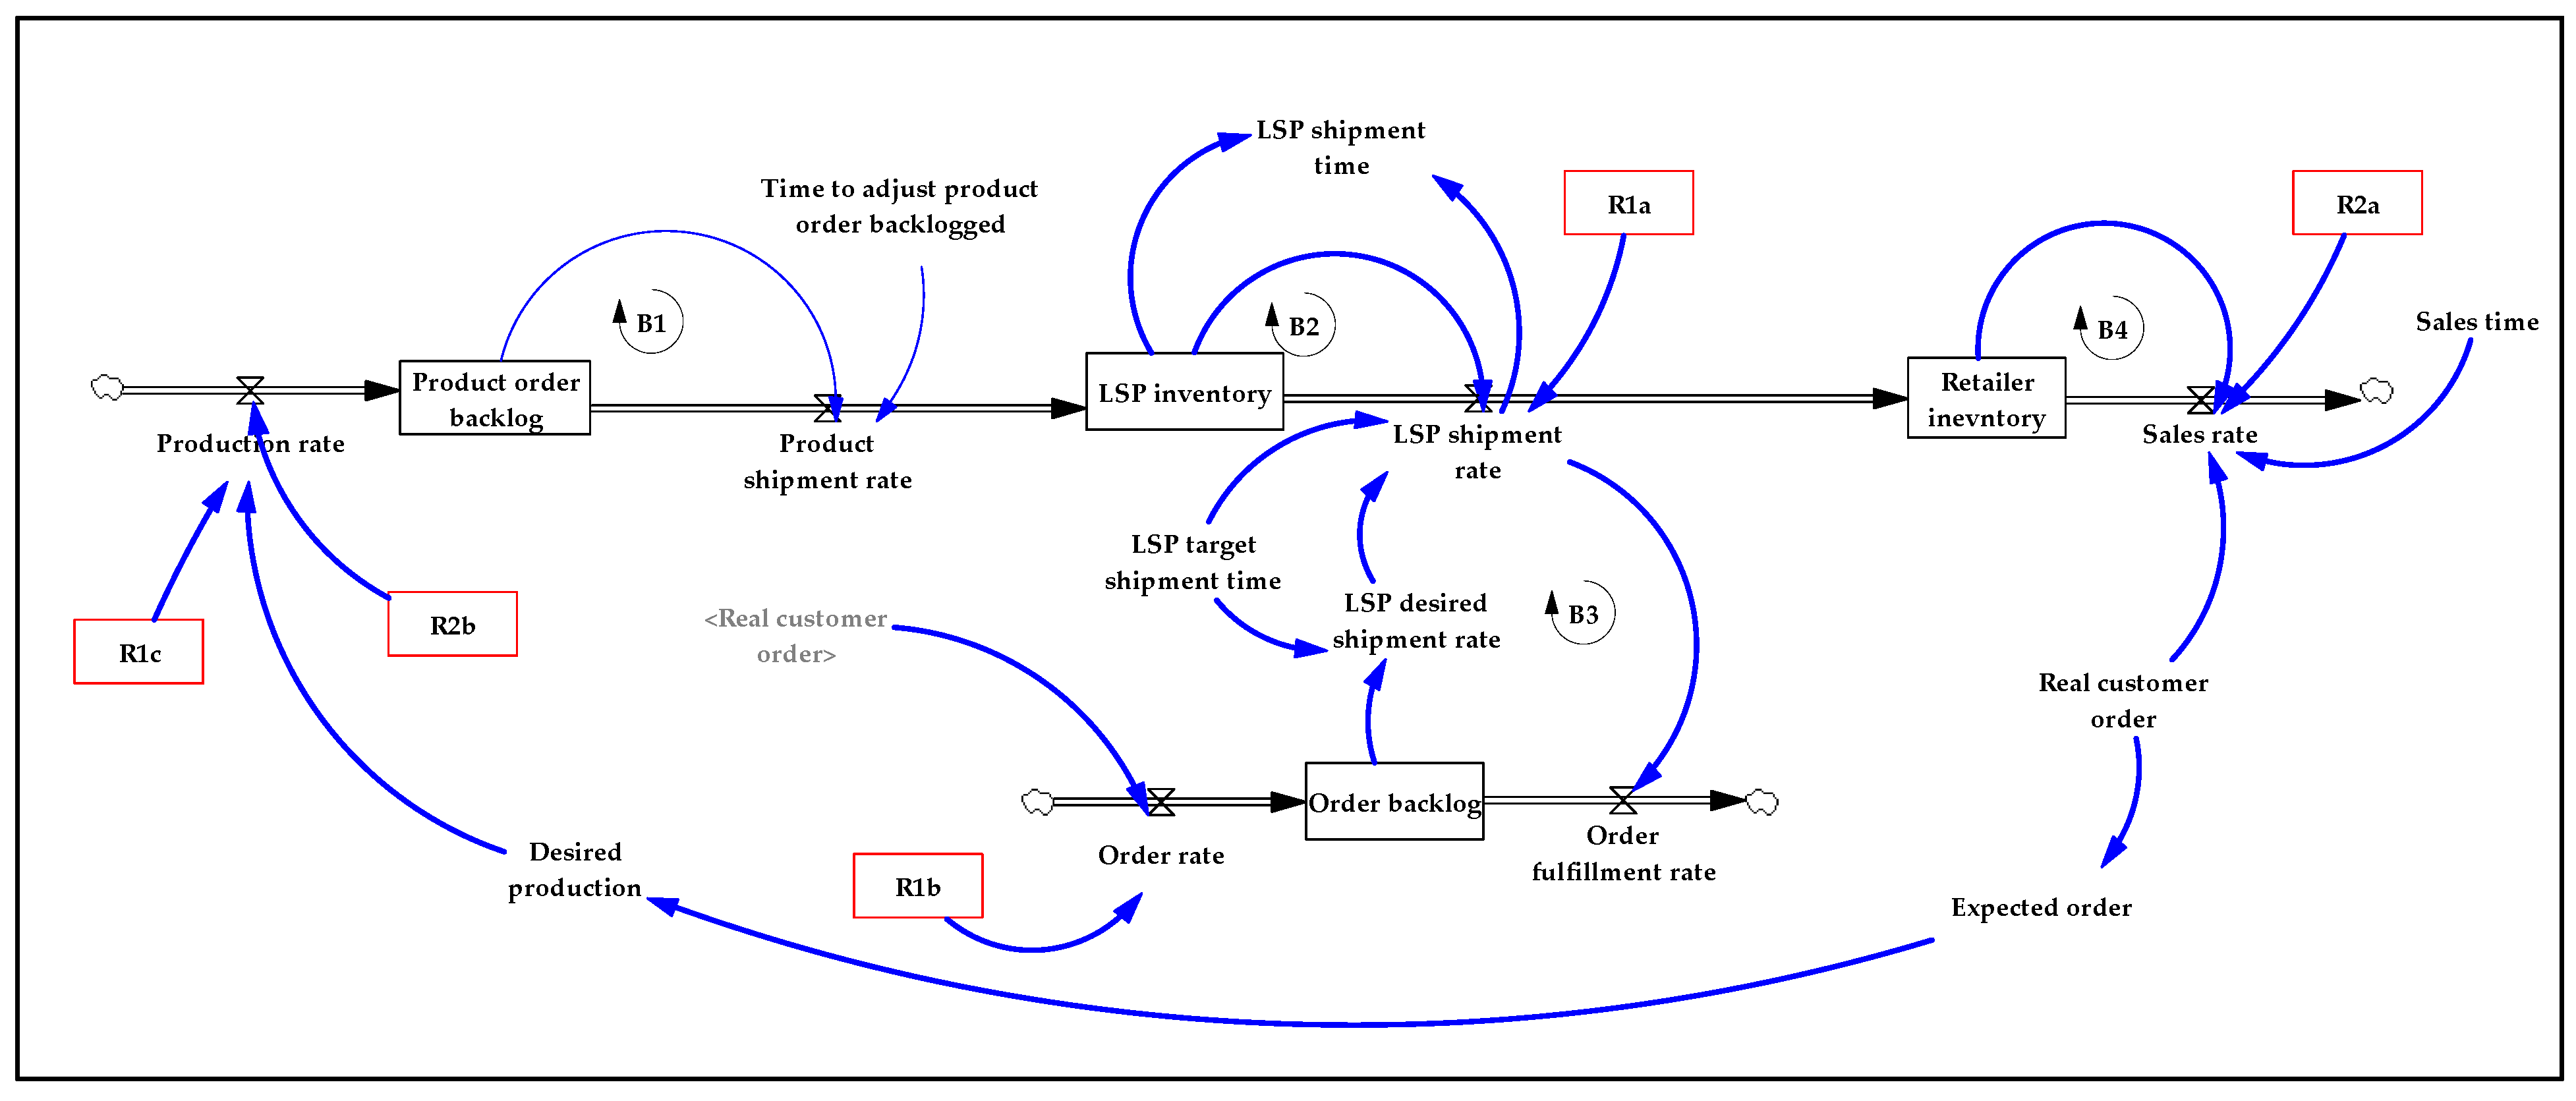
Figure 19.
The SFD model performance under natural disaster risk scenario.
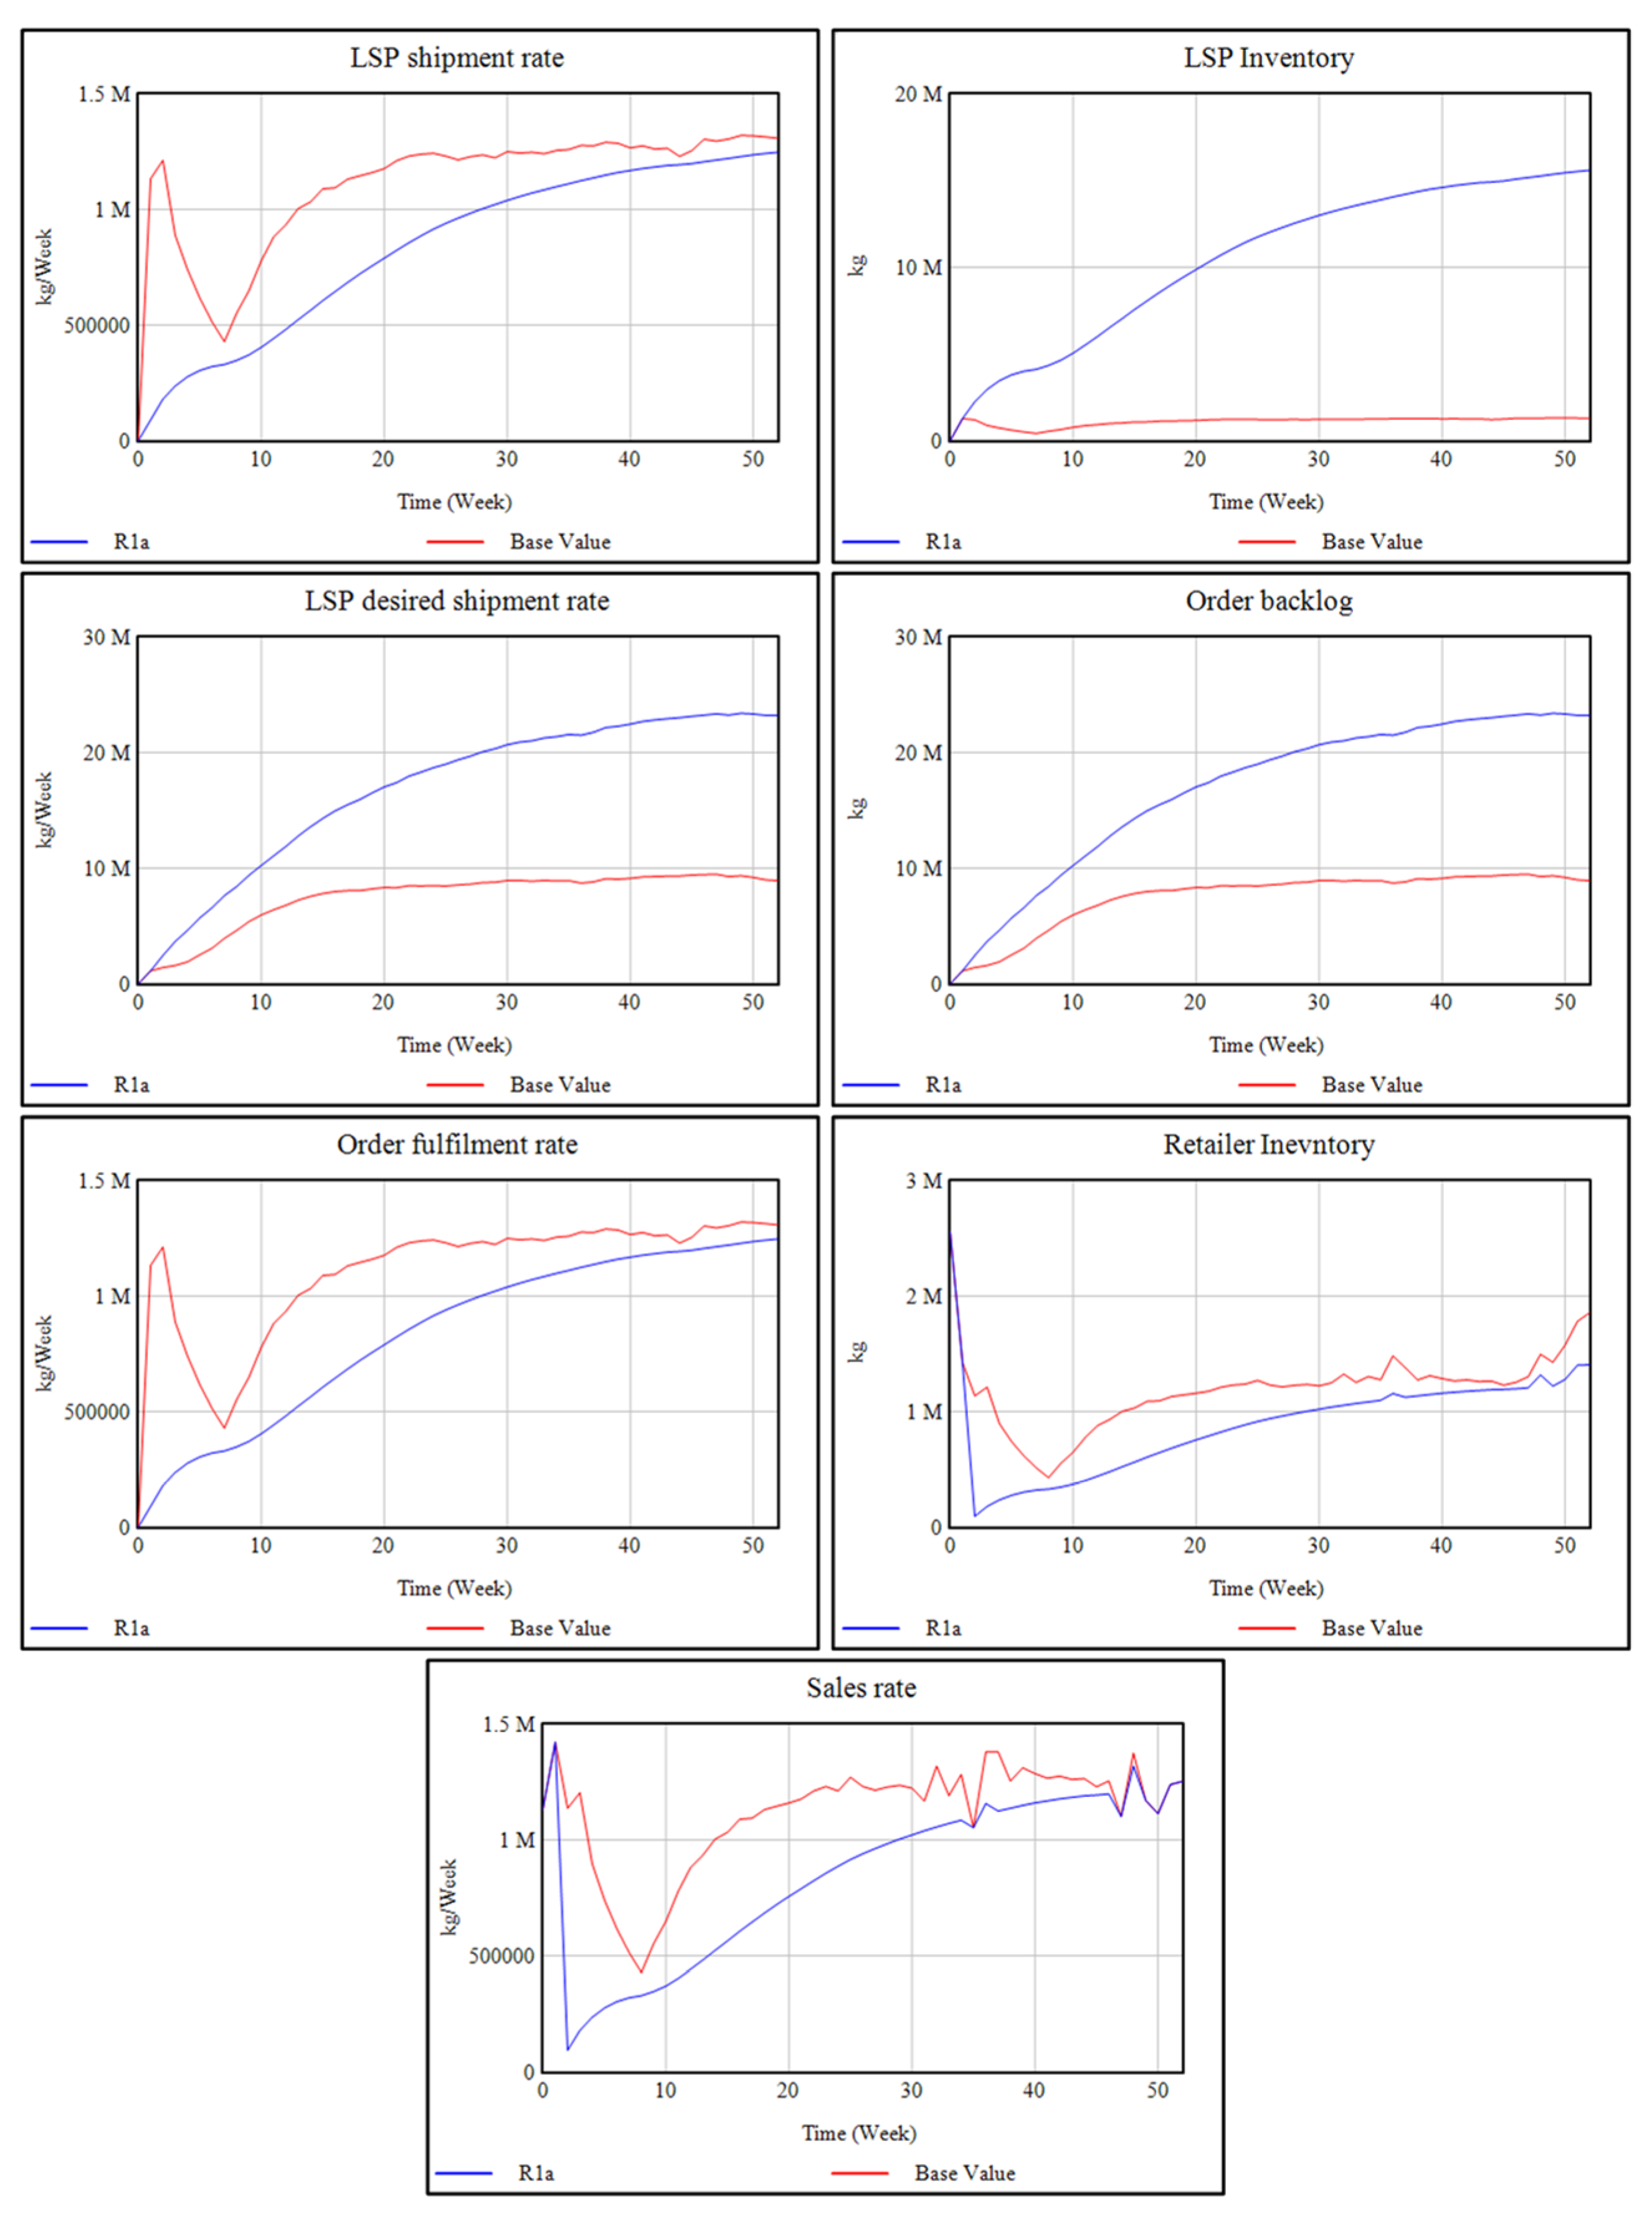
Figure 20.
The SFD model performance under COVID-19 risk scenario.

Figure 21.
The SFD model performance under labour strikes risk scenario.

Figure 22.
The SFD model performance under demand fluctuation risk scenario.
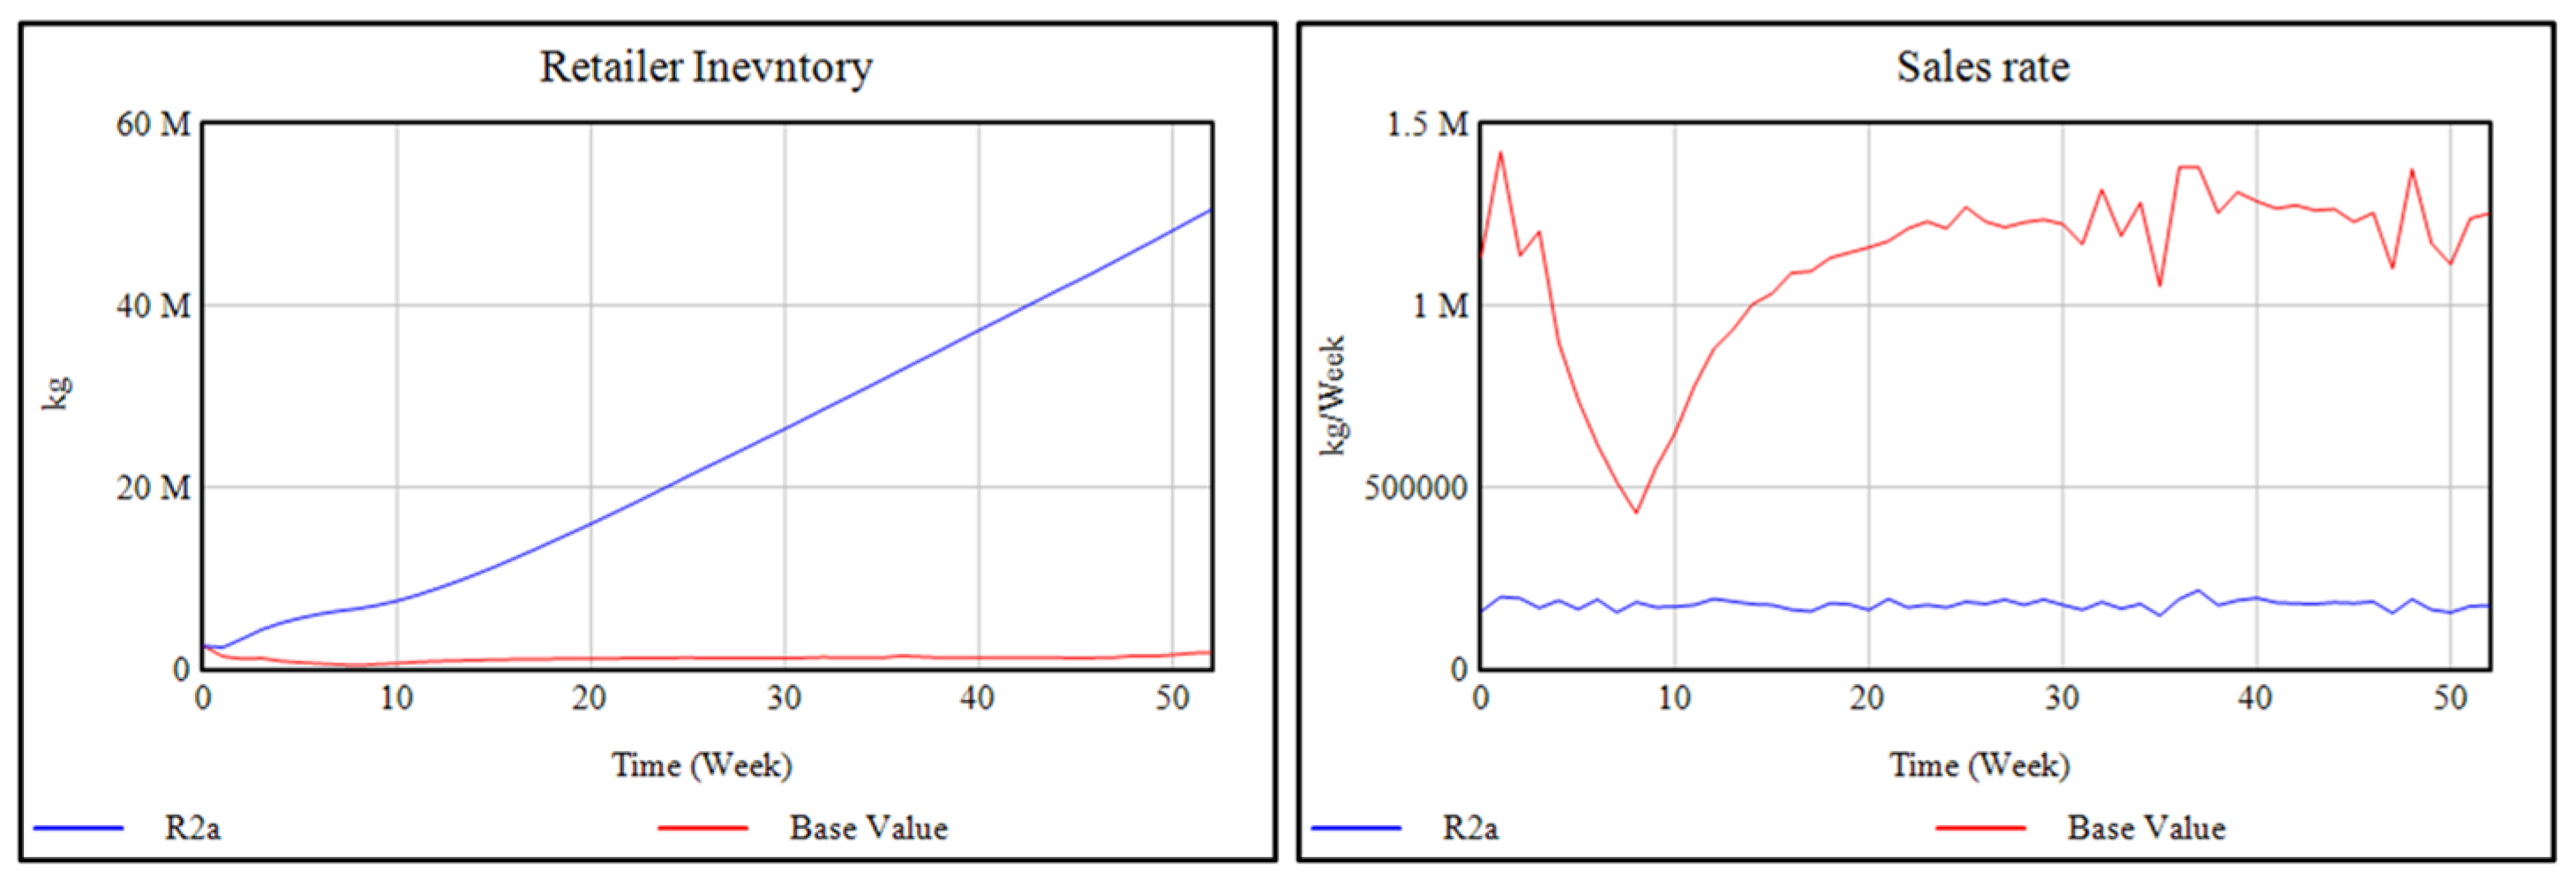
Table 2.
Definitions of selected risks for this research.
| Risks | Authors | Definitions |
|---|---|---|
| Natural disaster | Azizsafaei et al. [38] | Natural disasters, including disruptive events such as earthquakes, drought, floods, hurricanes, etc., that can negatively impact human lives and businesses. |
| Diseases | -- | The COVID-19 pandemic has explicitly been evaluated in this research. |
| Labour strikes | Gov. UK [63] | A labour strike includes work stoppage or refusal to continue to work by labour to compel employers to consider their terms/conditions and defend their rights. |
| Demand fluctuation | Ortiz-Barrios et al. [64] (p. 105) | “The failure to predict proper demand by a company leads to demand fluctuation between supply chain stages. This extends to bull-whip effect, which is a threat to economic growth”. |
| Supply quality risk | Chavez and Seow [65] (p. 2) | “A product’s quality risk/supply quality risk state in which it is affected by direct and indirect multi-tier suppliers’ materials, in which a minor risk incident can have a cumulative effect along the whole network”. |
Table 3.
Risk Assessment Matrix.
| Value | Likelihood | Impact |
|---|---|---|
| 1 | Rare | Very low |
| 2 | Unlikely | Low |
| 3 | Moderate | Medium |
| 4 | Likely | High |
| 5 | Almost Certain | Very high |
Table 4.
Risk Assessment Result.
| Risks | Symbol | Likelihood | Impact |
|---|---|---|---|
| Natural disaster | 1a | 10% | 0.8 |
| Diseases | 1b | 10% | 0.4 |
| Labour strikes | 1c | 30% | 0.2 |
| Demand fluctuation | 2a | 70% | 0.2 |
| Supply quality risk | 2b | 50% | 0.4 |
Table 5.
Causes trees for key variables in CLD model.
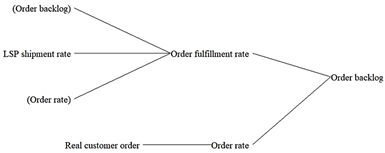 |  |
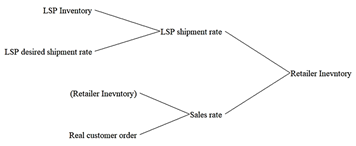 | 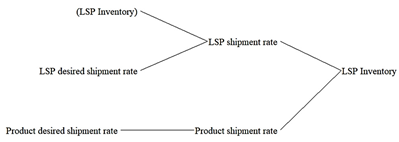 |
Table 6.
Role of major variables in cheese supply chain SFD model.
| Variable Name/Type | Variable Name/Type | Variable Name | |||
|---|---|---|---|---|---|
| Producer | Logistics Service Provider | Retailer | |||
| Production rate | F | LSP inventory | S | Retailer inventory | S |
| Producer order backlog | S | LSP shipment rate | F | Sales rate | F |
| Product shipment rate | F | LSP shipment time | A | Real customer demand rate | A |
| Time to adjust production order | A | LSP desired shipment rate | A | Expected order | A |
| Desired production | A | Order rate | F | Time to average order rate | A |
| Order backlog | S | Sales time | A | ||
| Order fulfilment rate | F | ||||
Table Note: F = Flow; S = Stock; A = Auxiliary.
Table 7.
Main Equations of the SFD model.
| Variables | Unit | Equation |
|---|---|---|
| Production rate | Kg/Week | DELAY FIXED (Desired production, 6, 0) |
| Product order backlog | Kg | INTEG (Production Rate − Production shipment rate) |
| Product shipment rate | Kg/Week | Product order backlog/Time to adjust product backlogged order |
| LSP inventory | Kg | INTEG (Product shipment rate-LSP shipment rate) |
| LSP shipment time | Week | INTEG (LSP Inventory/LSP shipment rate) |
| LSP shipment rate | Kg/Week | MIN (LSP desired shipment rate, LSP Inventory/LSP target shipment time) |
| LSP desired shipment rate | Kg/Week | Order backlog/LSP target shipment time |
| Order backlog | Kg | INTEG (Order rate − Order fulfilment rate) |
| Order fulfilment rate | Kg/Week | LSP shipment rate + Order backlog/Order rate |
| Expected order rate | Kg/Week | SMOOTH (Real customer order rate, Time to average order rate) |
| Retailer Inventory | Kg | INTEG (LSP shipment rate − Sales rate) |
| Sales rate | Kg/Week | MIN (Expected order rate, Retailer Inventory/Retailer sales time) |
| Risk Event | - | Probability × Impact |
Table 8.
Initial variable values for the SFD simulation.
| Simulation Input | Value |
|---|---|
| Product order backlog | 7.68 × 10⁶ Kg |
| Retailer Inventory | 2.56 × 10⁶ Kg |
| LSP inventory | 1 Kg |
| Real customer order | RANDOM NORMAL (9.8 × 10⁵, 1.58 × 10⁶, 1.28 × 10⁶, 1.00 × 10⁵, 1) kg/week |
| Order backlog | 1 Kg |
| Time to average order rate | 1 Week |
| LSP target shipment time | 1 Week |
| Retailer sales time | 1 Week |
| Time to adjust product order | 6 Week |
| Timestep | 1 Week |
| Simulation period | 52 Weeks |
Source: Adapted from Zhu et al. [93].
Table 9.
Interaction between risks and cheese supply chain system.
| Risk Event | Code | Interactions between Risks and Supply Chain Loops |
|---|---|---|
| Natural disaster | 1a | (1) R1a→LSP shipment rate→Order fulfilment rate→ Order backlogged→LSP desired shipment rate (2) R1a→ LSP shipment rate→LSP inventory (3) R1a→LSP shipment rate→Retailer inventory→Sales rate |
| Diseases | 1b | (1) R1b→Order rate→Order backlogged→Order fulfilment (2) R1b→Order rate→Order backlog→LSP desired shipment rate→LSP shipment rate |
| Labour strikes | 1c | (1) R1c→Production rate→Product order backlog rate→Product shipment rate→LSP inventory→LSP shipment rate→Retailer inventory→Sales rate (2) R1c→Production rate→Product order backlog rate→Product shipment rate→LSP inventory→LSP shipment rate→Retailer inventory→Sales rate |
| Demand fluctuation | 2a | R2a→Sales rate→Retailer inventory |
| Supply quality risk | 2b | (1) R2b→Production rate→Product order backlog rate→Product shipment rate→ LSP inventory→LSP shipment rate→Retailer inventory→Sales rate (2) R2b→Production rate→Product order backlog rate→Product shipment rate→LSP inventory→LSP shipment rate→Retailer inventory→Sales rate |
Table 10.
Implication of risk scenarios on SFD model parameters.
| Scenarios | |||||
|---|---|---|---|---|---|
| S1 | S2 | S3 | S4 | S5 | |
| Production rate | - | - | |||
| Order rate | - | ||||
| LSP shipment rate | - | ||||
| Sales rate | - | ||||
Note: The “-” sign represent the negative risk impacts. No positive risk was identified in any of the scenario.
Table 11.
SFD simulation results considering each risk scenario.
| LSP Shipment Rate | LSP Inventory | LSP Desired Shipment Rate | Order Fulfilment Rate | Order Backlog | Sales Rate | Retailer Inventory | Production Rate | Product Order Backlog | Product Shipment Rate | |||||||||||
|---|---|---|---|---|---|---|---|---|---|---|---|---|---|---|---|---|---|---|---|---|
| Base value | Max | 1.32 × 10⁶ | Max | 1.32 × 10⁶ | Max | 9.49 × 10⁶ | Max | 1.32 × 10⁶ | Max | 9.49 × 10⁶ | Max | 1.38 × 10⁶ | Max | 1.86 × 10⁶ | Max | 1.55 × 10⁶ | Max | 7.93 × 10⁶ | Max | 1.32 × 10⁶ |
| Min | 4.29 × 10⁵ | Min | 4.29 × 10⁵ | Min | 1.13 × 10⁶ | Min | 4.29 × 10⁵ | Min | 1.42 × 10⁶ | Min | 4.29 × 10⁵ | Min | 4.29 × 10⁵ | Min | 0 | Min | 2.57 × 10⁶ | Min | 4.29 × 10⁵ | |
| Ave | 1.13 × 10⁶ | Ave | 1.13 × 10⁶ | Ave | 7.60 × 10⁶ | Ave | 1.13 × 10⁶ | Ave | 7.72 × 10⁶ | Ave | 1.11 × 10⁶ | Ave | 1.17 × 10⁶ | Ave | 1.15 × 10⁶ | Ave | 6.76 × 10⁶ | Ave | 1.13 × 10⁶ | |
| R1a | Max | 1.25 × 10⁶ | Max | 1.56 × 10⁷ | Max | 2.34 × 10⁷ | Max | 1.25 × 10⁶ | Max | 2.34 × 10⁷ | Max | 1.42 × 10⁶ | Max | 1.43 × 10⁶ | Max | 1.55 × 10⁶ | Max | 7.93 × 10⁶ | Max | 1.32 × 10⁶ |
| Min | 9.07 × 10⁴ | Min | 1.28 × 10⁶ | Min | 1.13 × 10⁶ | Min | 9.07 × 10⁴ | Min | 1.13 × 10⁶ | Min | 9.45 × 10⁴ | Min | 9.45 × 10⁴ | Min | 0 | Min | 2.57 × 10⁶ | Min | 4.29 × 10⁵ | |
| Ave | 8.51 × 10⁵ | Ave | 1.06 × 10⁷ | Ave | 1.71 × 10⁷ | Ave | 8.51 × 10⁵ | Ave | 1.71 × 10⁷ | Ave | 8.51 × 10⁵ | Ave | 8.64 × 10⁵ | Ave | 1.15 × 10⁶ | Ave | 6.76 × 10⁶ | Ave | 1.13 × 10⁶ | |
| R1b | Max | 6.20 × 10⁴ | Max | 5.60 × 10⁷ | Max | 6.20 × 10⁴ | Max | 6.20 × 10⁴ | Max | 6.20 × 10⁴ | Max | 1.42 × 10⁶ | Max | 1.43 × 10⁶ | Max | 1.55 × 10⁶ | Max | 7.93 × 10⁶ | Max | 1.32 × 10⁶ |
| Min | 4.21 × 10⁴ | Min | 1.28 × 10⁶ | Min | 4.21 × 10⁴ | Min | 4.21 × 10⁴ | Min | 4.21 × 10⁴ | Min | 4.21 × 10⁴ | Min | 4.21 × 10⁴ | Min | 0 | Min | 2.57 × 10⁶ | Min | 4.29 × 10⁵ | |
| Ave | 5.09 × 10⁴ | Ave | 2.60 × 10⁷ | Ave | 5.09 × 10⁴ | Ave | 5.09 × 10⁴ | Ave | 5.09 × 10⁴ | Ave | 7.74 × 10⁴ | Ave | 7.75 × 10⁴ | Ave | 1.15 × 10⁶ | Ave | 6.476 × 10⁶ | Ave | 1.13 × 10⁶ | |
| R1c | Max | 1.21 × 10⁶ | Max | 1.28 × 10⁶ | Max | 5.56 × 10⁷ | Max | 1.21 × 10⁶ | Max | 5.56 × 10⁷ | Max | 1.42 × 10⁶ | Max | 1.43 × 10⁶ | Max | 9.30 × 10⁴ | Max | 6.40 × 10⁶ | Max | 1.07 × 10⁶ |
| Min | 7.43 × 10⁴ | Min | 7.43 × 10⁴ | Min | 1.13 × 10⁶ | Min | 7.43 × 10⁴ | Min | 1.13 × 10⁶ | Min | 7.43 × 10⁴ | Min | 7.43 × 10⁴ | Min | 0 | Min | 4.46 × 10⁵ | Min | 7.43 × 10⁴ | |
| Ave | 2.06 × 10⁵ | Ave | 2.09 × 10⁵ | Ave | 2.58 × 10⁷ | Ave | 2.06 × 10⁵ | Ave | 2.58 × 10⁷ | Ave | 2.32 × 10⁵ | Ave | 2.33 × 10⁵ | Ave | 6.93 × 10⁴ | Ave | 1.10 × 10⁶ | Ave | 1.83 × 10⁵ | |
| R2a | Max | 1.32 × 10⁶ | Max | 1.32 × 10⁶ | Max | 9.49 × 10⁶ | Max | 1.32 × 10⁶ | Max | 9.49 × 10⁶ | Max | 2.17 × 10⁴ | Max | 5.06 × 10⁷ | Max | 1.55 × 10⁶ | Max | 7.93 × 10⁶ | Max | 1.32 × 10⁶ |
| Min | 4.29 × 10⁵ | Min | 4.29 × 10⁵ | Min | 1.13 × 10⁶ | Min | 4.29 × 10⁵ | Min | 1.13 × 10⁶ | Min | 1.47 × 10⁴ | Min | 2.40 × 10⁶ | Min | 0 | Min | 2.57 × 10⁶ | Min | 4.29 × 10⁵ | |
| Ave | 1.13 × 10⁶ | Ave | 1.13 × 10⁶ | Ave | 7.60 × 10⁶ | Ave | 1.13 × 10⁶ | Ave | 7.60 × 10⁶ | Ave | 1.79 × 10⁴ | Ave | 2.40 × 10⁷ | Ave | 1.15 × 10⁶ | Ave | 6.76 × 10⁶ | Ave | 1.13 × 10⁶ | |
| R2b | Max | 1.21 × 10⁶ | Max | 1.28 × 10⁶ | Max | 4.86 × 10⁷ | Max | 1.21 × 10⁶ | Max | 4.86 × 10⁷ | Max | 1.42 × 10⁶ | Max | 1.43 × 10⁶ | Max | 3.10 × 10⁵ | Max | 6.40 × 10⁶ | Max | 1.07 × 10⁶ |
| Min | 2.46 × 10⁵ | Min | 2.46 × 10⁵ | Min | 1.13 × 10⁶ | Min | 2.46 × 10⁵ | Min | 1.13 × 10⁶ | Min | 2.46 × 10⁵ | Min | 2.46 × 10⁵ | Min | 0 | Min | 1.48 × 10⁶ | Min | 2.46 × 10⁵ | |
| Ave | 3.43 × 10⁵ | Ave | 3.46 × 10⁵ | Ave | 2.31 × 10⁷ | Ave | 3.43 × 10⁵ | Ave | 2.31 × 10⁷ | Ave | 3.66 × 10⁵ | Ave | 3.66 × 10⁵ | Ave | 2.31 × 10⁵ | Ave | 1.94 × 10⁶ | Ave | 3.54 × 10⁵ | |
Table 12.
The comparisons of risk scenario simulation results with the base value.
| LSP Shipment Rate | LSP Inventory | LSP Desired Shipment Rate | Order Fulfilment Rate | Order Backlog | Sales Rate | Retailer Inventory | Production Rate | Product Order Backlog | Product Shipment Rate | |
|---|---|---|---|---|---|---|---|---|---|---|
| R1a | −24% | 842% | 125% | −24% | 121% | −23% | −26% | 0% | 0% | 0% |
| R1b | −95% | 2199% | −99% | −95% | −99% | −93% | −93% | 0% | 0% | 0% |
| R1c | −82% | −81% | 239% | −82% | 234% | −79% | −80% | −94% | −84% | −84% |
| R2a | 0% | 0% | 0% | 0% | −2% | −84% | 1949% | 0% | 0% | 0% |
| R2b | −70% | −69% | 204% | −70% | 199% | −67% | −69% | −80% | −71% | −71% |
Publisher’s Note: MDPI stays neutral with regard to jurisdictional claims in published maps and institutional affiliations. |
© 2022 by the authors. Licensee MDPI, Basel, Switzerland. This article is an open access article distributed under the terms and conditions of the Creative Commons Attribution (CC BY) license (https://creativecommons.org/licenses/by/4.0/).
Share and Cite
MDPI and ACS Style
Azizsafaei, M.; Hosseinian-Far, A.; Khandan, R.; Sarwar, D.; Daneshkhah, A. Assessing Risks in Dairy Supply Chain Systems: A System Dynamics Approach. Systems 2022, 10, 114. https://doi.org/10.3390/systems10040114
AMA Style
Azizsafaei M, Hosseinian-Far A, Khandan R, Sarwar D, Daneshkhah A. Assessing Risks in Dairy Supply Chain Systems: A System Dynamics Approach. Systems. 2022; 10(4):114. https://doi.org/10.3390/systems10040114
Chicago/Turabian StyleAzizsafaei, Maryam, Amin Hosseinian-Far, Rasoul Khandan, Dilshad Sarwar, and Alireza Daneshkhah. 2022. "Assessing Risks in Dairy Supply Chain Systems: A System Dynamics Approach" Systems 10, no. 4: 114. https://doi.org/10.3390/systems10040114
Note that from the first issue of 2016, this journal uses article numbers instead of page numbers. See further details here.