


Exploiting Service Design in Service Quality: Escorting the Customer’s Experiential Value in the Journey of a Star-Rated Hotel

1
Department of Creative Design, National Yunlin University of Science and Technology, Douliou, Yunlin 64002, Taiwan
2
Graduate School of Design, National Yunlin University of Science and Technology, Douliou, Yunlin 64002, Taiwan
*
Author to whom correspondence should be addressed.
Systems 2023, 11(4), 206; https://doi.org/10.3390/systems11040206
Submission received: 31 December 2022
/
Revised: 5 April 2023
/
Accepted: 10 April 2023
/
Published: 19 April 2023
(This article belongs to the Special Issue Futures Thinking in Design Systems and Social Transformation)
Abstract
:The present research presented a novel model for incorporating service design to create guest experiential value. Taking a star hotel in Taiwan as an example, this study used the KJ method to classify online reviews about hotel services and then created a customer journey map (CJM) through participant observation of the entire service process. By deconstructing the service process and identifying key service touchpoints, service design ideas were incorporated into the CJM. A Kano questionnaire was then adopted to accommodate 38 service scape attributes in 4 segments: 1 attribute in the maintenance area, 10 of the high-priority area, 11 of the low-priority area, and 16 of differentiation. The overall research results propose experience design strategies for the hotel industry in terms of the service content and operation processes of star-rated hotels, which can then be adjusted according to their operating conditions to construct their unique service experience content. This is expected to be the basis for subsequent research and serve as a basis and reference for improving hotel service design strategies and competitiveness in the future.
1. Introduction
According to recent changes in industrial structures, original equipment manufacturers in Taiwan have moved away from the previous labor-intensive manufacturing model toward providing highly added-value services, thus leading to the vigorous development of tourism and hospitality. In the past, hotel management was mainly focused purely on providing accommodation, food, and beverage services. To change the outlook of hotels, information collected from consumer feedback has been transformed into experiential services. According to Schmitt [1], Schmitt and Zarantonello [2], and Walls, et al. [3], “through observation or participation in an event, a customer is stimulated to generate motivation, produce conceptual recognition or consumer behavior, and enhance product value. Products or services can provide a holistic experience (sense, feel, and relate) for customers, creating activities related to lifestyle marketing and brand identity”. Experiential marketing is how an enterprise uses its space in the environment as a stage; products or services as a carrier; and culture, art, and technology to increase product content to satisfy the needs of customers for experiences. Experiential marketing will help marketers to steer away from competition within the scope of function and price and move toward using more powerful marketing methods to identify new survival niches and spaces.
Take hotels as an example: traditional hotel management emphasizes more explicit factors, such as hardware facilities, staff service attitude, and food and beverage services. As competition in the hotel industry intensifies, management must shift its focus to enhancing the consumer experience. Customer experience can be improved by creating a positive atmosphere in the hotel environment, providing friendly reception services, managing the hotel through rational planning and operation, developing sensual ambiance designs and heartwarming services, and arranging outdoor recreational facilities and locations where delicious food and beverages are served. For this reason, innovative tools must be used to think outside the box and identify customer pain points [4,5]. With the growth of the economy, the purchase decision of consumers is no longer based solely on the product or service itself; the sensory experience throughout the consumption process also affects consumer decisions, and operational management revolves around customer-centric activities where customers are the source of profit for business owners.
Through a literature review and analysis and use of service design tools with customers as a point of departure, this study adopted a people-oriented conceptual design, taking everything into consideration rather than thinking of hotels as a normal operational model. The objective was to understand the value and cultural positioning of a brand, to incorporate brand personality, and to enhance and improve service content. By placing customers at the center, we developed a new economic model that creates different sensory experiences to bring about customer satisfaction and the value underlying it. The performance of a hotel in service scape attributes (e.g., consumer reviews) can be viewed as a “quality” that significantly affects whether consumers are satisfied with the hotel or are willing to spend their money on the hotel. The Likert scale is frequently used to measure consumer perception of service quality, but this form of measurement is generally accompanied by the assumption that the service quality attribute is linearly related to consumer satisfaction [6,7]. However, this scale can no longer fully and effectively explain the diverse range of consumer behaviors seen in the market. According to the Kano Model [8,9], service quality comprising the two-factor theory [10,11] is integrated into a two-dimensional framework. Using this framework as the theoretical foundation, this study analyzed the quality attributes, assessed the effects of these attributes, and identified the weights of each attribute in order of its importance in hotel management.
Kano model analysis analyzes the correlation between product features and customer satisfaction by dividing product quality into levels to identify the features that can effectively improve customer satisfaction and prioritize the improvement of product features. This model is an extension of the two-factor theory, but while the former is mainly concerned with job satisfaction, this model is mainly concerned with the products and services provided by the company. Generally, user research is required, usually in the form of matrix scales for users to make (add a feature and service feeling) (without adding a feature and service feeling) positive and negative evaluations of features and services.
Kano model analysis is generally used for the study of website satisfaction, service quality elements, quality positioning, and service quality performance, combined with customer experience observation and service-design-related tools. Generally, we use quantitative methods to evaluate hotel service items. However, this study uses service design tools combined with the Kano theory model to conduct research, emphasizing that we not only care about the emergence of data but also hope that through the analysis process of service design tools, we can decompose the service content more carefully to have a more intimate service content presentation so that the industry, service planners, and even designers can have a more diversified way to understand the real needs of the customer base: that is, to stimulate the issuance of multiple solutions and more open options, with priority and corresponding project menus, which can accurately estimate investment costs.
This study proposes that by establishing an analysis process for various service design tools, we can obtain immediate, clear, and reliable information that will provide an important reference for service planning, design positioning, operating costs, and development optimization priorities for hotel venues.
The results of this study will validate the combination of the two-dimensional quality characteristics of the questionnaire and related service design tools to show how five-star hotels will upgrade and optimize their service processes and hardware and software, providing hotel managers with new competitive advantages and specific strategies for future planning. The purpose of this study consists of two points:
(1) We hope to identify service gaps through research and analysis of data on the value of hotel service experience, room environment demand, user behavior experience, and market surveys to facilitate the subsequent planning of how to define specific service types and service contact points for investment in future hotels according to customer segments.
(2) By using service design tools, such as a customer journey map, service blueprint, KJ analysis, and Kano analysis, we deconstruct the service history of hotels and propose key service contact points to identify the different degrees of influence of the quality attribute performance on consumer satisfaction to effectively satisfy consumers’ perception of quality, clarify the content of service areas and optimize the sequence, reduce service costs, and serve as a reference for future positioning and development of hotel service planning and design.
2. Literature Review
2.1. Experience Economy
Experience in today’s experience economy refers to a series of memorable events and activities that engage an individual in a personal way, and it exists in four realms, namely entertainment, educational, escapist, and esthetic experiences [12,13,14]. Consumers have morphed into a giant experience machine in this new form of capitalism, in which the human’s sensory experiences have become a niche where products and shopping journeys must engage consumers in an enjoyable, experiential way [15,16]. As a result, experience appears as a new source of value, and consumers are hardly satisfied with merely the functions of either products or services [13,17,18]. This phenomenon suggests that businesses must create engaging and memorable experiences for consumers by exploiting products, services, or both.
The literature has suggested that interactions with consumers, either servicescape or in-person services, bring valuable experiences, such as new knowledge, pleasant learning, and occasional surprises, among others, which please customers and accordingly produce customer satisfaction as well as business financial gains [19,20].
The concept of the experience economy is widely adopted for both academic and industrial interests, e.g., exploring the memories of customers regarding rural restaurants [21], enhancing senior tourists’ well-being perception [22], studying the path of enhancing library utilization [23], examining the experiential elements of brand loyalty [24], and developing tourism products [25,26], among others. This approach helps to integrate customer experience and opinions into business strategies and practices and eventually benefits hotel management and brand-building.
2.2. Service Design (SD)
Service design is a design activity or practice that adds value to a service by designing overall interaction, experiences, and relationships with internal and external stakeholders to efficiently and effectively deliver value propositions to the service receiver, and to achieve long-term strategic benefits through value co-creation and networks (or systems) [27,28]. Similar to conducting an orchestra [29], service design (SD) is a holistic discipline integrating plans and actions of management, marketing, design, and research to create optimal services across all touchpoints to meet the needs of clients and the organization in an effective way [30]. SD is generally used to test the quality and brand image of a service iteratively before launching. SD provides positive interactive experiences across different touchpoints among people, systems, and the environment across the entire customer journey. Businesses may redefine a service with SD to deliver it in a more desirable way for customers’ value perception, as well as for business effectiveness [30,31,32,33,34].
The literature has suggested an in-depth understanding of the core concept and value of a service with five principles of SD: user-centered, co-creative, sequencing, evidencing, and holistic [35,36]. In short, a service should be designed as an overall experience based on users’ needs and all stakeholders’ benefits with a well-determined corresponding schedule and user feedback mechanism. An SD plan can then be implemented with a three-step rule, service concept development, service framework plan, and service touchpoints design once the evaluations surrounding the SD have been completed [37,38].
2.3. Customer Journey Map
A customer journey map (CJM) is a graphical illustration that uses a series of touchpoints based on customer experience to describe how a customer interacts with a service throughout the entire process [39]. A customer journey may include activities performed with a service, starting from different stages of evaluation, purchasing, using, and reviewing. It is synonymous with a script of service scenarios, in that it provides a vivid and structured visual presentation of the experience a customer has with a service [40]. As a tool in service management, it employs simple methods to provide the details of service interaction and the emotions experienced therein. Since CJM is centered around the experience of customers, providing solutions with broader customer-related perspectives instead of solely for business efficiency [41], businesses are then able to contemplate problems with real scenarios. CJM can be viewed as a storybook that describes how customers are motivated by and then experience the factors within the journey and states the sum of the experiences across all touchpoints associated with a company [42].
Six basic approaches have been proposed by Maechler, et al. [43] to manage the customer journey. The first step is to reidentify and depict the journeys from the customer’s perspective, followed by exploring the touchpoints the customers navigate through the journey; then, anticipating the customer’s needs, expectations, and desires in each touchpoint, constructing a basic understanding of what is working and what is not, and prioritizing each gap and associated improvement opportunity; and finally, mending the root-cause issues and redesigning the journeys for an optimal experience. After an understanding of the customer journey is obtained, the journeys taken can be effectively managed from the customer’s point of view to create a better customer experience.
2.4. Service Blueprinting
Service improvement begins with an accurate and specific understanding of every service process and component [44]. Service blueprint (SB) is one of the most useful tools used in service design and innovation to visualize and conceptualize the entire service process [45,46,47,48] to test assumptions, prevent service failures, and improve management efficiency. Businesses widely adopted SB, including the industries of tourism and hotel industry [49,50,51,52], to identify key items and repetitive tasks by combing through processes and clarifying services with a diagram that visualizes the relationships between users, service providers, and other roles involved in a service process.
Touchpoints and moments of truth are the two major components of an SB. The former indicates the points of interaction with clients directly or indirectly, and the latter documents the moment when users make decisions about the next step [53]. It details the services customers encounter and the backstage or behind the scene actions taken [54]. The distribution of touchpoints is constructed by referring to the customer journey map, from which the future service blueprint can be derived. The development of an SB is a co-creation of services across different departments, both service encounters and backstage, that contribute to customer service. Three lines can be figured in an SB: the line of interaction between service personnel and the customer, the line of visibility of a service, and the line of internal interaction with backstage contact employees [44,55]. Service blueprinting can benefit a business in many ways, including in service co-creation, clarifying the responsibilities of each department, developing preventive actions for potential failures via the comprehensive evaluation of all touchpoints, and creating new services from touchpoints [56]. In sum, service blueprints can help hotel managers to check all operations in the service process, identify potential problems in the service system, and improve deficiencies.
To be effective, SB should have substantial flexibility in response to the dynamic nature of customer needs, competition, and the environment [47,57,58]. This is particularly important for the hospitality business, from which service providers can infuse local features and characteristics into various service dimensions and customer experiences to create an extraordinary journey for travelers.
2.5. The Kano Model
Quality must be clearly defined to gain a competitive niche [59,60]. To solve service quality problems, related studies have identified attributes that influence how consumers measure quality, subsequently verifying the linear relationship between service quality attributes and consumer satisfaction. Such a relationship, however, is not always linearly correlated. Different quality attributes have different degrees of influence on customer satisfaction [61]. The Kano model was thus proposed to abandon the linear assumption about quality and satisfaction. The focus on the customer’s perception of quality was thus moved from the “physical aspect” to the “psychological aspect” [62,63].
The Kano model is not simply an analytical tool; instead, it requires users to understand the underlying principles and not just follow a conventional quality improvement process of quality control, quality management, and the creation of attractive quality. With this idea in mind, the Kano model can help us to determine the process to which a function or service belongs by appreciating the needs of customers. In addition, the Kano model can be used as a tool to find solutions to problems [64,65].
In the Kano model, as shown in Table 1, the vertical axis represents “consumer” satisfaction or dissatisfaction, and the horizontal axis represents the presence or absence of “quality”. Using this matrix, we classified the presence or absence of quality requirements and user satisfaction into five quality dimensions: (1) must-be, (2) one-dimensional, (3) attractive, (4) indifferent, and (5) reverse [8,66,67].
By asking A-not-A questions, the Kano model generates satisfaction in two-dimensional quadrants, instead of the single way of one dimension, to clarify whether the respondent needs a specific design (function or service). The functions or services that effectively improve customer satisfaction can be identified with the Kano model to analyze the correlation between product functionality, services, and customer satisfaction and to determine the priorities for improving product functionality.
These studies demonstrate the robustness and effectiveness of the Kano model in evaluating customer satisfaction and identifying critical features in various service industries, such as mobile banking services [68], community-based medical care services [69], and hospital food services [70]. Additionally, the Kano model has been applied to identify critical features in the heavy-duty vehicle industry [71], electronic library services [72], e-learning services [73], residential environments [74], urban greening services [75], online learning in higher education [76], fitness services [77], urban public space facilities [78], the catering industry [79], virtual stores [80], the online shopping experience [81], long-term care services for the elderly [82], museum mobile app services [83], public bus transport services [84], and intelligent transportation systems [85].
These studies provide evidence of the Kano model’s reliability and validity in evaluating customer satisfaction and identifying critical features across a wide range of service industries. As such, we believe that the Kano model is a suitable and effective method for the analysis of customer preferences in our study.
Moreover, we followed the established guidelines for using the Kano model, including the collection of data from a representative sample of participants and the use of statistical analysis to identify key features and assess their importance and satisfaction levels. We also conducted a reliability analysis to ensure the consistency and stability of our findings.
In summary, we are confident in the validity and reliability of our study’s results, as supported by the numerous recent academic articles that have used the Kano model across various fields, including the study by Shafique and Abbas [86] on the satisfaction level of customers for online shopping websites and the study by Yoo et al. on the satisfaction of healthcare service users [87].
2.6. Service Attributes of Hotels
Service attributes are essential components of hotel services that determine the quality of guest experience and satisfaction. These attributes can be categorized into tangible and intangible factors, which contribute to guests’ likelihood of returning to the hotel. The following literature review provides the latest research on service attributes in hotels:
(1) Tangible service attributes
Tangible service attributes refer to the physical aspects of hotel services that guests can experience and evaluate, such as the hotel’s appearance, cleanliness, and facilities. According to a recent study by Chen, et al. [88], the tangible service attributes that have the most significant impact on guests’ satisfaction with hotel services are room cleanliness, hotel security, and the quality of hotel facilities.
(2) Intangible service attributes
Intangible service attributes refer to the emotional and psychological aspects of hotel services that guests cannot see but can feel and evaluate, such as the hotel’s atmosphere, hospitality, and personal attention. In a recent study by Le, et al. [89], the intangible service attributes that have the most significant impact on guests’ satisfaction with hotel services are empathy, assurance, responsiveness, and reliability.
(3) Staff service attributes
Staff service attributes refer to the interaction between hotel staff and guests, such as the friendliness, competence, and professionalism of the staff. According to a recent study by [90], the staff service attributes that have the most significant impact on guests’ satisfaction with hotel services are staff responsiveness, staff competence, and staff empathy.
(4) Location and accessibility
Location and accessibility are important service attributes that influence guests’ decision to choose a hotel. A hotel’s location should be convenient and accessible for guests, whether for business or leisure travel. In a recent study by Kim and Jang [91], the location and accessibility of a hotel are the most significant factors that influence guests’ satisfaction with hotel services.
3. Methods
3.1. Research Process
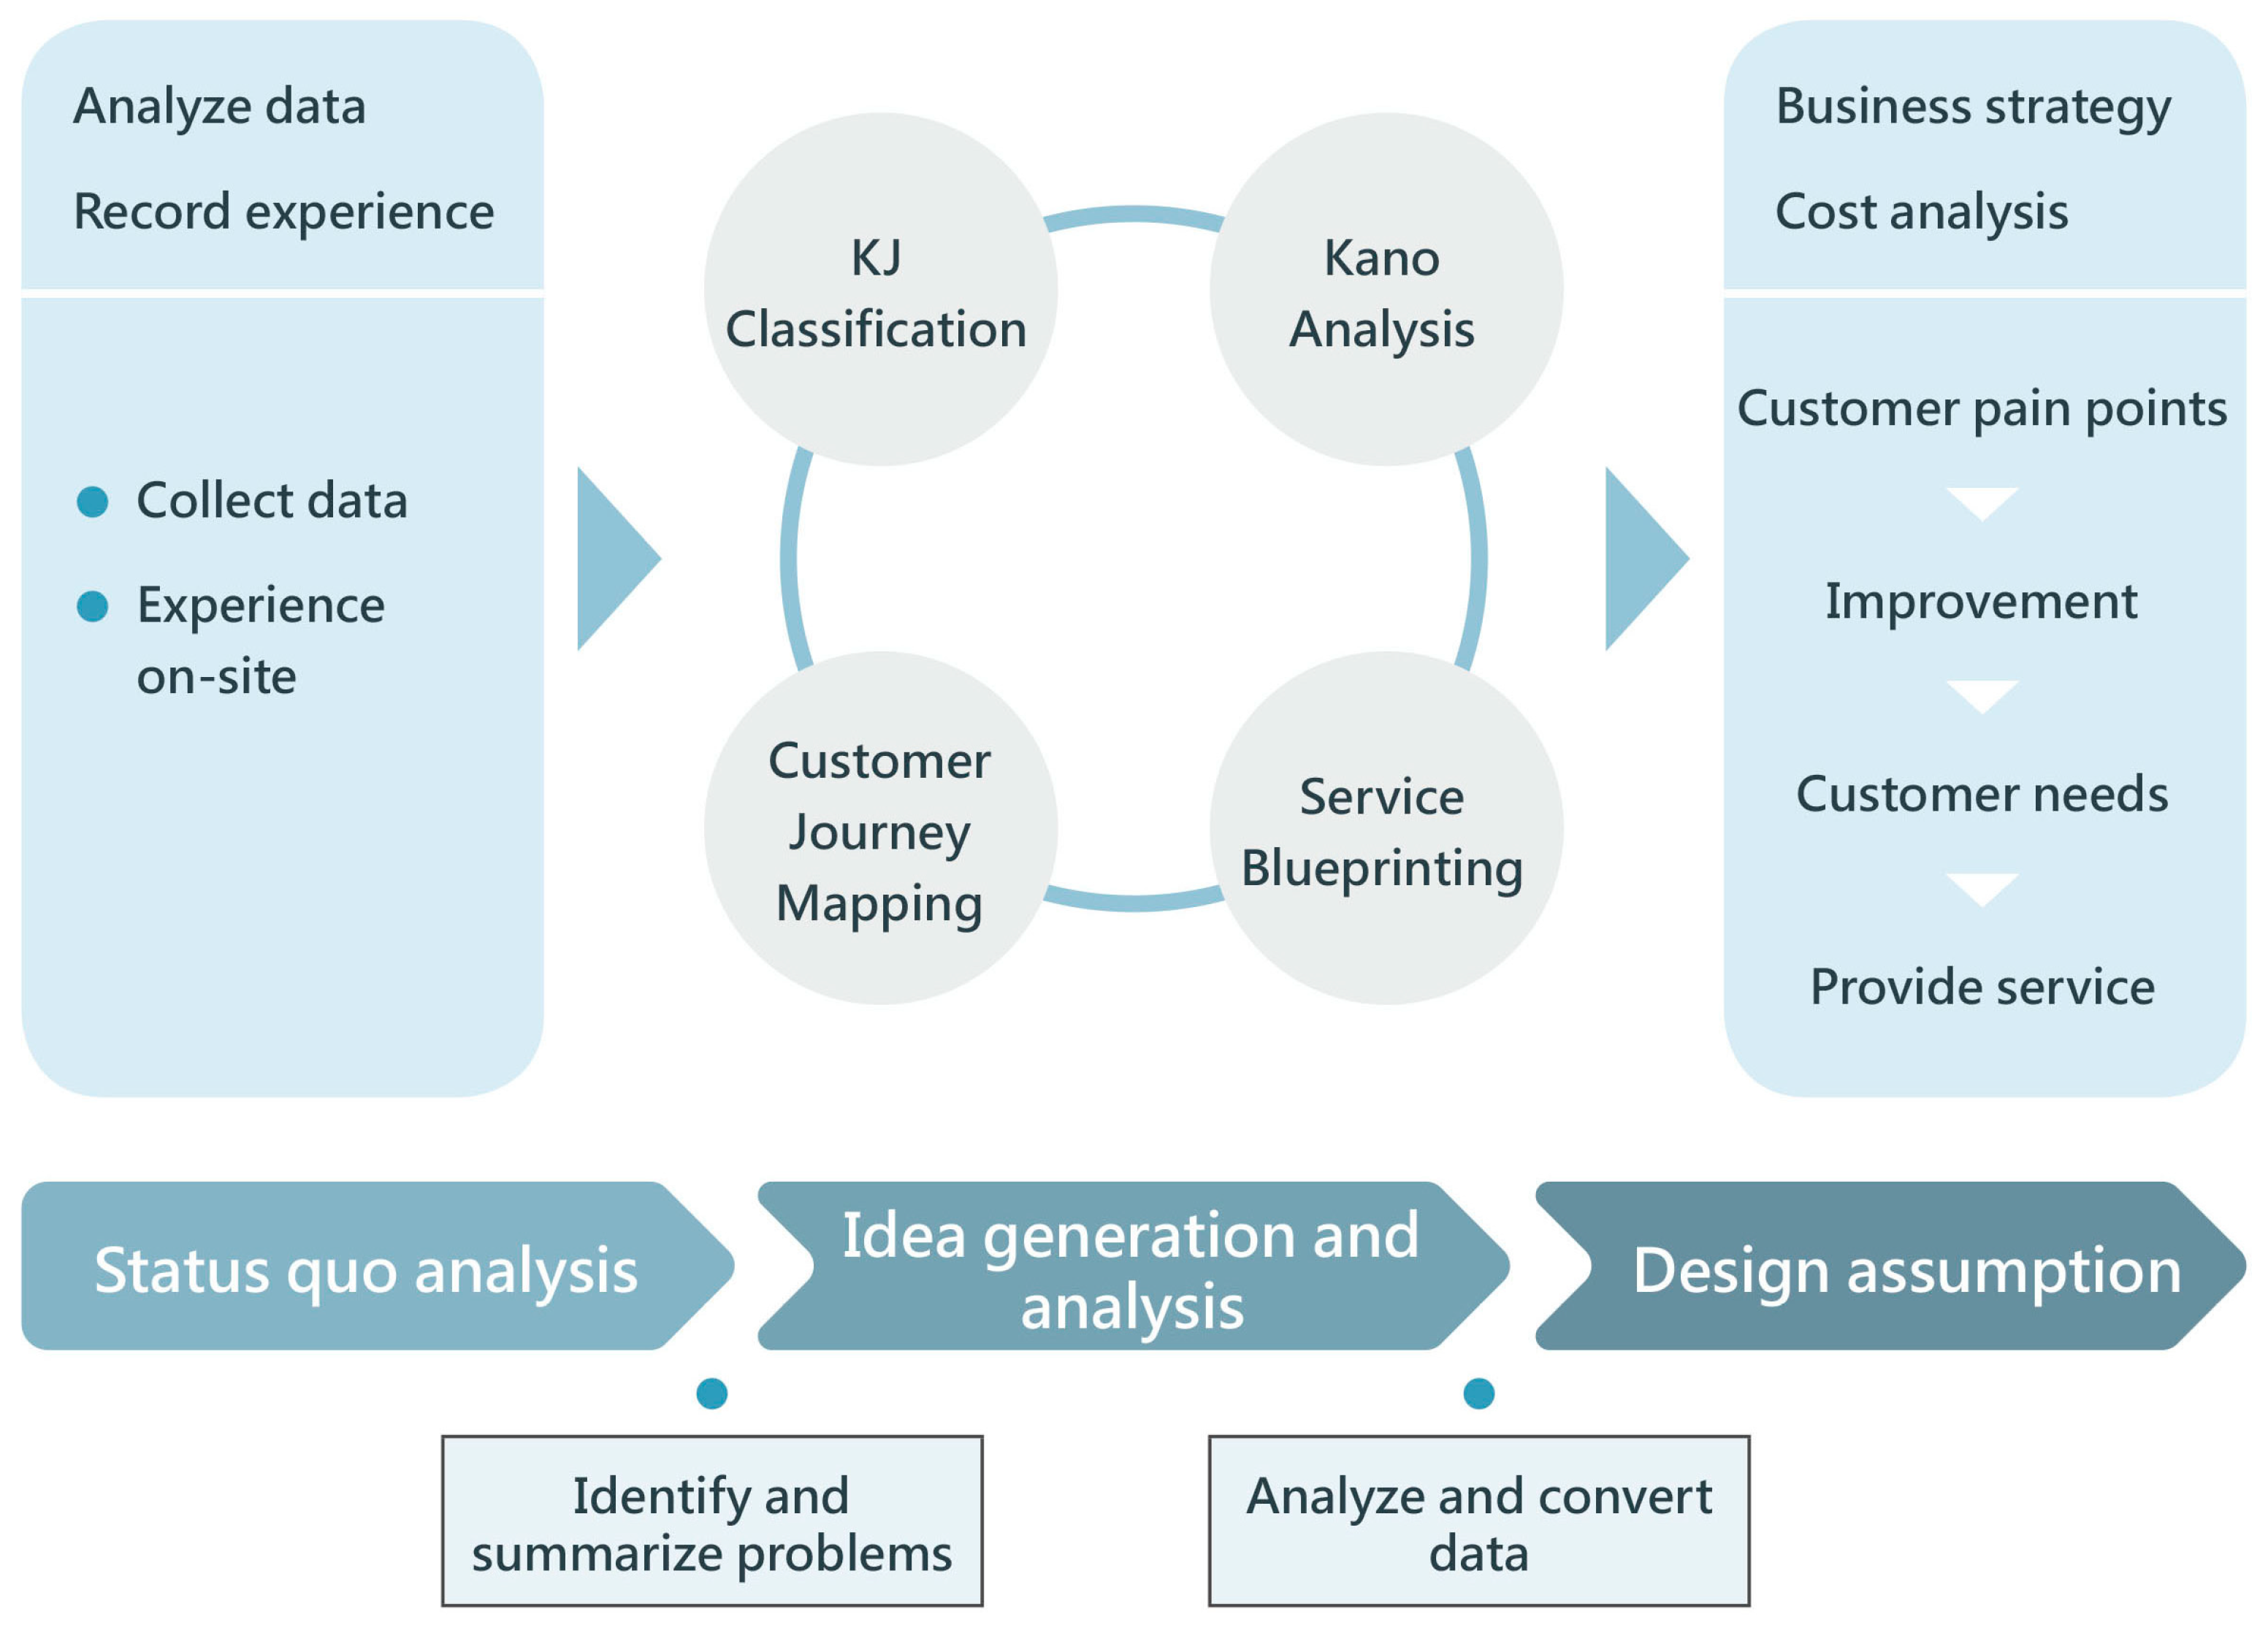
This research was conducted in three stages, as shown in Figure 1: status quo analysis, idea generation and analysis, and design assumption. A star-rated hotel in Taiwan was selected as the case hotel of this research. Based on the service design perspective, we examined the services offered by the hotel and the hardware it accommodates as the first stage. An on-site visit was then conducted on October 3 and 4 of 2020 by the researchers to experience its services and amenities, and a record regarding interior and exterior designs and service conditions was created accordingly as the second stage. The record covers the inside and outside of the hotel space, visual cues, room amenities, and service processes. A customer journey map was then drawn after the on-site visit, which was used for KJ classification and Kano analysis for preliminary results.
The research procedures carried out in this study were as follows: (1) establish the research topic and construct theory; (2) collect data and observe and record facts; (3) analyze data and identify problems; (4) present analysis results; and (5) develop hotel service strategies. According to Patton [92] and Yin [93], research samples should be selected from cases that provide a great deal of information about questions of central importance to the purpose of the research. Therefore, we selected a local star-rated hotel as the study sample, considering the service diversification of this hotel whose managers are knowledgeable about customer service concepts and are well aware of the service design thinking process.
3.2. Participants
Kano is a random sampling of respondents because most of them have the experience of staying in five-star hotels, so the questionnaire is distributed to the respondents by random sampling. Kano is sampled in the parent (market), and the type is determined according to the number of sampled people, and the method of execution is a questionnaire, which means that Kano is inclined to market research, which is different from user research that aims to explore the unknown needs behind a phenomenon. Kano is a description of the proportion of various types after sampling, so it is actually a way to turn something qualitative (a human attitude) into something quantitative.
Since the Kano quality two-way questionnaire consists of a set of “relative” questions, a face-to-face survey by trained interviewers is required to avoid a misunderstanding of the questions and to assist respondents in filling out the questionnaire effectively. Therefore, after the researcher developed the objectives, methodology, and analysis, we conducted the survey and collected data from the consumers in the hotel. Before the respondents completed the questionnaire, the interviewer asked whether they were willing to participate in this study, and if they did not agree to participate in this study, the interviewer selected the next respondent. When respondents’ responses were unclear, the interviewer immediately provided clarification.
Participants were recruited by one of the researchers from the lobby of the target hotel on the dates of the 3rd and the 4th of October 2020. The Kano questionnaire with the form of A-not-A questions was used to collect data. A total of 190 valid responses out of 203 questionnaires were retrieved with a 93.6% response rate. Thirteen incomplete responses were invalid and excluded from further analysis.
3.3. Analysis Techniques
This study adopted affinity diagrams, service design tools, and the Kano model to analyze the research data. These methods are not statistical analysis by means of a large number of questionnaires to obtain a large amount of data, but KJ analysis, customer journey map, service blueprint, and Kano model analysis. The KJ method is a way to find new ways to solve problems. Customer journey maps can integrate customer thinking and actions and organize the information needed according to their changes. The service blueprint is mainly based on the core services and ancillary services, arranged in chronological order, to develop the interaction between customers and employees.
Kano model analysis is often used for quality control. This study is mainly meant to explore the output of service quality and the service optimization sequence, similar to the triangulation method, to compare the findings of the same issue and summarize in-depth views, aiming to break away from the statistical bias of pure quantitative research and understand the potential demand of consumers for hotel service quality and items, which can provide operators with a clearer outline for future near, medium, and long-term planning. We hope to provide operators with a clearer outline for future planning in the near, medium, and long term, in order to define and focus on the positioning of hotel services and to spend reasonable investment costs.
3.3.1. Affinity Diagrams
The affinity diagram, also known as the KJ method, is a scientific inquiry method to group unknown problems according to their affinity, leading to the discovery of “creative skills” [94], and drawing conclusions about the problem. It is a tool used to organize massive amounts of consolidated information, such as facts, events, literature, individual opinions, issues, user opinions, user needs, and user insights [95]. The technique requires frequent brainstorming to categorize and summarize all types of information to define the nature of a problem during design thinking [96,97]. In this study, we gathered large amounts of data (facts, opinions, and thoughts) from observations, grouped the survey results of this study according to their similarity and relationship, and organized complex data into a summary of research ideas from which paths to solutions can be identified to propose definitive guidelines and interpretations.
3.3.2. Service Design Tools
Service design tools were employed in this study to explore how a hotel environment is perceived and the service processes it offers. This study focused on using the “Customer Journey Map” and “Service Blueprint” to document the behaviors, emotions, and feelings that the participants have when experiencing a service process. We recorded pain points to gain first-hand insight into what it feels like to be actually engaged in a process using a service design tool [98]. These tools were also used to conduct an inventory of the touchpoints in the study site. The touchpoints were then individually analyzed to elucidate the strategies and methods that can be used to optimize services and sustain business operations.
3.3.3. Kano Model Analysis
The Kano questionnaire consists of two types of questions to classify quality attributes: one type inquires how a consumer responds when a quality attribute is present, and the other how a consumer responds when a quality attribute is not present. The respondent answers each question by choosing one of the five r options, like it, expect it, do not matter, can live with it, or dislike it, as shown in Table 2 [99].
Table 2 also shows Kano’s evaluation table, which pairs each answer (feelings about the presence or absence of quality) with each quality attribute [100]. The letters A, O, M, I, and R represent the qualities of “attractive”, “one-dimensional”, “must-be”, “indifferent”, and “reverse”. The letter Q represents a questionable result. Although it is rare, this may occur when a consumer misunderstands an inquiry or circles a wrong answer. Hence, the Q-rate can be used to validate the questionnaire, where a Q-rate smaller than or equal to 2% is deemed acceptable [100,101].
The Kano evaluation results are based on the majority of responses. Other researchers observed that consumers’ responses tended to spread out, with most of them being “indifferent” if in-depth or detailed questions are asked. In this case, the percentage at the time of classification should be examined in detail, and the following method can be used to make modifications [102]: if (A + O + M) > (I + R + Q), then the grade is the maximum in (A, O, M), or else the grade is the maximum in (I, R, Q). Because the results of the Kano evaluation reflect the type of evaluation and not the relationship between quality and satisfaction, the customer satisfaction coefficient can be used to illuminate the influences of the fulfillment or non-fulfillment of quality on the satisfaction/dissatisfaction of consumers. The customer satisfaction coefficient comprises the extent of satisfaction and the extent of dissatisfaction.
Extent of satisfaction, Better (SI): CS = (A + O)/(A + O + M + I)
Extent of dissatisfaction, Worse (DSI): DS = (M + O)/(A + O + M + I) × (−1)
In general, values of SI fall between 0 and 1, and DSI is between 0 and −1. The larger the absolute values of SI and DSI, the greater their influence on a service. With (0, 0) as the center and (0.5, −0.5) as the furthest distance, a ¼ circle is drawn to show an area of insensitivity, where no instant action is required. On the other hand, the points that fall further away from the origin are those that need to be prioritized. For those points that are equally apart, the DSI points shall receive better priority to not dissatisfy the consumers. As a result, the priorities of points to be improved are must-be (M) > one-dimensional (O) > attractive (A) > indifferent (I) attributes [103]. The Kano model classifies customer experiences but does not reflect the true quality of service. The results reveal types of customer experiences and the classified services in the order of priority.
3.4. Research Instruments
A Kano questionnaire was used as the research instrument to collect information. The self-administered questionnaire comprised the items of the servicescape of a hotel [104] and respondents’ socioeconomic demographic information. The items of the hotel servicescape were drawn based on online reviews and the analysis of Internet users and the results of the KJ Method. Two professional designers and three researchers who specialize in hotel management were invited to validate the items. In total, 39 items of 5 categories of the in-room facility, public space in the room floor area, hotel lobby facility, services, and restaurant were then finalized by consensus, as shown in Table 3.
The most commonly used and interpreted classification of Kano quality attributes is defined by the results of the Kano quality “two-way questionnaire”. The implementation of this quality classification method consists of a set of “relative” questions: what is the consumer’s reaction when the quality attribute is present? The other is what is the consumer’s reaction when the quality attribute is not available? The response options were chosen by the respondent from among the five different response options. The model is effective in evaluating existing products or developing new products to meet consumer needs and expectations. Through these quality determinations, the relationship between quality performance and satisfaction can be clarified, and important quality items that are effective in improving consumer satisfaction can be identified. These quality attributes are the main factors that companies use to differentiate themselves from the market and create a competitive advantage.
4. Data Analysis
4.1. Customer Journey Map
The customer journey map, as shown in Figure 2, records the customer’s interactions with touchpoints before, during, and after using the service process. A detailed analysis is then followed to gain insight into the customer’s perception of the hotel services. A visual presentation of the emotional responses of users in the chronological order in which the service was delivered is given. This visualization technique illuminates the feelings users have about each service offered and what they prefer under any circumstance or across any touchpoint. On the bottom of the customer journey map is a graph showing the emotional journey, which expresses five different emotions: love, like, indifference, dislike, and hate.
As the customer journey map indicates, 9 of the 32 touchpoints were disliked with negative emotions, such as a surveillance camera being visible on the counter, dim lighting in the lobby, a keycard being difficult to use, complex beverage machines, poor accessibility of restaurants, very limited choices of TV channels, socket numbers, lighting control, and the air conditioning control mechanism.
Ten service touchpoints in the entire service process elicited positive emotions, including speedy internet connection, easy accessibility, Kano Park in Chiayi, a comfortable pillow, Wi-Fi password clearly indicated, free map of Chiayi tourist hotspots, HDMI cable for use, quality supply of shower in the bathroom, buffet bar, and meal cards. Wi-Fi password information in the room was most positively rated.
Thirteen service touchpoints in the entire process elicited neither positive nor negative emotions, such as the hotel website and booking page, the spatial layout and novel furniture in the lobby, in-store merchandise display, relaxing music in the elevator, a luggage rack with an old-fashioned color and patterns, supermarket merchandise display, travel catalog sorting, room number signs, placement of chairs in the corridor, personal use of public magazines, placement of towels, and speedy checkout.
4.2. KJ Method
A summary of problems based on the observations and feelings recorded when we experienced the services at the hotel was completed. The problems were then categorized to sum up the types of problems encountered and the dimensions to which they belong. Closely related groups were examined in detail and classified to show their relationships. The touchpoints in the CJP were organized into two main areas of the hotel. One is the public space with five categories of pain points: shop management, decorations, spatial planning, signs, and public facility (Figure 3). The other is the intermediary space and hotel rooms with another five categories of pain points: feelings about the environment, services, feelings about theme, room facility, and use (Figure 4).
4.3. Kano Questionnaire Results
4.3.1. General Information
The respondents were mainly white-collar workers (69.5%), students (30%), and retirees (0.5%) with ages mostly 23–33 years (62.6%), followed by 18–22 years (24.2%), 34–50 years (11.6%), and 51–60 years (1.6%). The percentages of the weight of each attribute of the hotel servicescape were computed based on affirmed responses (Table 4). For example, the attribute “space inside the room has novel designs” was graded in the “attractive”, “one-dimensional”, “must-be”, “indifferent”, “reverse”, and “questionable” categories with 57.9%, 10.5%, 3.2%, 26.3%, 0.5%, and 1.6% of the respondents, respectively. Specifically, the “attractive” category received substantially more responses (57.9%) than other categories, which suggests that this quality attribute is “attractive”. Most of the “Q”-rated responses were 1.1% and 1.6%, which validates the instrument with an amount less than or equal to 2%. This confirmed that the results from the Kano questionnaire were acceptable.
4.3.2. Interpretation
The Kano questionnaire results on hotel servicescape attributes can be interpreted as follows:
- The “must-be” (M). One attribute, “in-room lighting can be controlled”, is in this category. Improving this quality attribute does not lead to higher satisfaction, but the lack thereof will substantially increase the dissatisfaction of consumers.
- The “one-dimensional” (O). Ten attributes are in this category, including sufficient plug/USB sockets, hooks in the bathroom, a desk lamp in the room, separate shower and bathtub, sofas in the lobby, staff smiles, answers questions immediately, and others, as shown in Table 3. Satisfaction increases or decreases linearly with the fulfillment or nonfulfillment of these quality requirements.
- The “attractive” (A). Sixteen attributes are in this category, including mobile device connected to the TV, in-room air purifier, in-room themed decorations, and ice machine near guest room among others, as shown in Table 3. The fulfillment of these quality attributes significantly enhances customer satisfaction, whereas no significant effect on the dissatisfaction of consumers occurs when absent.
- The “indifferent” (I). Eleven attributes are in this category, including a magazine rack in the room, corridor decorations, a touchscreen for travel information, travel guidebooks, local cultural elements, shops, and souvenir shops in the lobby, among others, as shown in Table 3. No significant impacts on customer satisfaction occur whether these attributes are present or not.
- The “reverse” (R). The public resting area on the ground floor is the only attribute in this category. This will significantly increase/decrease customer dissatisfaction/satisfaction with/without this attribute.
4.4. Modified Kano Quality Attributes
4.4.1. Modified Kano Quality Attribute and Customer Satisfaction
By calculating the SI and DSI for each quality attribute, as shown in Table 4, 11 attributes are found to fall under the “indifferent” category, roughly a third of all items. To solve this problem of uncertainty that may be caused by lengthy questions, the results should be modified [102,105]. For the cases that (A + O + M) > (I + R + Q), the grade should be modified as the maximum in (A, O, M), and (I, R, Q) should be maximized otherwise. As a result, five of the “indifferent” attributes were modified as “attractive/indifferent”: corridor decorations, travel guidebooks, space with local cultural elements, chairs in the elevator lobby, and chef specials in restaurants, as shown in Table 5 (SI: the extent of satisfaction; DSI: the extent of dissatisfaction).
Meanwhile, the extent of satisfaction (CS) and dissatisfaction (DS) for the five attributes can be calculated by using Equations (1) and (2), respectively. The CS values were all greater than the DS values, indicating that the effect of the presence of these five attributes on satisfaction was stronger than the effect of the absence of these attributes on dissatisfaction. In other words, these quality requirements can effectively improve consumer satisfaction with a presence, which deserves to be included in the “attractive/indifferent” category.
4.4.2. Segmenting the Quality Attributes
The “customer satisfaction coefficient” represents the “relative cost” of not meeting a quality requirement. Here, the price and benefit apply to consumer satisfaction [100]. The extent of satisfaction (CS) ranges between 0 and 1, where consumer satisfaction is increased significantly as CS approaches 1. The extent of dissatisfaction (DS) ranges between −1 and 0, where consumer dissatisfaction increases as DS approaches −1. The customer satisfaction coefficient can be viewed as a measure of an increase or decrease in satisfaction and dissatisfaction after a quality requirement is fulfilled.
For easier communication, parameters of SI (x-axis) and DSI (y-axis) were plotted in a visual map (Figure 5), with the mean of 0.5 as the cut-off point for indicating the extent of an increase or decrease in satisfaction and dissatisfaction. The 39 service attributes were then properly distributed to the map for efficient interpretation and decision making. Four areas of the map indicate the directions of improvement.
“Must-be” (M) attributes in the Maintenance Area. These attributes did not significantly increase customer satisfaction but lowered customer dissatisfaction. Hotel management should strive to retain them to avoid dissatisfaction.
“One-dimensional” (O) attributes in the High-Priority Area. These attributes significantly improve customer satisfaction and decrease dissatisfaction. Satisfaction/dissatisfaction increases/decreases in proportion to the presence/absence of these attributes, thus requiring the first priority of improvement investment.
“Attractive” (A) attributes in the Differentiation Area. The attributes in this area can greatly increase customer satisfaction and have almost no effect on decreasing customer dissatisfaction. The fulfillment of these quality requirements can significantly enhance satisfaction. These attributes can be used to differentiate from other competitors.
“Indifferent” (I) attributes in the Low-Priority Area. These are the attributes that do not affect both satisfaction and dissatisfaction. Except for those “attractive/indifferent” attributes, improvement is only needed when surplus resources are available.
The survey results and categorization from the Kano analysis are simply meant to provide a clear index on how important the customer’s perception is for each quality attribute and accordingly suggest possible directions of improvement. To what extent the service had been delivered remains unclear with this segmenting. Additional surveys such as the system usability scale (SUS), net promoter score (NPS), and other investigations on customers’ experience will be required.
The Kano model survey is more of a market survey than a user behavior study. Surveys on consumer behavior can be ignored when performing improvement on the services of “must-be” and “indifferent”, but it will be necessary for those services with “one-dimensional” and “attractive” attributes. Worthy of note is the limitation of the level of representation of the respondents in this research, which may not provide sufficient generalizability.
5. Discussion
The current research took a star-rated hotel as a sample to test how service design can be helpful for a service business, such as a hotel. The CJM identified 32 touchpoints, which were rated by the respondents as loves, likes, is indifferent, dislikes, or hates, respectively. Ten of them generated happy emotions, nine services received a dislike rating, and the remaining thirteen services were perceived as indifferent.
By using the customer journey map and the KJ method, three major areas of touchpoints that bring unpleasant experiences to the customers were found to be public space, intermediary space, and hotel rooms. A questionnaire based on the Kano model was used to explore the relationships between the hotel’s quality attributes and the customer’s value perception of each service. There were 38 hotel servicescape attributes, and they were segmented into 4 categories of maintenance, high-priority, differentiation, and low-priority. Attributes in the maintenance segment, such as “in-room lighting control”, can be used as a defensive strategy for keeping customers satisfied. Attributes in the high-priority area, such as a comfortable room environment that is equipped with appropriate functions and well-trained hotel staff, should receive substantial resources to assure customer satisfaction. The results of this study are similar to those of J. J. Kim, Lee, and Han’s study exploring guests’ competitive hotel choice attributes [106]. Attributes in the differentiation segment, such as novel design of the room and another appeal for sensory experiences, can be used as a tool to differentiate from competitors. The results of this study are similar to findings on the impact of hotel brand experience on brand loyalty and on customer experience-driven business model innovation [107,108]. Attributes in the low-priority segment, such as in-house souvenir shops, may be improved when a resource surplus is present. The results of this study are similar to those on the effect of COVID-19 on the tourist satisfaction of B & B in Zhejiang, China [109]. Hotel owners can evaluate their resources and manpower deployment before making appropriate sequential arrangements. However, some of the charming/undifferentiated attributes of this section, such as the decoration of the corridor, can barely be considered as one of the attractive attributes suggested by the modified Kano approach. If this can be used to create a distinctive character, it will meet the needs of a specific customer segment.
This study adopts a qualitative and quantitative approach by using service design tools to analyze the data, providing data available in the real world and providing innovative insights for future research. A hybrid approach is used to validate the same questions, similar to triangulation, to ensure reliable and realistic results. Kano model analysis is used to generalize the different service types, which can be used as a reference for the industry and to control cost effectively. Since most of the operators are not clear about their positioning, if they only look at the analysis of their competitors, such as other operators investing in a certain project, then a blind following of the trend of investment will happen. However, becoming the ideal hotel for the public requires more than just investing resources, so the focus or direction of future development projects should be studied, defined, and confirmed before investing resources. This will help provide an effective investment strategy and direction, while avoiding a waste of resources and misdirection.
6. Conclusions and Suggestion
Items in the “Maintenance Area” can be used as a defensive strategy to maintain customer satisfaction and must be properly arranged to meet the needs of users; items in the “Priority Area” and categorized as “Unitary Quality” are prioritized to provide a room environment with appropriate functionality and comfort and well-trained staff service quality to achieve consumer satisfaction. The projects in the “differentiation area” are categorized as “charm quality”, which can be used as a tool to create “differentiation” so that consumers can experience through their senses in various spaces, and the feeling of quality can be strengthened. The projects in the “low priority area” can be implemented when the financial and technical aspects of the operation are available, and the hotel owners can evaluate their resources and manpower deployment before making appropriate sequencing arrangements. Different quality attributes have different degrees of influence on consumer satisfaction. In the face of a competitive situation and limited resources, the more important attributes should be implemented earlier to enhance consumer satisfaction. The specific results of this study can effectively provide a ranking of the importance of tradeoffs and serve as a reference for the positioning and development of future space, routes, and service flow planning and for providing a clearer path.
Emphasis has been placed on customer-centered service design tools and Kano questionnaire analysis to organize the four major service landscape attributes. In the future, when operators need to redefine the service customer group or service content, they can use these results:
- Effectively define the demand points of service customer groups and specifically define the needs of the customer groups.
- Designing hotel services according to the service customer group to create an effective cost of delivery at the demand point.
- To understand the high and low priority needs of the service customer group to facilitate the hotel to setting up a phased improvement policy.
- More clearly for the operators to operate the market, to propose a total of future service strategies and customer service types, to assess the suitability of the future investment in service content, to avoid an ineffective and wasteful injection of resources and investment, and to achieve the concept of lean costs.
Quality attributes in different categories impose different influences on consumer satisfaction or dissatisfaction. It is wise to allocate resources to those categories that will increase consumer satisfaction. The results of this study can effectively facilitate ranking by weight and importance. The findings of this research can also serve as a definitive guide and reference for spatial development, circulation positioning, and service workflow planning. The research findings have indicated that there is still room for improvement in the areas of hardware facilities or software service processes. The focus should be placed on the results of our Kano analysis with regard to attractive and one-dimensional quality requirements. Specifically, interior designs, decorations, and environmental odors in the hotel space can be adjusted to heighten the sensory experiences (e.g., sight, taste, and touch), thereby increasing the guests’ value perception. Classification using the Kano model adapts to changes over time, including changes in consumer behavior, technology advancements, or tourism culture, where consumers will start taking for granted some of the service attributes that they initially considered a delight.
Services in the attractive category may evolve into a one-dimensional or must-be category over time as competitors may add similar services. We recommend including continuous monitoring of the changes in consumer needs and adding more metropolitan areas to the research scope. In-depth analysis can also be performed on specific aspects of the service process, such as the increase in the number of guests, an increase in the number of returning guests, an increase in the number of guests from a specific population, and improving check-in procedures. Thus, consistent information and experiences can be created across all touchpoints to identify the problems in every service and process and to improve them accordingly. Apart from using the same service design tools as used in this study, future researchers can also incorporate user-based service design methods (e.g., stakeholders and personal or scenario-based design) to perform a more extensive analysis of guest needs, focusing on specific areas of the hotel (e.g., lobby, hotel room, restaurant, or public facilities). In doing so, more multidimensional research results can be generated.
A concept of the service blueprint of the hotel’s entire service process can be accordingly created with the Kano method to provide a clear picture of the connections of touchpoints and facilities required. Multiple purposes could then be expected by using such a Kano-based blueprint, including identifying the support required for all of the services offered, speedily detecting the required improvements, facilitating the sense and knowledge of teamwork for employees, and enacting vertical and horizontal communications within the organization, among others.
Author Contributions
All authors contributed to the paper. Conceptualization, T.-Y.C. and Y.-C.C.; writing—original draft preparation, Y.-C.C.; writing—review and editing, T.-Y.C.; visualization, T.-Y.C. All authors have read and agreed to the published version of the manuscript.
Funding
This research received no external funding.
Institutional Review Board Statement
Not applicable.
Informed Consent Statement
Informed consent was obtained from all subjects involved in the study.
Data Availability Statement
Not applicable.
Conflicts of Interest
The authors declare no conflict of interest.
References
- Schmitt, B. Experiential marketing. J. Mark. Manag. 1999, 15, 53–67. [Google Scholar] [CrossRef]
- Schmitt, B.; Zarantonello, L. Consumer experience and experiential marketing: A critical review. Rev. Mark. Res. 2013, 10, 25–61. [Google Scholar]
- Walls, A.R.; Okumus, F.; Wang, Y.R.; Kwun, D.J.-W. An epistemological view of consumer experiences. Int. J. Hosp. Manag. 2011, 30, 10–21. [Google Scholar] [CrossRef]
- Yao, T.H. Development and Planning for Hotel Industry; Yang-Chih Reading Culture: Taipei City, Taiwan, 1997. [Google Scholar]
- Talgorn, E.; Hendriks, M.; Geurts, L.; Bakker, C. A Storytelling Methodology to Facilitate User-Centered Co-Ideation between Scientists and Designers. Sustainability 2022, 14, 4132. [Google Scholar] [CrossRef]
- Huiskonen, J.; Pirttilä, T. Sharpening logistics customer service strategy planning by applying Kano’s quality element classification. Int. J. Prod. Econ. 1998, 56, 253–260. [Google Scholar] [CrossRef]
- Basfirinci, C.; Mitra, A. A cross cultural investigation of airlines service quality through integration of Servqual and the Kano model. J. Air Transp. Manag. 2015, 42, 239–248. [Google Scholar] [CrossRef]
- Kano, N. Attractive quality and must-be quality. Hinshitsu (Qual. J. Jpn. Soc. Qual. Control) 1984, 14, 39–48. [Google Scholar]
- Kvist, A.K.J.; Klefsjö, B. Which service quality dimensions are important in inbound tourism? Manag. Serv. Qual. Int. J. 2006, 16, 520–537. [Google Scholar] [CrossRef]
- Herzberg, F.; Mausner, B.; Snyderman, B.B. The Motivation to Work; John Wiley & Sons: NewYork, NY, USA, 1959; Volume 195. [Google Scholar]
- Park, S.; Lee, J.-S.; Nicolau, J.L. Understanding the dynamics of the quality of airline service attributes: Satisfiers and dissatisfiers. Tour. Manag. 2020, 81, 104163. [Google Scholar] [CrossRef]
- Pine, B.J.; Gilmore, J.H. The experience economy. Harv. Bus. Rev. 1998, 76, 18–23. [Google Scholar]
- Pine, B.J.; Gilmore, J.H. The experience economy: Past, present and future. In Handbook on the Experience Economy; Edward Elgar Publishing: Cheltenham, UK, 2013. [Google Scholar]
- Tom Dieck, M.C.; Jung, T.H.; Rauschnabel, P.A. Determining visitor engagement through augmented reality at science festivals: An experience economy perspective. Comput. Hum. Behav. 2018, 82, 44–53. [Google Scholar] [CrossRef]
- Liu, W.K. Stylizing Experiences. Bus. Next 2005, 99, 83. [Google Scholar]
- Roggeveen, A.L.; Grewal, D.; Schweiger, E.B. The DAST framework for retail atmospherics: The impact of in-and out-of-store retail journey touchpoints on the customer experience. J. Retail. 2020, 96, 128–137. [Google Scholar] [CrossRef]
- Pine, B.J., II; Gilmore, J.H. A leader’s guide to innovation in the experience economy. Strategy Leadersh. 2014, 42, 24–29. [Google Scholar]
- Eckhardt, G.M.; Houston, M.B.; Jiang, B.; Lamberton, C.; Rindfleisch, A.; Zervas, G. Marketing in the sharing economy. J. Mark. 2019, 83, 5–27. [Google Scholar] [CrossRef]
- Shah, A.K.; Alter, A.L. Consuming experiential categories. J. Consum. Res. 2014, 41, 965–977. [Google Scholar] [CrossRef]
- Scicluna, C. The Meal Experience in Casual Dining Restaurants. Master’s Thesis, University of Applied Sciences, Wels, Austria, 2020. [Google Scholar]
- Liu, C.R.; Huang, W.S.; Chien, P.P.; Pai, R.L. A Research of Customer’s Memory, Restaurant Attachment and Restaurant Loyalty from the Perspective of Experience Economy for Rural Restaurants. J. Tour. Leis. Stud. 2019, 25, 103–131. [Google Scholar]
- Hwang, J.; Lee, J. A strategy for enhancing senior tourists’ well-being perception: Focusing on the experience economy. J. Travel Tour. Mark. 2019, 36, 314–329. [Google Scholar] [CrossRef]
- Kou, G.; Ren, J.H. Study on the Path of Enhancing Library Maker Space Services. J. Libr. Inf. Sci. Res. 2018, 19, 71–78. [Google Scholar]
- Kao, Y.F.; Liu, H.C.; Tang, P.L. The Influence of Experiential Elements on Brand Loyalty from the Theory of Theater. Theater 2018, 26, 453–478. [Google Scholar]
- Lee, S.; Jeong, E.; Qu, K. Exploring theme park visitors’ experience on satisfaction and revisit intention: A utilization of experience economy model. J. Qual. Assur. Hosp. Tour. 2020, 21, 474–497. [Google Scholar] [CrossRef]
- He, P. Research on the In-Depth Development of Tourism Products in Tourist Attractions. Tour. Overv. 2016, 2, 54. [Google Scholar]
- Song, T.J. Preface: Nature of Service Design and Process Tools. J. Des. 2014, 19, 1–8. [Google Scholar]
- Chen, Y.-A.; Chen, C.L. Case study of sustainable service design in the hospitality industry. Chin. Manag. Stud. 2022, 16, 162–196. [Google Scholar] [CrossRef]
- Ostrom, A.L.; Bitner, M.J.; Brown, S.W.; Burkhard, K.A.; Goul, M.; Smith-Daniels, V.; Demirkan, H.; Rabinovich, E. Moving forward and making a difference: Research priorities for the science of service. J. Serv. Res. 2010, 13, 4–36. [Google Scholar] [CrossRef]
- Salgado, M.; De Castro Martinez, M.V.; Marcos Martinez, E.; López-Sanz, M.; Martin-Pena, M.L. Driving organisational change in SMEs using service design. J. Serv. Theory Pract. 2022, 32, 701–736. [Google Scholar] [CrossRef]
- Tan, A.R.; Matzen, D.; McAloone, T.C.; Evans, S. Strategies for designing and developing services for manufacturing firms. CIRP J. Manuf. Sci. Technol. 2010, 3, 90–97. [Google Scholar] [CrossRef]
- Mager, B.; Sung, T.-J.D. Special issue editorial: Designing for services. Int. J. Des. 2011, 5, 53–60. [Google Scholar]
- Ho, S.S.; Sung, T.J. The Development of Academic Research in Service Design: A Meta-Analysis. J. Des. 2014, 19, 45–66. [Google Scholar]
- Buhalis, D.; Harwood, T.; Bogicevic, V.; Viglia, G.; Beldona, S.; Hofacker, C. Technological disruptions in services: Lessons from tourism and hospitality. J. Serv. Manag. 2019, 30, 484–506. [Google Scholar] [CrossRef]
- Schneider, J.; Stickdorn, M. This Is Service Design Thinking: Basics, Tools, Cases; Wiley: Hoboken, NJ, USA, 2011. [Google Scholar]
- Chydenius, T. Culture in Service Design: How Service Designers, Professional Literature and Service Users View the Role of National, Regional and Ethnic Cultures in Services. In JYU Dissertations; University of Jyväskylä: Jyväskylä, Finland, 2020. [Google Scholar]
- Huang, K.H. Service Science: Service System and Value Co-Creation; Vital Wellspring Group: New Taipei City, Taiwan, 2015. [Google Scholar]
- Pantazis, V.; Otrok, M. The Role of Service Design in Startups: Exploring Potential Benefits and Challenges from Service Designers’ Perspectives. Master’s Thesis, University of Gothenburg, Gothenburg, Sweden, 2020. [Google Scholar]
- Wu, Y.C. New Business Advantages: Win with Customer Journey. Common Wealth Mag. 2016. [Google Scholar]
- Hsiao, H.L. Service Design: From Insight to Experience; Institute for Information Industry: Tapei City, Taiwan, 2012. [Google Scholar]
- Stickdorn, M.; Schneider, J.; Andrews, K.; Lawrence, A. This Is Service Design Thinking: Basics, Tools, Cases; Wiley: Hoboken, NJ, USA, 2011; Volume 1. [Google Scholar]
- Clatworthy, S.D. The Experience-Centric Organization: How to Win through Customer Experience; O’Reilly Media: Sebastopol, CA, USA, 2019. [Google Scholar]
- Maechler, N.; Neher, K.; Park, R. From Touchpoints to Journeys: Seeing the World as Customers Do; McKinsey & Company: Chicago, IL, USA, 2016; pp. 1–10. [Google Scholar]
- Zeithaml, V.A.; Bitner, M.J.; Gremler, D.D. Services Marketing: Integrating Customer Focus Across the Firm; McGraw-Hill Education: NewYork, NY, USA, 2018. [Google Scholar]
- Bitner, M.J.; Ostrom, A.L.; Morgan, F.N. Service blueprinting: A practical technique for service innovation. Calif. Manag. Rev. 2008, 50, 66–94. [Google Scholar] [CrossRef]
- Fließ, S.; Kleinaltenkamp, M. Blueprinting the service company: Managing service processes efficiently. J. Bus. Res. 2004, 57, 392–404. [Google Scholar] [CrossRef]
- Shostack, G.L. Service design in the operating environment. In Developing New Services; Business Expert Press: New York, NY, USA, 1984; pp. 27–43. [Google Scholar]
- Yu, E.; Sangiorgi, D. Service design as an approach to implement the value cocreation perspective in new service development. J. Serv. Res. 2018, 21, 40–58. [Google Scholar] [CrossRef]
- Fayard, A.-L.; Stigliani, I.; Bechky, B.A. How nascent occupations construct a mandate: The case of service designers’ ethos. Adm. Sci. Q. 2017, 62, 270–303. [Google Scholar] [CrossRef]
- Jegorova, A.; Sindonen, I. Defining Customer Experience in Four Star Hotels in Finland and in Russia. Master’s Thesis, Laurea University of Applied Sciences, Helsinki, Finland, 2013. [Google Scholar]
- Antwi, E. Service Design Implementation: Case: Kotoka International Airport-Ghana; Vaasa University of Applied Sciences: Vaasa, Finland, 2015; p. 88. [Google Scholar]
- Hummel, E.; Murphy, K.S. Using service blueprinting to analyze restaurant service efficiency. Cornell Hosp. Q. 2011, 52, 265–272. [Google Scholar] [CrossRef]
- Stickdorn, M.; Hormess, M.E.; Lawrence, A.; Schneider, J. This Is Service Design Doing: Applying Service Design Thinking in the Real World; O’Reilly Media, Inc.: Sebastopol, CA, USA, 2018. [Google Scholar]
- Stickdorn, M. Service design: Co-creating meaningful experiences with customers. In The Routledge Handbook of Tourism Marketing; Routledge: London, UK, 2014; pp. 329–344. [Google Scholar]
- Wang, C.C. Service Design: Stimulting the Soft Power of Small and Medium-Sized Enterprises. Taipei Econ. Q. 2012, 10, 23–30. [Google Scholar]
- Chibili, M. Designing Hospitality Processes. In Modern Hotel Operations Management; Routledge: London, UK, 2019; pp. 460–489. [Google Scholar]
- Vasantha, G.V.A.; Roy, R.; Lelah, A.; Brissaud, D. A review of product–Service systems design methodologies. J. Eng. Des. 2012, 23, 635–659. [Google Scholar] [CrossRef]
- Lee, C.-H.; Chen, C.-H.; Trappey, A.J. A structural service innovation approach for designing smart product service systems: Case study of smart beauty service. Adv. Eng. Inform. 2019, 40, 154–167. [Google Scholar] [CrossRef]
- Garvin, D. Competing on the eight dimensions of quality. Harv. Bus. Rev. 1987, 51, 101–109. [Google Scholar]
- Sert, A.N. Niche marketing and tourism. J. Bus. Manag. Econ. Res. 2017, 1, 14–25. [Google Scholar] [CrossRef]
- Anderson, E.W.; Sullivan, M.W. The antecedents and consequences of customer satisfaction for firms. Mark. Sci. 1993, 12, 125–143. [Google Scholar] [CrossRef]
- Kano, N. Attractive quality and must-be quality. J. Jpn. Soc. Qual. Control. 1984, 31, 147–156. [Google Scholar]
- Matzler, K.; Hinterhuber, H.H.; Bailom, F.; Sauerwein, E. How to delight your customers. J. Prod. Brand Manag. 1996, 5, 6–18. [Google Scholar] [CrossRef]
- Pheng, L.S.; Rui, Z. Service Quality for Facilities Management in Hospitals; Springer: Berlin/Heidelberg, Germany, 2016. [Google Scholar]
- Chen, C.C. Kano Analysis Essay. Available online: https://nor-chen.medium.com/ (accessed on 28 January 2023).
- Chen, Y.-H.; Su, C.-T. A Kano-CKM model for customer knowledge discovery. Total Qual. Manag. Bus. Excell. 2006, 17, 589–608. [Google Scholar] [CrossRef]
- Sharif Ullah, A.; Tamaki, J.i. Analysis of Kano-model-based customer needs for product development. Syst. Eng. 2011, 14, 154–172. [Google Scholar] [CrossRef]
- Akhavan, P.; Khosravi, S. Using Kano model to evaluate the quality of mobile banking services. J. Retail. Consum. Serv. 2021, 60, 102461. [Google Scholar]
- Chen, Y.C.; Huang, H.Y. Using the Kano model to analyze the key factors of community-based medical care services in Taiwan. Int. J. Environ. Res. Public Health 2020, 17, 2922. [Google Scholar]
- Chien, S.H.; Chiu, H.C. Using Kano model and IPA to evaluate the dining satisfaction of food service in Taiwanese hospitals. Int. J. Environ. Res. Public Health 2021, 18, 3411. [Google Scholar] [CrossRef]
- Dehghanpour, M.; Razavi, S.M.; Rafiee, H. Application of Kano model for determining critical features of heavy-duty vehicles in Iran. Int. J. Ind. Ergon. 2019, 74, 102908. [Google Scholar]
- Gholami, F.; Olyaei, M.H. An investigation of factors affecting users’ satisfaction with electronic library services using the Kano model. Libr. Hi Tech 2020, 38, 283–302. [Google Scholar]
- Ghorbanzadeh, V.; Asghari, A.; Madani, R. Prioritizing the factors influencing the use of e-learning by Kano model and AHP. Educ. Inf. Technol. 2021, 26, 2513–2530. [Google Scholar]
- Guo, Y.; Zhang, Y.; Chen, X.; Song, B. Application of the Kano model in customer satisfaction analysis of residential environment. Sustainability 2021, 13, 2656. [Google Scholar] [CrossRef]
- Han, Y.; Li, J.; Li, Z.; Chen, J.; Zhao, X. Application of the Kano model in identifying customer preferences for urban greening services. Urban For. Urban Green 2021, 65, 127463. [Google Scholar]
- Lee, H.K.; Hsieh, P.F. Application of the Kano model to the evaluation of satisfaction with online learning in higher education. Int. J. Distance Educ. Technol. 2021, 19, 1–15. [Google Scholar] [CrossRef]
- Lee, Y.H.; Chiu, C.Y. Applying the Kano model to evaluate the satisfaction of fitness service users. Int. J. Environ. Res. Public Health 2019, 16, 3924. [Google Scholar]
- Li, Z.; Yang, J. Study on residents’ satisfaction evaluation of urban public space facilities based on the Kano model. J. Clean. Prod. 2021, 279, 123521. [Google Scholar]
- Liu, S.; Ren, S. Applying the Kano model to evaluate customer satisfaction in the catering industry: A case study of a college canteen. J. Foodserv. Bus. Res. 2019, 22, 327–338. [Google Scholar]
- Mokhtari, S.; Shokohyar, S.; Beheshti, S. Application of the Kano model to determine the key factors influencing users’ acceptance of virtual stores. J. Retail. Consum. Serv. 2020, 55, 102101. [Google Scholar]
- Rahim, A.R.A.; Ismail, N.; Yusoff, R.M. The use of the Kano model to evaluate online shopping experience. J. Bus. Res. 2021, 132, 174–183. [Google Scholar]
- Ren, J.; Li, Q.; Li, H.; Li, L. Application of the Kano model in evaluating and improving the quality of long-term care services for the elderly. J. Clean. Prod. 2021, 312, 127835. [Google Scholar]
- Shih, C.W.; Chen, T.C. Applying the Kano model to evaluate users’ preferences for museum mobile app services. J. Cult. Herit. Manag. Sustain. Dev. 2020, 10, 423–441. [Google Scholar]
- Sinha, S.; Goyal, P. Customer satisfaction evaluation for public bus transport services using Kano model: A case study of Indian cities. J. Public Transp. 2019, 22, 74–92. [Google Scholar]
- Wang, S.; Chen, L. Using Kano model to identify factors affecting users’ adoption of intelligent transportation system. J. Intell. Transp. Syst. Technol. Plan. Oper. 2021, 25, 1–12. [Google Scholar]
- Shafique, M.N.; Abbas, M. Application of Kano model in determining the satisfaction level of customers for online shopping websites. J. Adv. Manag. Res. 2019, 16, 243–263. [Google Scholar]
- Yoo, D.J.; Kim, Y.J.; Kim, J.H. Applying the Kano model to analyze the satisfaction of healthcare service users: A case study of a university hospital. Int. J. Environ. Res. Public Health 2019, 16, 2678. [Google Scholar]
- Chen, Y.J.; Lin, C.P.; Liu, Y.L. Investigating service quality, satisfac-tion and loyalty of hotels in Taiwan during COVID-19 pandemic. Int. J. Hosp. Manag. 2021, 95, 102962. [Google Scholar] [CrossRef]
- Le, M.T.; Dao, T.H.; Nguyen, V.T. Investigating the impact of intangible service attributes on customer satisfaction in the hotel industry: The case of Vietnam. J. Hosp. Tour. Manag. 2021, 47, 218–226. [Google Scholar] [CrossRef]
- Kim, H.; Lee, J.S. An empirical investigation of the impact of hotel employees’ service attributes on customer satisfaction. J. Qual. Assur. Hosp. Tour. 2019, 20, 288–305. [Google Scholar] [CrossRef]
- Kim, H.J.; Jang, S.S. The influence of hotel location and accessibility on guests’ satisfaction: Focused on business hotels in South Korea. Sustainability 2020, 12, 9476. [Google Scholar] [CrossRef]
- Patton, M.Q. Qualitative Evaluation and Research Methods; SAGE Publications, Inc.: Thousand Oaks, CA, USA, 1990. [Google Scholar]
- Yin, R.K. Case Study Research: Design and Methods (Applied Social Research Methods); Sage publications: Thousand Oaks, CA, USA, 2014. [Google Scholar]
- Kuo, W.L. Research on Curriculum and Method of Environmental Design Education—A Case Study of International Workshop and Cross-field Teaching Scene; Ministry of Education: Taipei, Taiwan, 2020; p. 23. [Google Scholar]
- Dam, N.T.; Siang, T. A review of knowledge management systems: Challenges and opportunities in the era of big data. J. Knowl. Manag. 2020, 24, 492–516. [Google Scholar]
- Chen, C.C.; Li, Y.J. The Application of Kano Model on Exploring the Attractive Attributes of Cultural Product Design. J. Des. 2009, 13, 25–41. [Google Scholar]
- Chen, C.J.; Hsu, L.L.; Chen, Y.H. Exploring the Critical Quality Attributions of 3C web sites innovative plans by using Kano and TRIZ Methodology. J. Qual. 2016, 23, 91–116. [Google Scholar]
- Liu, P.H.; Weng, J.J. Participatory Design Applied in the Integrated Community Cultivation-How the Dialogue Platform is Established in the Field. In Proceedings of the LSHI 2018 Linkage × Symbiosis International Conference of Cultural Heritage and Design Innovation Proceeding, Taipei, Taiwan, 16 June 2018; pp. 287–296. [Google Scholar]
- Lo, C.-H. Application of Refined Kano’s Model to Shoe Production and Consumer Satisfaction Assessment. Sustainability 2021, 13, 2484. [Google Scholar] [CrossRef]
- Matzler, K.; Hinterhuber, H.H. How to make product development projects more successful by integrating Kano’s model of customer satisfaction into quality function deployment. Technovation 1998, 18, 25–38. [Google Scholar] [CrossRef]
- Violante, M.G.; Vezzetti, E. Kano qualitative vs quantitative approaches: An assessment framework for products attributes analysis. Comput. Ind. 2017, 86, 15–25. [Google Scholar] [CrossRef]
- Berger, C.; Blauth, R.; Boger, D. Kanos Methods For Understanding Customer-Defind Quality. Comput. Sci. 1993, 2, 3–36. [Google Scholar]
- Martin, B.; Hanington, B.; Hanington, B.M. Universal methods of design: 100 ways to research complex problems. In Develop Innovative Ideas, and Design Effective Solutions; Rockport Publishers: Beverly, MA, USA, 2012; pp. 12–13. [Google Scholar]
- Bitner, M.J. Servicescapes: The impact of physical surroundings on customers and employees. J. Mark. 1992, 56, 57–71. [Google Scholar] [CrossRef]
- Lin, F.-H.; Tsai, S.-B.; Lee, Y.-C.; Hsiao, C.-F.; Zhou, J.; Wang, J.; Shang, Z. Empirical research on Kano’s model and customer satisfaction. PLoS ONE 2017, 12, e0183888. [Google Scholar] [CrossRef]
- Kim, J.J.; Lee, Y.; Han, H. Exploring competitive hotel selection attributes among guests: An importance-performance analysis. J. Travel Tour. Mark. 2019, 36, 998–1011. [Google Scholar] [CrossRef]
- Liu, K.-N.; Hu, C. Investigating the impacts of hotel brand experience on brand loyalty: The mediating role of brand positioning. Int. J. Hosp. Tour. Adm. 2022, 23, 1102–1124. [Google Scholar] [CrossRef]
- Keiningham, T.; Aksoy, L.; Bruce, H.L.; Cadet, F.; Clennell, N.; Hodgkinson, I.R.; Kearney, T. Customer experience driven business model innovation. J. Bus. Res. 2020, 116, 431–440. [Google Scholar] [CrossRef]
- Hong, Y.; Cai, G.; Mo, Z.; Gao, W.; Xu, L.; Jiang, Y.; Jiang, J. The impact of COVID-19 on tourist satisfaction with B&B in Zhejiang, China: An importance–performance analysis. Int. J. Environ. Res. Public Health 2020, 17, 3747. [Google Scholar]
Figure 1.
Research framework (source: organized by this study).

Figure 2.
Customer journey map (source: organized by this study).

Figure 3.
Summary of the KJ for the public space (source: organized by this study).

Figure 4.
Summary of the KJ for the intermediary space and rooms (source: organized by this study). (M): must-be; (O): one-dimensional; (A): attractive; (I): indifferent; (R): reverse; (Q): questionable.
Figure 4.
Summary of the KJ for the intermediary space and rooms (source: organized by this study). (M): must-be; (O): one-dimensional; (A): attractive; (I): indifferent; (R): reverse; (Q): questionable.

Figure 5.
The segmentation of service attributes.


Table 1.
Overview of the five dimensions of quality requirements (source: organized by this study).
| Quality Requirement | Content |
|---|---|
| Must-be quality | The presence of this quality is taken for granted, but the absence of this quality still results in customer dissatisfaction. |
| One-dimensional quality | The presence of this quality leads to customer satisfaction, and the lack of it results in customer dissatisfaction. |
| Attractive quality | The presence of this quality leads to customer satisfaction, but the lack of it does not result in customer dissatisfaction. |
| Indifferent quality | The presence or absence of this quality leads to neither satisfaction nor dissatisfaction. |
| Reverse quality | The presence of this quality leads to customer dissatisfaction, and the lack of it results in customer satisfaction. |
Table 2.
Kano’s evaluation table.
| Absence of Quality | ||||||
|---|---|---|---|---|---|---|
| I Like It | I Expect It That Way | It Does Not Matter | I Can Live with It | I Dislike It | ||
| Presence of Quality | I like it | Q | A | A | A | O |
| I expect it that way | R | I | I | I | M | |
| It does not matter | R | I | I | I | M | |
| I can live with it | R | I | I | I | M | |
| I dislike it | R | R | R | R | Q | |
Note. A: attractive; O: one-dimensional; M: must-be; I: indifferent; R: reverse; Q: questionable.
Table 3.
The Kano Questionnaire analysis.
| Identity | Quantity | % | Age | Quantity | % | Purpose of Staying at a Hotel | Quantity | % |
|---|---|---|---|---|---|---|---|---|
| Students Community Retirees | 57 132 1 | 30 69.5 0.5 | 18~22 23~33 34~50 51~60 | 46 119 22 3 | 24.2 62.6 11.6 1.6 | Individual Family Group Business | 130 1 45 14 | 68.4 0.5 23.7 7.4 |
| Total | 190 | 100 | Total | 190 | 100 | Total | 190 | 100 |
Table 4.
The Kano questionnaire analysis.
| Attributes | (M) | (O) | (A) | (I) | I | (Q) | ||
|---|---|---|---|---|---|---|---|---|
| In-Room Facility | Novel designs | 3.2% | 10.5% | 57.9% | 26.3% | 0.5% | 1.6% | (A) |
| Balcony | 2.1% | 12.6% | 53.2% | 30.5% | 0.0% | 1.6% | (A) | |
| Lighting be controlled | 41.6% | 38.4% | 10.5% | 7.4% | 0.5% | 1.6% | (M) | |
| Sockets | 34.7% | 47.4% | 7.4% | 7.9% | 1.1% | 1.6% | (O) | |
| Mobile device | 2.6% | 10.5% | 43.2% | 41.6% | 0.5% | 1.6% | (A) | |
| Hooks in bath | 27.4% | 48.4% | 10.5% | 11.6% | 0.5% | 1.6% | (O) | |
| Air purifier | 12.6% | 27.4% | 46.3% | 10.5% | 1.6% | 1.6% | (A) | |
| Themed decorations | 3.7% | 8.4% | 50.0% | 36.3% | 0.0% | 1.6% | (A) | |
| Desk lamp | 15.8% | 32.1% | 26.3% | 23.2% | 1.1% | 1.6% | (O) | |
| Separate shower/bathtub | 15.8% | 45.3% | 23.2% | 13.7% | 1.1% | 1.1% | (O) | |
| Public Space in Room Floor Area | Magazine rack | 3.2% | 4.2% | 26.3% | 64.2% | 0.5% | 1.6% | (I) |
| Public resting area | 0.5% | 1.1% | 1.1% | 45.3% | 50.5% | 1.6% | (R) | |
| Ice machine | 6.8% | 14.2% | 43.2% | 33.2% | 0.5% | 2.1% | (A) | |
| Corridor decorations | 3.2% | 12.1% | 40.5% | 42.1% | 0.5% | 1.6% | (I) | |
| Hotel and Lobby Facility | Grand entrance | 10.0% | 17.9% | 42.1% | 26.8% | 1.6% | 1.6% | (A) |
| Touchscreen board | 2.1% | 2.1% | 42.1% | 51.6% | 0.5% | 1.6% | (I) | |
| Travel guidebooks | 13.2% | 7.4% | 30.0% | 46.3% | 2.1% | 1.1% | (I) | |
| Local cultural | 2.1% | 2.6% | 45.8% | 45.8% | 2.1% | 1.6% | (I) | |
| Shops | 2.6% | 6.3% | 28.4% | 59.5% | 1.6% | 1.6% | (I) | |
| Sofas | 17.9% | 44.2% | 24.7% | 12.1% | 0.0% | 1.1% | (O) | |
| Souvenir shop | 2.1% | 8.9% | 28.9% | 56.8% | 1.6% | 1.6% | (I) | |
| Counter themed | 1.6% | 14.7% | 52.1% | 29.5% | 0.5% | 1.6% | (A) | |
| Electronic sign | 7.9% | 18.4% | 36.8% | 33.2% | 2.1% | 1.6% | (A) | |
| Counter | 3.7% | 11.6% | 46.3% | 36.3% | 1.1% | 1.1% | (A) | |
| Bar in conference room | 8.4% | 22.6% | 47.9% | 20.0% | 0.0% | 1.1% | (A) | |
| Computers in business room | 8.9% | 17.4% | 40.0% | 32.1% | 0.0% | 1.6% | (A) | |
| Services | Receives guests unprompted | 12.6% | 18.9% | 43.7% | 22.1% | 1.1% | 1.6% | (A) |
| Smiles when serving | 16.8% | 40.5% | 24.7% | 14.2% | 1.6% | 2.1% | (O) | |
| Answers immediately | 28.9% | 46.3% | 12.6% | 8.9% | 1.6% | 1.6% | (O) | |
| Solute satisfaction | 4.7% | 3.2% | 28.9% | 55.8% | 5.3% | 2.1% | (I) | |
| Shoe-cleaning machine | 0.5% | 2.1% | 25.8% | 69.5% | 0.5% | 1.6% | (I) | |
| Chairs in elevator lobby | 5.3% | 11.1% | 34.7% | 44.7% | 2.6% | 1.6% | (I) | |
| Elevator music | 3.7% | 10.5% | 50.0% | 33.7% | 1.1% | 1.1% | (A) | |
| Restaurant | Local delicacies | 2.6% | 7.4% | 54.7% | 32.6% | 1.1% | 1.6% | (A) |
| Chef specials | 1.6% | 3.2% | 45.8% | 47.4% | 0.5% | 1.6% | (I) | |
| Themed atmosphere | 2.1% | 18.4% | 50.5% | 27.4% | 0.0% | 1.6% | (A) | |
| Clear tables promptly | 12.6% | 32.6% | 27.9% | 24.7% | 0.5% | 1.6% | (O) | |
| Provide assistance unprompted | 16.3% | 40.5% | 23.2% | 18.4% | 0.0% | 1.6% | (O) | |
| Eastern and Western | 15.8% | 43.7% | 26.8% | 12.6% | 0.0% | 1.1% | (O) |
Table 5.
Coefficients of Kano quality attribute and customer satisfaction.
| Attributes | (SI) | (DSI) | Kano Category | |
|---|---|---|---|---|
| In-Room Facility | Novel designs | 0.70 | −0.14 | Attractive |
| Balcony | 0.67 | −0.15 | Attractive | |
| Lighting be controlled | 0.50 | −0.82 | Must-Be | |
| Sockets | 0.56 | −0.84 | One-Dimensional | |
| Mobile device | 0.55 | −0.13 | Attractive | |
| Hooks in bath | 0.60 | −0.77 | One-Dimensional | |
| Air purifier | 0.76 | −0.41 | Attractive | |
| Themed decorations | 0.59 | −0.12 | Attractive | |
| Desk lamp | 0.60 | −0.49 | One-Dimensional | |
| Separate shower/bathtub | 0.70 | −0.62 | One-Dimensional | |
| Public Space in Room Floor Area | Magazine rack | 0.31 | −0.08 | Indifferent |
| Public resting area | 0.04 | −0.03 | Reverse | |
| Ice machine | 0.59 | −0.22 | Attractive | |
| Corridor decorations | 0.54 | −0.16 | Attractive/Indifferent | |
| Hotel and Lobby Facility | Grand entrance | 0.62 | −0.29 | Attractive |
| Touchscreen board | 0.45 | −0.04 | Indifferent | |
| Travel guidebooks | 0.39 | −0.21 | Attractive/Indifferent | |
| Local cultural | 0.50 | −0.05 | Attractive/Indifferent | |
| Shops | 0.36 | −0.09 | Indifferent | |
| Sofas | 0.70 | −0.63 | One-Dimensional | |
| Souvenir shop | 0.39 | −0.11 | Indifferent | |
| Counter themed | 0.68 | −0.17 | Attractive | |
| Electronic sign | 0.57 | −0.27 | Attractive | |
| Counter | 0.59 | −0.16 | Attractive | |
| Bar in conference room | 0.71 | −0.31 | Attractive | |
| Computers in business room | 0.58 | −0.27 | Attractive | |
| Services | Receives guests unprompted | 0.64 | −0.32 | Attractive |
| Smiles when serving | 0.68 | −0.60 | One-Dimensional | |
| Answers immediately | 0.61 | −0.78 | One-Dimensional | |
| Solute satisfaction | 0.35 | −0.09 | Indifferent | |
| Shoe-cleaning machine | 0.28 | −0.03 | Indifferent | |
| Chairs in elevator lobby | 0.48 | −0.17 | Attractive/Indifferent | |
| Elevator music | 0.62 | −0.15 | Attractive | |
| Restaurant | Local delicacies | 0.64 | −0.10 | Attractive |
| Chef specials | 0.50 | −0.05 | Attractive/Indifferent | |
| Themed atmosphere | 0.70 | −0.21 | Attractive | |
| Clear tables promptly | 0.62 | −0.46 | One-Dimensional | |
| Provide assistance unprompted | 0.65 | −0.58 | One-Dimensional | |
| Eastern and Western | 0.71 | −0.60 | One-Dimensional |
Disclaimer/Publisher’s Note: The statements, opinions and data contained in all publications are solely those of the individual author(s) and contributor(s) and not of MDPI and/or the editor(s). MDPI and/or the editor(s) disclaim responsibility for any injury to people or property resulting from any ideas, methods, instructions or products referred to in the content. |
© 2023 by the authors. Licensee MDPI, Basel, Switzerland. This article is an open access article distributed under the terms and conditions of the Creative Commons Attribution (CC BY) license (https://creativecommons.org/licenses/by/4.0/).
Share and Cite
MDPI and ACS Style
Chang, T.-Y.; Chiu, Y.-C. Exploiting Service Design in Service Quality: Escorting the Customer’s Experiential Value in the Journey of a Star-Rated Hotel. Systems 2023, 11, 206. https://doi.org/10.3390/systems11040206
AMA Style
Chang T-Y, Chiu Y-C. Exploiting Service Design in Service Quality: Escorting the Customer’s Experiential Value in the Journey of a Star-Rated Hotel. Systems. 2023; 11(4):206. https://doi.org/10.3390/systems11040206
Chicago/Turabian StyleChang, Tsen-Yao, and Yu-Chieh Chiu. 2023. "Exploiting Service Design in Service Quality: Escorting the Customer’s Experiential Value in the Journey of a Star-Rated Hotel" Systems 11, no. 4: 206. https://doi.org/10.3390/systems11040206
Note that from the first issue of 2016, this journal uses article numbers instead of page numbers. See further details here.