
To Compete or to Collaborate? Logistics Service Sharing and Retailers’ Resale in Competitive Online Channels

1
School of Business, Ningbo University, Ningbo 315211, China
2
Binhai Research Institute, Ningbo University, Ningbo 315211, China
*
Author to whom correspondence should be addressed.
Systems 2023, 11(7), 358; https://doi.org/10.3390/systems11070358
Submission received: 26 May 2023
/
Revised: 3 July 2023
/
Accepted: 11 July 2023
/
Published: 13 July 2023
(This article belongs to the Section Systems Engineering)
Abstract
:The prosperity of e-commerce has made more and more businesses willing to enter the e-commerce market, which has also brought a series of strategic collaboration between firms. This study considers game models with and without collaboration between the platform and the retailer. An e-commerce platform has relative logistics service sharing advantages while the retailer has relative procurement advantages. We formulated a multichannel supply chain consisting of a manufacturer and two retailers to explore the feasibility of the above strategic collaboration model. We utilized the Stackelberg game and Nash game approaches to obtain equilibrium solutions under both cooperative and noncooperative scenarios. Through a further analysis, we determined the impacts of the logistics sensitivity, the cost of the unit logistics service effort, the price of shared logistics service per unit, and the price competition intensity on optimal prices, the logistics service efforts, and the profits. Moreover, the collaborative exchange of advantages between the platform and the retailer needs to consider the interests of participating manufacturers in the game. Our extension suggests all three firms should actively promote deeper collaboration.
1. Introduction
In recent years, there has been a phenomenal growth in e-commerce, with the market size increasing sharply from USD 1336 billion in 2014 to USD 4878 billion in 2021 [1]. Moreover, it is estimated that the total amount of e-commerce sales will reach USD 6542 billion in 2023 [2]. The current hot situation in e-commerce and the optimistic forecast for its future development trends have attracted significant capital investments. There are some giant brands, such as Apple, Samsung, and Haier, deploying online channels to expand their sales and influences [3]. With the development of e-commerce, the choice of channels has become more diversified.
Meanwhile, consumers tend to have a preference for the delivery speed of online product logistics services [4]. Logistics services refer to whether customers can obtain products in a timely and reliable manner, and whether customers experience professional services such as speed, reliability, professionalism, and so on [5]. According to a survey by Avionos, 62% of American digital shoppers believe that fast delivery is vital for a positive retail experience, which is more effective than return strategies, good sales services, and other factors [6]. Therefore, logistics services have a great impact on firms’ profit by affecting the customers’ shopping experience [6,7]. It is not difficult to explain why many Chinese e-commerce giants, such as JD.com, Suning, Amazon.cn and Cainiao Network, are committed to building their own logistics service systems. For example, as of 30 September 2022, JD Logistics has operated more than 1500 warehouses, including cloud warehouses, with a total area of more than 30 million square meters. In terms of technological investment, JD Logistics’ R&D spending reached CNY 790 million in the third quarter, a year-on-year increase of 9.6%. After years of continuous investment, the results of JD’s logistics chain network integration have emerged, which strongly supports the flexibility, resilience, agility, and certainty of the supply chain. JD Logistics has become a “stabilizer” for e-commerce customers’ development.
Under this circumstance, a new trend of firm-to-firm logistics service sharing has emerged in the e-commerce market. Online platforms share their own logistics service systems with sellers [8]. This kind of logistics service sharing not only appears between individual sellers and the platform, but also between retail giants who want to enter the e-commerce market, which confirms Ma et al’s point about a multichannel supply chain [9]. However, existing research on logistics service sharing often treats it as a profit-driven service provided by firms [10,11], neglecting the examination of other aspects of value exchange. In practice, the logistics service sharing between retailers and platforms tends to go further. Retailer giants have inherent advantages, while platform providers have advantages in logistics services. Therefore, they are willing to collaborate [12,13]. The collaboration between JD and Walmart is a paradigm. JD and Walmart have ran an official flagship store on the JD platform and used JD’s warehouse distribution’s integrated logistics services since they announced a series of in-depth strategic collaboration on 20 June 2016. Walmart, on the other hand, because of its huge demand for goods, has a huge bargaining power in the upstream of the supply chain, often able to obtain lower procurement costs. Based on this, JD and Walmart reached an agreement on supply chain collaboration. Walmart purchases the general commodities needed by both and resells them to JD at a price lower than the wholesale price given by the manufacturer to JD. In these collaboration, Walmart has been supported by JD’s platform customers and logistics, while JD has obtained lower procurement costs, and both have achieved a win-win situation1.
The above case is very common in real life. Despite implementing a strategic collaboration, product prices across different channels can still vary due to various factors [14]. However, the platform and the retailer often see an increase in profits. Ganten mineral water, a common good on JD.com is a persuasive example. In the following illustration, we take the case of the 570 mL × 24 Ganten mineral water, which is sold on three channels, Ganten (i.e., the manufacturer), JD (i.e., the platform), and Walmart (i.e., the retailer). In the case of a strategic collaboration with Walmart and JD, Ganten provides products to consumers through direct channels and also wholesales products to Walmart and JD. Walmart sells its products directly to consumers and also resell them to JD at collaborative prices. Therefore, JD obtains a lower wholesale price than when purchasing directly from Ganten, reducing procurement costs. JD sells products directly to consumers and also provides logistics services for Walmart. It is worth noting that maintaining a certain logistics distribution system requires a huge cost, which is usually equal to the additional logistics level multiplied by the cost of the unit logistics service effort (CE) [5,13]. Therefore, when JD provides logistics services to Walmart, Walmart can save the cost of maintaining its logistics distribution system and only needs to pay for the fees of the shared logistics service to JD. The CE is constant for a certain period of time, while JD and Walmart jointly negotiate to set the price of the shared logistics service for each unit of product (PSLS). Figure 1 shows the price of the 570 mL × 24 Ganten mineral water in the three channels on JD. We can observe that even when collaboration exists, prices vary across channels. This is primarily because collaboration involves a series of interest exchanges between firms. The differences of these factors leads to differences in the factors considered when making pricing decisions after collaboration.
Based on the above illustrative cases, we aim to investigate the relationship between channel competition and retailers’ collaboration between manufacturer and retailers. We consider a platform to be a retailer with logistics service advantages. The manufacturer produces products and wholesales them to retailers while also selling directly to consumers. The platform has excellent logistics and is willing to collaborate via logistics sharing. One of the retailers has lower purchasing costs, which allows it to resell products to the platform at a lower price when they collaborate. Additionally, price competition affects market demand. We obtain the optimal decisions and outcomes for the three firms when the platform and the retailer collaborate or not, allowing us to analyze the impact of collaboration on the three firms. However, sometimes, the platform and the retailer may not be able to reach a complete collaboration due to differences in interests [15]. In such cases, the platform may only provide shared logistics services for a portion of the retailer’s products, while the retailer only offers some of its products for resale on the platform. However, the remaining products may still operate under the precollaboration mode, where the platform purchases goods from the manufacturer and the retailer handles the logistics for these products. Therefore, to extend the applicability of our study, we also introduce the concept of partial collaboration.
Prior research has often focused on the resale behavior of manufacturers to e-commerce platforms or e-retailers [16,17]. Our investigation aims to fill the research gap regarding the phenomenon of retailers reselling products to e-commerce platforms, while also incorporating the consideration of the current trend of logistics service sharing provided by e-commerce platforms. Additionally, by discussing competition and collaboration in different channel choices, we can more comprehensively characterize the characteristics of supply chain decision-making behavior. The research problems proposed in this study are as follows. (1) How should the manufacturer and the retailers make decisions without or with the retailers’ collaboration? (2) What factors affect the decisions of the three firms? (3) What are the conditions for the three firms to be Pareto improved? (4) How will the manufacturer react if it suffers a loss due to the collaboration? (5) If the collaboration has a positive impact on the three firms under specific conditions, what degrees of collaboration is the most beneficial to the three firms?
To address our research problems, we develop the following two hybrid models. One model is used to optimize decisions when the platform and the retailer do not collaborate, and the other is used when they collaborate. Although there are differences in the models, both are mixed models that involve a Nash game between the platform and the retailer, followed by a Stackelberg game in which the manufacturer leads, and the platform and the retailer follow. Using these models, we obtain the optimal decisions for all three firms and then compare their profits and decisions under different circumstances. We analyze the results and draw conclusions.
Our analysis yields four major findings. (1) In contrast to the scenario without collaboration, when the platform and the retailer collaborate, prices increase across all channels and the platform increases its level of effort in logistics services. (2) The interaction between PSLS and price competition intensity allows for a wide range of Pareto improvements among the three firms. (3) If the manufacturer experiences losses due to collaboration, it may adjust its wholesale prices to protect its own profits. This is because changes in wholesale prices can have a significant impact on the profits of all three firms. (4) If collaboration is expected to have a positive impact on all three firms, then each firm will anticipate a full collaboration between the retailers.
The rest of this paper is organized as follows. In Section 2, we review the existing literature on multiple-channel supply chain, logistics service sharing, and resale. In Section 3, we present and solve the hybrid models (a Nash game model and a Stackelberg game model), both with and without collaboration. We conduct a theoretical analysis and compare the optimal decisions under collaborative and noncollaborative scenarios. In Section 4, we discuss our research problems with numerical parameters and find the managerial conclusions as well as their possible practical implementations. Finally, in Section 5, we summarize our findings, propose some managerial insights, and suggest directions for future research.
2. Literature Review
There are three streams of literature related to our study, namely multiple-channel supply chain, logistics service sharing, and resale.
2.1. Multiple Channel
The first component of our literature framework is the multiple-channel supply chain. Multichannel supply chains have been widely studied in the past few decades. Many scholars [12,18,19,20,21,22] have investigated supply chain coordination in a multichannel supply chain, which often involves the coordination between multiple manufacturers producing different products and their retailers. The differences lie in the particularity of products, the number of retailers, and the corresponding relationship between retailers and manufacturers. For example, Hsieh et al. [18] formulated a supply chain model with multiple manufacturers and a single retailer producing different products and surveyed the impact of the coordination mechanism of pricing and ordering decisions on system profits. Khorshidvand et al. [22] explored the coordinated decision-making of multilevel and multichannel supply chains considering the sales channel price, advertising level, and product’s green policy. They proposed and verified an improved centralized supply chain model with practicability. Of course, the multichannel supply chain model is also applied to more supply chain problems. Ma et al. [9] investigated the multichannel supply chain with manufacturers, electronic retailers, and traditional retailers, and studied the profit, carbon emissions, and social welfare of the three long-term dynamic game models, without a cap-and-trade regulation, grandfathering approach, and benchmarking approach. Zhang et al. [23] studied the recycling mode selection and carbon emission reduction decision of the closed-loop supply chain of electric vehicles’ power batteries under the carbon limit and trading policy. They reached the conclusion that the echelon utilization of firms participating in the recycling business has a positive role in alleviating the recycling pressure and improving the profits of manufacturing firms. Vafaei et al. [24] proposed a mixed-integer programming model for a sustainable distribution network design considering multiproduct, multistage, and multitransport modes, especially third-party logistics, to solve the problem of choosing appropriate distribution channels according to product types and the number of vehicles transporting products. The research conducted by Lin et al. [25] provided a solution to the choice between the reseller model and the agency model for multichannel supply chains on e-commerce platforms. The study analyzed and concluded on the impact of the price competition intensity, market share, and commission rates on the strategy of model selection. Furthermore, the inventory problem is also a key issue of interest in multichannel supply chains [26,27,28]. However, the existing literature does not pay attention to the issue of voluntary collaboration between the platform and the retailer in multiple channels. This issue is evidently significant because retailers and e-commerce platforms are key stakeholders in the supply chain, and they can promote mutual benefits by continuously exploring new supply chain collaboration models.
2.2. Logistics Service Sharing
In recent years, sharing has become a hot topic in supply chain research. The types of sharing economy are extensive, varying from knowledge sharing [29,30,31], inventory sharing [32,33], product sharing [34,35], to service sharing [36,37]. Among these sharing modes, service sharing is related to our research.
The second component of our literature framework is logistics service sharing, which belongs to service sharing. In recent years, e-commerce has continued to prosper, and more and more scholars have taken into account important logistics issues. Meanwhile logistics service sharing plays a vital role in supply chain management by enabling the collaboration and resource optimization among various stakeholders. The study on logistics service sharing has emerged as the times require. Luo et al. [13] dug into the equity collaboration mechanism in the shared-logistics-service supply chain and provided a feasible solution for logistics firms to join the shared-logistics-service platform. He et al. [38] delved into competition issues in dual-channel supply chains where logistics services are shared. When the shared logistics price is found in a certain range, the manufacturer and the retailer can make a Pareto improvement, and the price competition intensity will narrow the range. Guo et al. [10] proposed a two-channel supply chain model to study the impact of logistics service sharing on firms’ decision-making and profits. They concluded that the impact of a logistics service cost depends on the logistics service disadvantage of manufacturers and the logistics service cost difference between manufacturers and electronic retailers. The existing literature has examined the implementation conditions and operational details of logistics service sharing. However, it lacks a deeper exploration of the application of logistics service sharing in the context of a benefit exchange within the supply chain.
2.3. Resale
The third component of our literature framework is resale. Indeed, previous research has predominantly focused on studying resale behavior among consumers within the supply chain [39,40,41,42,43] or between the manufacturer and the e-retailer [10,16,17,38]. The literature has primarily explored the actions of end-consumers in terms of reselling products. However, there has been limited attention given to examining resale behavior among other members within the supply chain, such as retailers, distributors, or manufacturers. Understanding and analyzing the dynamics of resale behavior among these actors can provide valuable insights into the overall functioning and efficiency of the supply chain. Further research in this area can contribute to a more comprehensive understanding of the complexities and implications of resale behavior within the broader supply chain context. Perrigot and Basset [44] conducted empirical research that specifically focused on pricing issues within franchise stores. The study emphasized the importance of avoiding certain price-related practices in franchise chains in order to mitigate potential conflicts. Li et al. [45] examined the issue of how platforms should strike a balance between the agency pattern and resale mode within a supply chain that involves frenemy platforms. The researchers discussed the factors influencing the choice of platform sales models, emphasizing performance investment and royalty rates as key determinants. They explored the implications of these factors on the decision-making process for platforms in selecting the most suitable sales model. The considerations of Liu and Zhao [46] regarding the choice of sales channels (reseller or agency) and logistics strategies on e-commerce platforms provide valuable insights for manufacturers and e-commerce platforms to optimize their operational decisions based on different logistics strategies. However, with the booming e-commerce industry, traditional retailers are increasingly joining e-commerce platforms. Existing research has not delved deeper into the bargaining power advantages possessed by traditional retailers. Exploring the resale behavior of retailers on e-commerce platforms will be beneficial for traditional retailers to optimize their decision-making and enhance profitability in the e-commerce era.
Different from the existing literature, in this study, we intend to investigate the mode of strategic resale and logistics sharing between the platform and the retailer in a multichannel supply chain. Our research encompasses the integration of logistics service sharing and resale, focusing on examining a supply chain consisting of two retailers (one traditional retailer and another operating as an e-commerce platform) and one manufacturer. In our analysis, the retailers engage in a Nash game, while both the retailers and the manufacturer participate in a Stackelberg game. By obtaining the equilibrium solution after the game, we delve into the specific changes in optimal profits and decisions for all firms resulting from this strategic collaboration between retailers.
3. Modeling Formulation
In this section, we assume a supply chain system composed of a manufacturer and two retailers (retailer 1 and retailer 2). Hereafter, retailer 2 and platform are used interchangeably. The manufacturer sells products to the retailers as well as the end-consumers simultaneously. Furthermore, the two retailers sell products to the consumers so that they have a competitive relationship among the three channels. We assume that retailer 1 has a superior logistics system and is willing to share it with others in exchange for benefits while retailer 2 has a much larger client volume than retailer 1 so it can purchase a large quantity of products from the manufacturer and obtain a lower wholesale price than retailer 1. We set as the wholesale price that retailer 2 obtains without collaboration and as the wholesale price that retailer 1 obtains without collaboration.
We consider that consumers have a demand for less waiting time, which depends on the different logistics service efforts l. The logistics service level is affected by the logistics service effort. The establishment of a logistics service system inherently involves costs, and we designate the cost for each unit of logistics service effort (CE) as . We utilize the concept of consumer logistics sensitivity to quantify the extent of this demand. Since both retailers have their own advantages in the supply chain, they ponder whether it is necessary to have a collaboration or not, that is, retailer 1 provides logistics service sharing to retailer 2 and retailer 2 provides a lower wholesale price of products to retailer 1 (we set it to ). If they conduct a strategic collaboration, retailer 2 obtains a lower wholesale price (we set it to ) than when not collaborating (it is easy to explain since retailer 2 would purchase a larger quantity of goods). Based on the above background, there is a relationship between wholesale prices under different scenarios, , , and .
All three firms have a basic logistics service effort () which definitely have an impact on demands and profits. We assume the basic logistics service efforts of all three firms are low. Therefore, we conclude the effect of on the market potential is negligible so it does not directly appear in the equation of our demand functions. We assume only the two retailers make efforts to improve their logistics service levels and generate extra demands and costs in their models. As mentioned above, the logistics service level that affects consumer preferences comes from the additional logistics service level efforts made by firms, while manufacturers do not take additional measures to improve their logistics service level. Therefore, we do not consider the impact of the logistics service effort on the market demand and cost of the manufacturers in the demand function without any loss of generality.
Decision variables are characteristics of resources or physical entities that are under the control of decision-makers. In our study, we considered the price (p) and the level of logistics service effort (l) as decision variables. These variables were chosen because they were within the decision-making authority of the firms and facilitated the analysis of the impact of external factors on them. The sale of homogeneous products through various channels often results in a fierce price competition within each channel. In this context, our primary focus was to examine the influence of external factors, specifically, price competition, on demand. To represent the intensity of price competition, we employed the variable . The variables and parameters used in this paper are listed in Table 1.
To avoid trivial solutions and make the models consistent with our cases, we made the following assumptions that are applicable to this paper.
Assumption 1.
In a supersize market, the enormous size stimulates demand for general retail products that approaches infinity. Meanwhile, in order to make the final results conform to the actual situation, we assume that α is large enough.
Assumption 2.
We assume that retailer 1 has exceptionally superior logistics services. Therefore, retailer 1 is willing to provide shared logistics services that other firms are willing to accept. The logistics capacity of retailer 1 is unlimited, so their logistics services quality is not directly affected by demand.
3.1. Hybrid Model without Collaboration
We set the hybrid model without collaboration as the benchmark model. In this case, the manufacturer sells products to the two retailers and consumers simultaneously. The two retailers sell products directly to consumers. The retailers use different and stable logistics systems and bear the corresponding costs, which are used to maintain the smooth operation of the logistics systems.
Figure 2 shows the supply chain framework in this no-collaboration case.
In this case, the manufacturer maximizes its profit by optimizing its retail price to consumers. The two retailers maximize their profit by optimizing their retailer prices to consumers and logistics service efforts. The wholesale price does not play a role in any party’s decision. The two retailers are engaged in a Nash game, while the three firms are playing a Stackelberg game in which the manufacturer acts as the leader and the retailers act as the followers.
Figure 3 depicts the decision timeline in the case without collaboration.
We assume that the market possesses an initial potential, representing the inherent demand level for each channel, independent of external factors. The prices and logistics service efforts implemented by firms significantly influence market demand. Consumer sensitivity to logistics within the market also impacts the effect of logistics service efforts on market demand. Price competition among firms can also affect demand, as higher pricing by competitors increases the likelihood of consumers purchasing products from alternative channels. As the quality of products in the three channels is identical, the price competition in the market leads to consumers being more inclined to purchase products from other channels if the price of any particular channel rises. Kurata et al. [47] applied the price competition that existed in all channels to their research on multichannel supply chains.
Therefore, the demands of the channel members can be expressed as follows,
The demand function of the manufacturer, as in (1), consists of three parts: (a) The market potential for the manufacturer. (b) The manufacturer’s price in the direct channel. Consumers always have a preference for low prices. The higher the price, the lower the market demand for products. Therefore, the price is always negatively related to the market demand. (c) The influence of price competition on the market demand. There is a substitution between products from different channels. Therefore, in a competitive market, the prices of competitors will be positively correlated with the market demand of a certain entity. The demand functions of retailer 1 and retailer 2, as in (2) and (3), both consist of four parts. The first three components of the demand function of the two retailers are the same as those of the manufacturer. The difference is that the demand functions of the retailers introduce the impact of the logistics service effort on consumers.
The investment costs of logistics services of the two firms depend on the logistics service efforts. Due to previous practical experience, we referred to articles [48,49,50] and assumed the cost as . For brevity, we normalized the manufacturer’s production cost to zero [51,52]. The profits of the channel members was expressed as follows:
In the profit functions, p represents the selling price of the channel, while D represents the market demand for each channel. The superscript N denotes the scenario of noncollaboration, and the subscripts m, , and represent different members of the supply chain. Additionally, w denotes the wholesale price, and l represents the level of logistics service effort. These notations are used consistently throughout the following illustration.
The profit function of the manufacturer, as in (4), consists of three components. The first component of (4) is the profit from selling products to consumers in the direct channel, the second and third components are the profit from wholesaling products to retailer 1 and retailer 2, respectively. The profit functions of the retailers (i.e., (5) and (6)) similarly consist of two components. The first component is the net profit from selling products to consumers in the direct channel, the second component is the cost of making a logistics service effort.
Through the utilization of methodologies such as the hybrid game model, which amalgamates the Nash game model and Stackelberg game model, in conjunction with the Hessian Matrix, we endeavored to optimize the decision variables to yield maximal profits for each of the three firms involved.
Lemma 1.
To prove the existence of maximum profits, we considered two necessary conditions to validate the outcomes: and .
Based on the above conditions, we generated the following theorem.
Theorem 1.
In the case without collaboration, the optimal decisions and equilibrium values are summarized in Table 2. All proofs are presented in Appendix A.
Based on Theorem 1, we derived the impacts of the price competition intensity, consumers’ logistics sensitivity, and cost the of unit logistics service effort on the manufacturer’s optimal price. The results and explanations are shown in Corollaries 1–3.
Corollary 1.
The impact of the price competition intensity on the manufacturer’s optimal price without collaboration is .
Corollary 1 indicates that the optimal price of the manufacturer always increases if the price competition intensity increases.
Corollary 2.
The impact of the consumers’ logistics sensitivity on the optimal price of the manufacturer without collaboration is .
Corollary 2 indicates that the optimal price of the manufacturer always increases if the consumers’ logistics sensitivity without collaboration increases.
Corollary 3.
The impact of the CE on the manufacturer’s optimal price without collaboration is .
Corollary 3 indicates that the optimal price of the manufacturer always decreases if the cost of the unit logistics service effort increases.
3.2. Hybrid Model with Collaboration
In the case with collaboration between the retailers, retailer 1 provides logistics service sharing to retailer 2 so that retailer 2 no longer needs to provide additional logistics service efforts. At the same time, retailer 2 purchases sufficient quantities of products that are enough for a bilateral demand at a lower price than any party’s price in the case without collaboration due to the effect of quantity discounts. Then, retailer 2 provides the products at a lower wholesale price than the manufacturer to retailer 1 in return. In this section, we assume an ideal state, that is, retailer 1 does not buy any goods from wholesalers, and retailer 2 no longer undertakes any logistics service efforts. Moreover, we assume that the logistics service capacity of retailer 1 is unlimited so that providing logistics service sharing does not generate intuitive logistics costs for retailer 1 (but providing logistics service sharing may affect the logistics service effort of retailer 1, thereby affecting its cost) if it provides the logistics service sharing to retailer 2 [38]. Figure 4 shows the supply chain framework in this case.
The decision order does not change in this case, and we still adopted a Nash game to optimize the decisions of retailer 1 and retailer 2, and the three firms played a Stackelberg game, where the manufacturer was the leader and the retailers were the followers. Figure 5 depicts the decision timeline in the case without collaboration.
The demands of the channel members can be expressed as follow,
The tripartite demand functions in the case with collaboration are similar to that in the case without collaboration, only replacing the service effort of retailer 2 with the logistics service effort of retailer 1. Therefore, this subsection does not elaborate on the composition of the demand functions.
In this case, the manufacturer and retailer 1 maximize their profits by optimizing their selling prices of products to consumers and their logistics service efforts, while retailer 2 maximizes its profit only by optimizing its selling price of products to consumers. The profits of the channel members are expressed as follows,
The profit function of the manufacturer, as in (10), consists of two components. The first component is the profit from selling products to consumers in the direct channel. The second component is the profit from wholesaling products to the retailer. It is noteworthy that the wholesale quantity is the combination of the demands of retailer 1 and retailer 2. The profit function of retailer 1, as in (11), consists of three components. The first component is the net profit from selling products to consumers in the direct channel. The second component is the cost of making a logistics service effort. The third component is the profit from providing logistics service sharing to retailer 2. The profit function of retailer 2, as in (12), consists of two components. The first component is the net profit from selling products to consumers in the direct channel; the net income per product equals the price minus the wholesale price of the manufacturer minus the PSLS. The second component is the profit from redistributing products to retailer 1; the net income per product equals the wholesale price of retailer 2 minus the wholesale price from the manufacturer.
In the process of the optimal decisions with collaboration, the required conditions are the same as those without collaboration, so they are not repeated.
Theorem 2.
In the case with collaboration, the optimal decisions and equilibrium values are presented in Table 3.
Based on Theorem 2, we can derive the impacts of the consumers’ logistics sensitivity and CE on the manufacturer’s optimal price. The results and explanations are shown in Corollaries 4 and 5.
Corollary 4.
The impact of the consumers’ logistics sensitivity on the optimal price of the manufacturer is .
Corollary 4 indicates that the optimal price of the manufacturer increases if the consumers’ logistics sensitivity increases.
Corollary 5.
The impact of the CE on the optimal price of the manufacturer is .
Corollary 5 indicates that the optimal price of the manufacturer decreases if the cost of the unit logistics service effort increases.
Furthermore, we compared the optimal price of the manufacturer in the two cases. Then, we obtained some critical managerial conclusions.
Theorem 3.
Comparing the retail prices of the manufacturer in the two cases, we obtain, , when . , when .
where .
Theorem 3 indicates that the difference of the optimal prices of the manufacturer in the two cases depends on the PSLS. If the PSLS is lower than a threshold, the manufacturer’s profit is improved when two retailers carry out a strategic collaboration. When the PSLS gradually becomes larger and exceeds the threshold, the strategic collaboration between the two retailers harms the interests of the manufacturer. Hence, if the PSLS is sufficiently low when the retailers implement their strategic collaboration, the manufacturer would welcome such a scenario and may even provide support. Conversely, if the PSLS exceeds the threshold, the manufacturer is likely to intervene in their collaboration.
4. Numerical Analysis
Due to the complexity of decision making, it is difficult to directly obtain or effectively evaluate optimal results and various kinds of analysis. In order to specifically compare the difference between the profits of the three firms in the case with collaboration and without collaboration, we conducted a group of numerical studies to explore the change of the optimal profit between the case with collaboration and without collaboration under different conditions. Based on this, we derived some practical results to guide the behaviors of the three firms.
We set to make sure it was large enough so that all the optimal values would be positive. Considering that most of the retail items on the market cost less than USD 10, we set , , , and . In the setting of the retail price, we satisfied the prerequisites in the background of this paper (, , and ) while referring to the reality (according to our investigation, in reality the value of tends to be similar to ), which meant the set values were logical. We further assumed that and , thus . See Table 4.
4.1. Influences of Price Competition Intensity and PSLS
We considered the price competition intensity and PSLS as two key factors in our study. Therefore, we analyzed their influences on the specific optimal decisions of the three firms. In the case with collaboration, we considered the influence of the price competition intensity and PSLS on the optimal decisions. In the case without collaboration, because the PSLS did not exist, we only analyzed the influence of the price competition intensity on the optimal decisions.
Figure 6 depicts how the optimal decisions change with the increase of price competition intensity in the case without collaboration. Note that the values of and and and , respectively, were very close, so they almost overlap in the figure. In Figure 6, we find that all decision variables increase exponentially with respect to price competition intensity. It means that the price competition intensity had a great positive impact on the pricing of the three firms and the logistics service efforts of the two retailers in the case without collaboration. It is evident that an increase in price competition intensity reinforces the firms’ inclination to utilize additional advantages to attract consumers. Consequently, they exert more efforts in providing logistics services to bolster market demand, as demonstrated by firms such as Suning and JD. However, in a highly competitive market, raising one’s own product price may seem counterintuitive. This could be attributed to three reasons. Firstly, when there is fierce price competition in the market, the demand remains relatively fixed while the supply is limited. Consequently, each channel feels the pressure to compete and seeks to increase profits by raising prices. Secondly, when one channel increases its price, other channels may perceive it as a signal that the channel offers a better product or service quality or can achieve a higher profitability. In order to maintain their competitive positions, other channels may follow suit and raise their own prices to remain competitive. Thirdly, the brand effect also plays a role. In a market with intense price competition, firms may use the brand effect to differentiate their products. Raising prices can be seen as a strategy to enhance perceived product quality or uniqueness, leading consumers to associate higher prices with higher quality or added value. Other channels may adopt a similar strategy, increasing their prices to create a comparable brand image. For instance, HEYTEA employed this strategy initially.
Figure 7 and Figure 8 depicts how the optimal decisions change with the increase of the PSLS and price competition intensity in the case with collaboration. In Figure 7 and Figure 8, we find that in the case with collaboration, the impact of the competition intensity on the optimal decisions is as great as that in the case without collaboration. The reasons for the changes are similar to those in the case without collaboration. However, the PSLS is linearly positively correlated with the optimal decisions, and the growth rates of the optimal decisions regarding PSLS vary. always increases the fastest with the increase of PSLS. When is small, increases the slowest with the increase of PSLS. When is larger than a certain value, increases the slowest with the increase of PSLS. This occurs because when the price of shared logistics services (PSLS) increases, retailer 2 raises its selling price to safeguard its profit and offset the higher cost associated with PSLS. In response, retailer 1 and the manufacturer also adjust their prices to align with retailer 2’s increase. Additionally, as the PSLS rises, retailer 1 needs to exert a greater effort in providing logistics services to justify the higher charges.
4.2. Win-Win Conditions With Collaboration
In this section, we explore the win-win conditions of the manufacturer, retailer 1, and retailer 2. We focused on ascertaining the impacts of the PSLS and on the optimal decisions and profit improvements of the three firms when the retailers collaborated, since the PSLS and were vital determining factors between the retailers that did not consider external channels (the manufacturer).
We first discuss the influences of the PSLS and on the optimal decision change. Since only appeared when there was no collaboration, we did not consider that decision. At the same time, was an exogenous variable in a certain time and space determined by the external environment, while the PSLS was an endogenous variable determined by the negotiation among firms. Therefore, we investigated the influence of on the PSLS threshold in different logistics sensitivities of consumers in different regions.
Let , , , and . We differentiated the change in the optimal decisions with respect to the PSLS, and we obtained some conclusions. when , when , when , and when . There was a certain similarity between the changes in these four optimal decisions and the PSLS, so we discuss them together. It can be observed that when the PSLS exceeds the thresholds corresponding to these four optimal decisions changes, the values of all four optimal decisions changes increase as the PSLS increases, and vice versa.
Figure 9 clearly shows the impact of on the PSLS thresholds. The upper region of each line is the range in which the profit of the relevant optimal decisions increases in the case with collaboration. In Figure 9, we find that with the increase of the price competition intensity, the threshold of decreases, while the threshold of and increases. However, the threshold of is always higher than the thresholds of and . Because always increases when is greater than zero, the threshold line for does not appear in the Figure 9.
The core concern of firms is to improve their own profits, which is also the premise of collaboration. Next, we study the profit changes of the three firms after collaboration under the joint action of the PSLS and . Let , , and . We differentiated the changes in the profits with respect to PSLS, and we obtained some conclusions. when or . It indicates that as the PSLS increases, the optimal profit change for the manufacturer first increases, then decreases, and then increases again. when or . It indicates that when the price competition intensity is low, the optimal profit for retailer 1 first decreases, then increases, and then decreases again as the PSLS increases. However, when the price competition intensity is high, the optimal profit for retailer 1 first increases, then decreases, and then increases again as the PSLS increases. when or . It indicates that as the PSLS increases, the optimal profit change for the manufacturer first increases, then decreases, and then increases again.
Where ,
,
,
Figure 10 shows the range of profit improvement of the manufacturer and the retailers under the retailers’ collaboration. There are three main regions in the figure (other regions may exist, but they are small enough to be ignored). Region I represents that the profits of retailer 1 and retailer 2 have been improved with collaboration. In the retail industry, Walmart and Target are competitors. However, they also collaborate when they need to lower supply chain costs and improve efficiency. They jointly formed a procurement organization named Common Purchasing LLC to save on purchasing costs and enhance their competitiveness in the global procurement market. This collaboration reduced the bargaining power and pricing power of manufacturers, as the two retailers joined forces, potentially leading to a decrease in manufacturers’ profits. As this collaboration affects other participants in the supply chain, manufacturers may take action to safeguard their interests. Region II represents that the profits of the three firms have been improved with collaboration. In the strategic partnership between Best Buy and Target, they optimized their supply chain by jointly procuring, sharing logistics, and sharing data, resulting in increased profits for both firms. Manufacturers also benefited from a higher volume of wholesale sales and spillover sharing of data. Region III represents that the profits of the manufacturers and retailer 2 have been improved with collaboration. In the collaboration between Walgreens and Rite Aid, Walgreens provided a logistics network while Rite Aid offered lower procurement costs. After the collaboration, the manufacturers obtained higher profits from larger wholesale sales, while Rite Aid gained cost advantages through shared logistics and procurement, resulting in increased profits. However, due to the higher logistics costs borne by Walgreens and the cost advantage gained by Rite Aid from lower procurement prices, Walgreens’ profits suffered losses. As can be seen from Figure 10, the Pareto improvement region exists, and the range is quite large. In addition, the PSLSs are generally not so expensive as to reach hundreds of CNY. Therefore, region II is rarely implemented. We can conclude from the above information, in a nutshell, when the retailers collaborate, the three firms have a great chance of achieving win-win results.
4.3. Manufacturer’s Reaction on Loss
Retailer 1 and retailer 2, as collaborating partners, established appropriate contracts to ensure mutual benefits from the collaboration (this ensured the enhancement of one’s own interests by aligning the current competitive environment with the PSLS and the preferential prices offered by retailer 2 through collaboration). The retailers, however, did not necessarily consider the interest of the manufacturer, which may result in the manufacturer incurring losses as a result of their collaboration (as shown in region II in Figure 10). We assumed that the three firms were fair in their concerns. If the profit of the manufacturer was lost due to the collaboration between the retailers, the manufacturer would take corresponding measures to balance the gains and losses of all firms. In our theoretical framework, the manufacturer could decide , , and . We assigned and to a node in Section 4.2 where the manufacturer’s profit suffered, and the retailers’ profit increased. Wholesale prices were then changed to see how the manufacturer’s reaction to the damage affected the profits of the three firms.
Let , , , and . Figure 11 illustrates the effects of wholesale prices on profit changes. There are seven main regions in the figure (other regions may exist, but they are small enough to be ignored). Region I represents that the profits of retailer 1 and retailer 2 has been improved with the collaboration. The wide range of region I implies that many manufacturers of low-priced goods may experience profit losses as a result of the strategic collaboration between the retailers. These manufacturers face difficulties in raising their wholesale prices. Nevertheless, they continue to supply their products to the retailers due to the potential for profitability. Region II represents that the profits of the three firms have been improved with the collaboration. When the wholesale prices are within that range, the manufacturer successfully maintain its own interests by changing the wholesale price, while also ensuring that the interests of the retailers are not compromised. This is the optimal way to set wholesale prices. Only when the wholesale price is within region I and region II will retailer 1 and retailer 2 persist in their collaboration because both firms benefit from the collaboration at that price range. Region III represents that the profits of the manufacturers and retailer 2 have been improved with the collaboration. Region IV represents that only the profit of the manufacturer has been improved with the collaboration. Region V represents that the profits of the manufacturer and retailer 1 have been improved with collaboration. Region VI represents that nobody benefits from the collaboration. Region VII represents that only the profit of retailer 1 has been improved with the collaboration. When the wholesale price is within regions III to VII, retailer 1 and retailer 2 cannot benefit simultaneously. Therefore, if the manufacturer changes the wholesale price to that range, retailer 1 and retailer 2 are likely to terminate their collaboration due to the inability to reach a consensus on their interests. In Figure 11, we can find that the wholesale prices have a significant impact on the profit changes of the three firms. It indicates that the manufacturer can change wholesale prices to secure their interests when it suffers a loss from the retailers’ collaboration. However, the variations in wholesale prices are not necessarily good for the retailers. Therefore, the three firms need to find a balance point in the collaboration, in order to achieve a win-win situation among the three firms.
To accurately depict the changes in the decision-making and profits after the cooperation, we conducted a quantitative analysis. The quantitative results are presented in Table 5. In Table 5, we can observe that within a certain range, as the intensity of the price competition increases, retailer 1 tends to exert more logistics service efforts after the collaboration, and the prices of both the manufacturer and retailer 1, as well as the profits of retailer 1 and retailer 2, increase. Interestingly, when the PSLS increases within a certain range, all decisions and profits rise, including for retailer 2, who bears the cost of the PSLS. Therefore, we suggest that firms consider appropriately increasing the PSLS during the collaboration, as this can facilitate the collective improvement of all firms.
4.4. Extensions on the Partial Collaboration
We discussed the scenarios of full collaboration and noncollaboration. However, achieving full collaboration between the retailers is an ideal scenario, yet it is often challenging to attain in practice. Therefore, we propose the concept of partial collaboration to better inform real-world decision-making. The aim of this subsection is to determine the optimal level of collaboration among firms that maximizes their benefits. By doing so, we seek to provide recommendations on how firms should strategically collaborate with other firms in their supply chain to maximize their benefits. Partial collaboration means that some products of the firms adopt the logistics and procurement mode before the collaboration, while some products adopt the logistics and procurement mode after the collaboration. Based on the above description, we introduce the collaboration coefficient () to represent the collaboration level between retailer 1 and retailer 2. For the two firms, represents the proportion of products adopting the collaborative mode, and represents the proportion of products not adopting the collaborative mode. Therefore, the market demands of channels are as follows:
The demand functions of the manufacturer and retailer 1, as in (13) and (14), are the same as in (1) and (5), respectively. The demand function of retailer 2, as in (15), consists of five components. The first three components are consistent with those in (3). The fourth component is the increased demand for self-built logistics services to transport products which adopt the noncollaborative mode. The fifth component is the increased demand for JD’s logistics services, which provides products that adopt the collaborative mode.
The profits of the channel members can be expressed as follows:
By observing Equations (16)–(18), in the case of a partial collaboration, the profit function of each firm is equal to the profit function in the case with collaboration multiplied by the collaboration coefficient plus the profit function in the case without collaboration multiplied by the noncollaboration coefficient .
Next, we focus on the effect of the collaboration coefficient on profit changes. Based on the previous discussion, it is known that collaboration is often achieved when all three firms can benefit from it and achieve a profit increase. Therefore, in our subsequent analysis, we followed this basic condition for achieving collaboration and focused on the impact of the level of collaboration on the profits of the three firms. We set 10, , so all three firms could be Pareto improved in the case with collaboration. Thus, it was easy to find out how the level of collaboration affected the change in profits.
In order to simplify the calculation process, we directly put the parameter assignment result into the profit function and obtained the optimal decisions.
Theorem 4.
In the case with partial collaboration, the optimal decisions and equilibrium values are summarized in Table 6.
Figure 12 depicts the influence of the collaboration coefficient on the profits of the three firms. In Figure 12, we can find that with the increase of the collaboration coefficient, the profits of all three firms increase. It indicates that the manufacturers and retailers are more inclined to achieve a complete collaboration rather than a partial collaboration between the retailers when the collaboration can make the three firms achieve a Pareto improvement.
From the perspective of profit growth, with the increase in the cooperation coefficient, retailer 2 experiences the largest profit improvement as the collaboration deepens, while the increase in profit for the manufacturer is not as significant. Therefore, in practical operations, we suggest that retailer 2 takes more proactive actions to drive the formation and deepening of the collaboration since minor profit improvements may not generate strong desires for collaboration from other firms.
5. Conclusions and Discussion
In this study, we investigated the impacts of a strategic collaboration between the platform and the retailer on the firms’ decisions and profits in a multiple-channel supply chain consisting of a manufacturer and two retailers. Specifically, we examined the range of a tripartite win-win scenario by enabling the platform and the retailer to achieve strategic inventory and logistics sharing, where the retailer platform provided the retailer with shared logistics services and the retailer provided the platform with wholesale products at lower prices. We developed and solved Stackelberg games to study the equilibrium outcomes in both cases with and without collaboration. Through the equilibrium outcomes, we analyzed the influence of the interaction between the price competition intensity and the PSLS, as well as the interaction between wholesale prices and the profits of the three firms. Additionally, we extended the concept of collaboration coefficient and analyzed its influence on the profits of the three firms. Our study generated many novel findings.
Firstly, in the case of a collaboration, the platform’s logistics service efforts indeed increase since it assumes the responsibility of the retailer’s logistics, requiring an improvement in its logistics service level to meet the expanded logistics demands. However, the price changes of the three firms remain uncertain, primarily influenced by external factors (price competition intensity) and factors related to the finalized content, such as the determined price of shared logistics services (PSLS), within the collaboration.
Secondly, both the price competition intensity and PSLS are critical factors that influence the optimal decisions and profits of the three firms. Regardless of the collaboration, the product prices of all three firms and the logistics service effort made by the retailers increase as the price competition intensity increases. However, the impact of the PSLS on the optimal decisions depends on the price competition intensity. With collaboration, the logistics service effort made by the platform is always larger than without collaboration. As the price competition increases, the threshold for the manufacturer’s retail price always decreases, while the threshold for the retail prices of the platform and the retailer always increases. Furthermore, the interaction between the price competition intensity and the PSLS creates a large Pareto improvement zone. When the price competition intensity is large enough, the three firms can certainly achieve a Pareto improvement, regardless of the value of the PSLS. Therefore, it is essential for the three firms to consider both the price competition intensity and the PSLS when making decisions.
Thirdly, we took fair concerns into account and found how the manufacturer would react if it suffered a loss with the collaboration. The manufacturer has the ability to impact the profits of all three firms by adjusting the wholesale prices of distribution channels, thus avoiding a reduction in profits due to the collaboration. However, such changes in wholesale prices may result in losses for the platform and the retailer after the collaboration. Therefore, a strategic collaboration between the retailers necessitates the involvement of the manufacturer, with all three firms agreeing on the PSLS and wholesale prices in order to achieve a mutually beneficial outcome.
Finally, by introducing the collaboration coefficient, we found that if the collaboration can benefit all three firms, the higher the level of collaboration, the greater the profit of the three firms. Therefore, firms are more inclined towards a full collaboration rather than a partial collaboration, as long as the collaboration generates profit.
The strategic collaboration between JD and Walmart serves as one of the exemplary cases reflecting these new findings. Following their strategic alliance, JD and Walmart have made continuous progress in their cooperation, integrating their respective strengths in the supply chain resources. This has led to a successful cost reduction in the overall supply chain operations and an increase in sales volume. The success of JD and Walmart’s collaboration can be attributed to their accurate assessment of the real environment and the rational implementation of their decisions. The conclusions drawn from our research can also provide assistance to other entities in terms of collaboration details (for example, how to determine the prices of shared logistics and wholesale prices, and how to determine the pricing and logistics efforts required for consumers after cooperation). This, in turn, paves a new path for the joint development of manufacturers, retailers, and e-commerce platforms in this era of the Internet. In the future, e-commerce platforms with excellent logistics capabilities, such as Suning and Amazon, can also engage in this type of collaboration with traditional retailers such as Costco and Yonghui Supermarket. Our research can provide a fresh perspective for their potential collaborations, such as determining the conditions for collaborations and emphasizing the concerns of manufacturers when engaging in such partnerships.
Our research could be extended in the following ways. First, future researchers can study the impacts of warehousing costs and wholesale price concessions on profits by considering the cost of product warehousing between the retailers and the wholesale price concessions given to the platform by the retailer. Here, warehousing costs can be a dynamic and changing factor, and the increase in warehousing volume of retail products after collaboration can affect this factor. The introduction of dynamic inventory and inventory costs in the context of the collaboration described in the paper provides effective optimization strategies for inventory management within the firms. Secondly, future researchers can expand the collaboration to the three firms rather than limiting it to the platform and the retailer, and the key factor is the sharing of logistics services. For instance, if the platform is willing to engage in price negotiations with the manufacturer using its shared logistics, how should the three entities balance the collaboration details? This can provide a framework for the manufacturer to consider joining the collaboration. Finally, future researchers can explore the impact of the collaboration on consumer utility from the perspective of consumers, so as to feed back into the demand and profit of firms. In this regard, the level of logistics efforts will be a primary factor influencing consumer utility. Such research can provide a more intuitive expansion of the discussion on consumer experience, addressing the gaps in the exploration of consumer perceptions in the current study.
Author Contributions
Conceptualization, B.D.; investigation, B.D. and X.Z.; writing—original draft preparation, B.D. and X.Z.; writing—review and editing, B.D. and S.Z.; methodology, B.D.; funding acquisition, B.D. All authors have read and agreed to the final version of the manuscript.
Funding
This work is supported by National Natural Science Foundation of China (71771128, 71402075, 72172069, 71502088), Fundamental Research Funds for the Provincial Universities of Zhejiang (SJWZ2021002, SJWY2021001), K.C.Wong Magna Fund in Ningbo University, and Special Fund for Innovative Open Experiment Project of Ningbo University.
Data Availability Statement
Not applicable.
Acknowledgments
We thank the editors and the anonymous reviewers of this manuscript for their careful work.
Conflicts of Interest
The authors declare no conflict of interest.
Appendix A. Proofs of All Theorems
Appendix A.1. Proof of Theorem 1
First, we find the reaction functions of the retailers by the Nash game. We can easily obtain the Hessian Matrix of retailer 1, .
Obviously, the first-order condition of the Hessian Matrix (i.e., ) is negative. The second-order condition of the Hessian Matrix (i.e., ) is positive, if the condition is satisfied. Then, we calculate the first-order partial derivative of and , respectively, and have the reaction functions of retailer 1 as follows: , .
Similarly, the Hessian Matrix of retailer 2 is .
Obviously, the first-order condition of the Hessian Matrix (i.e., ) is negative. The second-order condition of the Hessian Matrix (i.e., ) is positive, if the condition is satisfied. Then, we calculate the first-order partial derivative of and , respectively, and have the reaction functions of retailer 2 as follows: , . Combining the four reaction functions, and we obtain the solution of the Nash game between retailer 1 and retailer 2,
The solution of the Nash game is the reaction functions of the retailers to the manufacturer too. Then, we substitute the reaction function into the manufacturer’s profit function. We find the second derivative of the manufacturer’s price, that is, if the condition is satisfied.
Let , we can easily obtain the reaction function of the manufacturer. Then, we use a Stackelberg model to derive the optimal decisions of the manufacturer. After that, we substitute the optimal decision of the manufacturer into the retailers’ reaction functions and get the final optimal decision of the three firms which are listed in Table 2.
Appendix A.2. Proof of Theorem 2
The proof of Theorem 2 is similar to that of Theorem 1. First, we find the reaction functions of the retailers by the Nash game. We can easily get the Hessian Matrix of retailer 1, .
Obviously, the first principal minor of the Hessian Matrix (i.e., ) is negative. The second principal minor of the Hessian Matrix (i.e., ) is positive, if the condition is satisfied. Then, we calculate the first-order partial derivative of and , respectively, and have the reaction function of retailer 1 as follows: , .
The profit function of retailer 2 has just one decision variable, so we just calculate the secondary derivative of , which equals ; thus, retailer 2 has a maximum profit too. Then, we let and find the reaction function of retailer 2 as follows: .
According to the three reaction functions, we derive the optimal decisions under the Nash game,
Then, we find the second derivative of the manufacturer’s price, that is, , if the condition is satisfied.
Let , we can easily obtain the reaction function of the manufacturer. Then, we use a Stackelberg model to derive the optimal decision of the manufacturer. After that, we substitute the optimal decision of the manufacturer into the retailers’ reaction functions and obtain the final optimal decisions of the three firms which are listed in Table 3.
Appendix A.3. Proof of Theorem 4
First, we find the reaction functions of the retailers by the Nash game. We can easily obtain the Hessian Matrix of retailer 1, .
Obviously, the first-order condition of the Hessian Matrix is less than zero. The second-order condition of the Hessian Matrix () is greater than zero. Then, we calculate the first-order partial derivative of and , respectively, and have the reaction functions of retailer 1 as follows: , . The Hessian Matrix of retailer 2 is .
Obviously, the first-order condition of the Hessian Matrix (i.e., ) is negative. The second-order condition of the Hessian Matrix (i.e., ) is positive if the condition is satisfied. Then, we calculate the first-order partial derivative of and , respectively, and have the reaction functions of retailer 2 as follows: , . Combining the four reaction functions, we obtain the solution of the Nash game between retailer 1 and retailer 2,
The solution of the Nash game is the reaction functions of the retailers to the manufacturer too. Then, we substitute the reaction function into the manufacturer’s profit function. We find the second derivative of the manufacturer’s price, that is, . It is always less than zero.
Let , we can easily obtain the reaction function of the manufacturer. Then, we use a Stackelberg model to derive the optimal decision of the manufacturer. After that, we substitute the optimal decision of the manufacturer into the retailer’s reaction functions and obtain the final optimal decisions of the three firms which are listed in Table 6.
| 1 | See Diankeji’s JD and Walmart Announce Deep Strategic Cooperation available at http://www.diankeji.com/net/26790.html, accessed on 28 March 2023. |
References
- Yu, H.; Huang, M.; Chao, X.; Yue, X. Truthful multi-attribute multi-unit double auctions for B2B e-commerce logistics service transactions. Transp. Res. Part E Logist. Transp. Rev. 2022, 164, 102814. [Google Scholar] [CrossRef]
- Rath, S.B.; Basu, P.; Mandal, P.; Paul, S. Financing models for an online seller with performance risk in an E-commerce marketplace. Transp. Res. Part E Logist. Transp. Rev. 2021, 155, 102468. [Google Scholar] [CrossRef]
- Li, G.; Zheng, H.; Liu, M. Reselling or drop shipping: Strategic analysis of E-commerce dual-channel structures. Electron. Commer. Res. 2020, 20, 475–508. [Google Scholar] [CrossRef]
- Zhang, R.; Lu, Y.; Liu, B. Pricing Decisions and Game Analysis on Advanced Delivery and Cross-Channel Return in a Dual-Channel Supply Chain System. Systems 2023, 11, 155. [Google Scholar] [CrossRef]
- Li, D.; Liu, Y.; Fan, C.; Hu, J.; Chen, X. Logistics service strategies under different selling modes. Comput. Ind. Eng. 2021, 162, 107684. [Google Scholar] [CrossRef]
- Wei, J.; Chang, M. Are price matching and logistics service enhancement always effective strategies for improving profitability? Eur. J. Oper. Res. 2023, 307, 103–115. [Google Scholar] [CrossRef]
- Zhang, C.; Ma, H.M. Introduction of the marketplace channel under logistics service sharing in an e-commerce platform. Comput. Ind. Eng. 2022, 163, 107724. [Google Scholar] [CrossRef]
- Qin, X.; Liu, Z.; Tian, L. The strategic analysis of logistics service sharing in an e-commerce platform. Omega 2020, 92, 102153. [Google Scholar] [CrossRef]
- Ma, J.; Tian, Y.; Xu, T.; Koivumäki, T.; Xu, Y. Dynamic game study of multi-channel supply chain under cap-and-trade regulation. Chaos Solitons Fractals 2022, 160, 112131. [Google Scholar] [CrossRef]
- Guo, X.; Gao, K.; Wang, S. Share or not share: The optimal logistics service strategy in a dual-channel e-commerce supply chain. Electron. Commer. Res. 2022. [Google Scholar] [CrossRef]
- Niu, B.; Xie, F.; Chen, L.; Xu, X. Join logistics sharing alliance or not? Incentive analysis of competing E-commerce firms with promised-delivery-time. Int. J. Prod. Econ. 2020, 224, 107553. [Google Scholar] [CrossRef]
- Cao, E.; Wan, C.; Lai, M. Coordination of a supply chain with one manufacturer and multiple competing retailers under simultaneous demand and cost disruptions. Int. J. Prod. Econ. 2013, 141, 425–433. [Google Scholar] [CrossRef]
- Luo, Y.; Qiang, W.; Gou, X.; Dai, D.; Zhou, Y. Sharing Logistics Service Supply Chain with Revenue-Sharing vs. Cost-Sharing Contracts. Math. Probl. Eng. 2021, 2021, 9969937. [Google Scholar] [CrossRef]
- Vogel, J.; Paul, M. One firm, one product, two prices: Channel-based price differentiation and customer retention. J. Retail. Consum. Serv. 2015, 27, 126–139. [Google Scholar] [CrossRef]
- Liu, W.; Long, S.; Wei, S.; Xie, D.; Wang, J.; Liu, X. Smart logistics ecological cooperation with data sharing and platform empowerment: An examination with evolutionary game model. Int. J. Prod. Res. 2022, 60, 4295–4315. [Google Scholar] [CrossRef]
- Liu, C.; Xia, S.; Lang, C. Online Luxury Resale Platforms and Customer Experiences: A Text Mining Analysis of Online Reviews. Sustainability 2023, 15, 8137. [Google Scholar] [CrossRef]
- Zhang, Y.; Li, B.; Zhao, R. Resale or agency: Pricing strategy for advance selling in a supply chain considering consumers’ loss aversion. IMA J. Manag. Math. 2022, 33, 229–254. [Google Scholar] [CrossRef]
- Hsieh, C.C.; Chang, Y.L.; Wu, C.H. Competitive pricing and ordering decisions in a multiple-channel supply chain. Int. J. Prod. Econ. 2014, 154, 156–165. [Google Scholar] [CrossRef]
- Kaya, O.; Kubali, D.; Ormeci, L. A coordinated production and shipment model in a supply chain. Int. J. Prod. Econ. 2013, 143, 120–131. [Google Scholar] [CrossRef]
- Li, B.X.; Zhou, Y.W.; Li, J.Z.; Zhou, S.P. Contract choice game of supply chain competition at both manufacturer and retailer levels. Int. J. Prod. Econ. 2013, 143, 188–197. [Google Scholar] [CrossRef]
- Tian, Y.; Ma, J.; Xie, L.; Koivumäki, T.; Seppänen, V. Coordination and control of multi-channel supply chain driven by consumers’ channel preference and sales effort. Chaos Solitons Fractals 2020, 132, 109576. [Google Scholar] [CrossRef]
- Khorshidvand, B.; Soleimani, H.; Sibdari, S.; Seyyed Esfahani, M.M. Revenue management in a multi-level multi-channel supply chain considering pricing, greening, and advertising decisions. J. Retail. Consum. Serv. 2021, 59, 102425. [Google Scholar] [CrossRef]
- Zhang, C.; Tian, Y.X.; Han, M.H. Recycling mode selection and carbon emission reduction decisions for a multi-channel closed-loop supply chain of electric vehicle power battery under cap-and-trade policy. J. Clean. Prod. 2022, 375, 134060. [Google Scholar] [CrossRef]
- Vafaei, A.; Yaghoubi, S.; Tajik, J.; Barzinpour, F. Designing a sustainable multi-channel supply chain distribution network: A case study. J. Clean. Prod. 2020, 251, 119628. [Google Scholar] [CrossRef]
- Lin, G.; Xiong, X.; Li, Y.; Zhu, X. Sales Mode Selection Strategic Analysis for Manufacturers on E-Commerce Platforms under Multi-Channel Competition. Systems 2022, 10, 234. [Google Scholar] [CrossRef]
- Feng, X.; Moon, I.; Ryu, K. Warehouse capacity sharing via transshipment for an integrated two-echelon supply chain. Transp. Res. Part E-Logist. Transp. 2017, 104, 17–35. [Google Scholar] [CrossRef]
- Li, N.; Wang, Z. Inventory Control for Omnichannel Retailing Between One Warehouse and Multiple Stores. IEEE Trans. Eng. Manag. 2023, 1–18. [Google Scholar] [CrossRef]
- Huh, W.T.; Janakiraman, G. Inventory management with auctions and other sales channels: Optimality of (s, S) policies. Manag. Sci. 2008, 54, 139–150. [Google Scholar] [CrossRef] [Green Version]
- Vafaei, A.; Yaghoubi, S.; Tajik, J.; Barzinpour, F. Knowledge-sharing across supply chain actors in adopting Industry 4.0 technologies: An exploratory case study within the automotive industry. Technol. Forecast. Soc. Chang. 2023, 186, 122118. [Google Scholar]
- Zangiacomi, A.; Pessot, E.; Fornasiero, R.; Bertetti, M.; Sacco, M. Moving towards digitalization: A multiple case study in manufacturing. Prod. Plan. Control 2020, 31, 143–157. [Google Scholar] [CrossRef]
- Eslami, M.H.; Lakemond, N. Knowledge integration with customers in collaborative product development projects. J. Bus. Ind. Mark. 2016, 31, 889–900. [Google Scholar] [CrossRef]
- Achamrah, F.E.; Riane, F.; Aghezzaf, E.H. Bi-level programming for modelling inventory sharing in decentralized supply chains. Transp. Res. Procedia 2022, 62, 517–524. [Google Scholar] [CrossRef]
- Yan, X.; Zhao, H. Inventory sharing and coordination among n independent retailers. Eur. J. Oper. Res. 2015, 243, 576–587. [Google Scholar] [CrossRef]
- Sun, Z.; Xu, Q.; Liu, J. Pricing and replenishment decisions for seasonal and nonseasonal products in a shared supply chain. Int. J. Prod. Econ. 2021, 233, 108011. [Google Scholar] [CrossRef]
- Kutanoglu, E. Insights into inventory sharing in service parts logistics systems with time-based service levels. Comput. Ind. Eng. 2008, 54, 341–358. [Google Scholar] [CrossRef]
- Zhang, S.; Dan, B.; Zhou, M. After-sale service deployment and information sharing in a supply chain under demand uncertainty. Eur. J. Oper. Res. 2019, 279, 351–363. [Google Scholar] [CrossRef]
- Liu, C.; Lv, J.; Hou, P.; Lu, D. Disclosing products’ freshness level as a non-contractible quality: Optimal logistics service contracts in the fresh products supply chain. Eur. J. Oper. Res. 2022, 307, 1085–1102. [Google Scholar] [CrossRef]
- He, P.; Wen, J.; Ye, S.; Li, Z. Logistics service sharing and competition in a dual-channel e-commerce supply chain. Comput. Ind. Eng. 2020, 149, 106849. [Google Scholar] [CrossRef]
- Wu, R.; Geng, X.; Whinston, A.B. A generalized model of partial resale. Decis. Support Syst. 2012, 53, 108–117. [Google Scholar] [CrossRef]
- Zeng, Y.; Bai, X.; Wang, Y. How should resale platforms operate the customer-to-business-to-customer mode? Electron. Commer. Res. Appl. 2023, 58, 101251. [Google Scholar] [CrossRef]
- Pagnozzi, M.; Saral, K.J. Efficiency in auctions with (failed) resale. J. Econ. Behav. Organ. 2019, 159, 254–273. [Google Scholar] [CrossRef] [Green Version]
- Akyol, E. Can resale harm the original seller in a second-price auction? Econ. Lett. 2021, 203, 109845. [Google Scholar] [CrossRef]
- Tan, T.M.; Makkonen, H.; Kaur, P.; Salo, J. How do ethical consumers utilize sharing economy platforms as part of their sustainable resale behavior? The role of consumers’ green consumption values. Technol. Forecast. Soc. Chang. 2022, 176, 121432. [Google Scholar] [CrossRef]
- Perrigot, R.; Basset, G. Resale pricing in franchised stores: A franchisor perspective. J. Retail. Consum. Serv. 2018, 43, 209–217. [Google Scholar] [CrossRef]
- Li, Z.; Ho, Y.C.; Nan, G.; Li, M. Agency or resale: Effects of a platform-performance investment for frenemy platforms. Decis. Support Syst. 2019, 124, 113098. [Google Scholar] [CrossRef]
- Liu, H.; Zhao, Y. Research on Manufacturers’ Logistics Strategy Selection in the Context of E-Commerce. Systems 2023, 11, 324. [Google Scholar] [CrossRef]
- Kurata, H.; Yao, D.Q.; Liu, J.J. Pricing policies under direct vs. indirect channel competition and national vs. store brand competition. Eur. J. Oper. Res. 2007, 180, 262–281. [Google Scholar] [CrossRef]
- Jin, Y.; Wu, X.; Hu, Q. Interaction between channel strategy and store brand decisions. Eur. J. Oper. Res. 2017, 256, 911–923. [Google Scholar] [CrossRef]
- Liu, M.; Liang, K.; Perera, S.; Huang, R.; Ghose, S. Game theoretical analysis of service effort timing scheme strategies in dual-channel supply chains. Transp. Res. Part E Logist. Transp. Rev. 2022, 158, 102620. [Google Scholar] [CrossRef]
- Nair, A.; Narasimhan, R. Dynamics of competing with quality- and advertising-based goodwill. Eur. J. Oper. Res. 2006, 175, 462–474. [Google Scholar] [CrossRef]
- Yang, H.; Luo, J.; Zhang, Q. Supplier encroachment under nonlinear pricing with imperfect substitutes: Bargaining power versus revenue-sharing. Eur. J. Oper. Res. 2018, 267, 1089–1101. [Google Scholar] [CrossRef]
- Zhang, C.; Li, Y.; Ma, Y. Direct selling, agent selling, or dual-format selling: Electronic channel configuration considering channel competition and platform service. Comput. Ind. Eng. 2021, 157, 107368. [Google Scholar] [CrossRef]
Figure 1.
The price of 570 mL × 24 Genten mineral water in different channels on JD platform.
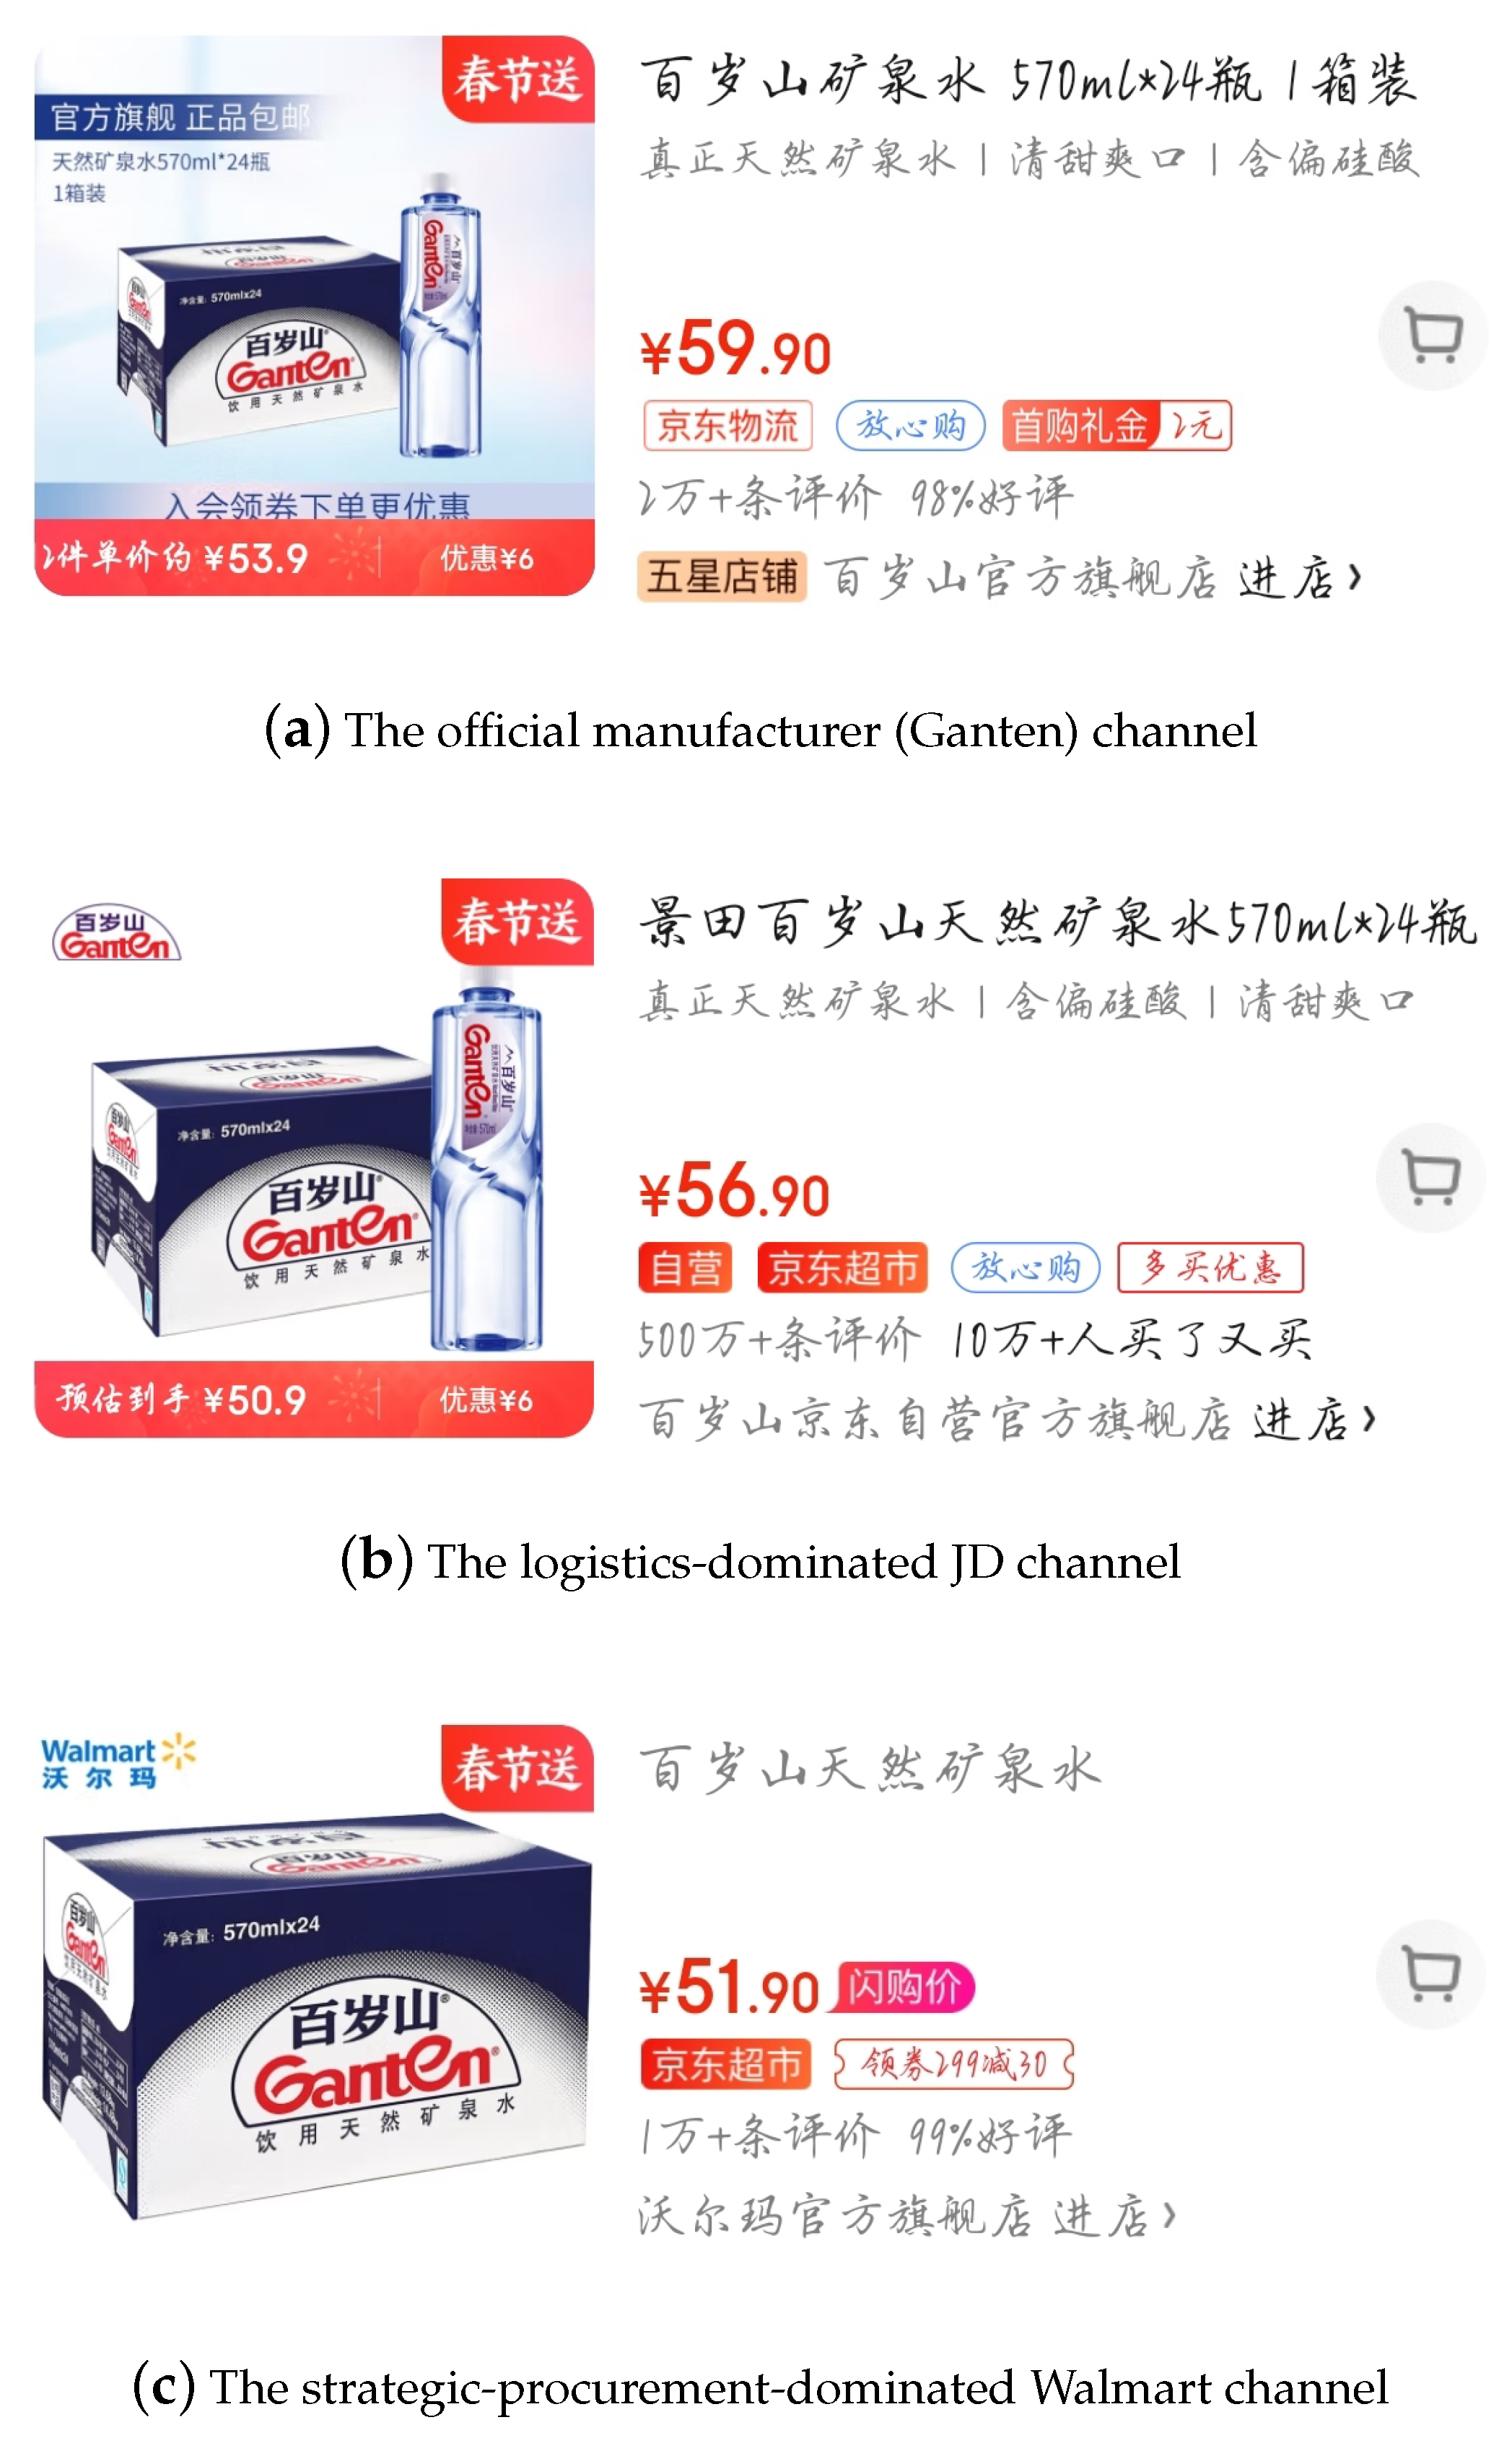
Figure 2.
Supply chain framework without collaboration.

Figure 3.
Sequence of events without collaboration.

Figure 4.
Supply chain framework with collaboration.

Figure 5.
Sequence of events with collaboration.

Figure 6.
The impact of on the optimal decisions in the case without collaboration: (a) price; (b) effort.
Figure 6.
The impact of on the optimal decisions in the case without collaboration: (a) price; (b) effort.

Figure 7.
The impact of and PSLS on optimal prices in the case with collaboration: (a) ; (b) ; (c) ; (d) .
Figure 7.
The impact of and PSLS on optimal prices in the case with collaboration: (a) ; (b) ; (c) ; (d) .

Figure 8.
The impact of and PSLS on optimal efforts in the case with collaboration: (a) ; (b) ; (c) ; (d) .
Figure 8.
The impact of and PSLS on optimal efforts in the case with collaboration: (a) ; (b) ; (c) ; (d) .

Figure 9.
Optimal decisions change with and .

Figure 10.
Profits change with and .

Figure 11.
Profits change with and .

Figure 12.
The influence of the collaboration coefficient on profits in the case with partial collaboration.
Figure 12.
The influence of the collaboration coefficient on profits in the case with partial collaboration.


Table 1.
Parameters and variables.
| Parameters | |
|---|---|
| Notations | Definition |
| Market potential for the three firms | |
| Price competition intensity between the three firms | |
| Consumers’ logistics sensitivity | |
| Cost of unit logistics service effort (CE) | |
| Manufacturer’s wholesale price to retailer 2, | |
| Retailer 2’s wholesale price to retailer 1 with collaboration | |
| Manufacturer’s wholesale price to retailer 1 without collaboration | |
| Price of shared logistics service per unit of product (PSLS) | |
| Collaboration coefficient which reflects the collaboration degree | |
| Decision Variables | |
| Selling price for products to consumers, ; | |
| Logistics service effort, ; | |
| Other Variables | |
| Demand of one channel, ; | |
| Profit of one channel, ; | |
| Superscript | |
| O | Symbol indicating the case with collaboration |
| N | Symbol indicating the case without collaboration |
| Subscript | |
| m | Symbol indicating the manufacturer |
| The retailer who provides logistics service sharing in the case with collaboration | |
| The retailer who provides product redistribution in the case with collaboration |
Table 2.
The optimal decisions and equilibrium values without collaboration.
| Opt. | Equilibrium Values |
|---|---|
Table 3.
The optimal decisions and equilibrium values with collaboration.
| Opt. | Equilibrium Values |
|---|---|
Table 4.
Summary of the values of the parameters.
| Parameters | Values |
|---|---|
| 100 | |
| 5 | |
| 4 | |
| 5 | |
| 6 | |
| 8 | |
| 4 |
Table 5.
Quantitative results of changes of the optimal decisions and profits.
| 0.1 | 0.3 | 31.59 | −0.15 | 0.32 | 0.02 | −327.29 | 145.118 | 6663.28 |
| 0.1 | 2 | 32.56 | 0.11 | 2.5 | 2.93 | −282.75 | 372.54 | 6943.51 |
| 0.2 | 2 | 43.49 | 0.31 | 3.17 | 3.53 | −286.69 | 531.758 | 10,807.7 |
| 0.3 | 2 | 65.31 | 4.47 | 4.17 | 0.75 | −240.20 | 881.88 | 20,071.1 |
| 0.4 | 0.2 | 128.35 | −1.94 | −0.96 | −1.16 | −941.67 | −13.92 | 55,592.9 |
| 0.4 | 4 | 133.10 | 6.61 | 14.24 | 14.99 | 1193.16 | 4608.76 | 63,984.4 |
| 0.4 | 8 | 138.10 | 15.61 | 30.24 | 31.99 | 3514.86 | 9635.42 | 73,147.2 |
Table 6.
Optimal decisions and equilibrium values with partial collaboration.
| Optimal Decisions | Equilibrium Values |
|---|---|
Disclaimer/Publisher’s Note: The statements, opinions and data contained in all publications are solely those of the individual author(s) and contributor(s) and not of MDPI and/or the editor(s). MDPI and/or the editor(s) disclaim responsibility for any injury to people or property resulting from any ideas, methods, instructions or products referred to in the content. |
© 2023 by the authors. Licensee MDPI, Basel, Switzerland. This article is an open access article distributed under the terms and conditions of the Creative Commons Attribution (CC BY) license (https://creativecommons.org/licenses/by/4.0/).
Share and Cite
MDPI and ACS Style
Zhang, X.; Zhang, S.; Du, B. To Compete or to Collaborate? Logistics Service Sharing and Retailers’ Resale in Competitive Online Channels. Systems 2023, 11, 358. https://doi.org/10.3390/systems11070358
AMA Style
Zhang X, Zhang S, Du B. To Compete or to Collaborate? Logistics Service Sharing and Retailers’ Resale in Competitive Online Channels. Systems. 2023; 11(7):358. https://doi.org/10.3390/systems11070358
Chicago/Turabian StyleZhang, Xi, Shengping Zhang, and Bisheng Du. 2023. "To Compete or to Collaborate? Logistics Service Sharing and Retailers’ Resale in Competitive Online Channels" Systems 11, no. 7: 358. https://doi.org/10.3390/systems11070358
Note that from the first issue of 2016, this journal uses article numbers instead of page numbers. See further details here.