Abstract
We detail a case study using a participatory modeling approach in the development and use of discrete-event simulations to identify intervention strategies aimed at reducing emergency department (ED) wait times in a Canadian health policy setting. A four-stage participatory modeling approach specifically adapted to the local policy environment was developed to engage stakeholders throughout the modeling processes. The participatory approach enabled a provincial team to engage a broad range of stakeholders to examine and identify the causes and solutions to lengthy ED wait times in the studied hospitals from a whole-system perspective. Each stage of the approach was demonstrated through its application in the case study. A novel and key feature of the participatory modeling approach was the development and use of a multi-criteria framework to identify and prioritize interventions to reduce ED wait times. We conclude with a discussion on lessons learned, which provide insights into future development and applications of participatory modeling methods to facilitate policy development and build multi-stakeholder consensus.
1. Introduction
Evidence-based decision making is the foundation for health policymaking and health service planning. There remain many practical challenges to integrating the results of research to identify evidence-based interventions to implement in a given context, especially in the face of the uncertainty and complexity that characterize many healthcare delivery systems. Although research presents a multitude of acceptable evidence-based options, it is difficult to determine which interventions will have the greatest impact given the heterogeneity in the population and the health-service delivery system. Complex or uncertain disease epidemiology, including multimorbidity, can introduce additional challenges to decision making. In addition, a large number of stakeholders with differing perspectives and competing priorities are typically involved in the decision-making processes. Failure to achieve consensus among these stakeholders can hinder the effective implementation of interventions [,,].
As a result of these challenges and the increasing availability of advanced computer technology, there has been a growing interest in using modeling and simulation techniques to assist in the decision-making process in the health sector [,]. The design and development of health services would benefit from using these techniques to systematically integrate diverse evidence sources into a computer model and validate the underlying causal mechanisms that drive complex healthcare problems. More importantly, these models allow assessment and comparison of the effects of proposed changes or resource configurations in service design through “what-if” scenarios, providing insights on potential impacts in a cost-effective and timely manner compared to real-world trials. A number of simulation studies have successfully applied computer modeling methods to inform strategic planning and health policy-making for stroke care improvement, alcohol-related harm reduction, cardiovascular disease interventions, and managing diabetes in pregnancy [,,,].
Despite this growing interest and an increasing number of simulation studies in health-related fields, serious and widespread application of systems modeling and simulation remains lacking in informing health-policy development [,,,,,]. Low stakeholder engagement is a major factor that hinders the translation of model findings into evidence-based policy and practice [,,]. Recent studies in the context of healthcare found that relatively few simulation models addressed the needs of policymakers, and models were often constructed without the involvement of health-system managers or policymakers (who are considered the ‘end users’) in the research process [,,,]. Many factors contributed to the “implementation gap” between model findings and serious application in the health field; for instance, the communication gap between research and stakeholder groups [], the lack of involvement of researchers when important policy decisions are made [], and the trust issues throughout different modeling stages that involve interactions between the model, the modeler, and the stakeholders []. Harper et al. proposed a trust model and discussed different aspects of trust building in the life cycle of a simulation study [].
Successful development of health interventions or policies depends on stakeholder support for the proposed improvements or actions. There is a growing recognition of the value of using a participatory modeling approach in simulation studies to bridge the communication gap and enable collaboration between stakeholders and modelers in building the simulation models [,,]. The participatory modeling (also referred to as collaborative modeling, participative modeling, or facilitated modeling) approaches involve the joint creation of a computer model that reproduces a shared representation of the system in silico with the end users, stakeholders, and experts to facilitate collaborative learning, build consensus, and inform the group’s decision making []. In these approaches, expert modelers directly collaborate with a team of end users or stakeholders throughout the whole simulation study life cycle, as opposed to the traditional approaches where the modelers conduct the simulation studies independently and only present the findings to the stakeholders []. A participatory approach to simulation modeling helps strengthen relationships and improve knowledge translation when designing health services and policies for complex problems [].
This case study describes modeling ED and acute care patient flow using a four-stage participatory modeling approach with discrete-event simulation (DES) in a Canadian health-policy setting. The paper complements the literature by reporting on the use of a participatory approach in developing DES models of patient flow in the emergency department (ED) to inform the design and planning of effective wait time reduction strategies from a whole-system perspective. The DES models, built in collaboration with a multidisciplinary group of stakeholders, served as a decision-support tool that integrated existing data, research evidence, expert knowledge, and local context to assess the potential impact of different intervention scenarios.
The modeling findings have been utilized to inform policy development and subsequent actions. We detailed our DES model’s structure and major quantitative results in previous work []; discussions on major simulation findings can be found therein. In the current study, we provide methodological details of the participatory approach used in model development and model use with stakeholders. We focus here on describing the following key aspects of the participatory modeling process:
- building trust in the modeling approach and seeking buy-in from the project leads for further development during the project initialization;
- leveraging existing conceptual mapping tools used in the health system for conceptual modeling;
- using co-production methods to build trust in the model and its outputs;
- identify and prioritize intervention scenarios using a multi-criteria framework.
We then discuss lessons learned and implications for adopting the participatory modeling approach in the health-policy setting.
2. Brief Review of Participatory Modeling Approaches
2.1. Motivation
In the past two decades, there has been little improvement in translating simulation findings into policy and practice [,,,,,,,], with communication gaps and a lack of understanding of policymakers’ needs contributing to the underutilization of model findings in healthcare decision making [,]. There is a rising awareness that more needs to be done to ensure that research results in better knowledge translation and improved health services and patient outcomes. Engaging stakeholders in research has been highlighted as a possible mechanism to increase the value, use, and relevance of research []. Scholars have called for collaborative engagement with health professionals, managers, decision makers, and patient representatives in simulation studies to increase the likelihood of successful implementation of simulation outputs [,,,]. In addition, a range of programs were established to support stakeholder engagement in health research, such as the development of the US Patient-Centered Outcomes Research Institute and knowledge translation activities in Canada [].
Participatory modeling approaches have been proposed as one way for engaging stakeholders and improving stakeholders’ knowledge and understanding of a system and its dynamics under a variety of conditions in order to support shared learning or the decision-making process [,,,,,]. It also increases trust in and use of scientific information in decision making []. It is a deliberate learning process that involves a diverse range of modeling activities that draw on stakeholders’ knowledge to develop a shared and formalized understanding and representation of the reality or system [,]. In a participatory modeling process, stakeholders can be involved in one or more modeling stages with different levels of engagement, ranging from passive participation (e.g., being merely informed about model findings) to active participation where stakeholders might contribute to problem identification, data collection, model design, and model use [,].
2.2. Applied Fields and Purpose
Participatory approaches to modeling have gained recognition in a number of sectors, including natural resource management (e.g., water management) [,], environmental planning [,], and health research and policy [,,,,]. Voinov et al. reviewed participatory modeling studies in resource management and environmental planning that involved multiple sectors and stakeholders []. There has been an increase in the popularity of participatory modeling in recent years, as evidenced by the rising number of papers published on the topic [,]. The authors presented different components for stakeholder participation within the development of specific environmental models and summarized tools and methods for participatory modeling in different modeling stages [,]. Participatory modeling approaches are also being used in public health and health services research. Freebairn et al. described the novel use of participatory simulation modeling combined with system science methodology in informing health policies through three case studies aimed at reducing alcohol-related harms, childhood obesity, and diabetes in pregnancy in real-world policy settings in Australia [,]. The authors published a series of papers on these case studies that provided valuable lessons, detailed procedures, and concrete guidance in using participatory dynamic simulation modeling methods in health policy settings, such as integrating knowledge translation and mobilization into participatory processes, converting conceptual system maps into a dynamic simulation, and building consensus with stakeholders for policy actions [,,,]. Frerichs et al. and Gerritsen et al. discussed and showcased the potential of using community-based participatory modeling approaches in public health and health equity research [,].
Depending on the form of participatory modeling approach used, participatory modeling processes may serve somewhat different purposes. Most participatory modeling projects focused on developing a collective understanding of the issues among the participants, and the model was viewed as a tool to support shared learning or community-based learning; while others engaged stakeholders to inform policy-making or mobilize actions [,,,,,,,]. Using the participatory modeling approach was found to have several benefits, including providing a better evidence base for policy decisions, improving the quality of the research, and increasing the dissemination and implementation of interventions [,,]. A number of tools and methods can be employed to facilitate stakeholder engagement in participatory modeling processes. Voinov et al. provided a systematic overview and assessment of various participatory modeling methods and discussed their strengths and weaknesses []. The authors proposed a typology of methods used in participatory modeling with illustrated workflows and provided practical guidance for method selection. Depending on the modeling stage, either qualitative (e.g., rich pictures or causal loop diagrams) or quantitative methods (e.g., agent-based modeling or system dynamics) could be utilized.
2.3. Specific Participatory Modeling Approaches and Tools
2.3.1. Soft Operation Research Methodology
Soft Systems Methodology (SSM) is a broader participatory modeling methodology that emphasizes the use of rich picture tools to learn about a problem situation and start exploratory discussions with people []. It also embraces the systems perspective to explore problematic situations with relevant stakeholders. SSM used a sequence of steps from problem finding and rich picture building to solution identification and action mobilization [,]. It has been used as a problem structuring approach in a number of sectors (e.g., strategic planning and policy development concerning agriculture) [], but its application in the healthcare setting is limited []. There are other “soft” problem structuring methods used for studying complex and unstructured problems involving multiple stakeholders with diverse perspectives, such as strategic options development and analysis, and hierarchical process modeling [,].
2.3.2. Group Model Building
Group model building (GMB) refers to a set of techniques used to engage client groups directly in the process of problem finding, model construction, and use through facilitated workshops or sessions [,,]. Group model building has matured as a field, specifically as a community-based participatory approach for social learning or the development of system dynamics (SD) models [,,,,,]. Depending on the type of problem, the end product often results in either qualitative models (causal loop diagrams) or quantitative models (such as SD models).
2.3.3. PartiSim Framework for DES
Tako and Kotiadis developed a facilitated modeling approach named PartiSim [,,,]. PartiSim (short for participative simulation) is a multi-methodology framework that integrates DES with SSM. The PartiSim framework integrates stakeholder input and facilitation as part of the process of conducting DES studies. The framework is divided into six primary stages in the simulation study life cycle, each with its own set of activities, deliverables, and tools to help the modeling team engage stakeholder participation in the study. The authors employed the PartiSim framework while collaborating with healthcare organizations on a variety of operational issues in healthcare settings []. The authors reflected on practical challenges encountered in facilitating the conceptual modeling process, particularly panel composition and team roles in handling conflicts and promoting involvement among stakeholder teams and modeling teams []. The authors also discussed and reported on the post-model coding step, specifically scenario development and experiments []. The authors achieved success in implementing model findings in an obesity service to improve patient waiting times [].
2.3.4. Other Participatory Modeling Approaches Used in Case Studies
Unlike the formal frameworks or methodologies introduced above, several studies reported the use of participatory modeling through case studies [,,,,]. These studies elaborated on the rationale and procedure of the participatory modeling approach used [], integration of rapid review with participatory modeling processes for knowledge mobilization [], the conversion of conceptual mapping into a quantitative simulation model [], and decision makers’ experience in the participatory modeling processes [].
2.3.5. Participatory Modeling Tools
Participatory modeling can be used in either qualitative or quantitative modeling. For qualitative modeling, a number of tools can be used at different modeling stages or combined with more general frameworks or methodologies such as SSM, GMB, or PartiSim. Diagramming or graphical tools, such as rich pictures (as a part of the SSM), causal loop diagrams, and cognitive (or conceptual) mapping, were often used in participatory modeling to generate visual representations of the components of the problems [,]. These qualitative maps or diagrams are utilized for collaborative exploration and group understanding of a complex issue by representing diverse relationships among many interacting components, illustrating how changes in one area affect other factors, and drawing the feedback loops that are assumed to explain the dynamic behaviors [,]. Unlike participatory modeling approaches for qualitative modeling, which are primarily concerned with fostering trust and understanding among stakeholders, participatory modeling approaches in quantitative modeling are more focused on “solving” a specific problem and frequently produce forecasts or quantitative estimates []. Participatory modeling can be embedded in the development and use of SD, DES [], and agent-based models (ABM) [].
2.4. Hybrid Modeling and Simulation
With new developments in the simulation tools and the rising complexity of the studied systems and decision-making needs, a growing number of studies in the field of modeling and simulation (M&S) have embraced a hybrid approach [,,]. This involves combining multiple simulation techniques (e.g., in the form of mixing SD, DES, and ABM) or integrating hard or soft operation research (OR) methods in one or more stages of a simulation study (e.g., combining SSM with DES) [,,]. The adoption of hybrid approaches becomes increasingly appealing, especially from a practical standpoint, as hybrid approaches can overcome some limitations of using any single M&S technique and complement each other [,]. This approach can further facilitate the nimble evolution of model scope and formulation in light of the growing understanding of the system and changing policy evaluation needs and context. One of the main areas of application of hybrid M&S was found to be healthcare []. A combination of multiple simulation techniques (e.g., SD, ABM, DES, and social network analysis) has been employed to investigate a range of complex health-related issues and systems, such as disease prevention and care management [,,,], projection of disease burden [], health workforce dynamics [], and immunoepidemiology of infectious diseases []. Reflecting the diversity in the mixing of different methods in simulation studies, Mustafee et al. presented a conceptual classification of hybrid M&S and discussed innovation in the M&S field by highlighting hybrid modeling [,,]. Unlike hybrid simulation, which combines two or more simulation techniques (e.g., SD, DES, or ABM) primarily in the model implementation stage of a simulation study, hybrid modeling extends hybrid simulation by emphasizing the combined application of simulation techniques together with theories, frameworks, methods, or tools in the broader OR domain or from other disciplines in stages of the modeling process of a simulation study beyond implementation [,,]. Hybrid modeling can involve the synthesis of a qualitative soft OR technique (such as SSM or a participatory approach) with a simulation technique []. For instance, McDonald et al. used a community-engaged collaborative modeling approach to co-create an ABM with the indigenous community to better understand the water services []. Jiang et al. combined the use of causal loop diagrams in the conceptual modeling stage with ABM to study breastfeeding interventions []. Other forms of hybrid modeling include the co-application of simulation techniques with cross-disciplinary methods from other fields or domains []. Tian et al. proposed a hybrid approach by linking multiple techniques with an SD model to investigate stroke prevention and care []. Kreuger et al. discussed the combined use of agile design in software engineering with hybrid simulation design and use []. Hybrid modeling stands at the forefront of fostering innovations in both the theoretical and practical aspects of M&S, especially in light of new developments in conceptual modeling to better understand and depict studied systems [], and in stakeholder engagement to capture domain knowledge from diverse stakeholders and build trust in simulation models [,].
3. Case Study Context
3.1. The Problem of Emergency Department Crowding and Wait Times
ED crowding, often reflected in lengthy wait times for emergency care, is a worldwide healthcare delivery issue that negatively affects patient safety, experience, and clinical outcomes, such as increased mortality rates and worse patient satisfaction [,,,,]. The causes of ED crowding and lengthy ED wait times are multi-factorial and complex [,]. Among 11 developed nations, Canadians reported the longest ED waits [,]. Lengthy ED wait times are a major concern for Canadians [], and several Canadian provinces have launched initiatives to address the ED crowding and patient wait times []. The government of Saskatchewan challenged the health system to tackle the waiting time problem in EDs []. In response to the challenges of improving timely access to emergency care, the Saskatchewan ED Waits and Patient Flow Initiative was launched to address ED wait times. The provincial initiative was charged with developing and implementing ED wait time reduction strategies provincially []. Given the complex nature of the issue, limited resources for allocation, and an extensive set of evidence-based options from both the literature and expert opinions, it is challenging to quantify the impact of each plausible contributing factor. It is also costly to pilot each evidence-based intervention individually or collectively for the studied EDs. Ideally, we would desire a safe and cost-effective approach to understand the causes and examine the likely consequences of proposed changes in advance. With the dual objectives of identifying the causes of lengthy ED wait times and comparing potential solutions to allocate limited resources, this study investigated the ED patient flow in six Saskatchewan hospitals. At the time of the research, the six hospitals were located in three health regions, which collectively served 63% of the Saskatchewan population.
3.2. Whole-System ED Patient Flow Modeling
There is a significant amount of literature on using simulation, particularly DES, to study ED crowding, streamline ED patient flow, and reduce wait times [,,,,,]. However, most of these ED simulation studies have high unit specificity with a focus only on care processes in a single ED [,,]. Only a few studies investigated ED crowding or wait times as part of a larger system, such as a whole hospital or complete acute care system [,,]. There has been limited improvement in multi-facility and whole-system modeling in the area of ED simulation studies that utilize DES [,,,].
Despite the broad agreement that the ED problem largely requires system-wide solutions and that solutions within the ED alone are insufficient, there remains a lack of whole-system multifacility modeling, as documented in the ED literature. Empirical evidence suggests that ED performance depends on adjoining systems, such as acute care, primary care, and sub-acute care to function efficiently [,,,,]. Jun et al. concluded that future simulation results on ED crowding or wait times need to depict the interaction of major service departments and support services in a hospital to gain insights from analyzing the system as a whole, rather than in a unit-specific piecemeal fashion []. Gunal et al. argued that unit-specific and facility-specific ED simulation studies, which ignore the subtle linkages between the ED and other units or services within the hospital, might oversimplify the complexity of hospital activities within a simulation model and overlook side effects and unintended consequences []. Zhang echoed that healthcare management would benefit from DES models, which capture the intricate interactions of healthcare services rather than just limiting them to single units []. Salmon et al. also found high unit specificity among ED simulation studies, thus calling for the examination of system influences beyond the ED itself to better understand emergency department operations from a whole-system perspective [].
This paper complements the literature by demonstrating how multi-facility whole-system DES models of patient flow can be used to design policies to improve ED patient flow and reduce wait times. Notably, the study embraced the systems view and studied ED wait times as a part of a larger integrated acute care system with multiple interacting subsystems or units.
4. Materials and Methods
4.1. Overview
This study described a participatory modeling approach for embedding stakeholder engagement in the development and use of DES models to support effective and coordinated policy development to reduce ED wait times. The participatory modeling approach used in this study drew on several existing frameworks for working with groups [,,] and was adapted to the local context. The approach was applied through collaboration between the Saskatchewan ED Waits and Patient Flow Initiative, Saskatchewan Ministry of Health, regional health authorities, Saskatchewan Health Quality Council, clinicians, health professionals, researchers, and health policy planners. The study was exempted by the University of Saskatchewan Research Ethics Board.
The participatory modeling approach used in this study can be broken down into four major stages: (1) project initialization; (2) conceptual modeling; (3) model implementation; and (4) model use and policy co-development. Figure 1 illustrates the overall participatory modeling process with a detailed visualization of the model use and policy co-development stage.
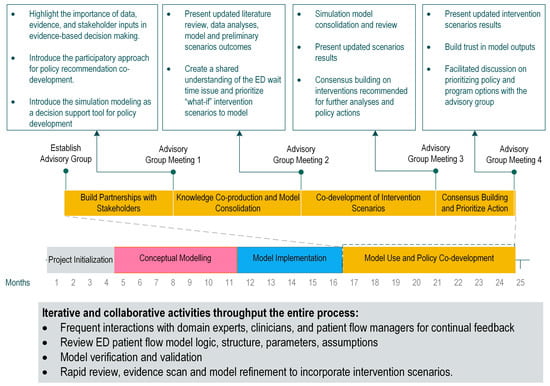
Figure 1.
Participatory modeling process.
4.2. Stage 1: Project Initialization
The initialization phase assembled the project team, defined the purpose and scope, and assessed the feasibility of using computational modeling to understand ED patient flow and inform the policy development process. The primary objective of this phase was to seek initial buy-in from the project lead (GF) and physician leads (JB and JS) of the ED Waits and Patient Flow Initiative. The goal was to help them recognize the value of computer simulation models as decision-support tools for addressing the ED patient flow challenges with a broader group of regional and provincial stakeholders. To achieve this, a proof-of-concept analysis was carried out to demonstrate the ability of computational models to simulate ED patient flow, synthesize evidence, data, and expert opinions, and allow for the evaluation and comparison of alternative wait time reduction strategies via virtual experiments.
Team Composition
The modeling project team was led by a project lead (GF) who was primarily responsible for managing the project, overseeing model development, and communicating with important stakeholders, including regional leaders and policy partners. The domain experts on the team included ED physicians, a geriatrician, family physicians, clinical experts, patient flow managers, and quality improvement consultants. These experts provided information about the current patient flow situation in the studied EDs and hospitals and offered clinical guidance for model development and use. Two key physician leads (JB and JS) shared duties with the project lead and jointly facilitated modeling meetings and stakeholder communication. One of the domain experts (JB), who was a geriatrician, also served as the project champion. Two technical advisors (NO) oversaw high-level model conceptualization and development to ensure that the model was suitably scoped, rigorously validated, and could be delivered within a policy-friendly time frame. The lead modeler and researcher (YT) was responsible for designing the participatory modeling process with the project leads and technical advisors, managing data requirements, synthesizing evidence for model conceptualization, building and validating simulation models, developing intervention scenarios with stakeholders, and conducting simulation runs. Another modeler served as an intern for five months during the project’s initialization phase to assess the feasibility of using computational modeling to inform decision making through proof-of-concept analysis. Two quality improvement consultants (AD and PF) helped facilitate meetings with stakeholders.
4.3. Stage 2: Conceptual Modeling
The first step of the study was to understand the existing ED waits situation by getting an overview of the entire ED patient flow and care processes in the studied EDs and hospitals. Conceptual modeling refers to a series of activities for abstracting a qualitative model from the problem situation and the real system with relevant domain experts and stakeholders [,]. The conceptual modeling process in the present study was inspired by elements from existing conceptual modeling frameworks [,] and comprised three key activities for knowledge discovery and information elicitation: (1) conceptualizing the problem, specifically the causes of ED wait times, and identifying a preliminary set of experimental factors (model inputs that can be changed); (2) understanding the data and care processes in the studied EDs and hospitals; and (3) defining the scope and boundaries of the model. The sequence of these activities was not linear, and they were pursued in a highly iterative fashion. We used tools that were borrowed or adapted from qualitative improvement toolkits [] and lean management techniques []. Prior to the formation of the modeling team, the provincial initiative’s working groups had conducted initial conceptual mapping of the ED wait time issue. Rather than introducing new conceptual mapping tools, the modeling team opted to review and enhance the previous work to generate new insights and foster a more comprehensive understanding of the problem situation.
Problem conceptualization started with a qualitative representation of the factors contributing to the ED wait times. A comprehensive literature review was conducted at this stage to identify important contributing factors to ED wait times. The modeling team also consulted with a wide range of domain experts and regional stakeholders through informal meetings and onsite visits to acquire knowledge about the studied sites. The perspectives of stakeholders and relevant domain experts were both crucial at this stage, as they assisted the modeler in better understanding the contextual factors in the studied EDs. A driver diagram was developed to depict the causes that could influence ED wait times from multiple perspectives. A driver diagram is a quality improvement tool used to illustrate a project team’s understanding of the factors that contribute to the project objective []. It displays key areas (primary and secondary drivers) to influence in order to achieve the aim of an improvement project when tackling a complex problem.
To understand the data and care processes in the studied EDs and hospitals, the modeling team worked with process improvement consultants, patient flow managers, regional stakeholders, and patients and family advisors through rapid process improvement workshops to develop value stream maps (VSMs) of the current state of ED patient flow. VSM is a lean management technique that uses a flowchart to draw the current (and future) state of a specific process (or service), with the goal of identifying waste, reducing process time, and improving the flow []. At the time of this research, many lean tools were already in use as part of the lean implementation in the province’s healthcare system []. Rather than re-inventing the wheel, the modeling team leveraged these existing conceptual mapping tools and instead focused on understanding and refining the VSMs. The modeling team met with process improvement consultants and individuals who have expertise in patient flow management in the studied hospitals and conducted onsite visits. The VSMs of ED and acute patient flow illustrated the major steps in the patient’s journey from registration to discharge. They also mapped the ED activities (both necessary and non-value-added activities), current care processes, and lead times from the whole-system perspective. Additionally, input data for the model was analyzed using administrative databases based on the driver diagram and VSMs.
In the subsequent stage of the process, the model scope and level of detail were discussed and defined. The primary outcome of the study was the wait time in EDs, which made DES an appropriate choice for the modeling approach as it is well-suited for modeling queuing systems with constraints. The modeler, technical advisors, and project champion collaboratively defined major components (entities, attributes, activities, and resources) to be included in the DES models. Furthermore, assumptions and simplifications were made with input from domain experts and technical advisors.
4.4. Stage 3: Model Implementation
4.4.1. Turning Conceptual Modeling into DES Models
To operationalize the conceptual model as a computational model, the modeler worked with patient flow managers, clinical experts, and quality improvement consultants to identify critical components (e.g., units), interactions, and patient cohorts to be captured in the first iteration of the development of DES models. This was an iterative process throughout the project cycle that involved reviewing evidence and the conceptual models, analyzing administrative databases, and ongoing consultation with clinical experts to determine important processes and agents to be represented in the DES models.
In the early phase of the model development, to communicate and consult with clinical and domain experts on model logic, we added 3D visualization of the floor plan of the studied EDs to showcase the patient movement in the simulation. We conducted face validation and external validation to maintain the credibility of the model. Multiple patient cohorts (e.g., ED visits for family practice sensitive conditions, hospitalization for ambulatory care sensitive conditions, etc.) were identified in the conceptual modeling stage. We extracted these patients cohorts from administrative databases, analyzed their use of ED and acute care services, and characterized them in the DES models.
4.4.2. Capacity Building and Health System Modeling Workshop
Most project stakeholders knew very little about computational modeling and its use in healthcare. Their participation and involvement in the project were largely driven by the priority of the issue and their trusted relationship with the lead domain experts and the provincial initiative. However, many stakeholders were curious about modeling methods. A 4-day health system modeling workshop, led by the modeling team, was hosted by the Saskatchewan Health Quality Council and the provincial initiative. Thirty-five participants (including several provincial leaders) from Saskatchewan health regions, health organizations, and the Ministry of Health participated in this modeling workshop on computational modeling and system thinking in healthcare []. Several participants were data content experts and had worked with the modeling team on parameterizing the simulation models of patient flow for the hospitals studied. The modeling team also presented the initial DES models of patient flow to the participants.
4.5. Stage 4: Model Use and Policy Co-Development
After completing the initial model development and validation, the project moved to the model use and policy co-development stage. We formed an advisory group that included stakeholders from three health regions and ministry departments within the healthcare system. To work towards shared goals and aligned actions to reduce ED wait times, we invited the advisory group to participate in four facilitated advisory group meetings to co-develop intervention solutions for implementation to reduce ED wait times in the studied EDs. We highlighted the use of simulation models for integrating data, evidence, and stakeholder inputs to support evidence-informed policy development.
The advisory group was formed by the provincial initiative. The advisory group included all relevant senior stakeholders from the Ministry of Health branches, executive leaders from three regional health authorities, physician leads and clinical experts, researchers, and patient advisors. Figure 1 illustrates the major activities that involve interaction and engagement with stakeholders in the model use and policy co-development process. It also highlights four major advisory group meetings with the engagement of the full panel of the advisory group during this process. The first meeting introduced the use of simulation models for policy co-development with stakeholders. The second meeting reviewed the preliminary scenario results and discussed creating additional intervention scenarios based on stakeholders’ assessments of their regional priorities, readiness, and drivers for lengthy ED wait times in the studied EDs. The last two meetings were centered around discussing the model results and reaching an agreement on recommended interventions for further analyses and the eventual development of a business case for implementation.
4.5.1. The First Meeting
The first advisory group meeting introduced the use of simulation models for policy co-development. The meeting emphasized the participatory approach being undertaken to support evidence-informed policy development with the active engagement of the advisory group. We presented our data analyses on a number of patient groups that were identified as potentially contributing to the problem of lengthy ED wait times. Then we summarized our literature review and environmental scan on two topics: (1) what interventions had been tried, what worked, and what did not work; and (2) promising practices from other jurisdictions and lessons learned from other organizations experiencing similar ED crowding or flow issues. Finally, we proposed the use of simulation models as a decision-support tool to synthesize data, evidence, and input from the advisor group to explore and compare the impact of proposed interventions. The modeling team also described the collaborative model development and model validation activities with patient flow managers, physicians, and data analysts. The advisory group agreed with using the participatory modeling approach to develop policy recommendations for the budgeting cycle.
After the first meeting, the modeling team started to conduct simulation runs of interventions that emerged from evidence and data. In addition, key contacts were identified for the three health regions where the six studied hospitals were situated. Engagement with regional and smaller stakeholder groups also occurred after the first meeting. We held multiple regional advisory group meetings with leaders of specific regional health authorities to gather information about hospitals studied in their region, their local contexts, data sources, interventions of interest, readiness, and priorities. Specifically, a multi-criteria prioritization framework for scenario development was designed and used with the regional leads (seen in Figure 2 and Table 1). The modeling team distributed this framework to key contacts in each health region before the second meeting. The key contact (a senior regional leader) discussed with managers and directors in their region about what interventions they would like to explore via simulation modeling to reduce ED wait times given their current state and local challenges. We also instructed them to review and assess each proposed intervention using the criteria in the framework. We then gathered an initial list of intervention scenarios that each region would like to explore using the models.
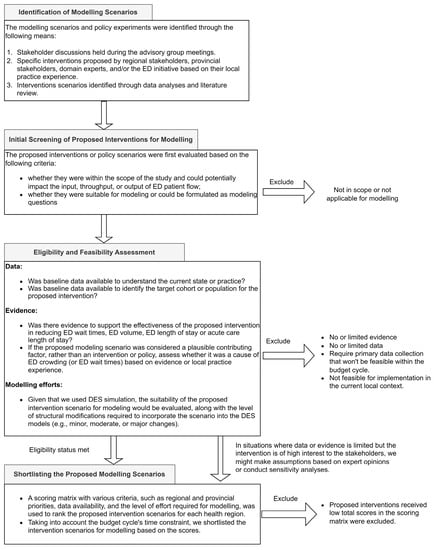
Figure 2.
The intake process for modeling scenarios.

Table 1.
Scoring Matrix. Criteria used for prioritizing requested modeling scenarios.
4.5.2. The Second Meeting
The second meeting began by presenting the early findings of five model intervention scenarios for five hospitals. For each intervention scenario, we presented the reduction in ED waits over three years and the supporting evidence for the proposed models of care or interventions. These intervention scenarios were identified by the modeling team through literature review, data analyses, and consultation with domain experts. These initial scenario runs were undertaken for demonstration purposes and exploration of “what-if” interventions, rather than for necessarily selecting the most desired scenario. The results of the scenario exploration stimulated discussions with the stakeholders.
In the wake of the above, we focused on discussing the development of additional modeling scenarios according to regional priorities and readiness. In the second meeting, we reviewed the list of interventions proposed by each health region. The regional leads explained the rationale behind each proposed scenario and reflected their regional priorities and alignments with the initiative’s goals. Ideally, it would be desirable to include all proposed scenarios from the regions in the simulation model; however, given the large number of scenarios that we received, the advisory group agreed on incorporating the top-ranked scenarios for each region based on the multi-criteria framework described in Figure 2 and Table 1. The modeling team took on the task of finalizing the list of scenarios for each health region and discussing data requirements and relevant evidence after the second meeting.
4.5.3. The Third and Fourth Meetings
The modeling team worked with each health region to refine and clarify the requested intervention scenarios using the multi-criteria prioritization framework. The third and fourth meetings consisted of an extensive review and discussion of the scenario results requested by each region, respectively. The modeling team presented the impact of each intervention scenario on ED wait times for the hospitals studied in the corresponding health region. For each scenario, we reviewed data input, supporting evidence (if any), evidence used in the model, key assumptions, and implementation ideas (e.g., how to achieve the expected wait reductions and what needs to be done in terms of implementation). To ensure a comprehensive exploration of intervention options to reduce wait times, additional intervention scenarios were requested during this time and incorporated into the simulation model.
To build trust in the modeling tool and continuously validate the model given the new changes made to incorporate different patient groups, we held a model challenge session between the third and fourth meetings. We invited clinical and data experts as well as interested parties to review the model structure, parameter values, and assumptions. Specific questions on the components being evaluated included: (1) how well the model component reflected the reality considered important by the clinical or domain experts; (2) whether the model output generated outputs that matched the real data; and (3) model assumptions, data sources, and data quality. We were able to gather feedback, suggestions, and critiques on (1) model input and data sources; (2) methodologies used; and (3) assumptions and ideas for future developments. This helped to further improve the DES models.
4.6. A Multi-Criteria Framework for Identifying and Prioritizing Policy Options with Stakeholders
It was challenging to select the most effective strategies to reduce ED wait times, given the large number of evidence-based options available that addressed different aspects of clinical practice and processes in the patient journey through the ED. Factors contributing to ED wait times might also differ between EDs due to variations in local context and organizational factors. Additionally, diverse opinions existed regarding the causes and solutions for the ED wait time issue in the studied hospitals. To address this, a multi-criteria framework was developed for the co-development of interventions with the stakeholders and the advisory group. The purpose of the framework is to promote transparent collaboration and communication with stakeholders during the policy development stage to identify feasible solution space. It is important to note that this framework is distinct from a multi-objective optimization framework and is not programmed into the DES models.
At the stage of co-development of intervention scenarios, we gathered and generated a large inventory of possible intervention scenarios from various sources, including (1) those supported by evidence; (2) those proposed by diverse stakeholder groups and domain experts; (3) those identified as likely to be promising through data analyses; (4) those currently considered for implementation; and (5) existing programs under consideration for expansion. Rather than accepting all scenarios for modeling without questioning, we screened and decided on the sets of interventions to be tested with the simulation models. The multi-criteria framework was used for identifying and prioritizing interventions or policies for modeling. The framework was developed following several knowledge translation principles and criteria to improve evidence-based decision making []. The multi-criteria framework has two components: (1) a modeling scenario intake process (seen in Figure 2) and (2) a scoring matrix (seen in Table 1). The framework took into account a number of criteria for managing scope, synthesizing evidence through a literature review, adapting knowledge to the local context, identifying gaps in practice, assessing feasibility, time to impact, and alignment with regional or provincial priorities.
4.6.1. The Intake Process for Modeling Scenario
To prevent “scope creep” and ensure that proposed intervention scenarios from stakeholders were appropriate and within scope [], we created and used an intake process to screen the proposed interventions or recommended policies. The intake process is presented in Figure 2. The screening process involved evaluating each proposed modeling scenario against several criteria, including its suitability for modeling, availability of data, and supporting evidence about its potential impact on ED wait times or patient flow. It was important to note that local knowledge could not be unquestionably accepted and required assessment together with evidence and data. In addition, for each proposed intervention scenario, we identified a key contact (usually a stakeholder). We clarified the proposed intervention and data requirements with key contacts as needed. We also communicated to the stakeholders about our screening process to manage expectations.
The modeling team conducted the Initial screening and made a first decision on whether we would accept the proposed intervention scenarios for modeling. The proposed intervention scenarios for modeling were declined if one or more of the following conditions were met:
- The proposed intervention scenario is not within the scope of the project;
- Data are not available or the proposed intervention requires primary data collection that cannot be completed within the current timeline and budget cycle;
- There is a lack of evidence regarding the efficacy of the proposed intervention in reducing ED wait times or improving ED patient flow;
- If the intervention scenario is unsuitable for modeling, as determined by the modeling team, it will not be pursued;
- If the intervention is not feasible for implementation in the current local context.
Although the modeling team conducted a literature review on the causes of and solutions to ED wait times during the conceptual modeling phase, the proposed intervention scenario might not have been included in the initial review. The second phase of screening involved a rapid review of the effectiveness of the requested intervention scenarios that were not captured in the initial literature review. If the evidence base was found to be thin but the intervention was of high interest to the stakeholders, the modeling team would work with the advisory group and domain experts to determine whether assumptions should be made about program efficacy based on expert opinions and whether sensitivity analyses should be conducted.
4.6.2. The Scoring Matrix
To facilitate policy recommendations at the third and fourth advisor meetings, the modeling team evaluated a list of proposed interventions aimed at reducing ED wait times for each health region using the intake process (Figure 2). Due to the high number of intervention scenarios received from various sources, a scoring matrix was used to further shortlist the interventions for modeling, as shown in Table 1. The modeling team, along with regional leaders and stakeholders in the advisory group, collaborated in filling out the scoring matrix, which evaluated each proposed intervention scenario based on the criteria outlined in Table 1. Each scenario—whether derived from data or evidence or requested by stakeholders—received a score. The scenarios were then sorted accordingly. The scoring matrices for each health region were developed and discussed during the third and fourth advisory meetings.
5. Application of the Participatory Modeling Approach
5.1. Stage 1: Project Initialization
Planning meetings were held to define the project scope and boundaries. It was agreed that the main goal of the project was to validate current assumptions about the causes of ED waits and examine a portfolio of possible intervention options to improve patient flow in the studied EDs, with a focus on ED wait times. Interventions or activities that solely focused on improving primary care, home care, mental health, or chronic disease management, but were unrelated to emergency care or wait times, were deemed out of scope. Two primary outcomes of interest were identified for the project: (1) time waiting for physician initial assessment: time between registration (or triage) and initial physician assessment; and (2) time waiting for an inpatient bed: time between the decision to admit the patient to an inpatient bed and the patient’s departure from the ED for the inpatient unit.
Initially, the project leads were not convinced of the value of using a simulation approach to explore policy options related to ED patient flow due to their unfamiliarity with the modeling methods. To address this, a proof-of-concept analysis was conducted. The modeler consulted with several health experts, quality improvement consultants, and the provincial initiative to gather insights on the patient flow within the ED and acute care settings. Two preliminary ED patient flow simulation models were built under the guidance of the project champion and technical advisors. Figure 3 provides a flow chart of the simulated patient flow in the proof-of-concept DES model. The proof-of-concept models demonstrated how patient flow could be represented and how qualitative insights and high-level quantitative predictions on patient flow metrics could be generated. The analyses showed that computational models in principle had the potential to advance the evaluation of policy scenarios and improve the decision-making process. It is worth noting that the project champion played the role of an advocate for the simulating modeling approach in this stage and assisted in building trust and confidence with the project leads by articulating the proof-of-concept models in language familiar to the project leads. As a result, the project was sponsored, and a modeling team was formed as one of the working groups within the provincial initiative.
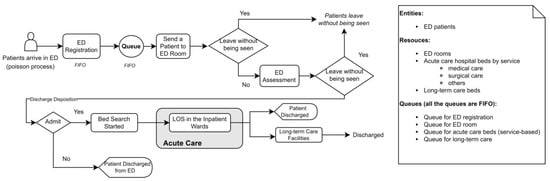
Figure 3.
Flow chart showing the modeled ED and acute care patient flow in the proof-of-concept DES Model. LOS: length of stay; FIFO: first in, first out.
5.2. Stage 2: Conceptual Modeling
The initial conceptual modeling provided a theoretical basis for communicating with the domain experts, stakeholders, and the modeler. This was instrumental in guiding the modeler to develop DES models that captured the system problems with ED wait times while maintaining a reasonable scope and a moderate level of complexity.
5.2.1. Problem Conceptualization
The causes of ED crowding and lengthy ED wait times are complex [,]. ED crowding and long waiting times originate mainly from three interdependent components: the high volume of patients demanding ED care (input), the inability to assess and treat patients in a timely manner in the ED (throughput), and the boarding of inpatients in the ED after disposition decisions (output) []. Many potential contributing factors have been identified. They are present within each component of the input–throughput–output conceptual model of ED crowding [,,,,]. Previous studies have investigated multiple input factors, such as the high volume of low-complexity patients in the ED, increased presentation with urgent and complex needs, and access to primary care [,,]. Many throughput and output causes were also reported, such as ED staff shortages, limited availability of timely specialty consultation, delays in disposition decisions, and access block to inpatient units due to inadequate acute care beds or delayed discharge of inpatients [,,]. Many input, throughput, and output solutions to ED crowding and wait times were trialed, modeled, and suggested with varying levels of success in different local contexts [,,,].
The modeling team jointly developed the driver diagram to depict five key areas to influence to reduce ED wait times. Figure 4 presents five primary drivers that are larger key topic areas related to the input, throughput, and output components of ED patient flow. Each primary driver was then linked with several secondary and tertiary drivers, which are less important or smaller in scale. The driver diagram was developed by incorporating diverse viewpoints from domain experts and stakeholders about the current state of the studied hospitals as well as evidence from the literature review. Domain experts and stakeholders were represented by physicians, nurse managers, operational leaders, and other health professionals from different health regions.
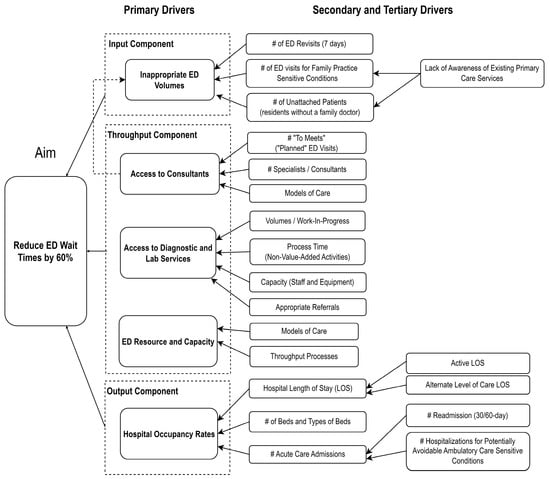
Figure 4.
Driver diagram for lengthy ED wait times. LOS: length of stay.
5.2.2. Core Patient Flow Processes Emerging from the Value Stream Mapping
To gain insights into the flow of ED patients in the studied hospitals, the modeling team made use of VSMs that were created by healthcare professionals and improvement consultants during rapid process improvement workshops. Figure 5 illustrates the core care processes that emerged from the VSMs that were developed by regional teams that worked in the studied hospitals. It is worth noting that the regional teams took a whole-hospital perspective when mapping out the current state rather than just focusing solely on ED activities. Community and primary care services were also mapped out and connected to ED inputs and hospital discharges.
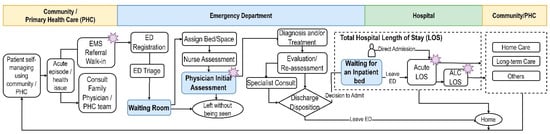
Figure 5.
Core care processes emerging from the value stream maps. The stars indicate areas that require improvement, which were marked on value stream maps created during the rapid process improvement workshops. EMS: emergency medical services.
5.2.3. Model Scope and Level of Details
Figure 5 further helped to determine the scope of the simulation models and identify the boundaries of the model. The need to explore the inputs to the ED (e.g., ED volumes) was an obvious entry point into the simulation model. The requirement to study the cause of prolonged waits for inpatient beds suggested that the flow of acute care patients should be included in the model in order to capture the intricate interactions between the ED and other acute care services in the hospital. Although community and primary care services were also mapped out in Figure 5, they were excluded from the model based on guidance from the initiative leads and domain experts. Activities aimed solely at improving primary care, home care, or mental health care were also deemed beyond the intended scope of the study.
We then identified entities, activities, queues, and resources that fell within the model boundary. We focused on identifying components that were connected with secondary and tertiary drivers and areas requiring improvements in Figure 4. Knowledge of the domain experts and technical advisors was vital at this stage to help decide the level of detail that required modeling.
5.3. Stage 3: Model Implementation
During the conceptual modeling stage, the identification of key components, care processes, and model scope facilitated the selection of appropriate data sources and model inputs for the DES models. Patient-related model inputs were obtained from various administrative databases, including the National Ambulatory Care Reporting System, Discharge Abstract Database, Physician Billing Data Repository, and Person Health Registration System. These databases contain individual-level data on ED visits, hospitalizations, physician billing, and covered population demographics. Staff-related model inputs include ED-specific physician shifts, ED physician assessment time, registration time, and ED triage time. Resource-related model inputs include ED beds and acute care beds. The DES models were created using AnyLogic 8.7.2 (professional version; AnyLogic North America, Chicago, IL, USA) with the Java-based Process Modeling Library on an Intel® Core™ i7-9700 T CPU at 2.00 GHz, operating on Windows 10 Pro. Figure 6 shows the simulated patient flow from ED to acute care in the DES models.
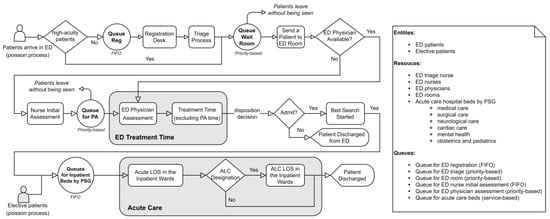
Figure 6.
Flow chart showing the patient flow from ED to acute care []. Reg: registration; PA: physician assessment; ALC, alternate level of care; LOS, length of stay; PSG, patient service group; FIFO: first in, first out. Licensed material reproduced with permission from Springer Nature.
As ED patient flow was the central focus of the model, it needed to be explicitly modeled to ensure that the core ED care processes were captured. In addition, knowing that ED wait times could be the result of delays that occurred in other parts of the healthcare system—in particular acute care—made it essential to capture inpatient flow in acute care settings. The resulting model captured patients from ED presentation to discharge from the ED or an inpatient ward (for admitted patients), as illustrated in Figure 6. The model further incorporated the volume of patients admitted via elective admissions to an inpatient ward. The model allowed for adjustment of the volume of the ED, the arrival rate by hour and day of the week, the acuity, and the volume of the ED of a specific cohort (e.g., ED visits for family practice sensitive conditions). Clinical experts also proposed reasonable assumptions to be used in the models. For instance, high-acuity patients often receive immediate treatment and interventions upon arrival; therefore, registration or triage might occur concurrently with the treatment rather than before the treatment. For parameters that were unknown due to a lack of data in the administrative database, clinical experts (e.g., nurse managers and ED physicians) provided estimates for the studied EDs, including the duration of nurse initial assessment and the duration of physician assessment.
We developed 3D visualizations of the studied EDs in the early phase of model development to aid domain experts’ understanding of the model logic and structure. Figure 7 illustrates examples of the visual representation of the studied EDs. Such visualization proved to be an effective approach in facilitating model interpretation and enabling effective communication with stakeholders without overwhelming them with detailed model logic and coding. The visualization allowed domain experts to provide valuable input and help refine model structure based on their clinical expertise and knowledge of the local contexts. For instance, this led to the incorporation of representations of chair spaces and surge stretchers in the EDs. Overall, incorporating visualization into the models improved model transparency and allowed for effective face validation of the models with domain experts.
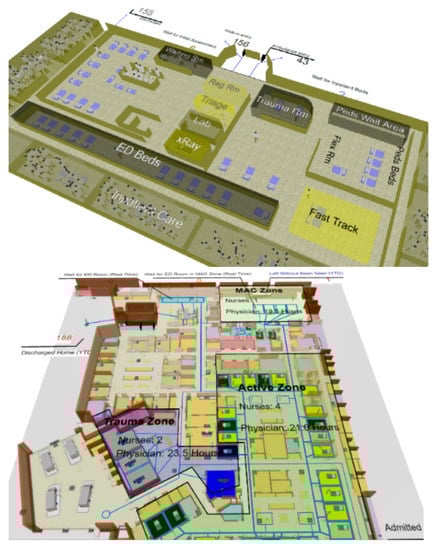
Figure 7.
Examples of visual representation of the studied EDs.
The DES models were configured with a warm-up period of 5 months, followed by a 2-year run. Each scenario was replicated 40 times. The details on the model structure, inputs, assumptions, and experiment setup were reported in the previous study []. We focused on studying two ED wait time outcome measures: time waiting for physician initial assessment and time waiting for an inpatient bed. External model validation was performed by comparing the quantitative outputs of the simulation models in the baseline scenario (no intervention) with empirical data on the two outcome measures for the six studied EDs located in three health regions. Table 2 displays the validation results. It is important to highlight that we performed multiple validations at various stages of model development, particularly when structural modifications were incorporated or new model inputs or data were used in the DES models.
Table 2.
Model validation [].
5.4. Stage 4: Model Use and Policy Co-Development
The use of the multi-criteria framework allowed for a systematic approach to identify, screen, and shortlist the intervention scenarios to reduce ED wait times in each health region. This approach was critical in achieving the goal of co-developing effective interventions for reducing ED wait times. The use of the scoring matrix, as illustrated in Table 1, enabled the modeling team, regional leaders, and stakeholders in the advisory group to collaboratively assess each proposed intervention scenario based on a set of predefined criteria. This allowed for a transparent evaluation of the proposed interventions. The resulting shortlist of interventions, as shown in Table 3, reflected the varying priorities and readiness of each health region, as well as the unique contexts and varying perspectives of the stakeholders involved. After the third advisory group meeting, we incorporated several additional intervention scenarios for modeling based on discussions with stakeholders. These additional scenarios included combinations of individual interventions presented in Table 3 and expansion of existing programs in the healthcare system.
Table 3.
Shortlisted intervention scenarios per health region in the third advisory group meeting.
Considering the diverse range of proposed interventions aimed at specific patient groups, we systematically identified and extracted the corresponding target patient groups for each intervention in each studied ED or hospital and represented them in the DES models. Table 4 presents the effects of three selected scenarios on ED wait times, with one targeting the input component of the ED patient flow, and the other two targeting the output component. The quantitative simulation results of other proposed intervention scenarios have been described and discussed in detail elsewhere [,]. The three scenarios in Table 4 studied two patient groups: (1) patients aged under 75 who were hospitalized for ambulatory care sensitive conditions (ACSCs), and (2) inpatients who no longer need acute care but experienced delayed hospital discharge, also termed as alternate-level-of-care (ALC) patients.
Table 4.
Effects of selected scenarios on ED wait times.
Hospitalizations for ACSCs are considered largely preventable through improved primary care on an outpatient basis []. These conditions have been well documented in the literature. We analyzed the hospitalizations for five ACSCs: asthma, heart failure and pulmonary edema, chronic obstructive pulmonary disease (COPD), diabetes, and angina. We extracted the patient group using the most responsible diagnosis codes and cases with certain cardiac procedures were excluded for certain ACSC conditions [,]. Individuals aged 75 years and older were also excluded. It is worth noting that COPD is one of the ACSCs, and many health regions were interested in COPD prevention and care. Hospitalizations for these potentially avoidable ACSCs account for 1.9% to 4.4% of the hospitalizations in the five studied sites in Table 4.
We used ALC hospital days to measure the delays in hospital discharge experienced by ALC patients. The reasons for these delays can differ. They can occur when ALC patients are waiting for transfer to long-term care (LTC) facilities, resulting in LTC-related ALC hospital days. Alternatively, delays can occur before patients are discharged home but are awaiting post-acute care or home care, resulting in non-LTC-related ALC hospital days. The effect sizes of these three scenarios, such as 10% and 30%, were obtained from the advisory group and domain experts based on their assessments of achievable targets.
Reducing ACSC-related hospitalizations led to a slight decrease in the mean time spent waiting for an inpatient bed across EDs. The reduction in mean time waiting for an inpatient bed was greater in site 1 (∆ 0.79 h) owing to the higher proportion of ACSC-related hospitalizations in this hospital (4.1%). Reducing either LTC-related ALC days or non-LTC-related ALC days resulted in a larger reduction in mean time waiting for an inpatient bed for sites 1 and 2. The three selected scenarios had limited impact on the mean time waiting for physician initial assessment; therefore, they will not be able to solve the ED waits associated with physician assessment.
6. Discussion
The study presented a case study that aimed to support the identification of interventions to address the complex problem of lengthy ED wait times from a whole-system perspective in a Canadian policy development setting using a participatory modeling approach. We presented and discussed the quantitative results of the model findings in a previous contribution []. This paper focused on describing the formulation of the participatory modeling approach used and demonstrating its application in the process of developing DES models of EDs and acute care patient flow for six studied hospitals located in three Saskatchewan health regions. The participatory modeling approach involved engaging with key stakeholders in various modeling stages and co-developing interventions with stakeholders using a multi-criteria framework to identify, screen, and shortlist modeling scenarios to support effective policy development. The participatory modeling approach enabled the provincial initiative to effectively engage a broad range of stakeholders to examine and identify the causes and solutions to the ED wait time in the studied hospitals. Our methodology also contributed to the M&S field by introducing an innovative multiparadigm hybrid modeling approach that integrates qualitative and quantitative paradigms in different modeling stages [].
To assess the impact of experts’ and stakeholders’ involvement in improving the model, we compared the proof-of-concept DES model (Figure 3) with the DES models developed using a participatory approach (Figure 6). While both models aimed to capture ED and acute care patient flow, significant differences were observed in their structures and development processes. The proof-of-concept DES model was constructed in an ad hoc manner, with the modeler taking the lead and consulting individual experts and stakeholders for information on the ED problem. The modeler represented the ED patient flow based on the obtained knowledge with very limited and ad hoc involvement of domain experts and stakeholders in the model development process. In contrast, the subsequent DES models were developed using a multistage participatory approach through iterative deliberation with stakeholders. Using the proposed participatory approach, domain experts and stakeholders collectively discussed evidence and shared knowledge about the causal mechanisms of the ED wait problem, identifying key drivers and areas requiring improvement through value stream mapping in the conceptual modeling stage. As a result of the different model building processes, notable differences emerged in the model structures. The proof-of-concept DES model primarily focused on ED patients, considering only ED-admitted patients for the acute care component, and featured simplified ED activities. In contrast, the later DES models incorporated detailed ED activities, included elective patients, stratified inpatients based on patient service groups, and accounted for separate alternate-level-of-care lengths of stay. The active and collaborative engagement of experts and stakeholders through the participatory approach contributed to these improvements in model structure and enhanced the modeler’s understanding of the ED problem. The models were also better designed to evaluate proposed interventions by stakeholders. The use of qualitative tools and techniques in the conceptual modeling stage not only improved our shared understanding of the ED problem situation in the studied hospitals but also complemented the development of the DES models []. It is important to note that the ways in which the stakeholders and domain experts are engaged, either collaboratively or consultatively, also exert a significant impact on the development and quality of the models. Furthermore, the participatory approach allowed for a comprehensive system perspective. Given that ED and acute care systems are complex systems, individual experts or stakeholders may possess deep knowledge of specific aspects while lacking a holistic understanding. Engaging them collectively through the participatory approach provided a platform for multiple perspectives to be shared and fostered a broader understanding of the ED problem. In contrast, individual engagement could risk losing the systemic perspective that is crucial for addressing the ED wait times in the face of the complexity associated with the ED and acute care systems []. The system perspective enabled by applying a participatory modeling approach allowed us to study ED wait times as a part of a larger integrated acute care system. Our study contributed to the literature on whole-system DES models of ED patient flow for policy development.
Our study contributes to the conceptual modeling literature by demonstrating the use of the quality improvement toolkit and lean techniques as a problem structuring method to support problem conceptualization in the health policy development context []. Unlike other problem structuring methods which were rooted in the OR domain [,], we explored and used a number of existing tools that had already been used in the healthcare system, such as lean techniques and quality improvement tools for conceptual modeling. During the conceptual modeling stage, it is common for the modeling team to take the lead and utilize mapping tools that are unfamiliar to the domain experts or stakeholders. Persuading domain experts and patient flow managers to use new tools can be challenging and may require additional training and resources. Moreover, such stakeholders may not feel ownership of the project if they are only being consulted for information. In this study, instead of introducing new conceptual mapping tools, the modeling team explored and learned about existing quality improvement and mapping tools that were already in use within the healthcare system for structuring the problem. For instance, we used VSMs of ED patient flow that had already been developed by domain experts to conceptualize the problem of ED wait times. The use of these existing tools also facilitated communication with domain experts and flow managers about the ED wait time problem in the studied hospitals, given their familiarity with the lean techniques through the implementation of the lean methodology across the province’s healthcare system at the time of this research. Such findings are consistent with previous research demonstrating that combining lean techniques with discrete-event simulation is a promising approach for studying care processes in the healthcare setting [,,].
Two important facets of trust that influence the implementation of simulation findings are the stakeholder–model relationship and the stakeholder–modeler relationship, as the decision to implement changes based on simulation results is held by the stakeholders [,]. In contrast to the existing participatory modeling approaches in quantitative modeling, which primarily focus on resolving specific problems and generating quantitative forecasts or estimates [], the novelty of our participatory modeling approach also lies in dedicated processes and activities specifically aimed at building trust in the computer modeling approach with the stakeholders and improving stakeholders’ modeling knowledge. We conducted proof-of-concept analyses during project initialization and provided simulation modeling workshop to help stakeholders become familiar with the computer simulation approach. This helped foster trust at the beginning of the study and build confidence in the modeling approach that we used. Furthermore, our approach empowered stakeholders to develop skills to apply the modeling approach on their own. This, in turn, strengthened the stakeholder–model relationship, as they perceived the modeling approach to be more useful and credible. The stakeholder–modeler relationship is primarily centered around the stakeholders’ perceived trust in the modeler’s modeling and communication competencies, particularly whether stakeholders perceive that the modeler has a good and shared understanding of the problem situation in the early phases of a study [,]. The conceptual modeling component in our participatory approach played a key role in building trust in this relationship, thereby further improving trust in the stakeholder–model relationship.
Another contribution of our participatory approach lies in the development and use of the multi-criteria framework for co-developing interventions to address ED wait times. The use of the framework helped stakeholders reach an agreement regarding the feasible solution space and allowed a transparent assessment of the proposed actions. We included both the assessment of evidence and the availability of data in the framework to promote evidence-based decision making. In previous simulation studies, modeling scenarios were typically not fully designed to address the needs of stakeholders or policymakers. While stakeholders may have been involved in the development of intervention scenarios, their involvement was often limited to providing information rather than having a sense of ownership or being held “accountable” for the proposed intervention scenarios. In our study, we worked closely with stakeholders by involving them in the identification and prioritization of intervention scenarios through advisory group meetings. Stakeholders were held “accountable” for their proposed intervention scenarios, as a contact person was identified for each proposed scenario. The stakeholders and the modeling team collaborated to fill in a scoring matrix to prioritize intervention options based on criteria such as data availability, local practice, regional priority, and time to impact. This approach conferred on stakeholders a high degree of ownership and trust in the process and allowed regional leaders to view the scoring matrix of other regions. This process further aided in breaking the silos between organizations and various departments.
This case study further supported some learning regarding the application of the participatory modeling approach. We agreed with previous research findings on the importance of engaging stakeholders early on in the participatory modeling approach [,]. We would also like to highlight the role of the project champion in the team composition, as the project champion served as a key linkage between the modeling team and the stakeholder group and played a crucial role in building trust in the modeling methodology. Previous studies have also emphasized the importance of having a project champion in participatory modeling projects, as they can greatly contribute to the successful completion of such projects [,]. Our core engagement with stakeholders was in the co-development of intervention solutions to reduce ED wait times. Although we have been transparent about the model assumptions and model validations, we experienced challenges in building trust in the model outputs when the model outputs contradicted the stakeholders’ prior beliefs or expectations. This phenomenon was also discussed in previous research [,]. In such cases, we found that it was important to facilitate ongoing and open dialogue with stakeholders through facilitated meetings.
7. Limitation and Future Work
The study has several limitations. The participatory modeling approach was applied to the case study of modeling ED and acute care patient flow using DES in a Canadian health policy setting. Due to the context-specific nature of the case study, the participatory modeling approach may not be directly applicable in other health-policy settings due to differences in organizational structures and policymaking environments. Second, the modeling team completed the scenario runs outside of the advisory group meetings, which might have reduced model transparency with stakeholders. An ideal solution would be to build models with a visual interface that allows for real-time experimentation during the advisory group meetings. However, this would require the identification of input variables related to the scenarios prior to the meetings and it is not always feasible to explore all the possible intervention solutions. Lastly, while the advisory group meetings were facilitated, formal scripts (e.g., PartiSim scripts) were not utilized, leading to a less structured approach that lacked standardization and might have resulted in missed opportunities.
The use of participatory modeling approaches with DES is still in its early stages in healthcare [] and future research is needed to explore and develop innovative tools and processes that encourage stakeholder participation in the DES modeling processes and improve the implementation of the model findings. This includes combining tools or processes from diverse participatory modeling approaches (e.g., combining elements of GMB with PartiSim) and drawing insights from these experiences, and enhancing model validation []. This study further suggests the value of investigating the adaptation of existing tools employed in the healthcare system for use in the participatory modeling processes.
8. Conclusions
This study has successfully employed a four-stage participatory modeling approach with discrete-event simulation to identify intervention strategies for reducing ED wait times in a real-world health policy setting. The use of a participatory approach has enabled a broad range of stakeholders to examine and identify the causes and solutions to ED wait times and co-develop interventions for implementation. This approach has shown to be an effective way of engaging stakeholders throughout the modeling process and building consensus. Additionally, the study embraced a system view by studying ED wait times as a part of a larger integrated acute care system with multiple interacting subsystems or units, contributing to the literature on whole-system DES models of ED patient flow for policy development.
Author Contributions
Conceptualization, J.B., G.F., N.D.O. and Y.T.; methodology, Y.T., N.D.O., A.D. and P.F; software, Y.T.; validation, Y.T., J.B., J.S. and N.D.O.; formal analysis, Y.T.; investigation, Y.T., J.B., J.S., A.D. and P.F; resources, Y.T., A.D. and P.F.; data curation, Y.T.; writing—original draft preparation, Y.T.; writing—review and editing, N.D.O., J.S., J.B. and A.D.; visualization, Y.T., P.F. and A.D.; supervision, N.D.O.; project administration, G.F. All authors have read and agreed to the published version of the manuscript.
Funding
This research received no external funding.
Data Availability Statement
The simulation model are available from the corresponding author (YT) upon reasonable request.
Acknowledgments
We would like to express our gratitude to Geoff McDonnell and Kurt Kreuger for their support and assistance in this research.
Conflicts of Interest
The authors declare no conflict of interest. The interpretation and conclusions contained herein do not necessarily represent those of the Government of Saskatchewan, the Saskatchewan Ministry of Health, the Saskatchewan Health Authority, or eHealth Saskatchewan.
References
- Concannon, T.W.; Fuster, M.; Saunders, T.; Patel, K.; Wong, J.B.; Leslie, L.K.; Lau, J. A Systematic Review of Stakeholder Engagement in Comparative Effectiveness and Patient-Centered Outcomes Research. J. Gen. Intern. Med. 2014, 29, 1692–1701. [Google Scholar] [CrossRef] [PubMed]
- Kotiadis, K.; Tako, A.A.; Vasilakis, C. A Participative and Facilitative Conceptual Modelling Framework for Discrete Event Simulation Studies in Healthcare. J. Oper. Res. Soc. 2014, 65, 197–213. [Google Scholar] [CrossRef]
- Freebairn, L.; Rychetnik, L.; Atkinson, J.-A.; Kelly, P.; McDonnell, G.; Roberts, N.; Whittall, C.; Redman, S. Knowledge Mobilisation for Policy Development: Implementing Systems Approaches through Participatory Dynamic Simulation Modelling. Health Res. Policy Syst. 2017, 15, 83. [Google Scholar] [CrossRef]
- Lamé, G.; Simmons, R.K. From Behavioural Simulation to Computer Models: How Simulation Can Be Used to Improve Healthcare Management and Policy. BMJ Simul. Technol. Enhanc. Learn. 2020, 6, 95. [Google Scholar] [CrossRef] [PubMed]
- Pitt, M.; Monks, T.; Crowe, S.; Vasilakis, C. Systems Modelling and Simulation in Health Service Design, Delivery and Decision Making. BMJ Qual. Saf. 2016, 25, 38–45. [Google Scholar] [CrossRef]
- Lich, K.H.; Tian, Y.; Beadles, C.A.; Williams, L.S.; Bravata, D.M.; Cheng, E.M.; Bosworth, H.B.; Homer, J.B.; Matchar, D.B. Strategic Planning to Reduce the Burden of Stroke among Veterans: Using Simulation Modeling to Inform Decision Making. Stroke 2014, 45, 2078–2084. [Google Scholar] [CrossRef]
- Atkinson, J.-A.; O’Donnell, E.; Wiggers, J.; McDonnell, G.; Mitchell, J.; Freebairn, L.; Indig, D.; Rychetnik, L. Dynamic Simulation Modelling of Policy Responses to Reduce Alcohol-Related Harms: Rationale and Procedure for a Participatory Approach. Public Health Res. Pract. 2017, 27, 2711707. [Google Scholar] [CrossRef]
- Hirsch, G.; Homer, J.; Evans, E.; Zielinski, A. A System Dynamics Model for Planning Cardiovascular Disease Interventions. Am. J. Public Health 2010, 100, 616–622. [Google Scholar] [CrossRef]
- Freebairn, L.; Atkinson, J.-A.; Osgood, N.D.; Kelly, P.M.; McDonnell, G.; Rychetnik, L. Turning Conceptual Systems Maps into Dynamic Simulation Models: An Australian Case Study for Diabetes in Pregnancy. PLoS ONE 2019, 14, e0218875. [Google Scholar] [CrossRef]
- Brailsford, S.C.; Harper, P.R.; Patel, B.; Pitt, M. An Analysis of the Academic Literature on Simulation and Modelling in Health Care. J. Simul. 2009, 3, 130–140. [Google Scholar] [CrossRef]
- Atkinson, J.A.; Wells, R.; Page, A.; Dominello, A.; Haines, M.; Wilson, A. Applications of System Dynamics Modelling to Support Health Policy. Public Health Res. Pract. 2015, 25, e2531531. [Google Scholar] [CrossRef]
- Mohiuddin, S.; Busby, J.; Savović, J.; Richards, A.; Northstone, K.; Hollingworth, W.; Donovan, J.L.; Vasilakis, C. Patient Flow within UK Emergency Departments: A Systematic Review of the Use of Computer Simulation Modelling Methods. BMJ Open 2017, 7, e015007. [Google Scholar] [CrossRef]
- Taylor, S.J.E.; Eldabi, T.; Riley, G.; Paul, R.J.; Pidd, M. Simulation Modelling Is 50! Do We Need a Reality Check? J. Oper. Res. Soc. 2009, 60, S69–S82. [Google Scholar] [CrossRef]
- Rutter, H.; Savona, N.; Glonti, K.; Bibby, J.; Cummins, S.; Finegood, D.T.; Greaves, F.; Harper, L.; Hawe, P.; Moore, L.; et al. The Need for a Complex Systems Model of Evidence for Public Health. Lancet 2017, 390, 2602–2604. [Google Scholar] [CrossRef]
- Jahangirian, M.; Borsci, S.; Shah, S.G.S.; Taylor, S.J.E. Causal Factors of Low Stakeholder Engagement: A Survey of Expert Opinions in the Context of Healthcare Simulation Projects. Simulation 2015, 91, 511–526. [Google Scholar] [CrossRef]
- Vázquez-Serrano, J.I.; Peimbert-García, R.E.; Cárdenas-Barrón, L.E. Discrete-Event Simulation Modeling in Healthcare: A Comprehensive Review. Int. J. Environ. Res. Public Health 2021, 18, 12262. [Google Scholar] [CrossRef] [PubMed]
- Sobolev, B.G.; Sanchez, V.; Vasilakis, C. Systematic Review of the Use of Computer Simulation Modeling of Patient Flow in Surgical Care. J. Med. Syst. 2011, 35, 1–16. [Google Scholar] [CrossRef]
- Brownson, R.C.; Royer, C.; Ewing, R.; McBride, T.D. Researchers and Policymakers: Travelers in Parallel Universes. Am. J. Prev. Med. 2006, 30, 164–172. [Google Scholar] [CrossRef] [PubMed]
- Harper, A.; Mustafee, N.; Yearworth, M. The Issue of Trust and Implementation of Results in Healthcare Modeling and Simulation Studies. In Proceedings of the 2022 Winter Simulation Conference (WSC), Singapore, 11–14 December 2022; pp. 1104–1115. [Google Scholar]
- Harper, A.; Mustafee, N.; Yearworth, M. Facets of Trust in Simulation Studies. Eur. J. Oper. Res. 2021, 289, 197–213. [Google Scholar] [CrossRef]
- Tako, A.A.; Kotiadis, K. PartiSim: A Multi-Methodology Framework to Support Facilitated Simulation Modelling in Healthcare. Eur. J. Oper. Res. 2015, 244, 555–564. [Google Scholar] [CrossRef]
- Voinov, A.; Jenni, K.; Gray, S.; Kolagani, N.; Glynn, P.D.; Bommel, P.; Prell, C.; Zellner, M.; Paolisso, M.; Jordan, R.; et al. Tools and Methods in Participatory Modeling: Selecting the Right Tool for the Job. Environ. Model. Softw. 2018, 109, 232–255. [Google Scholar] [CrossRef]
- O’Donnell, E.; Atkinson, J.-A.; Freebairn, L.; Rychetnik, L. Participatory Simulation Modelling to Inform Public Health Policy and Practice: Rethinking the Evidence Hierarchies. J. Public Health Policy 2017, 38, 203–215. [Google Scholar] [CrossRef] [PubMed]
- Tian, Y.; Osgood, N.D.; Stempien, J.; Onaemo, V.; Danyliw, A.; Fast, G.; Osman, B.A.; Reynolds, J.; Basran, J. The Impact of Alternate Level of Care on Access Block and Operational Strategies to Reduce Emergency Wait Times: A Multi-Center Simulation Study. Can. J. Emerg. Med. 2023, 25, 608–616. [Google Scholar] [CrossRef] [PubMed]
- Jun, J.B.; Jacobson, S.H.; Swisher, J.R. Application of Discrete-Event Simulation in Health Care Clinics: A Survey. J. Oper. Res. Soc. 1999, 50, 109–123. [Google Scholar] [CrossRef]
- Fone, D.; Hollinghurst, S.; Temple, M.; Round, A.; Lester, N.; Weightman, A.; Roberts, K.; Coyle, E.; Bevan, G.; Palmer, S. Systematic Review of the Use and Value of Computer Simulation Modelling in Population Health and Health Care Delivery. J. Public Health Med. 2003, 25, 325–335. [Google Scholar] [CrossRef]
- Morris, Z.S.; Boyle, A.; Beniuk, K.; Robinson, S. Emergency Department Crowding: Towards an Agenda for Evidence-Based Intervention. Emerg. Med. J. 2012, 29, 460–466. [Google Scholar] [CrossRef]
- Günal, M.M.; Pidd, M. Discrete Event Simulation for Performance Modelling in Health Care: A Review of the Literature. J. Simul. 2010, 4, 42–51. [Google Scholar] [CrossRef]
- Laker, L.F.; Torabi, E.; France, D.J.; Froehle, C.M.; Goldlust, E.J.; Hoot, N.R.; Kasaie, P.; Lyons, M.S.; Barg-Walkow, L.H.; Ward, M.J.; et al. Understanding Emergency Care Delivery Through Computer Simulation Modeling. Acad. Emerg. Med. 2018, 25, 116–127. [Google Scholar] [CrossRef]
- Salmon, A.; Rachuba, S.; Briscoe, S.; Pitt, M. A Structured Literature Review of Simulation Modelling Applied to Emergency Departments: Current Patterns and Emerging Trends. Oper. Res. Health Care 2018, 19, 1–13. [Google Scholar] [CrossRef]
- Hare, M. Forms of Participatory Modelling and Its Potential for Widespread Adoption in the Water Sector. Environ. Policy Gov. 2011, 21, 386–402. [Google Scholar] [CrossRef]
- Boaz, A.; Borst, R.; Kok, M.; O’Shea, A. How Far Does an Emphasis on Stakeholder Engagement and Co-Production in Research Present a Threat to Academic Identity and Autonomy? A Prospective Study across Five European Countries. Res. Eval. 2021, 30, 361–369. [Google Scholar] [CrossRef]
- Tako, A.A.; Kotiadis, K. Participative Simulation (Partisim): A Facilitated Simulation Approach for Stakeholder Engagement. In Proceedings of the 2018 Winter Simulation Conference (WSC), Göteborg, Sweden, 9–12 December 2018; pp. 192–206. [Google Scholar]
- Voinov, A.; Kolagani, N.; McCall, M.K.; Glynn, P.D.; Kragt, M.E.; Ostermann, F.O.; Pierce, S.A.; Ramu, P. Modelling with Stakeholders—Next Generation. Environ. Model. Softw. 2016, 77, 196–220. [Google Scholar] [CrossRef]
- Ulibarri, N. Collaborative Model Development Increases Trust in and Use of Scientific Information in Environmental Decision-Making. Environ. Sci. Policy 2018, 82, 136–142. [Google Scholar] [CrossRef]
- Stave, K. Participatory System Dynamics Modeling for Sustainable Environmental Management: Observations from Four Cases. Sustain. Sci. Pract. Policy 2010, 2, 2762–2784. [Google Scholar] [CrossRef]
- Beall, A.M.; Ford, A. Reports from the Field: Assessing the Art and Science of Participatory Environmental Modeling. Int. J. Inf. Syst. Soc. Chang. 2010, 1, 72–89. [Google Scholar] [CrossRef]
- Richardson, G.P.; Andersen, D.F. Teamwork in Group Model Building. Syst. Dyn. Rev. 1995, 11, 113–137. [Google Scholar] [CrossRef]
- Hovmand, P.S. Community Based System Dynamics; Springer: New York, NY, USA, 2014. [Google Scholar]
- Adams, S.; Rhodes, T.; Lancaster, K. New Directions for Participatory Modelling in Health: Redistributing Expertise in Relation to Localised Matters of Concern. Glob. Public Health 2021, 17, 1827–1841. [Google Scholar] [CrossRef]
- Seidl, R. A Functional-Dynamic Reflection on Participatory Processes in Modeling Projects. Ambio 2015, 44, 750–765. [Google Scholar] [CrossRef]
- Freebairn, L.; Atkinson, J.-A.; Kelly, P.M.; McDonnell, G.; Rychetnik, L. Decision Makers’ Experience of Participatory Dynamic Simulation Modelling: Methods for Public Health Policy. BMC Med. Inform. Decis. Mak. 2018, 18, 131. [Google Scholar] [CrossRef]
- Freebairn, L.; Atkinson, J.-A.; Qin, Y.; Nolan, C.J.; Kent, A.L.; Kelly, P.M.; Penza, L.; Prodan, A.; Safarishahrbijari, A.; Qian, W.; et al. “Turning the Tide” on Hyperglycemia in Pregnancy: Insights from Multiscale Dynamic Simulation Modeling. BMJ Open Diabetes Res. Care 2020, 8, e000975. [Google Scholar] [CrossRef]
- Frerichs, L.; Lich, K.H.; Dave, G.; Corbie-Smith, G. Integrating Systems Science and Community-Based Participatory Research to Achieve Health Equity. Am. J. Public Health 2016, 106, 215–222. [Google Scholar] [CrossRef] [PubMed]
- Gerritsen, S.; Harré, S.; Rees, D.; Renker-Darby, A.; Bartos, A.E.; Waterlander, W.E.; Swinburn, B. Community Group Model Building as a Method for Engaging Participants and Mobilising Action in Public Health. Int. J. Environ. Res. Public Health 2020, 17, 3457. [Google Scholar] [CrossRef]
- Augustsson, H.; Churruca, K.; Braithwaite, J. Re-Energising the Way We Manage Change in Healthcare: The Case for Soft Systems Methodology and Its Application to Evidence-Based Practice. BMC Health Serv. Res. 2019, 19, 666. [Google Scholar] [CrossRef] [PubMed]
- Hovmand, P.S. Group Model Building and Community-Based System Dynamics Process. In Community Based System Dynamics; Springer: New York, NY, USA, 2014. [Google Scholar]
- Reed, M.S. Stakeholder Participation for Environmental Management: A Literature Review. Biol. Conserv. 2008, 141, 2417–2431. [Google Scholar] [CrossRef]
- Viswanathan, M.; Ammerman, A.; Eng, E.; Garlehner, G.; Lohr, K.N.; Griffith, D.; Rhodes, S.; Samuel-Hodge, C.; Maty, S.; Lux, L.; et al. Community-Based Participatory Research: Assessing the Evidence. Evid. Rep. Summ. 2004, 18, 1–8. [Google Scholar]
- Checkland, P.; Poulter, J. Soft Systems Methodology. In Systems Approaches to Making Change: A Practical Guide; Reynolds, M., Holwell, S., Eds.; Springer: London, UK, 2020; pp. 201–253. ISBN 9781447174721. [Google Scholar]
- Water, H.; van de Schinkel, M.; Rozier, R. Fields of Application of SSM: A Categorization of Publications. J. Oper. Res. Soc. 2007, 58, 271–287. [Google Scholar] [CrossRef]
- Jones, W.; Kotiadis, K.; O’Hanley, J.R. Maximising Stakeholder Learning by Looping Again through the Simulation Life-Cycle: A Case Study in Public Transport. J. Oper. Res. Soc. 2021, 73, 2640–2659. [Google Scholar] [CrossRef]
- Kotiadis, K.; Mingers, J. Combining Problem Structuring Methods with Simulation: The Philosophical and Practical Challenges. In Discrete-Event Simulation and System Dynamics for Management Decision Making; John Wiley & Sons Ltd.: Chichester, UK, 2014; pp. 52–75. ISBN 9781118762745. [Google Scholar]
- Andersen, D.F.; Vennix, J.A.M.; Richardson, G.P.; Rouwette, E.A.J.A. Group Model Building: Problem Structuring, Policy Simulation and Decision Support. J. Oper. Res. Soc. 2007, 58, 691–694. [Google Scholar] [CrossRef]
- Vennix, J.A.M. Group Model-Building: Tackling Messy Problems. Syst. Dyn. Rev. 1999, 15, 379–401. [Google Scholar] [CrossRef]
- Esensoy, A.V.; Carter, M.W. Health System Modelling for Policy Development and Evaluation: Using Qualitative Methods to Capture the Whole-System Perspective. Oper. Res. Health Care 2015, 4, 15–26. [Google Scholar] [CrossRef]
- Tako, A.A.; Kotiadis, K. Facilitated Conceptual Modelling: Practical Issues and Reflections. In Proceedings of the 2012 Winter Simulation Conference (WSC), Berlin, Germany, 9–12 December 2012; pp. 1–12. [Google Scholar]
- Tako, A.A.; Vasilakis, C.; Kotiadis, K. A Participative Modelling Framework for Developing Conceptual Models in Healthcare Simulation Studies. In Proceedings of the 2010 Winter Simulation Conference, Baltimore, MD, USA, 5–8 December 2010; pp. 500–512. [Google Scholar]
- Kotiadis, K.; Tako, A.A. Facilitated Post-Model Coding in Discrete Event Simulation (DES): A Case Study in Healthcare. Eur. J. Oper. Res. 2018, 266, 1120–1133. [Google Scholar] [CrossRef]
- Tako, A.A.; Kotiadis, K.; Vasilakis, C.; Miras, A.; le Roux, C.W. Improving Patient Waiting Times: A Simulation Study of an Obesity Care Service. BMJ Qual. Saf. 2014, 23, 373–381. [Google Scholar] [CrossRef] [PubMed]
- Brailsford, S.C.; Eldabi, T.; Kunc, M.; Mustafee, N.; Osorio, A.F. Hybrid Simulation Modelling in Operational Research: A State-of-the-Art Review. Eur. J. Oper. Res. 2019, 278, 721–737. [Google Scholar] [CrossRef]
- Powell, J.H.; Mustafee, N. Widening Requirements Capture with Soft Methods: An Investigation of Hybrid M&S Studies in Health Care. J. Oper. Res. Soc. Abingdon 2017, 68, 1211–1222. [Google Scholar] [CrossRef]
- Tolk, A.; Harper, A.; Mustafee, N. Hybrid Models as Transdisciplinary Research Enablers. Eur. J. Oper. Res. 2021, 291, 1075–1090. [Google Scholar] [CrossRef]
- Gao, A.; Osgood, N.D.; An, W.; Dyck, R.F. A Tripartite Hybrid Model Architecture for Investigating Health and Cost Impacts and Intervention Tradeoffs for Diabetic End-Stage Renal Disease. In Proceedings of the Winter Simulation Conference 2014, Savannah, GA, USA, 7–10 December 2014; pp. 1676–1687. [Google Scholar]
- Qin, Y.; Freebairn, L.; Atkinson, J.-A.; Qian, W.; Safarishahrbijari, A.; Osgood, N.D. Multi-Scale Simulation Modeling for Prevention and Public Health Management of Diabetes in Pregnancy and Sequelae. In Proceedings of the Social, Cultural, and Behavioral Modeling; Springer International Publishing: Berlin/Heidelberg, Germany, 2019; pp. 256–265. [Google Scholar]
- Zhu, H.; Liu, S.; Li, X.; Zhang, W.; Osgood, N.; Jia, P. Using a Hybrid Simulation Model to Assess the Impacts of Combined COVID-19 Containment Measures in a High-Speed Train Station. J. Simul. 2023, 1–25. [Google Scholar] [CrossRef]
- Gao, A.; Osgood, N.D.; Jiang, Y.; Dyck, R.F. Projecting Prevalence, Costs and Evaluating Simulated Interventions for Diabetic End Stage Renal Disease in a Canadian Population of Aboriginal and Non-Aboriginal People: An Agent Based Approach. BMC Nephrol. 2017, 18, 283. [Google Scholar] [CrossRef]
- Flynn, T.; Tian, Y.; Masnick, K.; McDonnell, G.; Huynh, E.; Mair, A.; Osgood, N. Discrete Choice, Agent Based and System Dynamics Simulation of Health Profession Career Paths. In Proceedings of the Winter Simulation Conference 2014, Savannah, GA, USA, 7–10 December 2014; pp. 1700–1711. [Google Scholar]
- Vickers, D.M.; Osgood, N.D. A Unified Framework of Immunological and Epidemiological Dynamics for the Spread of Viral Infections in a Simple Network-Based Population. Theor. Biol. Med. Model. 2007, 4, 49. [Google Scholar] [CrossRef]
- Mustafee, N.; Harper, A.; Fakhimi, M. From Conceptualization of Hybrid Modelling & Simulation to Empirical Studies in Hybrid Modelling. In Proceedings of the 2022 Winter Simulation Conference (WSC), Singapore, 11–14 December 2022; pp. 1199–1210. [Google Scholar]
- Mustafee, N.; Harper, A.; Onggo, B.S. Hybrid Modelling and Simulation (M&S): Driving Innovation in the Theory and Practice of M&S. In Proceedings of the 2020 Winter Simulation Conference (WSC), Orlando, FL, USA, 14–18 December 2020. [Google Scholar]
- Mustafee, N.; Powell, J.H. From Hybrid Simulation to Hybrid Systems Modelling. In Proceedings of the 2018 Winter Simulation Conference (WSC), Göteborg, Sweden, 9–12 December 2018. [Google Scholar]
- McDonald, G.W.; Bradford, L.; Neapetung, M.; Osgood, N.D.; Strickert, G.; Waldner, C.L.; Belcher, K.; McLeod, L.; Bharadwaj, L. Case Study of Collaborative Modeling in an Indigenous Community. Water 2022, 14, 2601. [Google Scholar] [CrossRef]
- Jiang, L.; Li, X.; Wang, M.C.; Osgood, N.; Whaley, S.E.; Crespi, C.M. Estimating the Population Impact of Hypothetical Breastfeeding Interventions in a Low-Income Population in Los Angeles County: An Agent-Based Model. PLoS ONE 2020, 15, e0231134. [Google Scholar] [CrossRef]
- Tian, Y.; Hassmiller Lich, K.; Osgood, N.D.; Eom, K.; Matchar, D.B. Linked Sensitivity Analysis, Calibration, and Uncertainty Analysis Using a System Dynamics Model for Stroke Comparative Effectiveness Research. Med. Decis. Mak. 2016, 36, 1043–1057. [Google Scholar] [CrossRef] [PubMed]
- Kreuger, L.K.; Qian, W.; Osgood, N.; Choi, K. Agile Design Meets Hybrid Models: Using Modularity to Enhance Hybrid Model Design and Use. In Proceedings of the 2016 Winter Simulation Conference (WSC), Washington, DC, USA, 11–14 December 2016; pp. 1428–1438. [Google Scholar]
- Morley, C.; Unwin, M.; Peterson, G.M.; Stankovich, J.; Kinsman, L. Emergency Department Crowding: A Systematic Review of Causes, Consequences and Solutions. PLoS ONE 2018, 13, e0203316. [Google Scholar] [CrossRef] [PubMed]
- Pines, J.M.; Griffey, R.T. What We Have Learned from a Decade of ED Crowding Research. Acad. Emerg. Med. 2015, 22, 985–987. [Google Scholar] [CrossRef]
- Guttmann, A.; Schull, M.J.; Vermeulen, M.J.; Stukel, T.A. Association between Waiting Times and Short Term Mortality and Hospital Admission after Departure from Emergency Department: Population Based Cohort Study from Ontario, Canada. BMJ 2011, 342, d2983. [Google Scholar] [CrossRef]
- Singer, A.J.; Thode, H.C., Jr.; Viccellio, P.; Pines, J.M. The Association between Length of Emergency Department Boarding and Mortality. Acad. Emerg. Med. 2011, 18, 1324–1329. [Google Scholar] [CrossRef]
- Tekwani, K.L.; Kerem, Y.; Mistry, C.D.; Sayger, B.M.; Kulstad, E.B. Emergency Department Crowding Is Associated with Reduced Satisfaction Scores in Patients Discharged from the Emergency Department. West. J. Emerg. Med. 2013, 14, 11–15. [Google Scholar] [CrossRef]
- Moskop, J.C.; Sklar, D.P.; Geiderman, J.M.; Schears, R.M.; Bookman, K.J. Emergency Department Crowding, Part 1—Concept, Causes, and Moral Consequences. Ann. Emerg. Med. 2009, 53, 605–611. [Google Scholar] [CrossRef]
- Vogel, L. Canadians Still Waiting for Timely Access to Care. Can. Med. Assoc. J. 2017, 189, E375–E376. [Google Scholar] [CrossRef] [PubMed]
- Pines, J.M.; Hilton, J.A.; Weber, E.J.; Alkemade, A.J.; Al Shabanah, H.; Anderson, P.D.; Bernhard, M.; Bertini, A.; Gries, A.; Ferrandiz, S.; et al. International Perspectives on Emergency Department Crowding. Acad. Emerg. Med. 2011, 18, 1358–1370. [Google Scholar] [CrossRef]
- Bond, K.; Ospina, M.B.; Blitz, S.; Afilalo, M.; Campbell, S.G.; Bullard, M.; Innes, G.; Holroyd, B.; Curry, G.; Schull, M.; et al. Frequency, Determinants and Impact of Overcrowding in Emergency Departments in Canada: A National Survey. Healthc. Q. 2007, 10, 32–40. [Google Scholar] [CrossRef]
- Saskatchewan ED Waits and Patient Flow Initiative Emergency Department Waits and Patient Flow Initiative Fall 2015 Newsletter. Available online: https://www.hqc.sk.ca/Portals/0/documents/ReducingERWaitsImprovingFlow/Emerg-Dept-Waits-Update-Fall-2015.pdf (accessed on 16 July 2017).
- Saghafian, S.; Austin, G.; Traub, S.J. Operations Research/Management Contributions to Emergency Department Patient Flow Optimization: Review and Research Prospects. IIE Trans. Healthc. Syst. Eng. 2015, 5, 101–123. [Google Scholar] [CrossRef]
- Paul, S.A.; Reddy, M.C.; DeFlitch, C.J. A Systematic Review of Simulation Studies Investigating Emergency Department Overcrowding. Simulation 2010, 86, 559–571. [Google Scholar] [CrossRef]
- Zhang, X. Application of Discrete Event Simulation in Health Care: A Systematic Review. BMC Health Serv. Res. 2018, 18, 687. [Google Scholar] [CrossRef]
- Rashwan, W.; Abo-Hamad, W.; Arisha, A. A System Dynamics View of the Acute Bed Blockage Problem in the Irish Healthcare System. Eur. J. Oper. Res. 2015, 247, 276–293. [Google Scholar] [CrossRef]
- Vanderby, S.; Carter, M.W. An Evaluation of the Applicability of System Dynamics to Patient Flow Modelling. J. Oper. Res. Soc. 2010, 61, 1572–1581. [Google Scholar] [CrossRef]
- Shi, P.; Chou, M.C.; Dai, J.G.; Ding, D.; Sim, J. Models and Insights for Hospital Inpatient Operations: Time-Dependent ED Boarding Time. Manag. Sci. 2016, 62, 1–28. [Google Scholar] [CrossRef]
- Esensoy, A.V. Whole-System Patient Flow Modelling for Strategic Planning in Healthcare. Ph.D. Thesis, University of Toronto, Toronto, ON, Canada, 2016. [Google Scholar]
- Rouwette, E.A.J.A.; Vennix, J.A.M.; van Mullekom, T. Group Model Building Effectiveness: A Review of Assessment Studies. Syst. Dyn. Rev. 2002, 18, 5–45. [Google Scholar] [CrossRef]
- Robinson, S. Conceptual Modelling for Simulation Part II: A Framework for Conceptual Modelling. J. Oper. Res. Soc. Abingdon 2008, 59, 291–304. [Google Scholar] [CrossRef]
- Institute for Healthcare Improvement. Quality Improvement Essentials Toolkit; Institute for Healthcare Improvement: Boston, MA, USA, 2017. [Google Scholar]
- Feld, W.M. Lean Manufacturing: Tools, Techniques, and How to Use Them; CRC Press: Boca Raton, FL, USA, 2000; ISBN 9781420025538. [Google Scholar]
- Hines, P.; Rich, N. The Seven Value Stream Mapping Tools. Int. J. Oper. Prod. Manag. 1997, 17, 46–64. [Google Scholar] [CrossRef]
- Kinsman, L.; Rotter, T.; Stevenson, K.; Bath, B.; Goodridge, D.; Harrison, L.; Dobson, R.; Sari, N.; Jeffery, C.; Bourassa, C.; et al. “The Largest Lean Transformation in the World”: The Implementation and Evaluation of Lean in Saskatchewan Healthcare. Healthc. Q. 2014, 17, 29–32. [Google Scholar] [CrossRef]
- Saskatchewan Health Quality Council Health Care Leaders to Participate in Innovative Computer Modelling Boot Camp. Available online: https://www.saskhealthquality.ca/about-us/news/health-care-leaders-to-participate-in-innovative-computer-modelling-boot-camp/ (accessed on 30 April 2023).
- Straus, S.E.; Tetroe, J.; Graham, I.D. Knowledge Translation in Health Care: Moving from Evidence to Practice, 2nd ed.; Wiley: Hoboken, NJ, USA, 2013; ISBN 9781118413548. [Google Scholar]
- Komal, B.; Janjua, U.I.; Anwar, F.; Madni, T.M.; Cheema, M.F.; Malik, M.N.; Shahid, A.R. The Impact of Scope Creep on Project Success: An Empirical Investigation. IEEE Access 2020, 8, 125755–125775. [Google Scholar] [CrossRef]
- Asplin, B.R.; Magid, D.J.; Rhodes, K.V.; Solberg, L.I.; Lurie, N.; Camargo, C.A., Jr. A Conceptual Model of Emergency Department Crowding. Ann. Emerg. Med. 2003, 42, 173–180. [Google Scholar] [CrossRef] [PubMed]
- Hoot, N.R.; Aronsky, D. Systematic Review of Emergency Department Crowding: Causes, Effects, and Solutions. Ann. Emerg. Med. 2008, 52, 126–136. [Google Scholar] [CrossRef] [PubMed]
- Doupe, M.B.; Chateau, D.; Chochinov, A.; Weber, E.; Enns, J.E.; Derksen, S.; Sarkar, J.; Schull, M.; Lobato de Faria, R.; Katz, A.; et al. Comparing the Effect of Throughput and Output Factors on Emergency Department Crowding: A Retrospective Observational Cohort Study. Ann. Emerg. Med. 2018, 72, 410–419. [Google Scholar] [CrossRef] [PubMed]
- Asaro, P.V.; Lewis, L.M.; Boxerman, S.B. The Impact of Input and Output Factors on Emergency Department Throughput. Acad. Emerg. Med. 2007, 14, 235–242. [Google Scholar] [CrossRef] [PubMed]
- Moineddin, R.; Meaney, C.; Agha, M.; Zagorski, B.; Glazier, R.H. Modeling Factors Influencing the Demand for Emergency Department Services in Ontario: A Comparison of Methods. BMC Emerg. Med. 2011, 11, 13. [Google Scholar] [CrossRef]
- Forster, A.J.; Stiell, I.; Wells, G.; Lee, A.J.; van Walraven, C. The Effect of Hospital Occupancy on Emergency Department Length of Stay and Patient Disposition. Acad. Emerg. Med. 2003, 10, 127–133. [Google Scholar] [CrossRef]
- Yarmohammadian, M.H.; Rezaei, F.; Haghshenas, A.; Tavakoli, N. Overcrowding in Emergency Departments: A Review of Strategies to Decrease Future Challenges. J. Res. Med. Sci. 2017, 22, 23. [Google Scholar] [CrossRef]
- Moskop, J.C.; Sklar, D.P.; Geiderman, J.M.; Schears, R.M.; Bookman, K.J. Emergency Department Crowding, Part 2—Barriers to Reform and Strategies to Overcome Them. Ann. Emerg. Med. 2009, 53, 612–617. [Google Scholar] [CrossRef]
- Mason, S.; Mountain, G.; Turner, J.; Arain, M.; Revue, E.; Weber, E.J. Innovations to Reduce Demand and Crowding in Emergency Care; a Review Study. Scand. J. Trauma Resusc. Emerg. Med. 2014, 22, 55. [Google Scholar] [CrossRef]
- Saskatchewan Health Quality Council Connected Care: A Summary of Learnings from the Emergency Department Waits and Patient Flow Initiative. Available online: https://www.saskhealthquality.ca/wp-content/uploads/2021/06/Connected-Care-Summary-of-Learnings-from-ED-Waits-and-Patient-Flow-Initiative.pdf (accessed on 26 July 2021).
- Khan, S.; Sanmartin, C. LHAD research team Hospitalizations for Ambulatory Care Sensitive Conditions (ACSC): The Factors That Matter; Statistics: Ottawa, ON, Canada, 2011. [Google Scholar]
- Canadian Institute for Health Information. Continuity of Care with Family Medicine Physicians: Why It Matters; CIHI: Ottawa, ON, Canada, 2015. [Google Scholar]
- Jones, W.; Kotiadis, K.; O’Hanley, J. Engaging Stakeholders to Extend the Lifecycle of Hybrid Simulation Models. In Proceedings of the 2019 Winter Simulation Conference (WSC), National Harbor, MD, USA, 8–11 December 2019; pp. 1304–1315. [Google Scholar]
- Powell, J.; Mustafee, N. Soft OR Approaches in Problem Formulation Stage of a Hybrid M&S Study. In Proceedings of the Winter Simulation Conference 2014, Savannah, GA, USA, 7–10 December 2014; pp. 1664–1675. [Google Scholar]
- Bal, A.; Ceylan, C.; Taçoğlu, C. Using Value Stream Mapping and Discrete Event Simulation to Improve Efficiency of Emergency Departments. Int. J. Healthc. Manag. 2017, 10, 196–206. [Google Scholar] [CrossRef]
- Robinson, S.; Radnor, Z.J.; Burgess, N.; Worthington, C. SimLean: Utilising Simulation in the Implementation of Lean in Healthcare. Eur. J. Oper. Res. 2012, 219, 188–197. [Google Scholar] [CrossRef]
- Robinson, S.; Worthington, C.; Burgess, N.; Radnor, Z.J. Facilitated Modelling with Discrete-Event Simulation: Reality or Myth? Eur. J. Oper. Res. 2014, 234, 231–240. [Google Scholar] [CrossRef]
- Diallo, S.Y.; Gore, R.; Lynch, C.J.; Padilla, J.J. Formal Methods, Statistical Debugging and Exploratory Analysis in Support of System Development: Towards a Verification and Validation Calculator Tool. Int. J. Model. Simul. Sci. Comput. 2016, 7, 1641001. [Google Scholar] [CrossRef]
Disclaimer/Publisher’s Note: The statements, opinions and data contained in all publications are solely those of the individual author(s) and contributor(s) and not of MDPI and/or the editor(s). MDPI and/or the editor(s) disclaim responsibility for any injury to people or property resulting from any ideas, methods, instructions or products referred to in the content. |
© 2023 by the authors. Licensee MDPI, Basel, Switzerland. This article is an open access article distributed under the terms and conditions of the Creative Commons Attribution (CC BY) license (https://creativecommons.org/licenses/by/4.0/).