
The Evaluation Prediction System for Urban Advanced Manufacturing Development


1
School of Management, Guangzhou University, Guangzhou 510006, China
2
Research Center for High Quality Development of Modern Industry, Guangzhou University, Guangzhou 510006, China
3
School of Economics and Management, Harbin Institute of Technology (Weihai), Weihai 264209, China
4
School of Computer Science and Cyber Engineering, Guangzhou University, Guangzhou 510006, China
*
Author to whom correspondence should be addressed.
Systems 2023, 11(8), 392; https://doi.org/10.3390/systems11080392
Submission received: 5 May 2023
/
Revised: 17 July 2023
/
Accepted: 28 July 2023
/
Published: 1 August 2023
Abstract
:With the rapid development of the economy, it is important to reasonably evaluate the development status of the regional manufacturing industry. Given this, this article expands the evaluation indicators of urban advanced manufacturing (UAM) from the perspective of the push–pull-mooring (PPM). Then, it uses a machine learning (ML) method to predict the evaluation results of other cities through a small amount of sample data. The results show that: (1) From the current development status of UAM in Guangdong Province (GD), cities in the Pearl River Delta region occupy a dominant position. However, cities in eastern, western, and mountainous regions have strong development potential and lead cities. Therefore, each region has cities with high levels of development and has a demonstrative role. (2) By comparison, it was found that the overall development level of UAM in GD is not significantly different from that of the Yangtze River Economic Belt. However, due to significant differences in their extreme values, the proportion of cities above the average in the overall population is relatively small. This indirectly proves that GD’s UAM not only has a phased nature, but also has a demonstrative role. (3) The prediction effect of the perceptron model is better than other methods. Although neural network models have better prediction performance than other machine learning models, they should not overly rely on complex network structure prediction data. By comparing the results, the reliability is verified. Finally, according to the life cycle theory, we propose a targeted development path for different UAM.
1. Introduction
The world is undergoing great changes. This leads to the pattern of the international division of labor in manufacturing facing readjustment. Developed countries have implemented the “high-end manufacturing return” plan to seize the strategic commanding height of the global value chain. Developing countries are also rising with the trend. Under the “double squeeze”, the traditional factor-driven development model is difficult to meet the current development needs. Therefore, the upgrading of the manufacturing urgently needs new developmental strategic guidance. Advanced manufacturing development is an active choice to adapt to the new normal. It is of great significance to build a modern manufacturing system and form a new driving force for development. Through the implementation of advanced manufacturing, not only can it effectively resist the pressure of international competition, but also form a new pattern of industrial coordinated development. This will promote the intelligent development of manufacturing and point out the direction for its development and reform of it.
The manufacturing industry currently has drawbacks, such as being large but not strong, weak independent innovation ability, and prominent environmental pollution. Therefore, the development stage of it needs to enter a new stage of development. By promoting its innovative development, improving productivity [1], and increasing manufacturing efficiency, important needs for economic and social development can be met. However, the concept of UAM has not been unified. The development of the manufacturing should transform from a traditional single economic factor driven development model to an innovation-driven and green-driven development model, which is an inevitable choice for advanced manufacturing, namely industrial technological innovation [2], industrial economic development, and industrial environmental development [3]. Based on this, this paper defines the urban advanced manufacturing (UAM) by combing the relevant literature. By grasping its definition, we can build a scientific and reasonable evaluation system, to explore the current situation of UAM. This article introduces the push–pull-mooring (PPM) theory and attempts to expand the UAM evaluation system under its guidance. Specifically, based on the PPM theory, a UAM evaluation system is constructed to systematically evaluate the manufacturing industry from the economic, environmental, and technical perspectives. This breaks through the limitations of traditional static research perspectives and is a novel research perspective. On this basis, we add some new variables to enrich the evaluation system.
On the other hand, there are many evaluation methods for the industry, for example, DEA method [4], and analytic hierarchy process (AHP) method [5]; due to the limitations of the objective indicators of the research sample, these methods can only be applied to a certain range of cities for research. If the statistical indicators of two urban clusters are inconsistent, it is difficult to achieve comprehensive measurement and comparative analysis. At present, some scholars have pointed out that machine learning training can effectively solve the problem of sample size [6]. In other words, the machine learning only requires learning data from small-scale sample cities, and training through common alternative indicators can predict the evaluation results of large sample cities. On the basis of traditional research methods, this article utilizes deep learning methods to explore small sample city evaluation, making up for the shortcomings of statistical indicators of each city are not necessarily the same. A small number of mapping indicators are used to match the evaluation results, thus supplementing the literature on using deep learning to evaluate city. Expand research methods and perspectives to effectively measure UAM, using urban agglomerations as construction units, and objectively understand the differences in the development of different UAMs.
To address these knowledge gaps, we construct an evaluation system:
- (1)
- This article expands the evaluation indicators of UAM from the perspective of PPM theory. Specifically, we evaluate UAM from the perspectives of economy, technology, and environment, and adds some new indicators. Thus, a more scientific and comprehensive evaluation system has been established.
- (2)
- Using machine learning (ML) method to predict the evaluation results of other cities through a small amount of sample data. This extends the existing evaluation methods. Specifically, this allows for the evaluation of large sample data through a small amount of sample data, overcoming the problem of lacking sample indicators.
Finally, the ML method is established to forecast the UAM with the minimum error. This confirms the effectiveness of the method. Therefore, this method can be used to predict the evaluation results of other cities, overcoming the problem of lacking sample indicators.
The rest of this paper is as follows: Section 2 summarizes the literature reviews. In Section 3, we introduce the methodology, including the research framework, sample selection basis, the evaluation index, research methods, and evaluation criteria. Section 4 is an experiment, namely factor analysis results, model training, model comparison results, and prediction results. The next section discusses the innovation and suggestion. Finally, the conclusion is presented.
2. Literature Review
2.1. The Concept of Urban Advanced Manufacturing Development
The UAM is an indispensable part of development, especially after the realization of industrialization, the development of the manufacturing has entered a new stage. The development plans of various countries have included the improvement of manufacturing competitiveness. Many countries have formulated relevant strategies to promote the high-quality of their manufacturing industry [7]. For example, France proposed the new industry plan, Germany proposed the industry 4.0 plan, and South Korea proposed the growth power plan [8]. In this context, China proposes the smart manufacturing 2025 strategy. The strategy points out that the government should actively promote the structural reform of the manufacturing industry, improve the industrial R and D and innovation ability and technological development level. The original whole process of the manufacturing industry will be greatly improved when sustainable development is realized from the R and D link, production link, manufacturing link, and sales link. This will promote the rational allocation of resources, the improvement of production efficiency, and the enhancement of comprehensive strength. The overall development environment of the manufacturing industry will be greatly improved. Organically combine the development benefits, development quality, and development power of the industry to form the sustainability of the development of the manufacturing ecosystem to maintain a good trend in the development of industrial benefits. It can be seen that the UAM is not a simple and single development, but needs the coordinated development of the economy, innovation, and environment. Therefore, the UAM is an all-around development covering sustained economic growth, innovation-driven development, and green protection [9]. It can be summarized into the following three aspects:
- (1)
- Environmental regulations aim to reduce the negative impact of manufacturing development on the environment and promote itself transformation. Zhang et al. (2023) [10] found that environmental regulation accelerates the transfer of equipment manufacturing industry, but its impact on its international competitiveness presents a “U-shaped” pattern. Xie et al. (2023) [11] found technology innovation can be stimulated by combining environmental regulation and other policies to improve capacity utilization in moderate and severe pollution sectors. Wen et al. (2022) [12] found that environmental regulation can force manufacturing enterprises to transform and improve total factor productivity. Lena et al. (2022) [13] analyzed the impact of environmental policies on productivity in manufacturing industries in Italy. The result show that environmental regulation has no negative impact in most samples.
- (2)
- Economic development involves the overall development scale of large-scale manufacturing industry and the efficiency level of manufacturing enterprises. If the level of regional economic development is low, it will be difficult to attract a large number of manufacturing enterprises to gather and form a huge trade market. Popov et al. (2022) [14] evaluated the impact of regional economic diversification on the gross domestic product of the manufacturing industry. The results showed that regional economic diversification has a long-term impact on its stable economic development. Li et al. (2021) [15] found industrial agglomeration has a significant promoting effect on the improvement of the global value chain position of the manufacturing. Li et al. (2018) [16] found diversified agglomeration is more conducive to innovation for manufacturing enterprises than specialized agglomeration.
- (3)
- Only by continuously improving the level of intelligence in a region’s manufacturing industry can we effectively ensure the development advantages of the urban manufacturing. Lo et al. (2022) [17] found technology patents improve the total factor productivity of manufacturing enterprises by reducing operating costs, improving resource allocation efficiency, and enhancing innovation capabilities. Li et al. (2022) [18] believed that big data-driven analysis, as one of the key technologies of artificial intelligence, can improve the market competitiveness of the manufacturing and help business leaders make wise decisions. Von Joerg et al. (2022) [19] found that small and medium-sized manufacturing enterprises can create new business models by effectively utilizing AI resources. Wang et al. (2022) [20] found that artificial intelligence can significantly improve the total factor productivity of manufacturing enterprises. Specifically implemented from three aspects: technological innovation, human capital optimization, and market matching. Leoni et al. (2022) [21] found that manufacturing companies can deploy artificial intelligence to stimulate knowledge management processes and improve their supply chain resilience and performance.
2.2. Evaluation Methods
In recent years, there are many evaluation methods for the manufacturing. However, most of them are based on the construction of an evaluation index, and there are almost no machine learning methods. Li et al. (2020) [22] constructed the measurement model for the equipment manufacturing industry. In addition, it analyzes the indicators affecting the development of the industrial cluster and provides suggestions for its development. Yin et al. (2021) [23] evaluated the efficiency of green innovation in the equipment manufacturing industry and analyzed its dynamic evolution trend. Yan et al. (2021) [5] used the AHP to analyze the performance management of manufacturing enterprises. Singh et al. (2019) [24] used the AHP to evaluate the performance sustainability of Indian manufacturing enterprises. Determine the company ranking according to its score and judge the market competitiveness of manufacturing enterprises. Patalas et al. (2020) [25] proposed the evaluation system of sustainable development of manufacturing enterprises based on the AHP. Taking a production company as an example, the usability of the proposed solution is demonstrated. Chen et al. (2020) [26] established the DEA model to evaluate the manufacturing development efficiency in the Yangtze River Delta. Dou et al. (2021) [27] evaluated and analyzed the development trend of the advanced manufacturing industry based on the entropy and clustering model. They also put forward corresponding development strategies for manufacturing. Zhen (2020) [28] build the competitiveness model to provide countermeasures and suggestions for port manufacturing. Jin (2020) [29] studied the measurement and evaluation of marine manufacturing upgrading. The upgrading strategy of the shipbuilding industry is given. Yu et al. (2019) [4] used the DEA method to construct the carbon performance evaluation system for the green supply chain in automobile manufacturing. Sun et al. (2018) [30] evaluated the maturity of the low-carbon energy industry based on the AHP and fuzzy comprehensive evaluation method. It is applied to many subdivided industries, such as the power electronic equipment industry, intelligent wind power generation industry.
The disadvantage of the above method is that it depends on a comprehensive evaluation index system. It is more applicable to the national industry level and the level of listed manufacturing enterprises. In the study of prefecture-level cities, due to the different statistical caliber and focus of each city, it is impossible to use the above evaluation methods to build the prefecture-level city evaluation system. Therefore, it is impossible to effectively measure the difference in UAM in prefecture-level cities in China.
This paper puts forward a new evaluation method for this problem. The advantage of this method is that it only needs to build a comprehensive evaluation system in a small sample city to get the evaluation score. The mapping index and evaluation score of the sample city are trained by perceptron, and the training parameters are transferred to other cities. Finally, the score of UAM in Yangtze River Economic Belt (YREB) prefecture-level cities is obtained.
3. Methodology
3.1. Research Framework
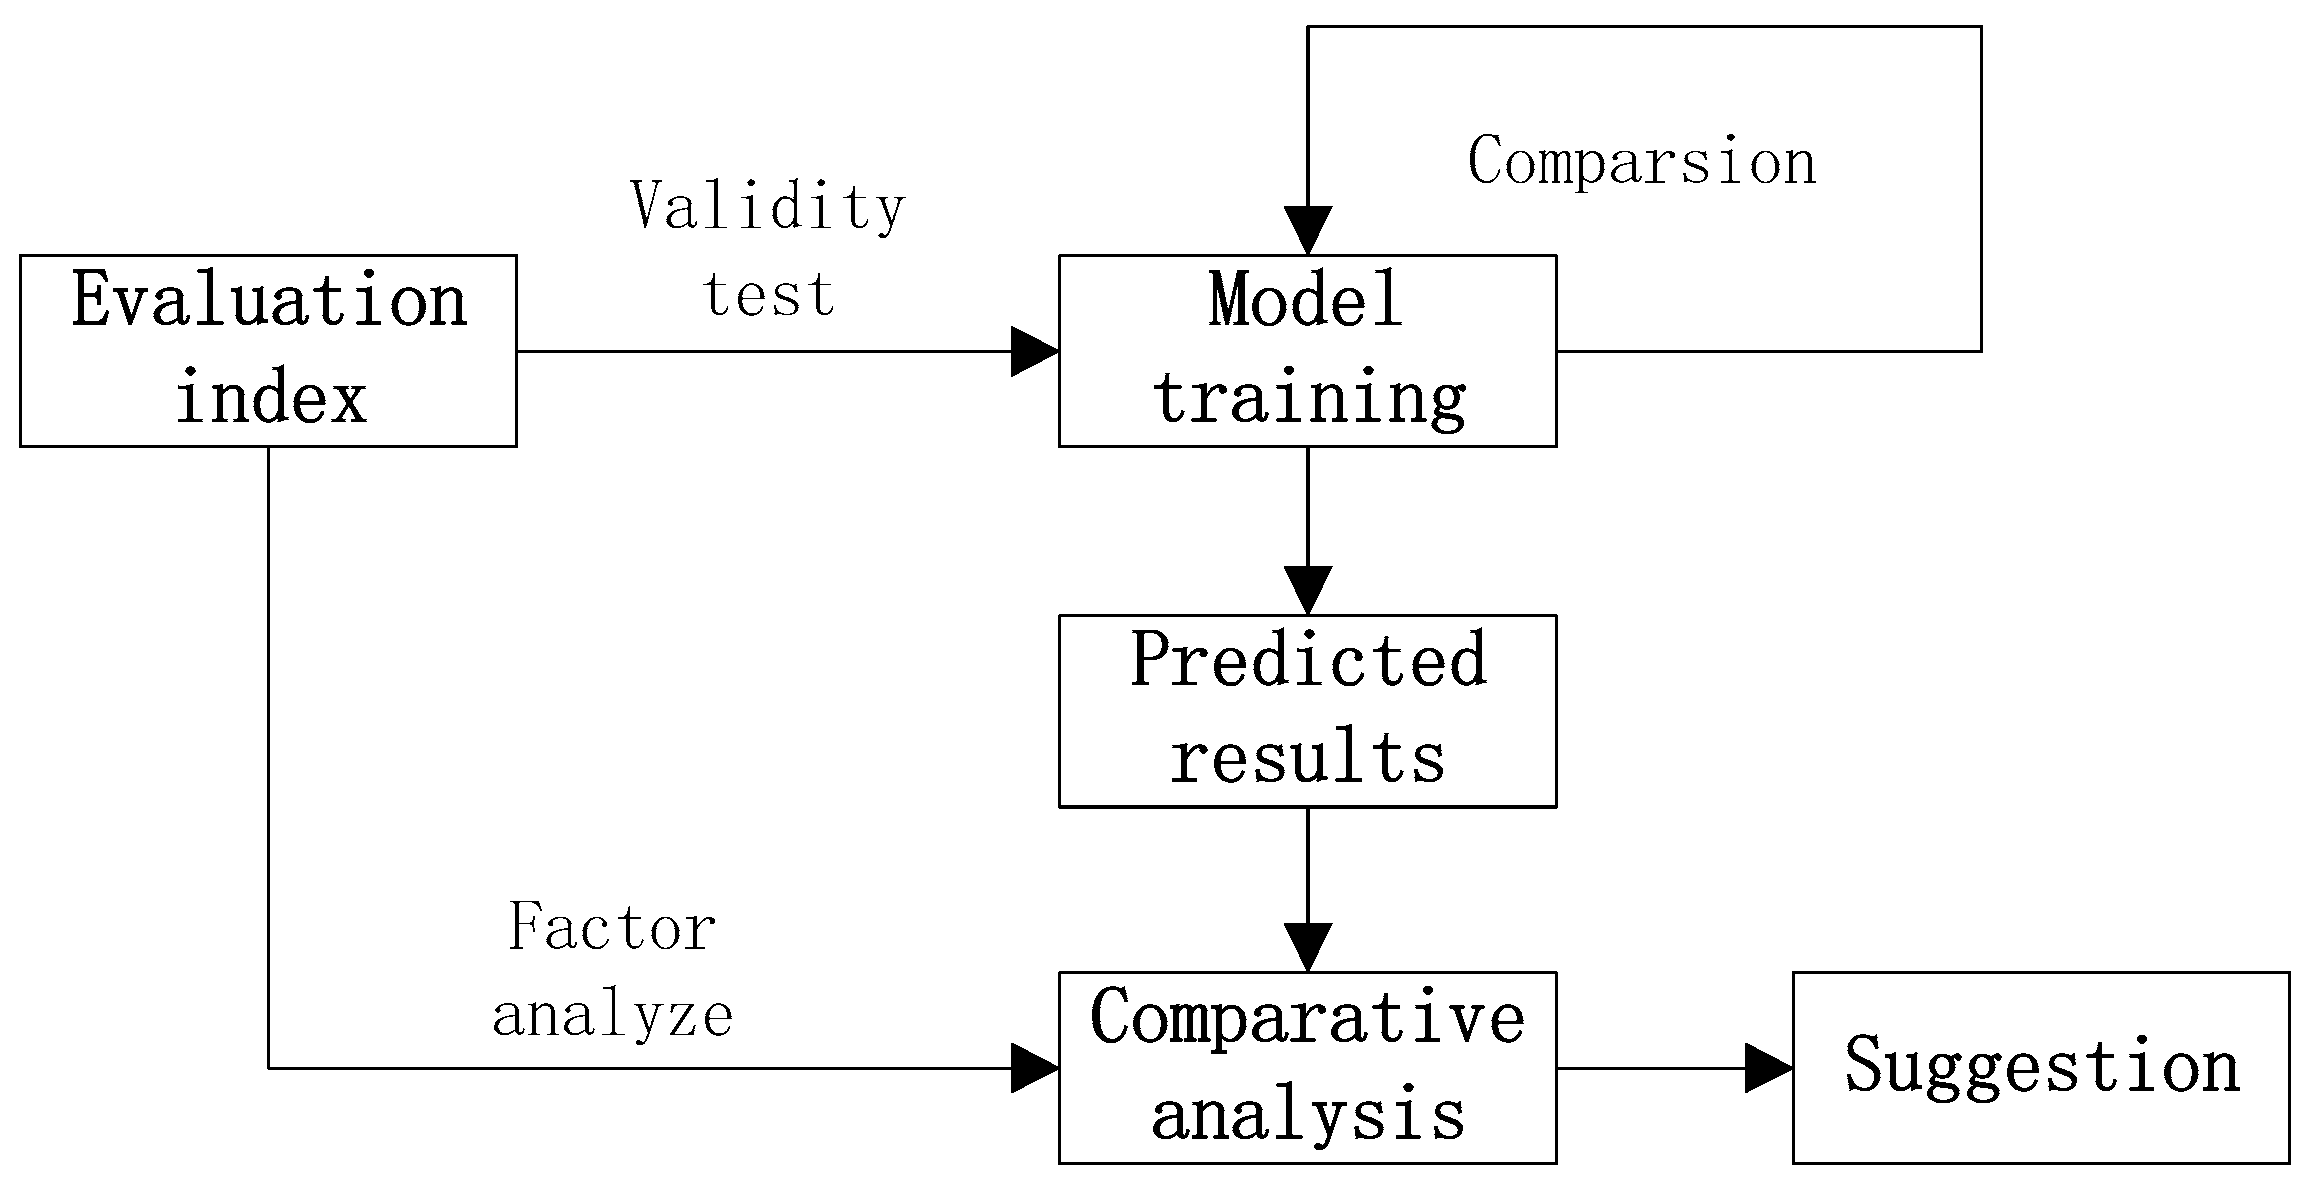
The purpose of this study was to predict the status of regional UAM. The research framework is shown in Figure 1. It included the following steps:
Step 1: Evaluation index. An evaluation system was built based on small sample data. On this basis, the data test of the evaluation index was carried out. If it failed, the index was reconstructed, and if it passed the test, factor analysis was carried out. Finally, the evaluation results of small sample cities were calculated.
Step 2: Model training. Based on the scores of the small sample city evaluation system as training labels, the mapping index was used as the input indicator. Among them, the mapping index also sought common indicators for all cities from the perspectives of economy, technology, and environment. On this basis, the evaluation results of small sample cities were trained and verified by using mapping indicators through a variety of models. According to the comparison of error results, the optimal model was selected, i.e., the ML model.
Step 3: Prediction results. Based on the model parameters trained by the ML model, we migrated the parameters to the large sample data to predict the UAM in other cities.
Step 4: Comparative analysis. A comparative analysis of different urban agglomerations was conducted.
Step 5: Suggestion. Based on the development situation of different urban agglomerations, targeted development suggestions were proposed in three aspects: green development, technological development, and economic development.
3.2. Sample Selection Basis
This paper selected 21 cities in Guangdong Province (GD) as the sample data because there were great differences in urban development in this province, which could make the sample study more universal. Among them, there were not only first-tier developed cities, but also relatively backward cities. According to the data in the statistical yearbook of GD, there were obvious differences in the industrial added value of GD in 2020. Cities with more than 400 billion yuan included Shenzhen, Guangzhou, Foshan, and Dongguan. There were two cities with less than 20 billion yuan. The remaining cities were between 20 billion yuan and 100 billion yuan. This shows that the data sample distribution was reasonable and suitable for the sample city.
3.3. Evaluation Index
3.3.1. Theoretical Basis
The PPM theory originated from sociology by capturing the factors that influence people’s migration from one place to another over a period of time in order to trace the patterns of migration. It mainly includes three aspects:
(1) The pull factor is a positive factor in population migration, mainly referring to the positive reasons that promote population migration from their original place of residence to a new destination. For example, the destination will bring higher income levels, better economic environment, and complete infrastructure to the relocated personnel.
(2) The push factor, on the other hand, is the opposite of the pull factor and has a negative impact on migration. It mainly refers to the negative factors that cause the population to be forced to leave their place of origin. For example, negative factors, such as severe environmental pollution.
(3) The mooring factors are used to describe the impact of individual factors on migration decision-making, which refers to individual preferences caused by differences in other factors besides pull and push. For example, personal development abilities and experience.
Although the PPM theory originated from sociology, it has also been widely applied in other disciplinary fields. Essentially, it explains the process of a research subject transitioning from a poor environment to a better and more sustainable environment. This is very consistent with studying UAM. Dou et al. (2021) [27] introduced the PPM theory into the development of the manufacturing industry and analyzed its development from the perspectives of economic, technological, and environmental factors. On this basis, this article applied the theoretical framework to further establish a more scientific and comprehensive evaluation system.
3.3.2. Main Index
Based on the concept of UAM, the UAM was defined from three levels, which could be used to effectively analyze the UAM in the city, as shown in Table 1.
(1) The development of industrialization could reflect the intensive degree of the regional manufacturing and effectively reflect the development scale and benefit level of manufacturing. The X1 could be continuously improved, which could produce economies of scale and provide a foundation for economic development and a good business guarantee for the regional manufacturing. The X2 represents the benefits development of the manufacturing industry. With the increase in gross profit, it could effectively stimulate the manufacturing industry and provide external power for manufacturing. The X3 could effectively measure the industrial labor output of the region and reflect the development level of the industrial economy. The X4 could implement manufacturing development project plans to stimulate and release their development potential. The X5 represented the process of industrial adjustment and transformation towards advanced structure, emphasizing the rational allocation of factor resources and coordination among various industries, bringing endogenous impetus to the development of the manufacturing industry.
(2) When regional industrial pollution was serious, it limited the development of the local manufacturing. Therefore, serious industrial pollution would bring severe challenges to the local environmental carrying capacity. Through the implementation of green environmental control for manufacturing enterprises, rigid constraints could be formed on the UAM. Therefore, the driving factors were environmental factors, including X6, X7, and X8. These variables have a lasting and far-reaching impact on the UAM. By investigating these variables, we could better understand the degree of local industrial pollution. Based on this, environmental protection measures should be taken to reduce unit industrial pollution and promote the UAM. The X9 represented the attitude of government departments, which could regulate the emission intensity of various pollutants in local industries. The X10 was related to the level of local industrial and technological development. Compared to low tech manufacturing, medium to high tech manufacturing had lower carbon dioxide emissions.
(3) Only when the intelligent level of manufacturing in a region was continuously improved could we effectively ensure the advantages of UAM in that region. First, to promote the UAM, we needed to actively promote the intelligent level of manufacturing and cultivate the emerging manufacturing industry. The X11 and X12 could effectively represent the technological development level. Second, having independent core technology could effectively promote intelligent development. The development of core technology was inseparable from technology investment. The X13 reflected the level of technological investment in the manufacturing industry. Finally, the X14 reflected the market innovation output of the manufacturing industry. The X15 represented the government’s attention to intelligent manufacturing. Usually, intelligent policies provided incentives for the transformation of the manufacturing industry. The X16 represented a combination of new knowledge elements, which had a new impact on knowledge creation.
3.3.3. Mapping Index
Because the statistical caliber and focus of each city were different, the above evaluation indicators could not cover all prefecture-level city. Therefore, it was impossible to effectively measure the difference of UAM in prefecture-level city in China. We could only use factor analysis to calculate the evaluation results of small sample cities and obtain evaluation scores. On this basis, we used the score as the training label and the mapping index as the input indicator. Then, we trained and validated through the model. This could enable large sample cities to accurately predict their evaluation scores through the Mapping index. It could effectively measure the development of all cities. Among them, the mapping index also sought common indicators for all cities from the perspectives of economy, technology, and environment. The specific indicators were as follows:
(1) Per capita GDP development level (M1) reflected the development of economy. The reason was that the increase in regional economy would drive the increase in manufacturing business scale and consumption, thus forming a scale effect. In this context, economic scale could promote the integrity of the industrial chain and the effectiveness of resource allocation and improve the development level of urban manufacturing.
(2) Per capita number of invention patent applications (M2) reflected the development of intelligent. The reason was that the number of patents reflected technological development activities. The greater the number of patents, the stronger the innovation ability of a region [41]. With the continuous improvement of regional innovation ability, it could effectively promote the intelligent development in the region.
(3) The PM2.5 average concentration (M3) reflected the green development. The reason was the PM2.5 average concentration could effectively reflect the local environmental pollution level [42]. With the increase in PM2.5 average concentration, it could be said that the pollution in this area was serious. The decrease in PM2.5 average concentration indicated that the region attaches importance to environmental governance, which could reflect the level of green development.
3.4. Research Method
3.4.1. Data Processing Module
To eliminate the impact of different dimensions, it was necessary to normalize the indicators. After processing was used to replace the original value, the indicators of different units of magnitude were comparable. The formula were as follows:
Assuming that there were n samples in the evaluation system and each sample had m indicators, Xij represented the original value of the j-th indicator of the i-th sample; Xij′ represented the standard value after processing.
3.4.2. Factor Analysis Module
This method usually evaluated the comprehensive index of a phenomenon and explained it through the internal dependence of the correlation coefficient matrix between multiple variables.
The matrix form was . If there were n samples, m indicators, and the random vector was , the common factor was , the special factor was . It was expressed as follows:
where ① p belonged to m. ② was irrelevant, and their variance was 1. ③ was irrelevant, and their variance was different. ④ was the correlation coefficient of the variable on the factor.
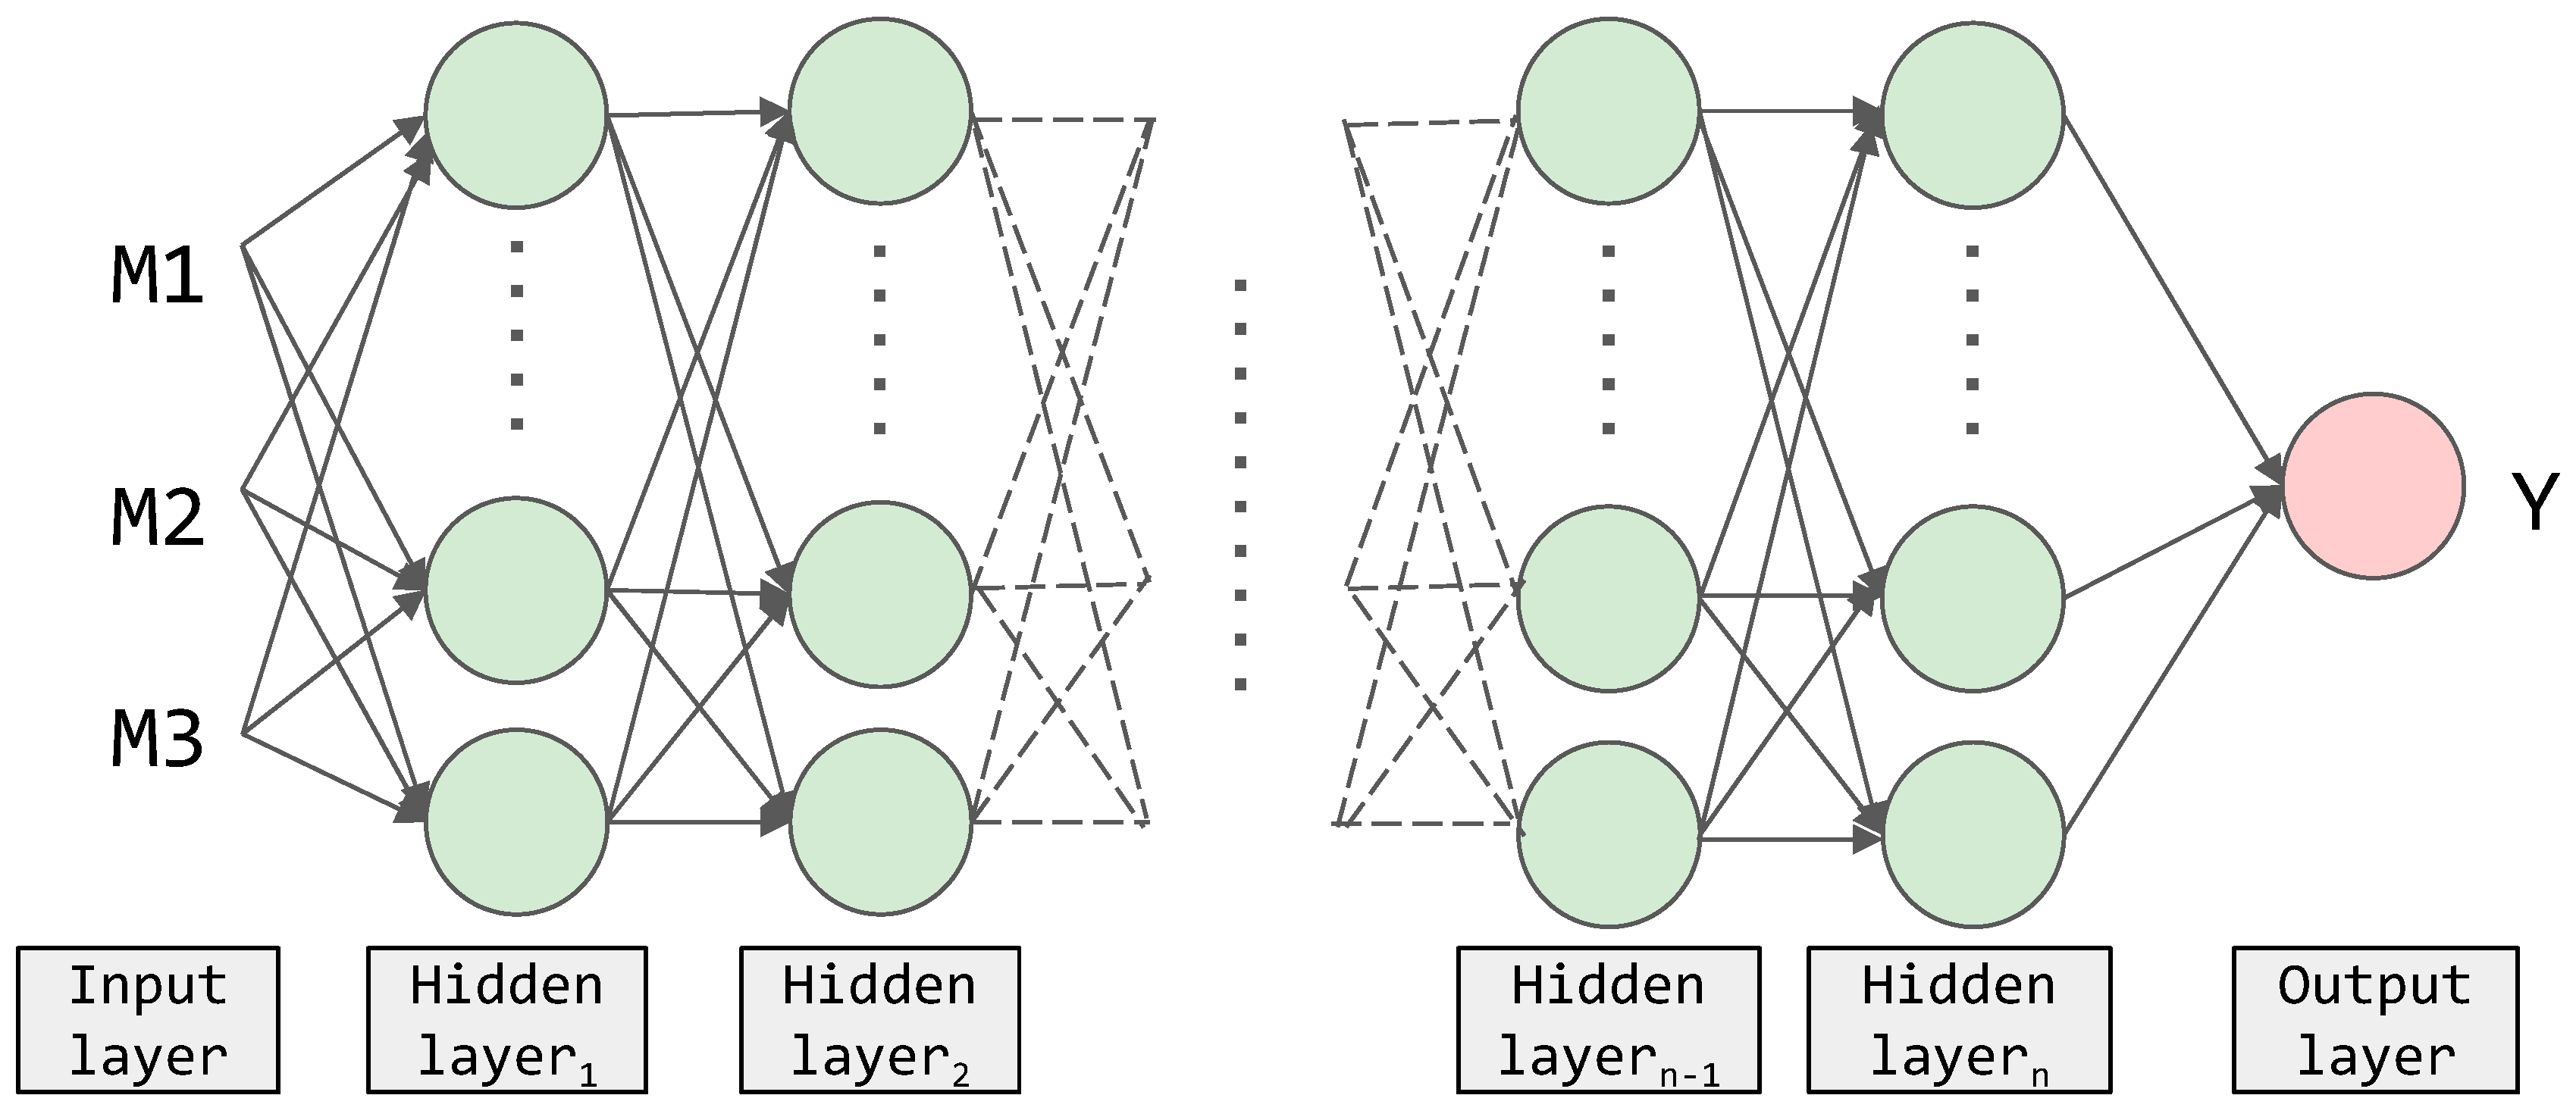
3.4.3. The Machine Learning Module
This article used Back-propagation neural networks (BP-NN) as the framework for machine learning debugging. The layers of ML were fully connected, as shown in Figure 2. It was a neural network composed of fully connected layers with hidden layers, and the output of the hidden layer was transformed by the activation function. The number of layers and the number of hidden neurons were super parameters.
The Partial derivative formula of the output layer was as follows:
where the number of output nodes was 1. Output was ; the number of nodes in the reciprocal second layer was , and the output was . The number of nodes in the third to last layer was , and the output was .
Its mean squared error derivative function was as follows:
By bringing in, it could be concluded that:
where . The derivative of the sigmoid function was . Continuing to take the derivative yields the following formula was as follows:
For , the Chain rule could be applied to decompose it as follows:
It could be inferred from as follows:
Due to , the following formula could be derived using the derivative of the sigmoid function:
where .
Reference could obtain .
At this point, was the output value Oi of the current connected starting node multiplied by the gradient information of the terminating node j, as follows
By defining , it could be simply understood as the contribution value to the Error function .
Therefore, the specific expression of the output layer could be summarized as follows:
The second to last hidden layer was:
The third to last hidden layer was:
where was the input of the third to last layer, i.e., the output of the fourth to last layer.
According to this rule, it was only necessary to iteratively calculate the , , equivalent of each node of each layer to obtain the Partial derivative of the current layer so as to obtain the gradient of the weight matrix W of each layer, and then, it iteratively optimized the network parameters through the gradient descent algorithm.
3.5. Evaluation Criterions Module
To verify the accuracy and effectiveness of ML, most scholars use a variety of evaluation criteria methods [43]. Therefore, this paper used the mean absolute error (MAE), mean square error (MSE), root mean square error (RMSE), and the regression determination coefficient (R2) to evaluate it. The expressions were as follows:
where was the real data, was model output data, was the average value of the real data.
4. Experimental Results and Analysis
4.1. Factor Analysis Results
The KMO value is greater than 0.60. At the same time, the p-values of the significance probability of the Bartlett test are 0.00. According to the measurement standard, the index variables used in this paper are suitable for factor analysis. Therefore, the indexes in this paper can be tested by data, and the factor analysis experiment can be carried out. According to the factor analysis, this paper obtained the evaluation results, as shown in Table 2.
From Table 2, it can be seen that there are significant differences in UAM scores among 21 cities in Guangdong Province from 2011 to 2020. The following points are found:
- (1)
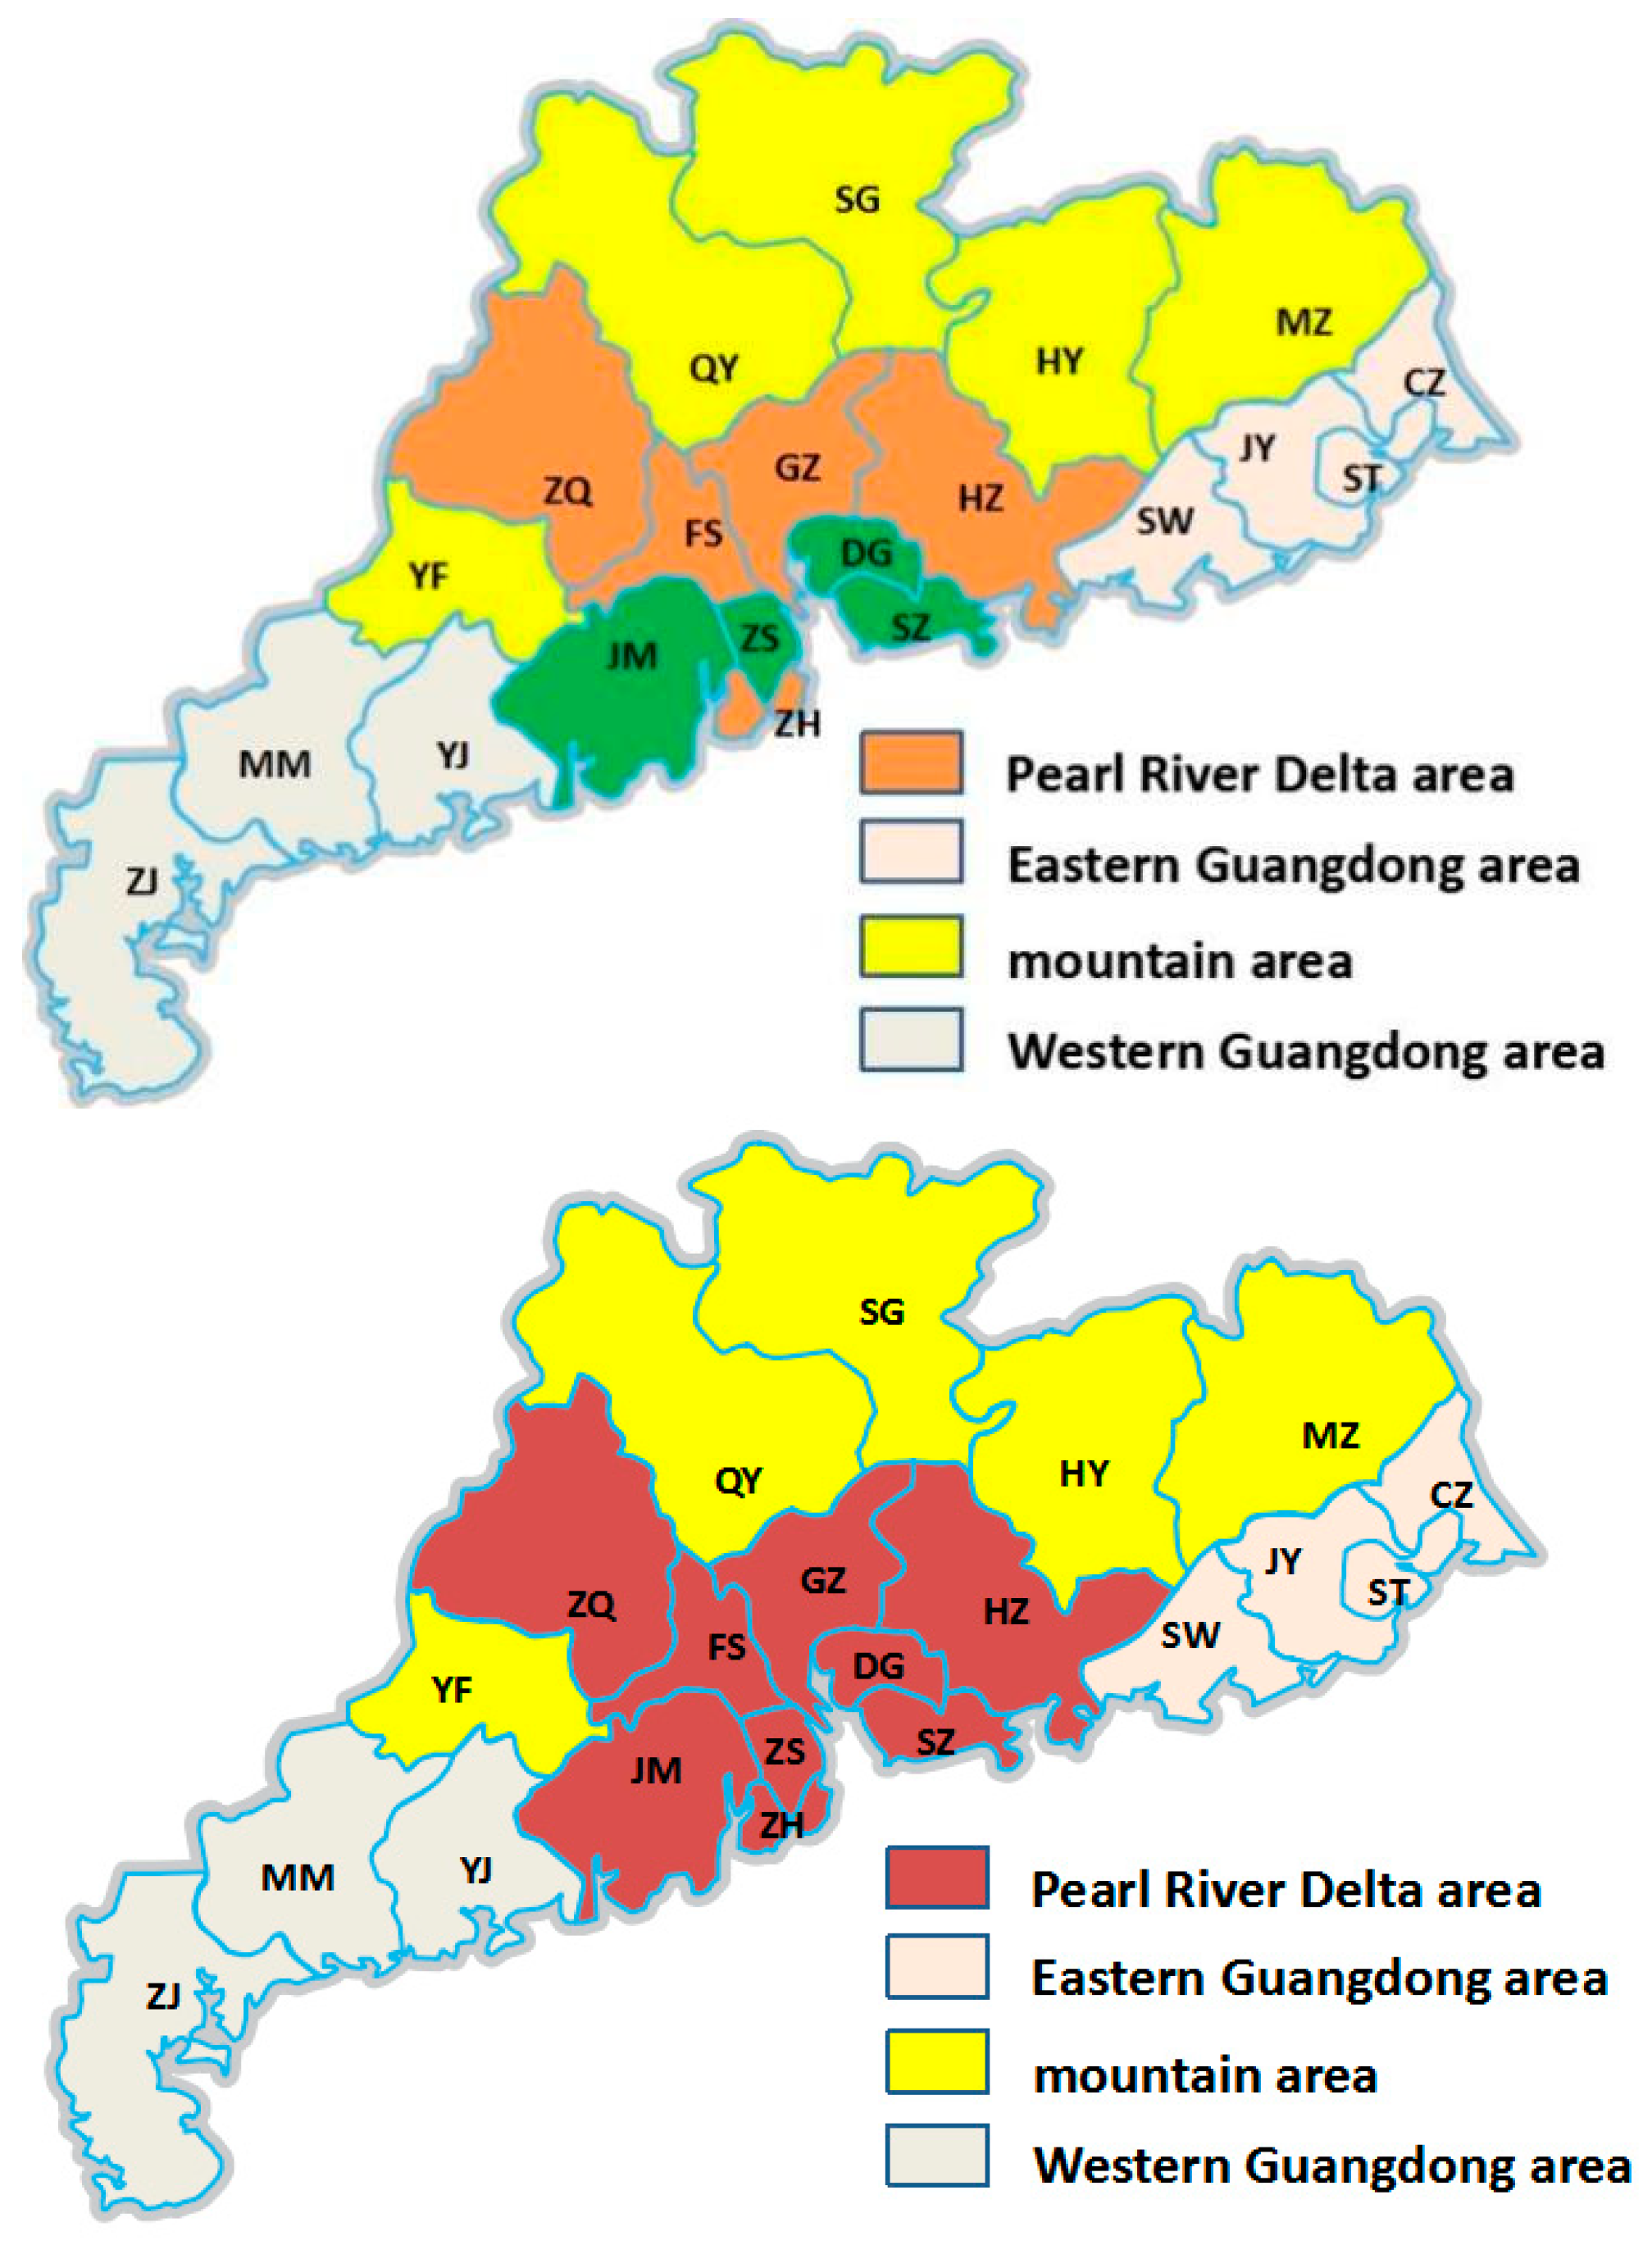
- The UAM in the Pearl River Delta region is generally in a leading position. SZ, GZ, FS, and DG have strong development, which is in line with the actual development situation. Based on Figure 3, it can be seen that these cities occupy the core position of GD and have the advantage of developing manufacturing. After years of development, both the manufacturing and information technology industries have dominated the local economy.
- (2)
- There is potential for the development of UAM in the eastern and western areas of GD. Based on Figure 3, JY is located in the central location of cities in the eastern GD area. It is in a leading position with overall strength still maintained, but its development potential is now relatively lower than that of ST. On the other hand, MM is located in the central area of three cities in the western GD area. Over time, the gap between its scores and those of the other two cities has gradually widened.
- (3)
- The overall development level of mountainous areas is not high, and it is necessary to increase the development of UAM. Based on Figure 3, it can be seen that cities in mountainous areas are relatively scattered and cannot form a central area for manufacturing factor resource aggregation like the other three areas. Compared to the other 16 cities, the 5 cities in this region are vast and sparsely populated and are located in a mountainous area to the north due to geographical limitations.
- (4)
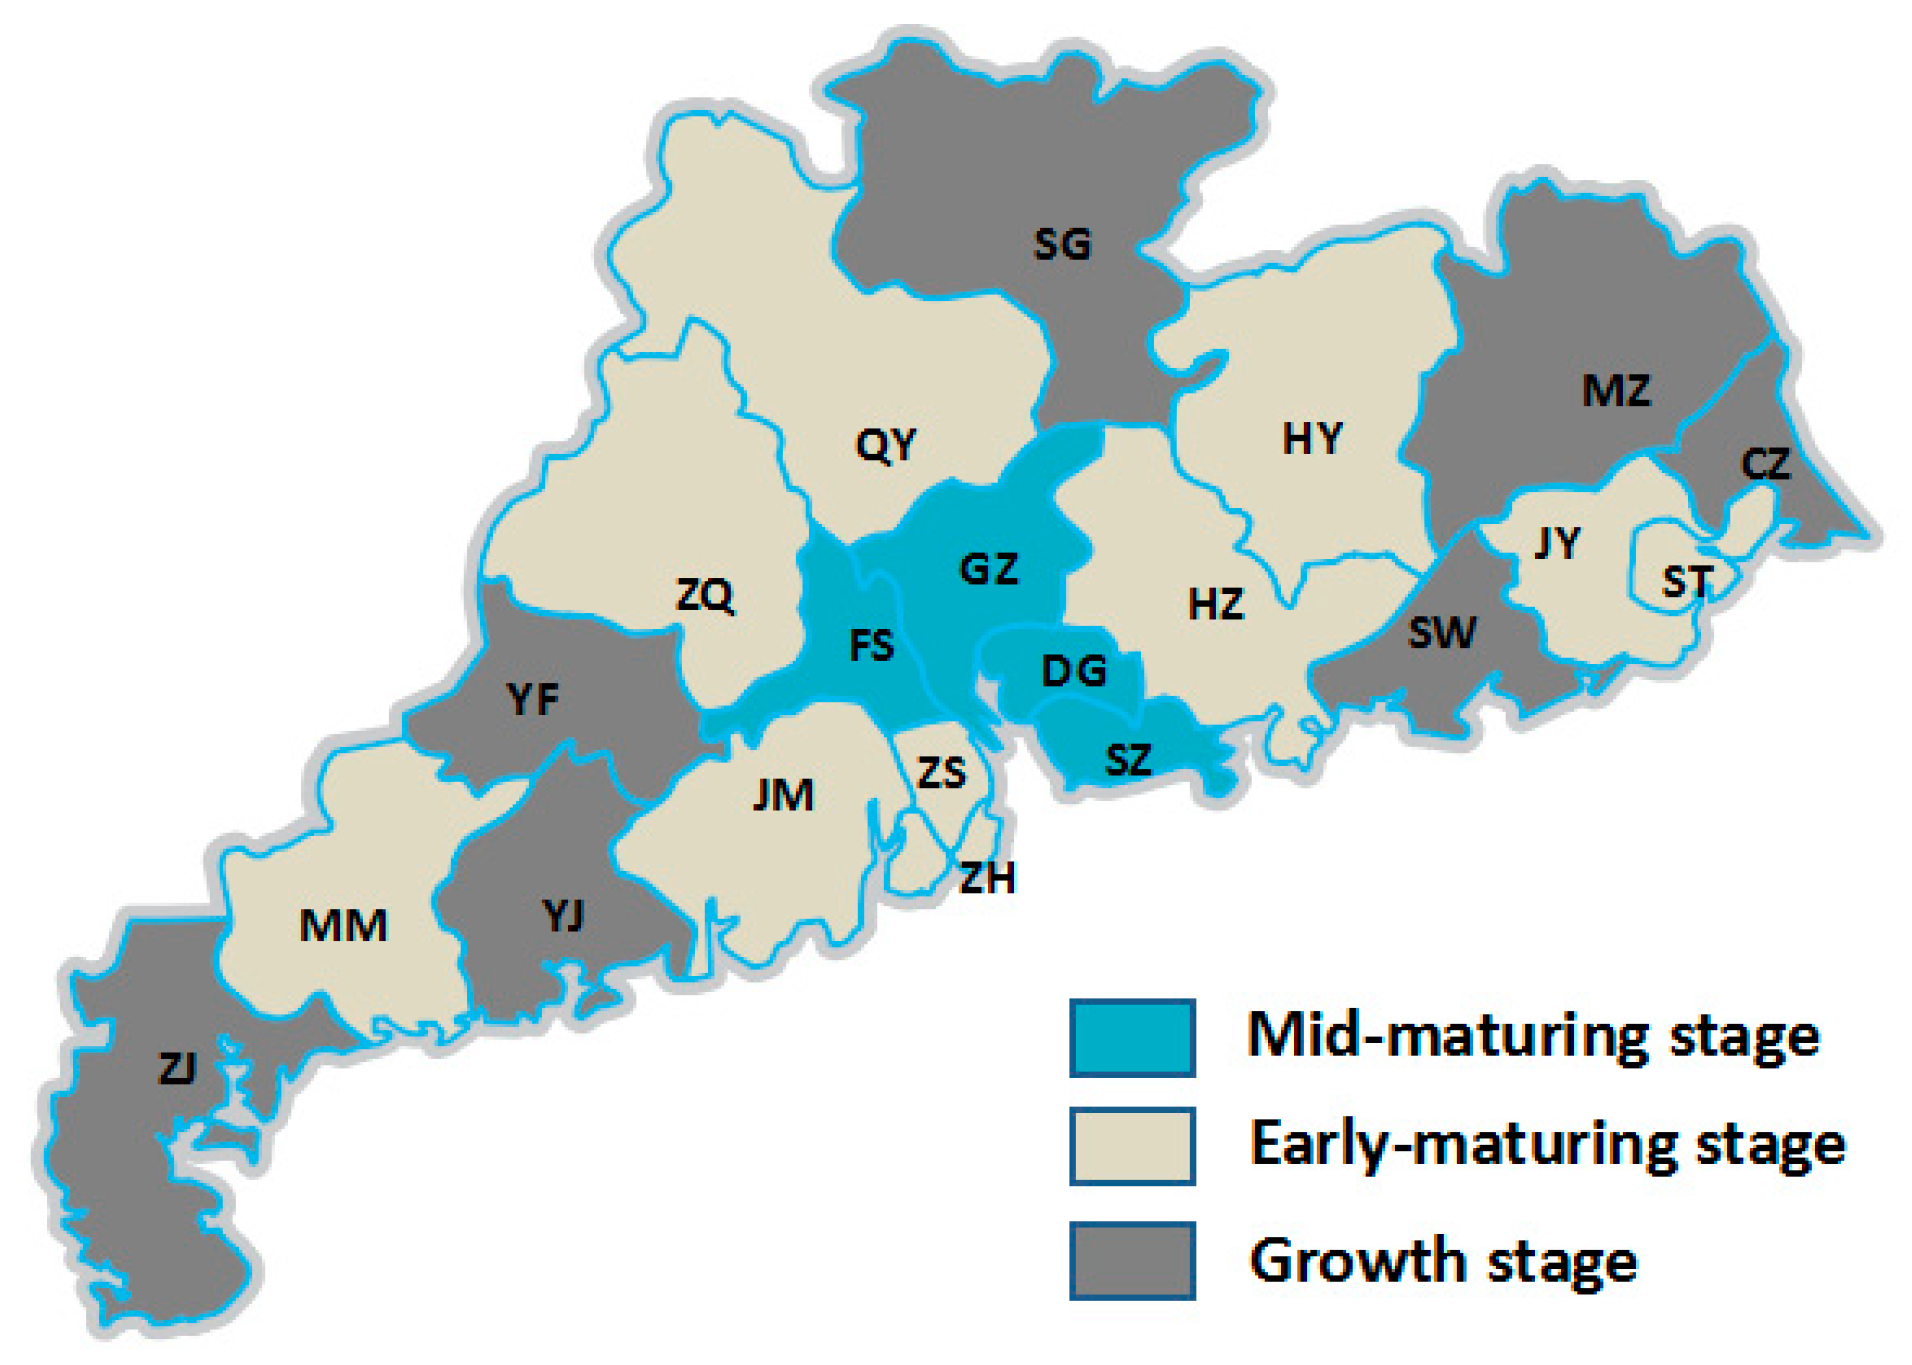
- In terms of the overall development level of GD, first, each area has its own cities with good development levels. Cities with higher levels of development in these regions have a demonstrative role and can lead the development of the region. Second, the scores of these cities have obvious periodicity. Even if leading cities in other regions have a lower level of development than the four leading cities in the Pearl River Delta, they are in the same stage of development as the remaining five cities. According to the life cycle theory, the four leading cities in the Pearl River Delta, GZ, SZ, FS, and DG, belong to the mid-maturing stage. Leading cities in other regions, such as MM, JY, ST, QY, and HY as well as the remaining five cities in the Pearl River Delta, are in the early-maturity stage. The remaining cities in GD belong to the growth stage. In the mid-maturing stage, cities not only have a spillover effect on the early-maturing stage, but also have a demonstrative effect on them. Similarly, cities in the early-maturing stage will also enable cities in the growth stage to learn and imitate them. Cities with different life cycles are shown in Figure 4.
4.2. Model Training
The deep learning module takes the results of factor analysis as the output variable Y, and uses alternative indicators M1, M2, and M3 corresponding to environmental, technical, and economic indicators as the input variables. Divide 210 data according to the two eight rule, namely 80% of the data are used as the training set, and 20% of the data are used as the test set. In addition, there are generally three experiences regarding the setting of a model network structure, namely the number of hidden layers and the number of neurons [44]:
(1) Scenario 1: The number of hidden layer neurons is equal to 60–80% of the number of input layer neurons;
(2) Scenario 2: The number of hidden layer neurons equals “2/3 × (number of input layer neurons) + 1”;
(3) Scenario 3: The number of hidden layer neurons is equal to twice the number of input layer neurons.
In the experiment, this article conducts sequential validation. Based on the experimental results (see from Table 3, Table 4 and Table 5), we found that the training results of the model do not improve as the number of hidden layers and neurons increases. When the hidden layer is 1 and the neuron is 6, the model training results are the best. At this point, the test results are MAE = 0.026, MSE = 0.001, RMSE = 0.034, R2 = 0.884. This indicates that the increase in the number of hidden layers in neural networks, which means that the network structure is complex, does not necessarily improve its prediction accuracy.
4.3. Model Comparison Results
To verify the accuracy of our model, this paper compares it with support vector regressor (SVR), K-nearest neighbor (KNN), eXtreme gradient boosting (Xgboost), and long–short term memory (LSTM). The input indexes of all models are consistent. To display the experimental results more intuitively, we use Table 6 to express the display.
Table 6 shows the accuracy of the different models. Our model can reach 0.026, 0.001, and 0.034 in MAE, MSE, and RMSE, respectively. It is significantly lower than SVR, KNN, Xgboost, and LSTM. Secondly, the R2 of our model is 0.884, which is much higher than that of other models. These results show that our model is more accurate in prediction, so it is scientific and reasonable to use it as a prediction model. It is worth noting that although the accuracy of the LSTM model is higher than traditional machine learning methods, it is lower than our model, indicating that the overly complex network model is not suitable for the problem in this study. It corresponds to the results found in Section 4.2. Although neural network models have better prediction performance than other machine learning models, they should not overly rely on complex network structure prediction data.
4.4. Prediction Results
In this step, we migrate ML training parameters for small sample cities to large sample mapping indicators. The mapping index M1–M3 is predicted and classified based on the training parameters. The number of other cities is 102.
Table 7 shows the data results of mapping indexes and predicted scores for 102 cities in the YREB. Table 8 shows the urban mapping indexes and factor analysis scores of 21 cities in GD. Through comparison, the following situations can be found:
In terms of environmental pollution, GD is much better than the YREB, with a maximum value lower than the average environmental indicators of the YREB, which indirectly indicates that GD’s manufacturing industry emphasizes green development. On the other hand, the difference between the three quantile of GD and the difference between the 75 percentile and the maximum is not significant, which indicates that the green transformation has become the goal of GD’s manufacturing development.
In terms of technological development, urban agglomerations in Guangdong Province are slightly higher than those in the YREB with a maximum value exceeding 60 while the maximum value of cities in the YREB only exceeds 50, but the average difference in technological development between the two urban agglomerations is not significant at 1. However, the cut-off points of the percentile of the M2 index of the two urban agglomerations are phased and are quite different from the maximum value, which indicates that the technological development within the urban agglomeration is unbalanced. On the other hand, the 25 and 50 percentile of urban agglomerations in the YREB are higher than those in GD, but the 75 percentile is lower than those in GD. This indicates that some cities in GD have relatively backward technological development while others have relatively high levels of technological development and severe polarization.
In terms of economic development, there is not much difference between GD and the YREB with the average and maximum values of urban clusters in the YREB slightly higher than those in GD. Although the cutoff points of the M3 index percentiles of the two urban agglomerations are similar, the 75 percentile and the maximum are quite different. The economic development strength of most cities in the two urban agglomerations is comparable, but some cities are far ahead, such as SZ in GD and Shanghai in the YREB.
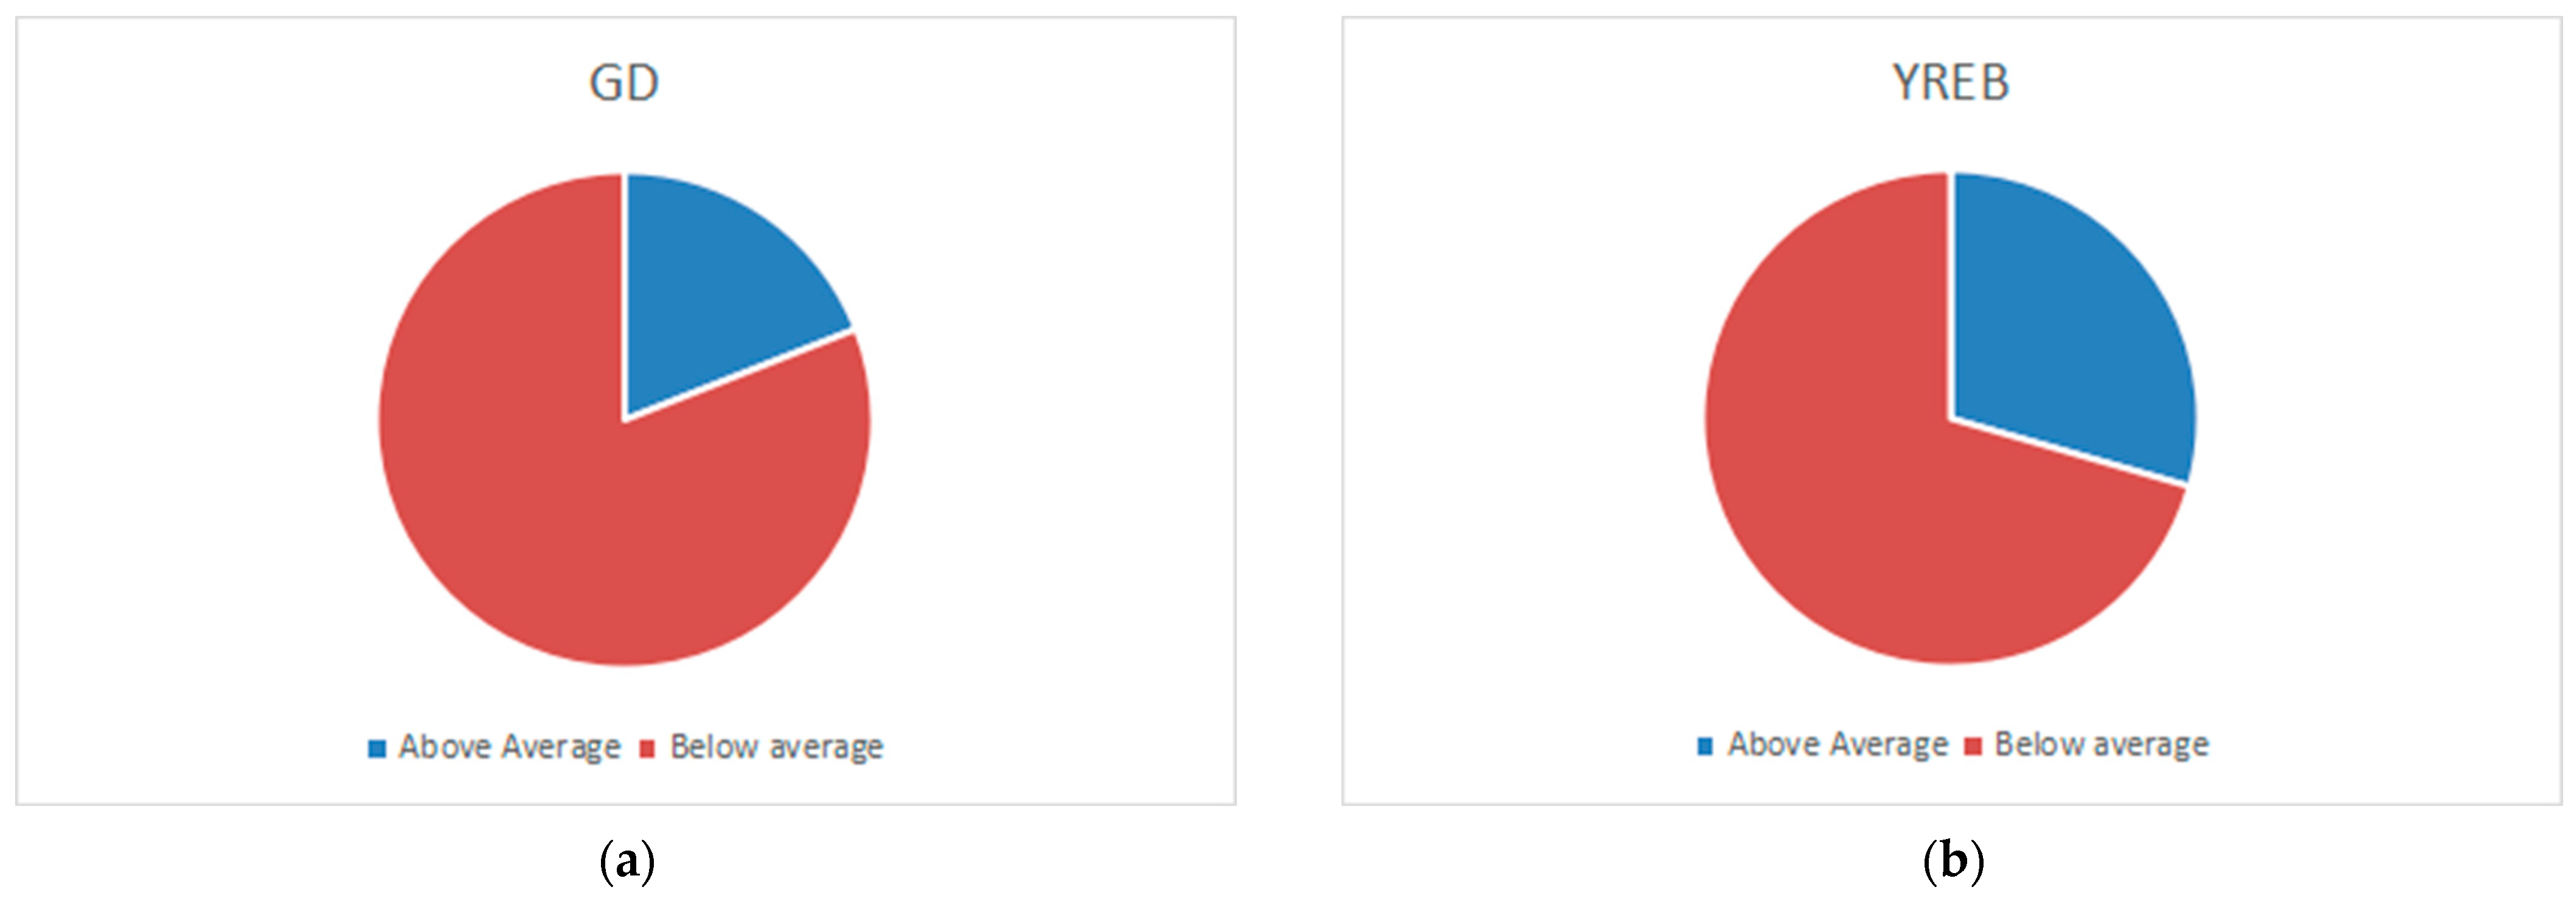
In terms of total score, the difference between their mean and percentile is not large. However, it can be seen from Figure 5 that there is a gap between the number of cities with different percentile in the two urban agglomerations. The proportion of cities above average in GD is relatively low, compared to YERB. This indicates that the UAM development of GD is not uniform. On the other hand, based on Table 7 and Table 8, the maximum value of UAM in GD is higher than that in the YREB. It indicates that the development of UAM in GD is phased and that there is a significant gap between leading cities and most cities. It can be used as a demonstration sample to drive the development of UAM in other areas. In addition, YERB’s 102 cities scored between GD’s 21 cities. Therefore, YERB’s cities can refer to the 21 cities corresponding to their UAM for imitation and learning.
4.5. Analysis
According to the life cycle theory, this article divides GD’s UAM into three stages based on the development level of UAM. Among them, the four cities that are far ahead are in the mid-maturing stage. Cities with a moderate score, namely the remaining five cities in the Pearl River Delta and leading cities in other regions, are in the early-maturing stage. Cities with lower scores are in their growth stage. Based on this, this article proposes corresponding development paths.
4.5.1. The Development Path of the Mid-Maturing Cities
The mid-maturing cities have strong technological strength in the manufacturing, with superior location and a complete manufacturing system. Their technology-based manufacturing industry has a high reputation with a certain industrial scale and influence. Therefore, they can use the manufacturing industry as a carrier for technological transformation and innovation, achieving industrial spatial layout and all-round development so that different industries can form complementary advantages. Specific development suggestions are as follows:
(1) They have advantages in green areas and are suitable for breakthrough and innovative development. In the process of manufacturing development, solving environmental and resource problems requires scientific and technological support. Green technology is a key factor in coordinating the economic development of the manufacturing industry with green development. Therefore, these mid-maturing cities should adhere to supporting green development through technological innovation, thereby promoting the development of UAM. At this stage, manufacturing enterprises need to aim to improve resource utilization and green governance, establish technological innovation mechanisms, implement the concept of green development, and improve the level of green technological innovation in enterprises. Ultimately, the impact of UAM on the ecological environment is reduced, achieving a balance between manufacturing development and environmental protection, and achieving sustainable development.
(2) They have significant technological advantages and can enhance their ability to innovate and develop technology. In UAM, manufacturing enterprises should be the main body, market demand should be the target orientation, and an integrated technology integration system of industry, academia, and research should be constructed to promote the overall technological innovation and development of regional manufacturing industry. Specifically, at this stage, by mastering the current technological development status of the manufacturing industry, comparing and analyzing the technological advantages and bottleneck technology areas. These mid-maturing cities should encourage leading manufacturing enterprises to draw industry technology maps, prioritize key bottleneck technologies as future key research content, and use this to promote the upgrading of the manufacturing value chain and move towards high-end fields. This can not only drive the advancement of UAM technology, but also extend to the overall industrial cluster and adjacent regional industries in the region, thereby improving the level of technological development in the region and adjacent regions.
(3) The development of their industrial economy is relatively advantageous, and it is necessary to strengthen the interaction between upstream and downstream manufacturing enterprises in the cluster industry chain, improve innovation efficiency, promote the efficient flow of innovation factors between industries, and achieve the sharing of innovation resources, technology spillovers, and knowledge diffusion within the cluster, thereby continuously enhancing the regional industrial technology innovation capability. On this basis, the manufacturing industry should break through the geographical distance limitations between regions, achieve cluster cross regional cooperation, carry out platform construction cooperation, strengthen inter regional industrial cluster interconnection and information sharing, and thus promote the development of UAM. In addition, to accelerate the development of Technological convergence, their manufacturing industry should be actively embedded in the global value chain, carry out technology exchange and cooperation with developed manufacturing countries, and improve the technology level of cross-border manufacturing industry so as to occupy the dual end position of the value chain. At the same time, they can fully leverage their strong industrial radiation effect to achieve spillover effects in the industrial economic space of the region and drive the development of surrounding cities through the manufacturing industry.
4.5.2. The Development Path of the Early-Maturing Cities
In the early-maturing stage, the development level of UAM in cities is moderate with relatively abundant traditional manufacturing resources and even distribution of industrial resource elements. These cities have typical pillar traditional industries and enjoy a high reputation among them. It can be linked with the manufacturing industry, integrate relevant industrial resources within the region, closely integrate and coordinate development, and promote UAM development by cultivating emerging industries.
(1) There are still some shortcomings in their green development, and coordination with environmental development should be strengthened. In the path of collaborative development in the UAM, it is necessary to coordinate the relationship between environmental protection and manufacturing development, improve sustainable development capabilities, and carry out pollution prevention and control in the rational development and utilization of resources, implementing environmental protection into specific practices. Through the scientific adjustment of environmental regulation and green assessment methods, it should promote the structural adjustment and innovation of the manufacturing, to efficiently use resources, control pollution and waste generation, promote environmental green development, and achieve coordination between regional manufacturing and green environment.
(2) These cities should cultivate and enhance their awareness of manufacturing innovation, comprehensively enhance their technological innovation capabilities and industry competitive advantages, and optimize and transform traditional manufacturing industries through technological innovation. This can enhance the transfer of manufacturing industry from labor-intensive to technology-intensive, reasonably promote product structure optimization, and jointly promote the UAM. Based on this, such cities can cultivate a batch of intelligent, flexible, and precise new manufacturing industries; form product advantages; and enhance competitiveness. At the same time, they should also upgrade their production service industry technology to provide convenient and high-quality services for the development of the UAM.
(3) In terms of industrial economy, cities in the early-maturing stage are relatively weak, so it is necessary to promote the integration of manufacturing industry. In the integrated development of the manufacturing industry, they should rely on it to improve the manufacturing system and attract more manufacturing related enterprises and auxiliary R and D enterprises to gather around it. By breaking through the previous single mode of manufacturing agglomeration, guiding the rational and orderly development of different industries, and optimizing and restructuring resource allocation between industries, such cities can achieve manufacturing resource matching, further tap into the potential and space of manufacturing development, and create a good manufacturing cluster ecology. Ultimately, they can build a complete industrial chain within the cluster ecosystem, forming manufacturing advantages with regional industrial influence, which can promote the development of UAM.
4.5.3. The Development Path of the Growth Cities
The UAM development foundation of cities in the growth stage is weak, and they should rely on the manufacturing industry within the region and integrate and plan resources around the manufacturing industry. Based on this, they can gradually improve the level of manufacturing infrastructure construction, improve the support service system, and promote the development of the manufacturing industry.
(1) They should strive to improve the quality of the ecological environment. The “high investment, high pollution, and low efficiency” model in the basic development process of the manufacturing industry has caused serious damage to the ecological environment. It is necessary to improve environmental regulations around the manufacturing industry, focus on protecting the regional ecological environment, and effectively solve prominent problems, such as wastewater discharge, air pollution, and waste generation in the manufacturing industry.
(2) Their technological development level is slightly lower than that of mature mid stage cities, and they should introduce and absorb advanced technologies. In their UAM, technology should be introduced and absorbed to promote the transformation and upgrading of it. Specifically, technology introduction can enable the manufacturing industry to achieve technological achievements. In the basic development stage, it can save a lot of time, eliminate the need for repetitive technological research and development, fill the gap in traditional industry technology, and achieve a transition from scratch to skip the traditional technological development stage. On this basis, technology is digested and absorbed, gradually mastering the introduction of technology, thereby improving the technical level of manufacturers, enhancing labor productivity, enhancing industrial competitiveness, and laying the foundation for independent innovation research in the UAM.
(3) Such cities should enhance the level of manufacturing agglomeration. In the basic development path of the manufacturing industry, it is necessary to promote the development of industrial clusters and provide spatial carriers for industrial development by forming large-scale manufacturing clusters. On the one hand, by promoting the circulation of product elements through agglomeration, they can reasonably allocate resources, release the vitality of manufacturing enterprises, improve product production efficiency, and increase enterprise benefits. On the other hand, the more obvious agglomeration effect will attract numerous resource elements, their related infrastructure will gradually improve, and the production supporting service industry will also gradually increase, thereby promoting the development of the manufacturing industry.
It is worth noting that although the above development path is proposed using 21 cities in GD as a sample, YERB’s 102 cities can match the development path based on the predicted score.
5. Discussion
There are two innovations in this article compared to existing research, namely methods and evaluation systems. The details are as follows:
(1) In terms of research methods, the current research methods for industrial evaluation include a factor analysis [45], DEA [26], and AHP [5] method, which rely on indicator data. However, due to the large number of cities in China, the statistical indicators of each city are not necessarily the same. It is difficult to conduct a comprehensive evaluation through the above methods.
The advantage of deep learning methods is that they can effectively solve the problem of sample size [6]. This allows for the evaluation of large sample data through a small amount of sample data. Specifically, a small number of mapping indicators are used to match the evaluation results. Through model training, these indicators can be used to predict the evaluation results of other cities, which overcomes the problem of a lack of sample indicators. By comparing the other models, the prediction results of ML method are more accurate. This expands the evaluation method. By using small sample data to predict large sample results, the problem of mismatched indicators among different cities is compensated for. This provides an innovative perspective and expands the research method in this field.
(2) In terms of evaluation system, this article expands the research on UAM from the perspective of PPM theory. Previous studies have mostly focused on PEST [46], SWOT [47], and Diamond Theory [48]. However, existing theories mostly focus on the factors that initially affect the industry, often neglecting the dynamic situation that promotes or hinders the industry. Subsequently, scholars began to introduce PPM theory into this research field, constructing it from economic, technological, and environmental perspectives, but there is still room for expansion of indicators. Based on this, this article adds new indicators on the basis of the previous studies. For example, using policy texts to extract low-carbon indicators [37] and intelligent manufacturing indicators [40], calculating the number of scientific research cooperation networks in different cities based on web of science [49], and measuring the carbon emissions of each city [36], thus enriching the indicator system of UAM.
6. Conclusions
This paper makes an in-depth study of UAM. By sorting out the literature, we define the concept of UAM and establish the evaluation system of influencing factors. In this context, we construct an evaluation system and use a small number of sample cities to analyze the evaluation results. In addition, the ML is constructed to predict the evaluation results of other cities, which can overcome the problem of the lack of data samples. The results show that:
(1) From the current development status of UAM in GD, cities in the Pearl River Delta region occupy a dominant position. Cities in eastern and western GD are uneven, and there is a lack of development momentum in mountainous cities. However, cities in eastern and western regions have strong development potential to lead cities. This indicates that each region has cities with high levels of development and has a demonstrative role. In addition, the UAM of these cities has obvious periodicity, which can be explained according to the life cycle theory, namely the mid-maturing stage, the early-maturing stage, and the growth stage.
(2) By comparison, it was found that the overall development level of UAM in GD is not significantly different from that of the YREB. However, due to significant differences in their extreme values, the proportion of cities above the average in the overall population is relatively small. This indirectly proves that there is a significant gap between GD’s leading cities and most cities, that is, GD’s UAM not only has a phased nature, but also has a demonstrative role.
(3) We introduce the ML method to expand existing evaluation methods and compensate for the problem of mismatched indicators among cities. The prediction effect of our model is better than the other method. This indicates that although neural network models have better prediction performance than other machine learning models, they should not overly rely on complex network structure prediction data. Its reliability is verified.
Although this study is limited to urban areas as a whole, through further research, this knowledge can be adopted and verified in specific industries. For example, different manufacturing sectors also have different development bases. By evaluating the specific sector data of small sample cities, the evaluation system can also be used to predict the development of the same sector in other cities. Therefore, this case study is about UAM, but not limited to this. It is also very useful for other research objects. For example, in the future, we can study the development status of the specific manufacturing sector. In addition, in the future, relevant field datasets will be continuously expanded to apply this research method to more datasets for validation.
Author Contributions
Conceptualization, Z.D. and Y.S.; methodology, Z.D.; software, Z.D. and Z.Z.; validation, Z.D., Y.S. and Z.Z.; formal analysis, Z.D.; investigation, Z.D.; resources, J.Z.; data curation, Z.D.; writing—original draft preparation, Z.D.; writing—review and editing, Z.D., J.Z., Y.S. and Z.Z.; visualization, Z.D.; supervision, J.Z. and Y.S.; project administration, Y.S.; funding acquisition, Y.S. All authors have read and agreed to the published version of the manuscript.
Funding
This research was funded by the National Natural Science Foundation Project under grant number 52275479; the Guangdong Provincial Regional Joint Fund under grant number 2022B1515120060. the Guangzhou Foundation Project under grant number 20220602JBGS04.
Institutional Review Board Statement
Not applicable.
Informed Consent Statement
Not applicable.
Data Availability Statement
The data in this paper are from the statistics bureau of Guangdong (http://stats.gd.gov.cn; accessed on 3 March 2022); China urban statistical yearbook (http://www.tjcn.org; accessed on 3 March 2022); Washington University in St. Louis (https://sites.wustl.edu/acag; accessed on 3 March 2022).
Acknowledgments
The authors thank the editor and anonymous reviewers for their numerous constructive comments and encouragement that have improved our paper greatly. In addition, they thank the members of the research center for their suggestions.
Conflicts of Interest
The authors declare no conflict of interest.
References
- Guo, K.; Peng, J. The Manufacturing Sector’s strategic Position and Role in China’s New Stage of Development. Soc. Sci. China 2021, 5, 128–149+207. [Google Scholar]
- Li, B.; Liu, Z. Measurement and Evolution of High-quality Development Level of Marine Fishery in China. Chin. Geogr. Sci. 2022, 32, 251–267. [Google Scholar] [CrossRef] [PubMed]
- Hu, W.Q.; Jin, T.; Liu, Y. Effects of environmental regulation on the upgrading of Chinese manufacturing industry. Environ. Sci. Pollut. Res. 2019, 26, 27087–27099. [Google Scholar] [CrossRef] [PubMed]
- Yu, K.; Zhang, W.M.; Zhang, Y.L. Carbon Performance Evaluation of Automobile Manufacturing Industry in Green Supply Chain. In Proceedings of the International Conference on Robots and Intelligent System (ICRIS), Haikou, China, 15–16 June 2019; pp. 405–408. [Google Scholar]
- Yan, Y.; Chu, D.J. Evaluation of Enterprise Management Innovation in Manufacturing Industry Using Fuzzy Multicriteria Decision-Making under the Background of Big Data. Math. Probl. Eng. 2021, 3, 2163–2190. [Google Scholar] [CrossRef]
- Zheng, W.; Tian, X.; Yang, B.; Liu, S.; Ding, Y.; Tian, J.; Yin, L. A Few Shot Classification Methods Based on Multiscale Relational Networks. Appl. Sci. 2022, 12, 4059. [Google Scholar] [CrossRef]
- Jia, F.; Ma, X.; Xu, X. The Differential Role of Manufacturing and Non-manufacturing TFP Growth in Economic Growth. Struct. Change Econ. Dyn. 2019, 52, 174–183. [Google Scholar] [CrossRef]
- Xin, G.B. Promote high-quality development of manufacturing industry. Macroecon. Manag. 2019, 2, 5–7. [Google Scholar]
- Liu, G.X.; Wang, J.; Jiang, L.W. Theoretical mechanism and evaluation analysis of high-quality development of China’s manufacturing industry. Ind. Econ. 2020, 3, 20–24. [Google Scholar]
- Zhang, X.F.; Fan, D.C. Research on the influence mechanism of heterogeneous environmental regulation on the manufacturing equipment industry in Asia-Pacific countries. Clean Technol. Environ. Policy 2023, 25, 1737–1752. [Google Scholar] [CrossRef]
- Xie, B.; Yang, C.; Song, W.; Song, L.; Wang, H. The impact of environmental regulation on capacity utilization of China’s manufacturing industry: An empirical research based on the sector level. Ecol. Indic. 2023, 148, 110085. [Google Scholar] [CrossRef]
- Wen, H.W.; Wen, C.Y.; Lee, C.C. Impact of digitalization and environmental regulation on total factor productivity. Inf. Econ. Policy 2022, 61, 101007. [Google Scholar] [CrossRef]
- Lena, D.; Pasurka, C.A.; Cucculelli, M. Environmental regulation and green productivity growth: Evidence from Italian manufacturing industries. Technol. Forecast. Soc. Chang. 2022, 184, 121993. [Google Scholar] [CrossRef]
- Popov, A.A.; Karataeva, T.A.; Danilova, E.V.; Myreev, A.N.; Sergeeva, V.V. Diversification as a factor in the efficient economic development of the republic of Sakha (Yakutia), Russia. J. East. Eur. Cent. Asian Res. 2022, 9, 183–193. [Google Scholar] [CrossRef]
- Li, N.; Yang, R. Industrial Agglomeration and Upgrading of Manufacturing Global Value Chain Status: Impact Mechanism and Empirical Test. J. Nanjing Univ. Financ. Econ. 2021, 9, 87–97. [Google Scholar]
- Li, S.; You, W. Can Industrial Agglomeration Promote Innovation in Manufacturing Enterprises. Res. Financ. Econ. Issues 2018, 4, 30–38. [Google Scholar]
- Lo, K.L.; Zhang, J.J.; Xia, F. Does digital technology innovation work better for industrial upgrading? An empirical analysis of listed Chinese manufacturing firms. Appl. Econ. Lett. 2022. [Google Scholar] [CrossRef]
- Li, C.Q.; Chen, Y.Q.; Shang, Y.L. A review of industrial big data for decision making in intelligent manufacturing. Eng. Sci. Technol.-Int. J.-Jestech 2022, 29, 101021. [Google Scholar] [CrossRef]
- Von Joerg, G.; Carlos, J. Design Framework for the Implementation of AI-based (Service) Business Models for Small and Medium-sized Manufacturing Enterprises. J. Knowl. Econ. 2022. [Google Scholar]
- Wang, K.L.; Sun, T.T.; Xu, R.Y. The impact of artificial intelligence on total factor productivity: Empirical evidence from China’s manufacturing enterprises. Econ. Change Restruct. 2022, 56, 1113–1146. [Google Scholar] [CrossRef]
- Leoni, L.; Ardolino, M.; El Baz, J.; Gueli, G.; Bacchetti, A. The mediating role of knowledge management processes in the effective use of artificial intelligence in manufacturing firms. Int. J. Oper. Prod. Manag. 2022, 42, 411–437. [Google Scholar] [CrossRef]
- Li, H.; Xu, W.; Zhang, Y.; Wu, T. Evaluation of Factors Influencing the Sustainable Development of the Marine Equipment Manufacturing Industry Cluster. J. Coast. Res. 2020, 106, 440–444. [Google Scholar] [CrossRef]
- Yin, J.Y.; Wang, D. Dynamic evaluation of green innovation efficiency of patent-intensive industries: Evidence from the new equipment manufacturing. Technol. Anal. Strateg. Manag. 2021. [Google Scholar] [CrossRef]
- Singh, A.; Askary, Z.; Gupta, S.; Sharma, A.K.; Shrivastava, P. AHP Based Model for Evaluation of Sustainable Manufacturing Enablers in Indian Manufacturing Companies. Adv. Ind. Prod. Eng. 2018, 2019, 397–403. [Google Scholar]
- Patalas-Maliszewska, J.; Losyk, H.; Jasiulewicz-Kaczmarek, M. A Sustainable Development Evaluation Card for a Manufacturing Company. Ifac Pap. 2020, 53, 10468–10473. [Google Scholar] [CrossRef]
- Chen, X.; Liu, X.; Wang, W.; Gong, Z. Behavioral DEA model and its application to the efficiency evaluation of manufacturing transformation and upgrading in the Yangtze River Delta. Soft Comput. 2020, 24, 10721–10738. [Google Scholar] [CrossRef]
- Dou, Z.; Sun, Y.; Wang, T.; Wan, H.; Fan, S. Exploring Regional Advanced Manufacturing and Its Driving Factors: A Case Study of the Guangdong-Hong Kong-Macao Greater Bay Area. Int. J. Environ. Res. Public Health 2021, 18, 5800. [Google Scholar] [CrossRef]
- Zhen, Z. Competitiveness Model of Chinese Port Manufacturing Industry Based on Global Value Chain. J. Coast. Res. 2020, 103, 701–704. [Google Scholar] [CrossRef]
- Jin, Q. Measurement and Promotion of the Transformation and Upgrading Effect of Marine Manufacturing Industry. J. Coast. Res. 2020, 81–84. [Google Scholar] [CrossRef]
- Sun, X.D.; Jia, X.F.; Rong, Y.F. Maturity evaluation in China’s low carbon energy industry. Clean. Energy Clean. Cities 2018, 152, 709–714. [Google Scholar] [CrossRef]
- Liu, X.L.; Xu, Y. Progressiveness status, problems and countermeasures of equipment manufacturing industry on the west bank of the Pearl River. Sci. Technol. Prog. Policy 2018, 35, 48–53. [Google Scholar]
- Li, L.S.; Yang, C.H.; Liu, J. Evaluation of the Comprehensive Development Capability of Regional Manufacturing Industry in China: An Empirical Analysis Based on Manufacturing Industries in the East, Central, and West Regions. China Soft Sci. 2014, 2, 121–129. [Google Scholar] [CrossRef]
- Yang, F.; Sun, Y.; Zhang, Y.; Wang, T. Factors Affecting the Manufacturing Industry Transformation and Upgrading: A Case Study of Guangdong-Hong Kong-Macao Greater Bay Area. Int. J. Environ. Res. Public Health 2021, 18, 7157. [Google Scholar] [CrossRef] [PubMed]
- Wang, L.H.; Wang, Z.; Ma, Y.T. Does environmental regulation promote the high-quality development of manufacturing? A quasi-natural experiment based on China’s carbon emission trading pilot scheme. Socio-Econ. Plan. Sci. 2022, 81, 101216. [Google Scholar] [CrossRef]
- Su, Y.W. Evaluation of High Quality Development of Manufacturing Industry in Central China: Analysis from 2007 to 2018. Econ. Probl. 2020, 9, 85–91+117. [Google Scholar]
- Avenyo, E.K.; Tregenna, F. Greening manufacturing: Technology intensity and carbon dioxide emissions in developing countries. Appl. Energy 2022, 324, 119726. [Google Scholar] [CrossRef]
- Li, C.; Xia, W.J.; Wang, L.P. Synergies of green policies and their pollution reduction effects: Quantitative analysis of China’s green policy texts. J. Clean. Prod. 2023, 412, 137360. [Google Scholar] [CrossRef]
- Dou, Z.X.; Sun, Y.M. Situation Analysis and Development Strategy of Advanced Manufacturing Industry in Regional Cities: Based on 9 cities in the Pearl River Delta of Guangdong–Hong Kong–Macao Greater Bay Area. Sci. Technol. Manag. Res. 2020, 40, 68–74. [Google Scholar]
- Fu, W.Z.; Chu, L.P. Evaluation of High Quality Development of Manufacturing Industry from the Perspective of Yangtze River Delta Integration: Topsis Evaluation Model Based on Improved CRITIC Entropy Weight Combination Weights. J. Ind. Technol. Econ. 2020, 39, 145–152. [Google Scholar]
- Liu, J.; Yang, Y.J.; Cao, Y.R. Forrest Jeffrey Yi-Lin. Stimulating effects of intelligent policy on the performance of listed manufacturing companies in China. J. Policy Model. 2021, 43, 558–573. [Google Scholar] [CrossRef]
- Liu, X.; Zhang, X. Industrial agglomeration, technological innovation and carbon productivity: Evidence from China. Resour. Conserv. Recycl. 2021, 166, 105330. [Google Scholar] [CrossRef]
- Li, G.; Fang, C.; He, S. The influence of environmental efficiency on PM2.5 pollution: Evidence from 283 Chinese prefecture-level cities. Sci. Total Environ. 2020, 748, 141549. [Google Scholar] [CrossRef] [PubMed]
- Dou, Z.; Sun, Y.; Zhang, Y.; Wang, T.; Wu, C.; Fan, S. Regional industry demand forecasting: A deep learning approach. Appl. Sci. 2021, 11, 6199. [Google Scholar] [CrossRef]
- Zhang, W.F. MATLABneural Network Programming; Chemical Industry Press: Beijing, China, 2011. [Google Scholar]
- Qiu, S.B.; Liu, Y.; Ye, Y. Analyzing the Sustainability of Water-Cultural Industry and Their Influencing Factors in China. J. Interconnect. Netw. 2022, 22, 2144001. [Google Scholar] [CrossRef]
- Khatami, F.; Ricciardi, F.; Cavallo, A.; Cantino, V. Effects of globalization on food production in five European countries. Br. Food J. 2022, 124, 1569–1589. [Google Scholar] [CrossRef]
- Beraud, J.; Zhao, X.; Wu, J. Revitalization of Chinese’s manufacturing industry under the carbon neutral goal. Environ. Sci. Pollut. Res. 2022, 29, 66462–66478. [Google Scholar] [CrossRef]
- Wu, B.; Young-Myung, Y. A Study on Enhancing National Competitiveness of China’s Eco-friendly Automobile Industry: Focusing on the Porter’s Diamond Model. J. Econ. Stud. 2022, 40, 149–168. [Google Scholar] [CrossRef]
- Chen, W.; Yan, Y. New components and combinations: The perspective of the internal collaboration networks of scientific teams. J. Informetr. 2023, 17, 101407. [Google Scholar] [CrossRef]
Figure 1.
The research framework.

Figure 2.
The network structure of deep learning model.

Figure 3.
Distribution of urban agglomeration in GD.

Figure 4.
Development stage of UAM in GD.

Figure 5.
Figure 5. Proportion of cities with average scores of different urban agglomerations. (a) GD. (b) YRED.
Figure 5.
Figure 5. Proportion of cities with average scores of different urban agglomerations. (a) GD. (b) YRED.

Table 1.
Variable description.
| Specific Indicators | Indicator Direction | References | |
|---|---|---|---|
| Economics index | Value-add of industrial enterprises above designated size (X1) | Positive | Liu et al. (2018) [31] Li et al. (2014) [32] Yang et al. (2021) [33] Wang et al. (2022) [34] |
| Total profits of industrial enterprises above designated size (X2) | Positive | ||
| Overall labor productivity of industrial enterprises above designated size (X3) | Positive | ||
| Investment in fixed assets by manufacturing (X4) | Positive | ||
| Industrial structure sophistication (X5) | Positive | ||
| Environmental index | Discharge of industrial waste water (X6) | Negative | Su et al. (2020) [35] Dou et al. (2021) [27] Avenyo et al. (2022) [36] Li et al. (2023) [37] |
| Discharge of industrial solid waste produced (X7) | Negative | ||
| Discharge of industrial waste gas (X8) | Negative | ||
| Low carbon policy text (X9) | Positive | ||
| CO2 emissions from industrial production processes (X10) | Negative | ||
| Technical index | Value added of advanced manufacturing industry (X11) | Positive | Dou et al. (2020) [38] Fu et al. (2020) [39] Liu et al. (2021) [40] |
| Value added of high-tech industry (X12) | Positive | ||
| Internal expenditure on R&D by industrial enterprises (X13) | Positive | ||
| Sale revenue of new products by industrial enterprises (X14) | Positive | ||
| Intelligent manufacturing policy text (X15) | Positive | ||
| Scientific collaboration network (X16) | Positive |
Table 2.
The evaluation results.
| Guangzhou (GZ) | Shenzhen (SZ) | Zhuhai (ZH) | Shantou (ST) | Foshan (FS) | Shaoguan (SG) | Heyuan (HY) | |
| 2011 | 0.2686 | 0.3098 | 0.0910 | 0.0630 | 0.1858 | −0.0001 | 0.0557 |
| 2012 | 0.2619 | 0.3267 | 0.0932 | 0.0895 | 0.1898 | 0.0014 | 0.0576 |
| 2013 | 0.2873 | 0.3564 | 0.0995 | 0.0868 | 0.2108 | 0.0287 | 0.0805 |
| 2014 | 0.2777 | 0.3858 | 0.1170 | 0.0999 | 0.2426 | 0.0354 | 0.0956 |
| 2015 | 0.2986 | 0.4268 | 0.1249 | 0.1151 | 0.2752 | 0.0310 | 0.0996 |
| 2016 | 0.3215 | 0.4697 | 0.1528 | 0.1187 | 0.2937 | 0.0242 | 0.1203 |
| 2017 | 0.3372 | 0.5242 | 0.1550 | 0.1476 | 0.2900 | 0.0467 | 0.1112 |
| 2018 | 0.3587 | 0.5573 | 0.1427 | 0.1545 | 0.2953 | 0.0492 | 0.1172 |
| 2019 | 0.3886 | 0.5714 | 0.1560 | 0.1651 | 0.3121 | 0.0583 | 0.1158 |
| 2020 | 0.4237 | 0.5948 | 0.1681 | 0.1451 | 0.2946 | 0.0550 | 0.1411 |
| Meizhou (MZ) | Huizhou (HZ) | Shanwei (SW) | Dongguan (DG) | Zhongshan (ZS) | Jiangmen (JM) | Yan jiang (YJ) | |
| 2011 | −0.0054 | 0.1185 | 0.0739 | 0.1057 | 0.1098 | 0.0844 | 0.0598 |
| 2012 | 0.0078 | 0.1153 | 0.0540 | 0.1204 | 0.1100 | 0.0718 | 0.0776 |
| 2013 | 0.0294 | 0.1373 | 0.0741 | 0.1521 | 0.1081 | 0.0947 | 0.0808 |
| 2014 | 0.0383 | 0.1428 | 0.0777 | 0.1430 | 0.1251 | 0.0945 | 0.0791 |
| 2015 | 0.0339 | 0.1511 | 0.0851 | 0.1705 | 0.1200 | 0.1257 | 0.0871 |
| 2016 | 0.0683 | 0.1727 | 0.0822 | 0.2008 | 0.1490 | 0.1428 | 0.0922 |
| 2017 | 0.0737 | 0.1871 | 0.0931 | 0.2462 | 0.1413 | 0.1313 | 0.0872 |
| 2018 | 0.0841 | 0.1729 | 0.1031 | 0.2624 | 0.1364 | 0.1430 | 0.0829 |
| 2019 | 0.0895 | 0.1718 | 0.0805 | 0.2630 | 0.1238 | 0.1407 | 0.1001 |
| 2020 | 0.1141 | 0.1742 | 0.0875 | 0.2870 | 0.1335 | 0.1524 | 0.1001 |
| Zhanjiang (ZJ) | Maoming (MM) | Zhaoqing (ZQ) | Qingyuan (QY) | Chaozhou (CZ) | Jieyang (JY) | Yunfu (YF) | |
| 2011 | 0.0890 | 0.0970 | 0.0746 | 0.0459 | 0.0573 | 0.0922 | 0.0091 |
| 2012 | 0.0864 | 0.1095 | 0.0862 | 0.0670 | 0.0633 | 0.1105 | 0.0462 |
| 2013 | 0.0987 | 0.1241 | 0.1014 | 0.0726 | 0.0639 | 0.0947 | 0.0771 |
| 2014 | 0.1302 | 0.1352 | 0.1226 | 0.0797 | 0.0788 | 0.1241 | 0.0860 |
| 2015 | 0.1214 | 0.1441 | 0.1408 | 0.0848 | 0.0766 | 0.1212 | 0.0901 |
| 2016 | 0.1151 | 0.1603 | 0.1378 | 0.1034 | 0.0943 | 0.1467 | 0.0876 |
| 2017 | 0.1170 | 0.1656 | 0.1273 | 0.1077 | 0.0944 | 0.1464 | 0.0568 |
| 2018 | 0.1286 | 0.1507 | 0.1059 | 0.0934 | 0.0887 | 0.1387 | 0.0608 |
| 2019 | 0.1233 | 0.1528 | 0.1221 | 0.1276 | 0.0919 | 0.1525 | 0.0513 |
| 2020 | 0.1047 | 0.1542 | 0.1244 | 0.1296 | 0.0855 | 0.1518 | 0.0792 |
Table 3.
Prediction accuracy of ML under scenario 1.
| The Number of Hidden Layers | The Number of Hidden Layer Neurons | MAE | MSE | RMSE | R2 |
|---|---|---|---|---|---|
| 1 | 2 | 0.038 | 0.002 | 0.049 | 0.757 |
| 2 | 2 | 0.032 | 0.002 | 0.047 | 0.782 |
| 3 | 2 | 0.042 | 0.003 | 0.055 | 0.701 |
| 4 | 2 | 0.032 | 0.002 | 0.045 | 0.802 |
| 5 | 2 | 0.041 | 0.003 | 0.054 | 0.711 |
Table 4.
Prediction accuracy of ML under scenario 2.
| The Number of Hidden Layers | The Number of Hidden Layer Neurons | MAE | MSE | RMSE | R2 |
|---|---|---|---|---|---|
| 1 | 3 | 0.038 | 0.002 | 0.049 | 0.757 |
| 2 | 3 | 0.032 | 0.002 | 0.047 | 0.782 |
| 3 | 3 | 0.042 | 0.003 | 0.055 | 0.701 |
| 4 | 3 | 0.032 | 0.002 | 0.045 | 0.802 |
| 5 | 3 | 0.041 | 0.003 | 0.054 | 0.711 |
Table 5.
Prediction accuracy of ML under scenario 3.
| The Number of Hidden Layers | The Number of Hidden Layer Neurons | MAE | MSE | RMSE | R2 |
|---|---|---|---|---|---|
| 1 | 6 | 0.026 | 0.001 | 0.034 | 0.884 |
| 2 | 6 | 0.034 | 0.002 | 0.046 | 0.792 |
| 3 | 6 | 0.038 | 0.002 | 0.046 | 0.786 |
| 4 | 6 | 0.032 | 0.002 | 0.044 | 0.811 |
| 5 | 6 | 0.027 | 0.001 | 0.038 | 0.859 |
Table 6.
Comparison results of different models.
| Model | MAE | MSE | RMSE | R2 |
|---|---|---|---|---|
| Our model | 0.026 | 0.001 | 0.034 | 0.884 |
| SVR | 0.045 | 0.003 | 0.057 | 0.673 |
| KNN | 0.042 | 0.004 | 0.067 | 0.551 |
| Xgboost | 0.041 | 0.006 | 0.077 | 0.473 |
| LSTM | 0.029 | 0.002 | 0.041 | 0.830 |
Table 7.
Data Results of 102 Cities in the YREB.
| Mean | Minimum | Maximum | 25 Percentile | 50 Percentile | 75 Percentile | |
|---|---|---|---|---|---|---|
| M1 | 7.2384 | 2.5255 | 16.5851 | 4.5727 | 6.3599 | 8.6616 |
| M2 | 9.0902 | 0.3786 | 51.7768 | 2.3708 | 5.2856 | 11.6949 |
| M3 | 29.9974 | 14.5226 | 50.7973 | 23.7548 | 29.3574 | 35.2565 |
| Score | 0.1748 | 0.0771 | 0.4636 | 0.1278 | 0.1438 | 0.1834 |
Table 8.
Data Results of 102 Cities in the GD.
| Mean | Minimum | Maximum | 25 Percentile | 50 Percentile | 75 Percentile | |
|---|---|---|---|---|---|---|
| M1 | 6.8439 | 3.1011 | 15.9309 | 4.2326 | 5.2357 | 8.1827 |
| M2 | 10.8876 | 0.6000 | 61.1900 | 1.6350 | 3.6900 | 15.0900 |
| M3 | 21.4643 | 19.0600 | 24.9600 | 20.2100 | 21.4700 | 22.5700 |
| Score | 0.1762 | 0.0550 | 0.5948 | 0.1024 | 0.1411 | 0.1712 |
Disclaimer/Publisher’s Note: The statements, opinions and data contained in all publications are solely those of the individual author(s) and contributor(s) and not of MDPI and/or the editor(s). MDPI and/or the editor(s) disclaim responsibility for any injury to people or property resulting from any ideas, methods, instructions or products referred to in the content. |
© 2023 by the authors. Licensee MDPI, Basel, Switzerland. This article is an open access article distributed under the terms and conditions of the Creative Commons Attribution (CC BY) license (https://creativecommons.org/licenses/by/4.0/).
Share and Cite
MDPI and ACS Style
Dou, Z.; Sun, Y.; Zhu, J.; Zhou, Z. The Evaluation Prediction System for Urban Advanced Manufacturing Development. Systems 2023, 11, 392. https://doi.org/10.3390/systems11080392
AMA Style
Dou Z, Sun Y, Zhu J, Zhou Z. The Evaluation Prediction System for Urban Advanced Manufacturing Development. Systems. 2023; 11(8):392. https://doi.org/10.3390/systems11080392
Chicago/Turabian StyleDou, Zixin, Yanming Sun, Jianhua Zhu, and Zijia Zhou. 2023. "The Evaluation Prediction System for Urban Advanced Manufacturing Development" Systems 11, no. 8: 392. https://doi.org/10.3390/systems11080392
Note that from the first issue of 2016, this journal uses article numbers instead of page numbers. See further details here.