
Research on Dynamic Scheduling and Route Optimization Strategy of Flex-Route Transit Considering Travel Choice Preference of Passenger

1
School of Urban Construction and Transportation, Hefei University, Hefei 230601, China
2
Anhui Provincial Key Laboratory for Urban Rail Transit Safety and Emergency Management, Hefei University, Hefei 230601, China
3
School of Transportation, Southeast University, No. 2 Southeast University Road, Nanjing 211189, China
*
Author to whom correspondence should be addressed.
Systems 2024, 12(4), 138; https://doi.org/10.3390/systems12040138
Submission received: 20 March 2024
/
Revised: 13 April 2024
/
Accepted: 18 April 2024
/
Published: 19 April 2024
(This article belongs to the Special Issue Performance Analysis and Optimization in Transportation Systems)
Abstract
:In this paper, to improve the operational service capability and attractiveness of the flex-route transit system, the real dynamic interaction scenario between passenger travel choice preference and system operation scheme in the post-pandemic era is described and quantified. The key technologies, operation mode, system framework, and interactive events required for dynamic interactive scheduling and route planning of flex-route transit are summarized. According to different choice preferences, the corresponding dynamic interaction scheduling strategies and route mixed integer programming model are proposed. An optimization scheme to improve the service capability of the system is introduced and analyzed. The computational results based on real-world cases show that the proposed strategy can better handle the relationship between requirements of transit system operation and requests of passengers without increasing operating costs, significantly improving the service performance of flex-route transit and the choice rate of passengers. We also find that the introduction of optimization schemes and the adjustment of passenger fares constitute a win-win strategy that benefits both passengers and transit operators.
Keywords:
public transit; flex-route transit; travel choice behavior; interaction strategy; operation schedulingMSC:
90B201. Introduction
Information technology, communication technology, and intelligent transportation system technology have been developing rapidly since the pandemic, and mobile technologies such as ride-sharing applications, customized transportation, and online reservation platforms have also gradually improved. Real-time monitoring and dynamic management and scheduling of vehicles have become technically possible. With these technical tools, the dispatching center can accurately obtain real-time vehicle location, road traffic conditions, passenger status updates, and real-time requirements so as to quickly generate and update vehicle route planning schemes, reduce operation costs, and improve the attractiveness and reliability of public transit.
In the post-pandemic era, the economy is in a low-growth cycle, and, with the improvement of carbon reduction awareness, people’s consumption attitudes are gradually changing. In terms of travel, passengers have been gradually shifting from private travel to public transportation, but the premise is to meet their travel preferences. Since the resumption of work, the demand for personalized public transit services has continued to increase. When passengers choose a travel mode and enterprises provide services, they mainly focus on relevant factors such as vehicle full load rate, driver qualification, vehicle disinfection, route planning, site setting, and travel time.
Flex-route transit is one of the most widely used flexible public transit operation modes, and has been operational in the United States for more than 20 years [1,2]. In practice, the flex-route transit system first receives the travel demand from passengers and then selects which passengers to serve according to the time window, timetable, and other relevant constraints, and formulates the path plan. Not all demands will be accepted by the system [3], passengers need to be selected by the system, and whether they are served is completely determined by the flex-route transit system. However, in the actual scene, passengers will compare various travel modes according to their own needs and choose the most favorable transportation mode. Therefore, in addition to the flex-route transit system choosing passengers, passengers will also choose whether to use the flex-route transit as their travel mode.
When passengers have travel demands, if they choose the flex-route transit as their travel mode, they will send the request to the flex-route transit system. After receiving the requests, the system will choose whether to accept the travel requests according to various operational requirements. If requests are accepted, the operation plan will be formulated according to the requirements and requests and will be fed back to the passengers. Passengers will choose whether to accept the operation plan according to their preference. If not, they will inform the system and the system will reformulate the operation plan for other passengers after receiving the feedback. If the new plan meets the requirements of some passengers who choose not to use the flex-route transit, the system will receive new requests and feed them back after formulating a new plan. This is repeated until the operation plan meeting the requirements of both system and served passengers is generated.
Therefore, it is worth discussing how to describe and quantify the interaction behavior. Formulating operation plans in advance based on the interaction behavior will reduce various negative impacts caused by direct rejection (direct rejection caused by the transit request not meeting the requirements of the system, regardless of subsequent replanning) and direct cancellation (direct cancellation caused by the planned travel route not meeting the requirements of the passengers, regardless of subsequent reselection) during operation and improve the attractiveness and sharing rate of public transit.
2. Literature Review
The urgent need for flexibility and personalization of travelling options has prompted continuous research and innovation related to flex-route transit. At present, much research has been conducted on flex-route transit, mostly focusing on the applicability aspect (macro level, summarizing case experiences and analyzing applicable conditions, designing practical and feasible operational plans), the operational organization aspect (meso level, analyzing operational organization parameters such as travel demand, stations, routes, schedules, etc., quantifying relevant factors, and constructing decision models), and the operation scheduling aspect (micro level, analyzing and simulating the interaction between passengers and vehicles in different scenarios).
Regarding the applicability analysis, determining the most suitable public transit operation mode based on the current traffic situation in a specific area and the characteristics of residents’ travel needs has always been a hot research issue. Decision makers can refer to and analyze different aspects such as travel demand, road conditions, technology, ticket prices, customer satisfaction, and operation scheduling before designing a flexible public transit operational organization plan [1,2,4] in order to comprehensively determine the applicable conditions of various travel modes, determine feasible public transportation operation modes, and improve the mobility of residents’ travel. Currie et al. [5] found through calculations that demand-responsive public transit has different service characteristics in various spatial backgrounds from rural to urban areas, proving its role in areas with low and high travel demand density. Daganzo et al. [6] explored a universal demand-responsive public transit service model that covers various modes of transportation services such as taxis, carpooling, and scheduled rides. They proposed a universal analytical framework that can be used to simulate the steady-state performance of various demand-responsive public transit systems, with the aim of comparing and analyzing existing urban transportation modes in different city types and demand levels. Rich et al. [7] constructed a model and algorithm to evaluate the service performance and cost-effectiveness of fixed-route transit and demand-responsive transit. The research results showed that the fixed-route transit performed better during peak hours, while demand-responsive transit had certain advantages in non-peak hours and emerging areas.
The main task of the operational organization aspect is to quantitatively analyze the relevant operating parameters of flexible public transit to improve service levels and service quality. Analyzing and evaluating operating plans requires modeling and simulation of cost or utility functions. In terms of flexible public transit station setting and route planning, scholars generally select the cost of passengers [8,9,10,11], operators [12,13,14,15,16,17], or systems [18,19,20,21] as the objective function by using time window, operating speed, etc. as constraints, by establishing the mixed integer programming model, and by using optimization algorithms to improve site selection and route planning.
Regarding the operation scheduling aspect, the dynamic characteristics of flexible public transit and some more detailed operational parameters, such as fares, service rejection rates, passenger satisfaction, etc., can be analyzed to encourage operators to formulate better operational strategies. Amirgholy and Gonzales proposed an operation strategy based on dynamic pricing to meet the travel demand as much as possible while reducing the overall travel cost in the peak travel period [22]. Quadrifoglio et al. evaluated static reservation demands and dynamic real-time demands and proposed a corresponding flex-route transit scheduling algorithm [23,24]. Zhou et al. established a multi-line hybrid vehicle dynamic scheduling model to formulate the fleet organization and route planning for the travel demand of multiple lines [25]. Grahn et al. used actual demand data, vehicle trajectory data, and traffic network dynamic data to simulate and optimize system operation in order to improve system performance, including reducing costs and improving reliability [26,27].
Methods relative to the application analysis aspect and the operational organization aspect can also analyze operation parameters, but at the stage of operation scheduling dispatch, passengers are allowed to change their behavior, thereby prompting flexible public transit operators to continuously optimize their operational strategies. Passengers’ psychological decision-making and choice behavior also affect the service level of the system. Relevant studies have been carried out on the impact of passengers’ decision-making psychology on system performance [28]. The cancellation behavior of passengers has an impact on the system performance, but there is a lack of adequate research on the matter [29], especially research on the mathematical expression model of this behavior [30]. At present, the research on cancellation behavior of passengers in flexible transit deals mainly with randomly generated cancellations [31,32,33], without conducting an in-depth analysis of the behavior characteristics of passengers.
There are few relevant studies on the impact of passengers’ psychological decision-making and choice behavior on system service levels, especially the combination of utility functions and choice behavior. At present, research on the decision-making behavior of flexible public transit passengers mainly involves random generation and cancellation and lacks in-depth analysis of passengers’ behavioral characteristics. The reasons for and the characteristics of passengers’ selection/cancellation behavior need to be analyzed in depth, and the interaction between system planning and passenger selection should also be discussed in depth. This paper expects to depict and quantitatively analyze this interaction behavior, formulate a system route replanning and a passenger travel re-meet strategy, propose optimization solutions, and analyze system performance.
The remainder of this paper is organized as follows. In Section 3, the related background of flex-route transit is introduced, and the interaction strategy is analyzed. The interaction model and optimization scheme for improving system service performance are proposed in Section 4. Case studies are presented in Section 5 to illustrate the performance of the interaction strategy and optimization scheme in different scenarios, and a summary of findings is presented in Section 6.
3. System Description
3.1. Service Area and Demand
The service area of the flex-route transit can be simplified as a rectangle with width W and length L, as shown in Figure 1. In each service shift, the vehicle starts from one terminal station, passes through all checkpoints and serviceable reserved stops, and ends at another terminal station. Each checkpoint has its own fixed departure time.
Passengers can generally be divided into the following four categories: type I—the pick-up and drop-off points are both at checkpoints, type II—the pick-up point is at a checkpoint, but the drop-off point is not at a checkpoint, type III—the pick-up point is not at a checkpoint, but the drop-off point is at a checkpoint, and type IV—the pick-up and drop-off points are both not at checkpoints. The proportion of each type is λ1, λ2, λ3, λ4.
Each shift has various requirements such as service distance, timetable, and time window. When there is travel demand outside the base route, if the various requirements are met, the flex-route transit will deviate from the base route to pick up and drop off passengers and then return to the base route.
3.2. Bidirectional Selection between Passenger Travel and System Service
During the pandemic, information interactive transmission technology developed rapidly, and passengers’ requirements and preferences for travel modes also changed. When receiving travel requests from passengers, the flex-route transit system will select the passengers to serve and make an operation plan based on existing conditions and constraints. However, route planning of the flex-route transit is a process of mutual restrictions and mutual compatibility between system and passengers. According to the characteristics of existing travel modes, passengers choose the appropriate or preferred travel mode from their own preferences. Whether or not they choose the flex-route transit will, in turn, affect the route planning of the system.
Choice of passengers and route planning by the flex-route transit system are interactive processes, as shown in Figure 2. When passengers choose to travel by flex-route transit, they will send travel requests to the flex-route transit system and the system will formulate the initial operation plan according to the received travel requests. When the initial operation plan is formed, it is fed back to each accepted passenger. Some passengers may choose to cancel due to the long driving route or the high cost, and the decision it is fed back to the flex-route transit system. The system then generates a new operation plan according to the new travel requests. When some passengers see that the new operation plan meets their own preferences, they will choose to ride the flex-route transit again and so on until the optimal operation plan that meets the requirements of both served passengers and system at the same time is generated.
3.3. Operation Mode of Flex-Route Transit System
The scheduling and path planning process of the system is divided into two parts: static and dynamic interaction, as shown in Figure 3. For the static scheduling and route planning before departure, specifically, all demand-responsive passengers need to send a travel request to the reservation center before the reservation deadline of each shift. The information to be provided during the reservation includes the ideal service shift and the ideal location for the pick-up and drop-off points. When the system processes the received reservation request, it will immediately feedback on whether the passenger can be served by the shift. After the passengers’ appointment deadline, the scheduling center will globally optimize the needs of all passengers who can be served to generate the optimal initial vehicle schedule.
After determining the initial vehicle schedule, passengers determine whether to accept the service or not according to their own travel choice preferences and provide feedback to the reservation center. The reservation center immediately reports back to the dispatch center. After receiving the dynamic interactive information, the dispatch center will call the dynamic database through the computer aided dispatching system and use its dynamic route planning model to update the vehicle schedule in real time and send the modified schedule to the corresponding vehicle and passenger immediately.
4. Mathematical Model
Static and dynamic route planning models are the core functions of the computer aided dispatching system and the key to the efficiency of the driving plan. In this section, the static route planning model of the flex-route transit and the dynamic route planning strategy that can deal with various dynamic interactive events are constructed, respectively. The static route planning model is characterized by the minimum vehicle driving time, passenger travel time, and system rejection rate (passenger unserved rate) as the optimization goal processes the reservation demand of passengers and determines the initial driving plan for the vehicle. The dynamic route planning strategy considers both the system operation requirements and the passenger travel preferences and dynamically adjusts the driving plan in real time.
A directed graph G = (S, A, T) was defined to represent the route planning network of vehicles, where S represents the set of all optional stops, A = S2 represents the edge set formed by all optional stops, and T = (tij) is the set of vehicles driving time corresponding to each edge.
4.1. Flex-Route Transit Route Planning Model
When the flex-route transit system receives a set of travel demands and makes a driving plan, it can be classified as a flex-route transit vehicle routing problem. Based on the above description and parameter definition, the following interactive mixed integer programming model for route planning of the flex-route transit is constructed:
The objective function (1) minimizes the weighted sum of the three factors, namely vehicle driving time, total in-vehicle time of passengers, and penalty time converted from unserved rate. The penalty time cost ensures that the flex-route transit system serves as many passengers as possible while meeting the requirements of both the system and the passengers. Using time costs to describe the operational situation can directly reflect the quality of service by the system.
Constraints (2) and (3) ensure that each stop has only one departure path and one arrival path. Constraint (4) ensures that, at the initial checkpoint, the number of in-vehicle passengers is equal to the number of getting-on passengers, and then the vehicle’s passenger load is the original number plus or minus the number of passengers getting on or off at each stop. Constraint (5) ensures that, for any two stops with a connection, the arrival time of stop j is no later than the departure time of stop i plus the driving time between the two stops. MG and MT are large enough to ensure that the constraints are invalid when there is no connection between the two stops. Constraint (6) ensures that the passenger’s drop-off time is later than the pick-up time. Constraint (7) ensures that the departure time of a non-checkpoint stop is equal to the time the vehicle requires to arrive at the stop plus the stop service time. Similarly, Constraint (8) ensures that the departure time of the vehicle at the checkpoint is equal to the arrival time of the vehicle at the checkpoint plus the service time. Constraints (9) and (10) establish the time relationship equations of each passenger’s pick-up/drop-off time and corresponding stops, respectively. Constraint (11) ensures that no illegal subtours are contained in the optimal solution by eliminating all the loops that make other points disjoint. Constraint (12) means that the passenger capacity in the vehicle will not exceed the rated passenger capacity at any time. Constraint (13) ensures that the vehicle operation meets the time window requirements. Constraint (14) ensures that the retrograde distance of the vehicle is not greater than its maximum allowable retrograde distance. Constraint (15) represents the penalty time cost, which is converted from the number of unserved passengers through the conversion coefficient.
4.2. Dynamic Route Planning Strategy
The system initially plans the vehicle route according to the known information, receives dynamic events such as passenger demands and traffic conditions in real time during the implementation process, and re-plans the vehicle route according to certain rules to meet the system requirements [34].
At present, passengers mainly consider the following factors when traveling by public transit:
(i) Full load rate: there are certain restrictions on the full load rate of buses during the pandemic, and passengers in the post-epidemic era also have certain requirements for the full load rate.
(ii) Travel time: because the information interaction is more comprehensive and convenient, passengers can obtain information such as stations, routes, and road conditions at any time, and can obtain travel time fluctuations in advance. Passengers may now transfer from private travel to public transit when the travel time meets certain requirements.
(iii) Travel cost: since most people have become accustomed to private travel during the pandemic, passengers may now transfer to public transit when the travel cost meets certain requirements.
Figure 4 is the system framework for dynamic interactive scheduling. Through information interaction between the system and passengers, the vehicle schedule that meets the system requirements and the passengers’ travel choice preferences will be finally generated.
4.2.1. Full Load Rate
If the passenger demand is accepted by the system but does not meet their travel preferences for vehicle full load rate δ, they will stop using the flex-route transit and the system will formulate a new vehicle schedule.
Specifically, when the passenger demand is accepted but the passenger then cancels, the system goes through the remaining unserved passengers and inserts them one by one into the operation plan. If the system requirements and passenger preferences are met after insertion, a new vehicle schedule is generated; otherwise, the passengers will continue to refuse. Then the system sends the updated scheme to each passenger, the passenger chooses to use it or not, and the steps are repeated until the final operation scheme is generated.
4.2.2. Travel Time
The travel time between the origin and destination of the passengers is determined by the location of the station, the average driving speed of the vehicle, and the topology of the road network. However, in the actual operation process, the fluctuation of driving time caused by the superposition of various factors will inevitably affect the travel time. At the same time, multiple stops of vehicles between the origin and the destination will also increase the travel time. When the actual travel time fluctuation from the origin to the destination is within an acceptable range, passengers will choose to use the flex-route transit.
The theoretical travel time for origin–destination is usually estimated based on the average speed of the road section, and the value of ϑ reflects the actual fluctuation as an acceptable coefficient of travel time.
If the actual travel time fluctuation is greater than the acceptable range, the passengers will cancel the flex-route transit travel, and the system will re-formulate the dynamic interactive scheduling scheme.
4.2.3. Travel Cost
Passengers may consider transferring from private travel to public transportation when travel costs are low. Formula (18) introduces the travel mode of private car/online car-hailing to reflect the process of independent choice of passengers and calculates its travel cost, where ς is the cost comparison coefficient. Passengers will choose the travel mode with the lowest travel cost, reflecting the selection process of passengers.
Similarly, if the accepted passengers are not satisfied with the travel cost, they will cancel the flex-route transit travel and the system will re-enact the dynamic interactive scheduling scheme until the vehicle scheme meets the system requirements and passenger travel preferences under the maximum service rate.
4.3. Discussion on Optimization Method
With the introduction of travel choice behavior on the part of passengers, passengers choose travel modes according to preferences, a phenomenon which will inevitably lead to an increase in cancellation rate. At the same time, due to the more stringent constraints, the rejection rate of travel requests by the system will also increase. Therefore, measures to improve the utilization rate and service rate need to be discussed.
Allowing passengers to walk a certain distance within a reasonable range to reach the dynamic meeting points and then get on or off the flex-route transit [35], as shown in Figure 5, can effectively reduce extra time caused by detours and parking, reduce travel time cost for the passengers, and improve the service rate.
In each shift, the DBSCAN algorithm [36] is used to automatically associate MinPts demand points of the passengers within ε range, then the K-medoids algorithm [37] is used to select the meeting points with minimum total walking time from the associated demand points within each range, and the passengers can walk to the dynamic meeting points to get on or off the flex-route transit. The route planning model with dynamic meeting points strategy is modified as follows:
Subject to
The objective function (19) minimizes the weighted sum of the four factors, namely vehicle driving time, total passengers in-vehicle time, total passengers walking time, and penalty time converted from unserved rate. Constraint (20) calculates walking time based on walking distance and walking speed. Constraint (21) ensures that, if the stop is the selected dynamic meeting point in the corresponding stop group, the incoming and outgoing are both 1; otherwise, the incoming and outgoing are both 0.
With the addition of the walking mode, the passenger’s travel time and travel time preference will change accordingly; therefore, Formula (17) is changed to Formula (22), where the theoretical walking time before getting on the vehicle and the theoretical walking time after getting off the vehicle can be calculated using the average walking speed.
Similarly, Formula (23) also reflects the process of independent choice of passengers. On the basis of Formula (18), the sum of walking travel cost and riding flex-route transit travel cost is compared with the travel cost of riding a car.
5. Result Analysis
5.1. Parameter Values
This section presents a case study conducted based on the Metropolitan Transit Authority (MTA) Line 646 flex-route transit service which is a typical flex-route transit system; it has been widely used as an example by many previous studies [23,24,38,39,40]. The default parameter values refer to existing studies [23,41]. The L and W are 10 miles and 1 mile, respectively. The cp is three. The λ1, λ2, λ3, and λ4 are 0.1, 0.4, 0.4, and 0.1, respectively. The ωd, ωi, ωw, and ωp are 1, 1, 1, and 1, respectively. The vb, vc, and vw are 25 miles/h, 25 miles/h, and 3 miles/h, respectively. The db is 0.3 miles. The tc, tn, and ts are 1 min, 0.3 min, and 40 min, respectively. The ξ and τ are 1000 passengers/trip and 30 passengers/trip, respectively. The σ1, σ2, φ1, φ2, φ3, and ς are 0.2 ¥/min, 1.2 ¥/min, 1 ¥/min, 1 ¥/min, 1 ¥/min, and 1, respectively [42,43]. Similar to previous studies [24,44], rectilinear movement is applied to reproduce a realistic road network.
5.2. Analysis of Operation Results
By solving the model, various indicators can be obtained. To simulate the volatility of passenger demand in practice, scenarios under different passenger demand levels are simulated. For each scenario, 100 replications of a single-trip operation are run to provide statistical estimates of the system performance. The static route optimization model is solved by using the YALMIP platform to call the CPLEX software (community edition), and the proposed dynamic route planning strategy is adopted to dynamically adjust the pick-up and drop-off of passengers.
5.2.1. Considering Full Load Rate
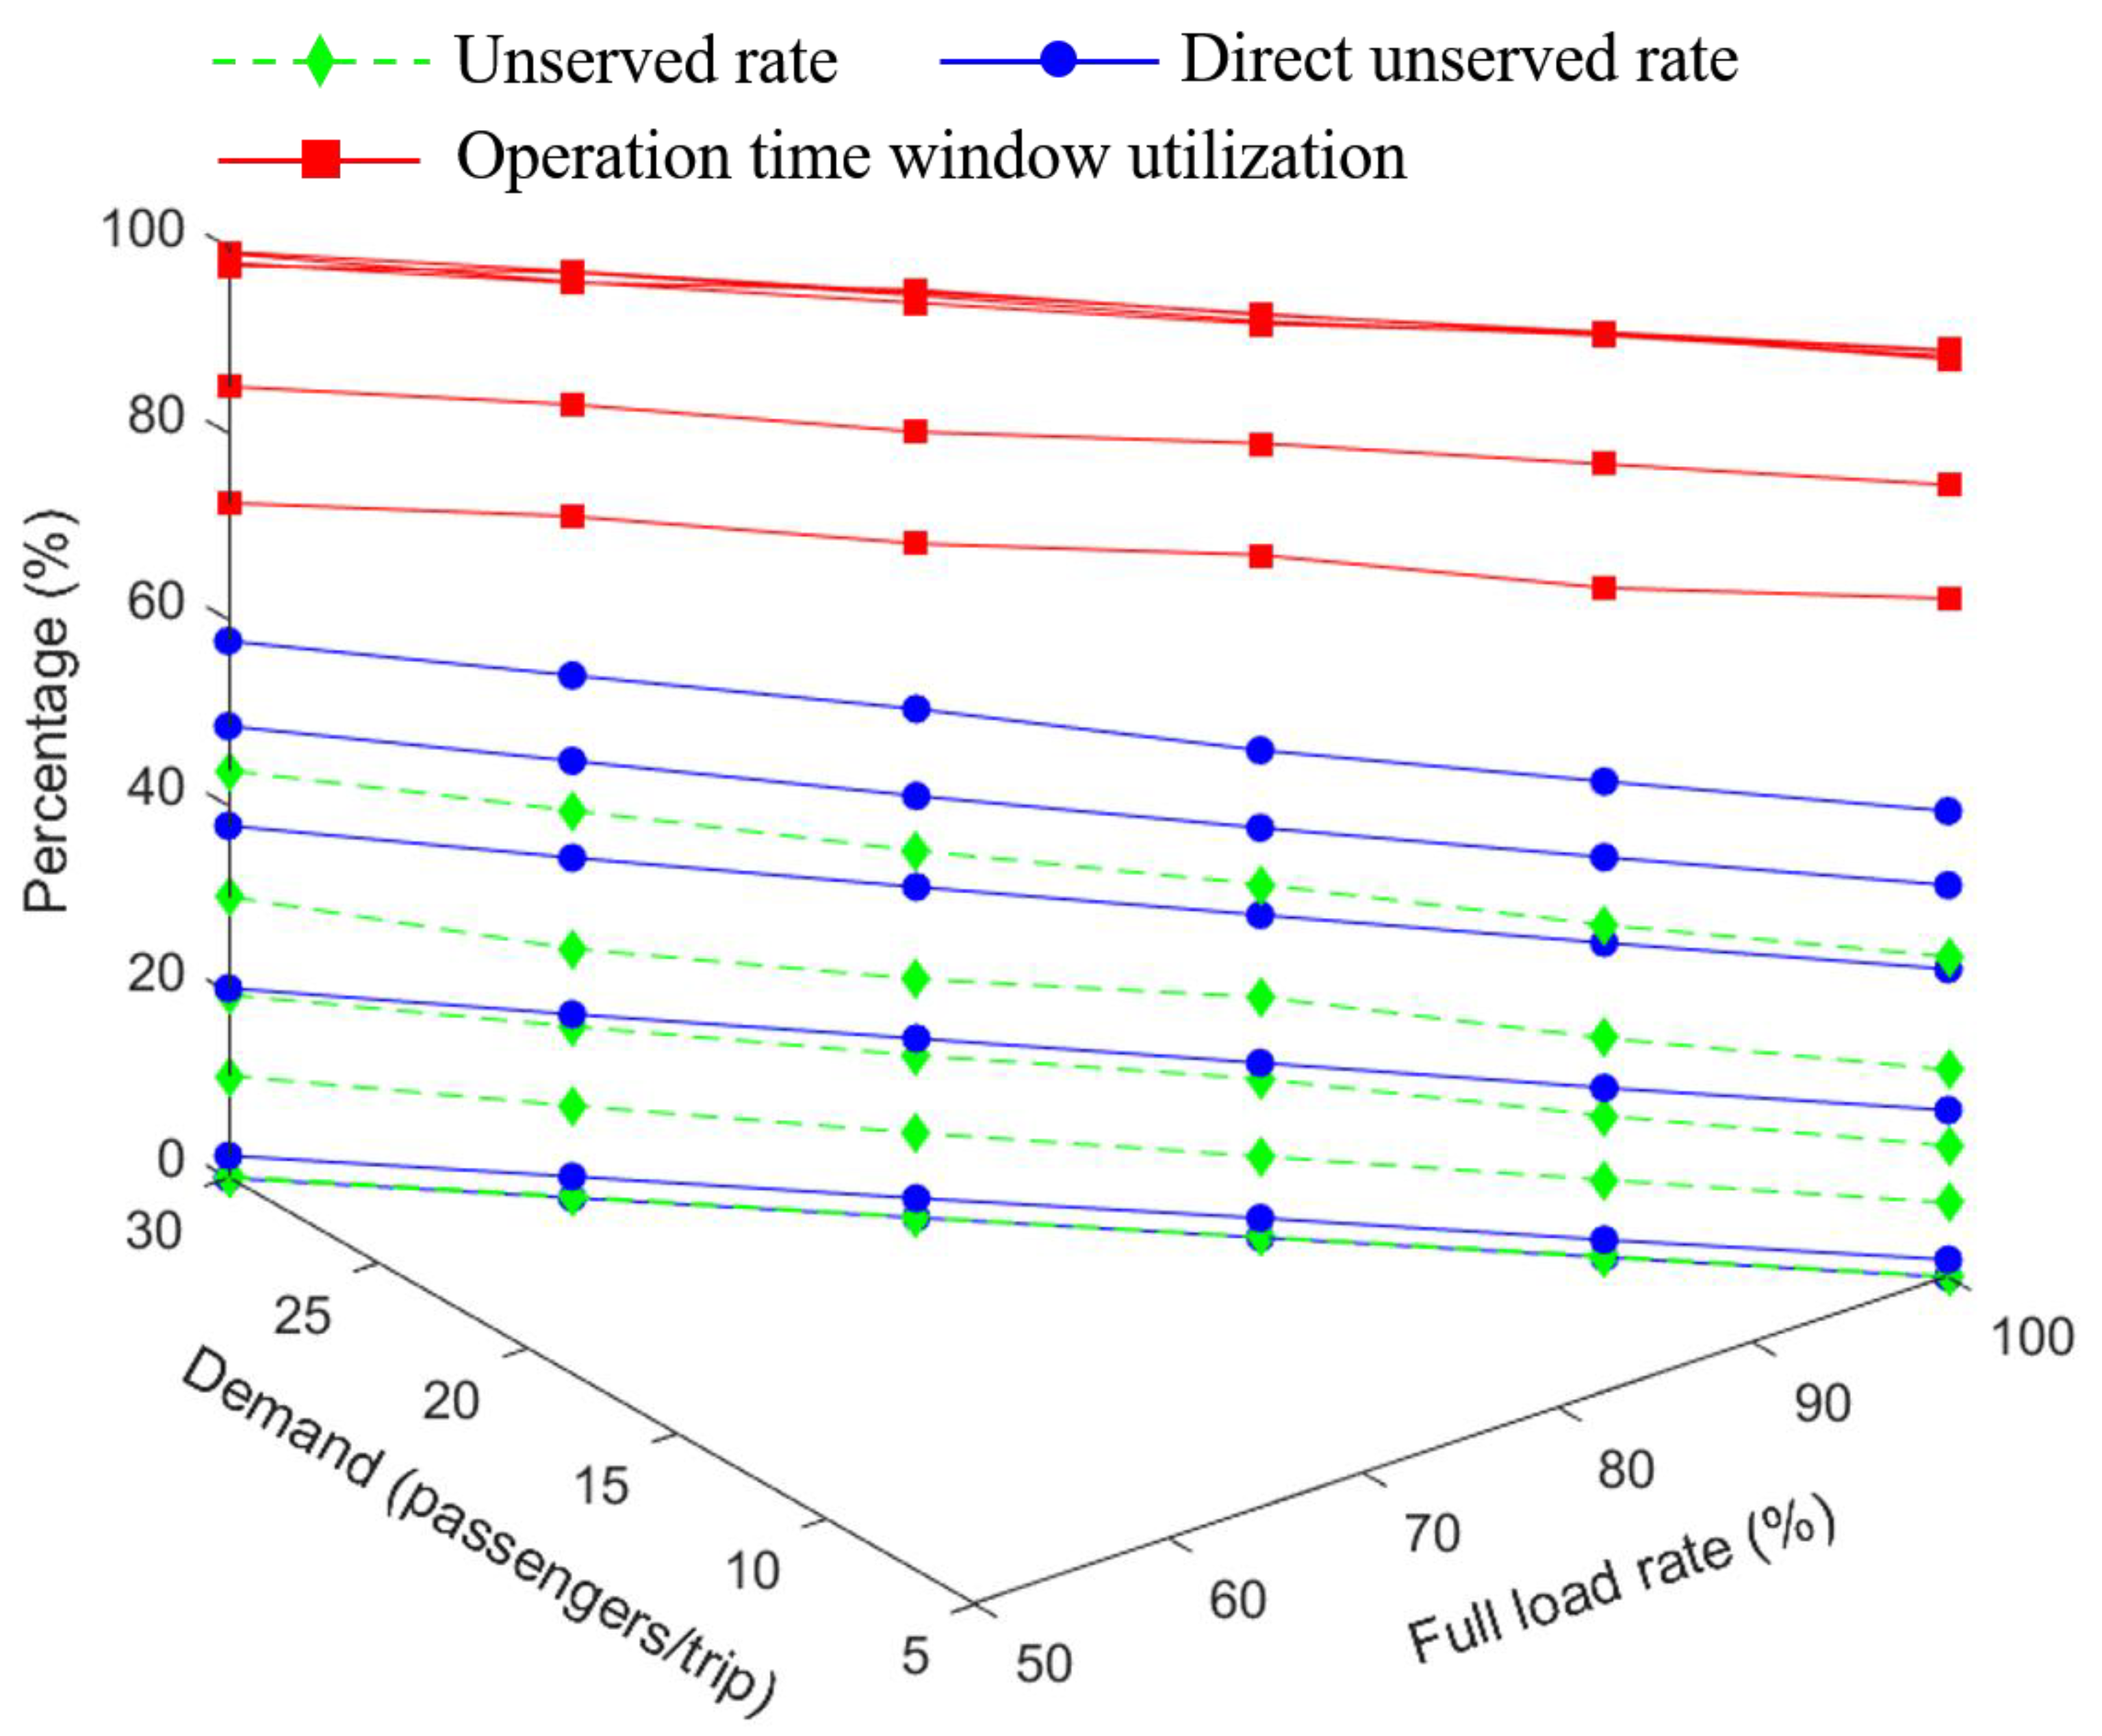
With the increase of travel demand, the ratio of passengers not being served (unserved rate) increases due to system constraints such as time windows, as shown in Figure 6. At the same time, when the passenger’s travel preference increases the requirement for the congestion degree of the carriage (the maximum full load rate decreases accordingly), the unserved rate also increases. The direct unserved rate in the figure shows that, without an interaction strategy (no subsequent dynamic interaction to generate the optimal operation scheme), the original operation plan is in a situation where the system directly refuses and passengers directly cancel, so the unserved rate is higher.
It can be seen from Figure 6 that the utilization rate of the operation time window is low when the demand levels are low, and it also meets the maximum full load rate requirement. Therefore, small-sized vehicles can be used to meet the system requirements and the full load rate preferences while reducing operating costs. When the demand levels are high, the utilization rate of the operation time window and the unserved rate are high. Therefore, in order to improve the sharing rate of public transit, the number of operation shifts can be increased, so as to attract and serve passengers as much as possible on the basis of meeting system constraints and travel preferences.
5.2.2. Considering Travel Time
As shown in Figure 7, when passengers are sensitive to time fluctuations (ϑ is small), the unserved rate is very high and it is difficult to transfer passengers’ travel mode to the flex-route transit. When passengers are tolerant of travel time fluctuations (ϑ is large), the unserved rate decreases and the flex-route transit can attract and serve more passengers.
Therefore, the system should consider the overall situation when formulating the operation plan to ensure the balance between the service rate and the passenger travel time. The travel time of in-vehicle passengers should not be increased too much in order to pursue the service rate, but infinitely reducing the sharing rate to provide efficient services should also be avoided. Given this kind of situation, operators need to formulate corresponding emergency plans. For passengers who cannot be served, the system can quickly notify them and arrange other vehicle transfers. For in-vehicle passengers who increase their travel time, financial compensation can be given so as to make up for the inconvenience to passengers.
5.2.3. Considering Travel Cost
The specific results are shown in Table 1. It can be seen from the table that, with the increase of passenger demand per shift, the total travel cost for all passengers riding the flex-route transit and the total travel cost for riding a car will increase. The travel cost for riding the flex-route transit will grow faster, making it difficult to meet all requirements of system and demand of each passenger. Therefore, some passengers will not be served by flex-route transit due to the system or their own preferences. With the increase of passenger demand, passengers will take longer to travel by flex-route transit than by car, so the unserved rate will increase significantly. The travel plans of served passengers meet the passengers’ own demand and the requirements of system, and the total travel cost is lower than that on car.
By introducing the interaction model, the system can determine the served objects and the operational organization before the actual operation and improve the stability and attractiveness of the service. If the system does not use the interaction model to plan in advance but rejects requests that cannot meet the requirements of the system and the demand of the passengers at the beginning of the operation, the unserved rate will be higher. The direct unserved rate in the table shows that, without an interaction strategy, the original operation plan is in the situation where the system directly refuses and passengers directly cancel, so the unserved rate is higher.
The per capita travel cost of riding the flex-route transit and riding a car are shown in Figure 8. If passengers ride cars, the per capita with respect to the travel cost of a hypothetical served demand are roughly the same as the per capita relative to the travel cost of the total demand at different demand levels, because the travel distance meets the normal distribution and tends to be stable. As the demand levels increase, the per capita relative to the travel costs of the total passengers riding the flex-route transit and the per capita relative to the travel cost of served passengers will increase. The per capita related to the travel cost of total passengers will grow more rapidly and will be higher than that associated with riding a car at high demand levels. Therefore, there will be more and more unserved demand, and the per capita associated with the travel cost of the remaining served demand will be less than that of riding a car.
The above simulation results are similar to existing research [43], indicating that a dynamic intervention (dynamic interaction strategy) can dynamically update the driving path of the vehicle in real time, providing a more economical operation scheme for the system, reducing the unnecessary detour distance and actual operation cost of the vehicle, and reducing the unserved rate of passenger travel demand.
5.3. Analysis of Optimization Schemes
After analyzing the interaction behavior, it is also worth discussing how to improve the service rate of flex-route transit. Improving the utilization rate of flex-route transit can improve the share rate of public transit and reduce the use of cars, thus improving the level of environmental protection and easing road congestion. At the same time, analyzing the operation conditions at different parameter levels can help the flex-route transit system formulate relevant measures and strategies conducive to enterprise development under the premise of meeting service quality. This section takes the travel cost factor as an example.
The introduction of the dynamic meeting points strategy allows some passengers to walk for some distance before getting on or off the flex-route transit, which can reduce the driving time and parking time of the vehicle to a certain extent, so that the vehicle operation time window is more sufficient and can serve more passengers. At the same time, due to the reduction of in-vehicle time, the number of passengers willing to travel by flex-route transit will also increase to a certain extent.
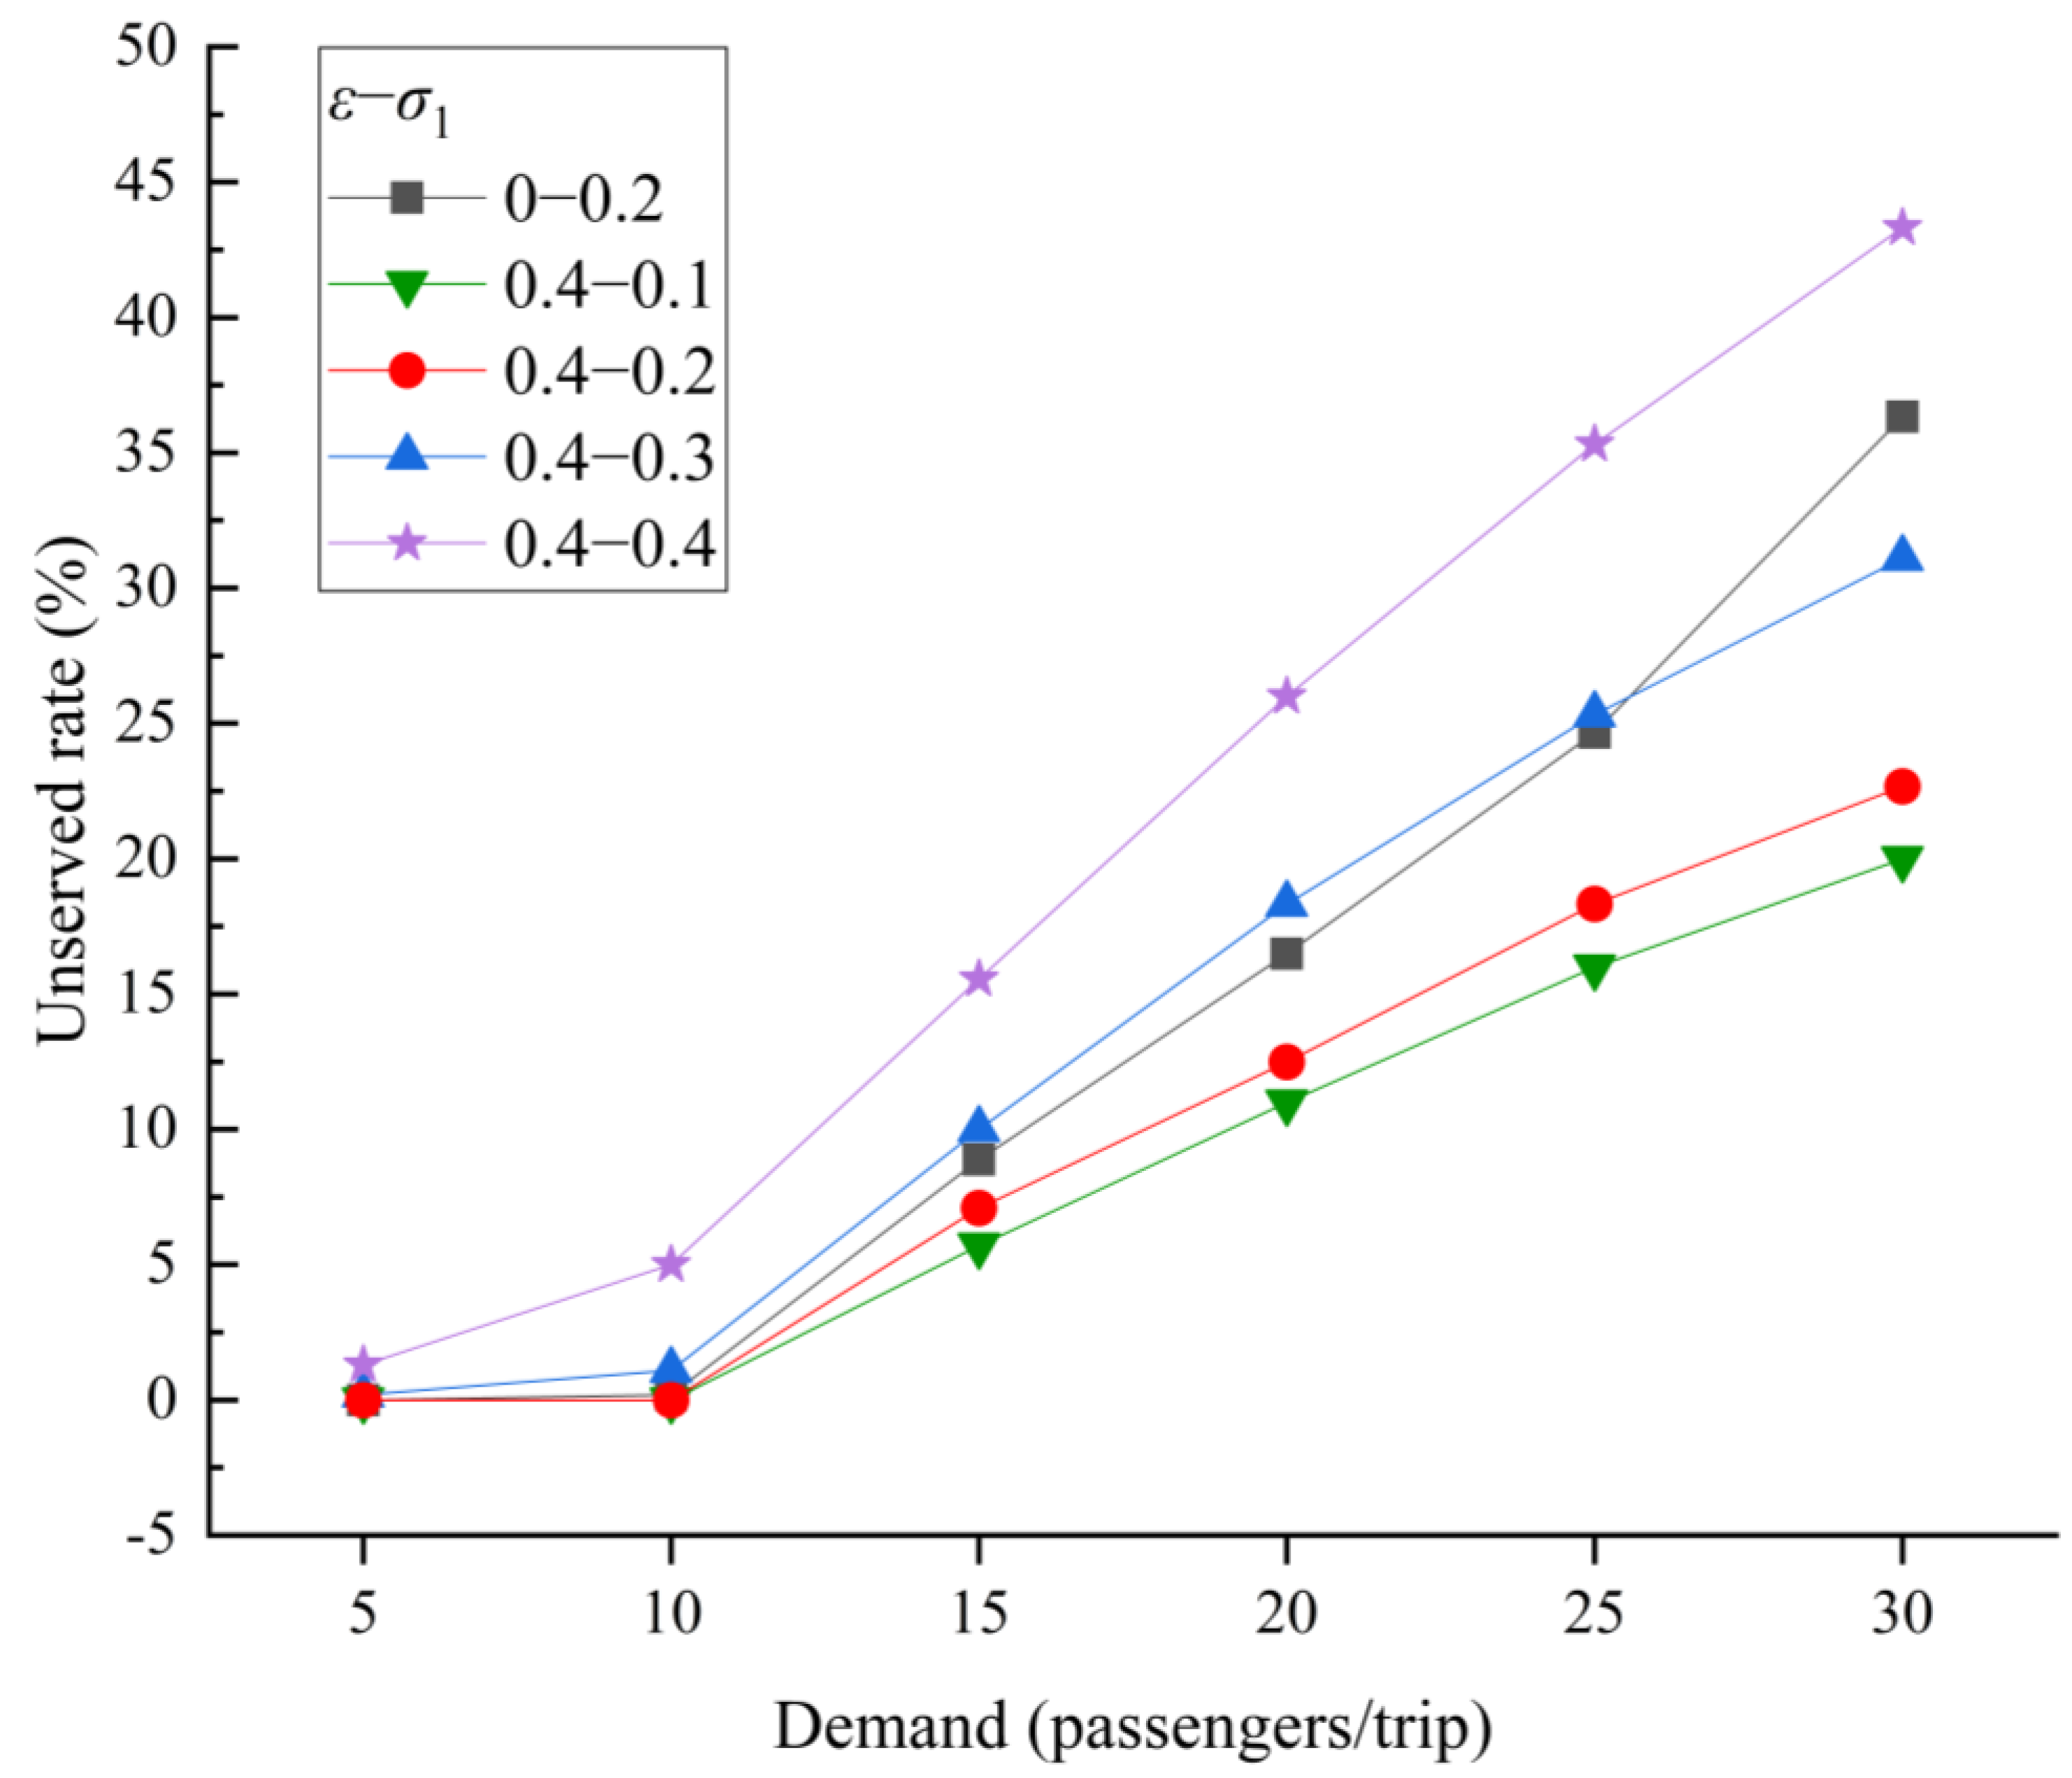
The dynamic meeting points strategy automatically associates MinPts demand points within a certain walking allowable range, meaning that if there is an equal amount of or greater than MinPts demand points existing in the associated ε range at the same time, the system generates dynamic meeting points to allow associated passengers to walk to those points to get on or off the flex-route transit. The values of MinPts and ε have an impact on the dynamic meeting points strategy. MinPts is generally taken as three. The impact of the value of ε on the system is shown in Figure 9. Figure 9 shows how the unserved rate of the flex-route transit system changes at different ε and at different demand levels when the ε increases from 0 miles to 0.7 miles (0 means general operation without dynamic meeting points strategy). It can be seen that, with the initial increase of ε, the unserved rate of the flex-route transit system at different demand levels decreases to a certain extent, reflecting the effectiveness of the dynamic meeting points strategy. However, when ε continues to increase, the unserved rate increases instead. When ε reaches 0.7 miles, it exceeds the value of general operation. This is because as the walkable range/distance increases, the walking travel cost of passengers increases rapidly. Although the in-vehicle travel cost of riding the flex-route transit is reduced, the walking travel cost plus the in-vehicle travel cost will exceed the travel cost of riding a car, so the unserved rate will increase.
The sensitivity analysis can find the optimal parameter value and provide the basis for the actual operation. If the relevant parameters or conditions change as a result, the optimal value in line with the actual situation can also be obtained through analysis.
With the introduction of the dynamic meeting points strategy, some passengers need to walk, something which will inevitably affect the enthusiasm of using the flex-route transit. Therefore, it is necessary to re-formulate the pricing levels and appropriately subsidize passengers. However, the subsidy will affect the revenue of the system and can only be filled by increasing the overall fare of the passengers. The optimal value of ε (0.4 miles) is selected to analyze the impact of different pricing levels on system performance, as shown in Figure 10. It can be seen that, as the pricing levels σ1 decrease, the travel time costs also decrease, and the service rate of the flex-route transit and the choice rate of passengers increase. When the pricing levels increase, the service rate of the flex-route transit and the choice rate of passengers decrease. When the pricing levels increase too much, the performance of the system becomes inhibited. Therefore, the flex-route transit system should comprehensively consider the benefits and service quality when formulating an operational organization and formulate a reasonable pricing level.
6. Conclusions
In the current operation mode of the flex-route transit, the system plays a dominant role and has the priority to determine the service for picking up and dropping off passengers, an approach which does not reflect the choice attribute of passengers. However, in the post-pandemic era, the independent choice behavior of passengers has had a significant impact on the performance of the system, a phenomenon which should be considered. To solve this problem, this paper proposes an interactive strategy between the operation scheduling of the flex-route transit system and the choice of passengers to improve the service performance of the flex-route transit system and the choice rate of passengers. On this basis, the key technologies, operation mode, system framework, and interactive events required for the dynamic interactive scheduling and route planning of the flex-route transit are summarized. According to different choice preferences, the corresponding dynamic interaction scheduling strategies are proposed, and the influence of various interaction events on system performance is simulated and evaluated.
The results show that the proposed strategy and the constructed model can better deal with the relationship between the operational requirements of the system and the demand of passengers without increasing operational costs by more fully mining the operational capacity of the flex-route transit system, by significantly reducing the unserved rate, by giving passengers the right to choose independently, and by increasing the enthusiasm of the passengers to use public transit.
This paper conducts an in-depth analysis of the impact of passenger choice behavior on system performance but does not conduct in-depth research on how to motivate passengers to choose public transit and how to improve the service performance and attractiveness of public transit. Analysis of the optimization strategy shows that adjusting the operating conditions of the system or travel mode of the passengers will have a significant impact on the performance of the system. Considering the changes in the costs for and benefits to the system or passengers after adjustment, it is necessary to study the fare formulation and subsidy strategy in depth. Therefore, it is paramount to develop a method that can balance the interests between the system and the passengers so as to improve the service capacity of the system and the willingness of passengers to use public transit, promoting fairness. Multi-vehicle and multi-line cooperative operations are also a problem that needs to be studied. If passengers are allowed to transfer at junction stations and reasonable cooperative operation scheduling and headway are formulated, the driving path can be optimized to a greater extent, the detour can be reduced, and the service capacity of the system and the willingness of passengers to use public transit can be improved.
Author Contributions
The authors confirm contribution to the paper as follows: Conceptualization: W.L.; Methodology: J.Z.; Software: J.Z.; Validation: J.Z. and R.G.; Formal Analysis: W.L.; Data Curation: J.Z. and R.G.; Writing—Original Draft Preparation: J.Z.; Writing—Review & Editing: W.L.; Visualization: J.Z. and R.G.; Supervision: W.L.; Project Administration: W.L.; Funding Acquisition: W.L. All authors have read and agreed to the published version of the manuscript.
Funding
This research was supported by the National Natural Science Foundation of China (No. 52272319).
Data Availability Statement
Data are contained within the article.
Conflicts of Interest
The authors declare no conflicts of interest.
Notations
The following symbols are used in this paper:
| ai, aj | abscissa of stop i and stop j, respectively |
| C | set of stops at the checkpoints, where C = {1, 2, …, cp} and cp = number of checkpoints |
| ct | total number of non-checkpoint stops that the vehicle needs to visit |
| db | maximum allowable retrograde distance, unit: miles |
| dd(q) | walking distance between getting off point and destination of passenger q, unit: miles |
| dd(q)p(q) | Manhattan distance between origin and destination of reservation of passenger q, unit: miles |
| dij | Manhattan distance between stop i and stop j, unit: miles |
| dkw | sum of distance from each point in cluster to center point, that is, the total walking distance in cluster, unit: miles |
| dp(q) | walking distance between origin and getting on point of passenger q, unit: miles |
| dq | drop-off stop corresponding to passenger q |
| dw | maximum acceptable walking distance, unit: miles |
| gj | number of passengers getting on (gj > 0) or getting off (gj < 0) at stop j |
| K | set of central stops that can be clustered, where K = {1, 2, …, kp}, K ⫋ S |
| kp | number of central stops that can be clustered (possible meeting points) |
| pq | pick-up stop corresponding to passenger q |
| Q | set of passengers, where Q = Q1 ∪ Q2 ∪ Q3 ∪ Q4 |
| Q1, Q2, Q3, Q4 | respective numbers of passengers in the I, II, III, and IV categories |
| rq | {0,1} indicates whether the passenger q is served by the flex-route transit (rq = 1) or not (rq = 0) |
| S | set of all stops on the route, where S = C∪Q |
| ta(j) | time of arrival at stop j |
| arrival time at the drop-off stop corresponding to passenger q | |
| tb(i) | time of departure at stop i |
| departure time at the pick-up stop corresponding to passenger q | |
| tc | service time at every checkpoint, unit: min |
| td(q) | passenger q drop-off time |
| tn | service time at every non-checkpoint stop, unit: min |
| tpen | system penalty time due to unserved passengers, unit: min |
| tp(q) | passenger q pick-up time |
| ts | one-way operating time constraints/time windows, unit: min |
| tw(i) | time of walking from stop i to the corresponding reservation stop (non-cluster center demand points that belong to the same cluster and can be served), unit: min |
| vb | driving speed of the flex-route transit vehicle, unit: miles/h |
| vc | driving speed of the car, unit: miles/h |
| vw | walking speed of the passenger, unit: miles/h |
| xij | {0,1} indicates if an arc (i, j) is chosen (xij = 1) or not (xij = 0) |
| yi | {0,1} indicates if stop i is a dynamic meeting point and is included in the optimal route (yi = 1) or not (yi = 0) |
| ηi, ηj | number of passengers in the vehicle at stop i and stop j, respectively |
| θ | proper subset of set S except for the empty set |
| ξ | penalty time conversion factor |
| σ1 | fare cost per unit time of flex-route transit, unit: ¥/min |
| σ2 | fuel/taxi fare cost per unit time of car, unit: ¥/min |
| τ | rated passenger capacity of vehicle |
| φ1 | travel cost per unit time of flex-route transit, unit: ¥/min |
| φ2 | travel cost per unit time of car, unit: ¥/min |
| φ3 | travel cost per unit time of walking, unit: ¥/min |
| ωd, ωi, ωw, ωp | respective performance index, weight coefficient of vehicle, driving time cost, passenger in-vehicle time cost, passenger walking time cost, and penalty time cost. |
References
- Koffman, D. Operational Experiences with Flexible Transit Services: A Synthesis of Transit Practice; TCRP Synthesis 53; Transportation Research Board: Washington, DC, USA, 2004. [Google Scholar]
- Potts, J.F.; Marshall, M.A.; Crockett, E.C.; Washington, J. A Guide for Planning and Operating Flexible Public Transportation Services; Transit Cooperative Research Program (Report 140); Transportation Research Board: Washington, DC, USA, 2010. [Google Scholar]
- Xu, K.; Saberl, M.; Liu, W. Dynamic pricing and penalty strategies in a coupled market with ridesourcing service and taxi considering time-dependent order cancellation behaviour. Transp. Res. Part C Emerg. Technol. 2022, 138, 103621. [Google Scholar] [CrossRef]
- Volinski, J. Microtransit or General Public Demand-Response Transit Services: State of the Practice; Transit Cooperative Research Program (Report 166); Transportation Research Board: Washington, DC, USA, 2019. [Google Scholar]
- Currie, G.; Fournier, N. Why most DRT/micro-transits fail—What the survivors tell us about progress. Res. Transp. Econ. 2020, 83, 100895. [Google Scholar] [CrossRef]
- Daganzo, C.F.; Ouyang, Y. A general model of demand-responsive transportation services: From taxi to ridesharing to dial-a-ride. Transp. Res. Part B Methodol. 2019, 126, 213–224. [Google Scholar] [CrossRef]
- Rich, J.; Seshadri, R.; Jomeh, A.J.; Clausen, S.R. Fixed routing or demand-responsive? Agent-based modelling of autonomous first and last mile services in light-rail systems. Transp. Res. Part A Policy Pract. 2023, 173, 103676. [Google Scholar] [CrossRef]
- Li, X.; Quadrifoglio, L. Feeder transit services: Choosing between fixed and demand responsive policy. Transp. Res. Part C Emerg. Technol. 2010, 18, 770–780. [Google Scholar] [CrossRef]
- Jorgensen, R.M.; Larsen, J.; Bergvinsdottir, K.B. Solving the dial-a-ride problem using genetic algorithms. J. Oper. Res. Soc. 2007, 58, 1321–1331. [Google Scholar] [CrossRef]
- Chandra, S.; Quadrifoglio, L. A model for estimating the optimal cycle length of demand responsive feeder transit services. Transp. Res. Part B Methodol. 2013, 51, 1–16. [Google Scholar] [CrossRef]
- Saeed, K.; Kurauchi, F. Enhancing the service quality of transit systems in rural areas by flexible transport services. Transp. Res. Procedia 2015, 10, 514–523. [Google Scholar] [CrossRef]
- Kim, M.; Schonfeld, P. Conventional, flexible, and variable-type bus services. J. Transp. Eng. 2011, 138, 263–273. [Google Scholar] [CrossRef]
- Kim, M.E.; Schonfeld, P. Integrating bus services with mixed fleets. Transp. Res. Part B Methodol. 2013, 55, 227–244. [Google Scholar] [CrossRef]
- Kim, M.E.; Schonfeld, P. Integration of conventional and flexible bus services with timed transfers. Transp. Res. Part B Methodol. 2014, 68, 76–97. [Google Scholar] [CrossRef]
- Kim, M.E.; Schonfeld, P. Maximizing net benefits for conventional and flexible bus services. Transp. Res. Part A Policy Pract. 2015, 80, 116–133. [Google Scholar] [CrossRef]
- Fu, L. Planning and design of flex-route transit services. Transp. Res. Rec. J. Transp. Res. Board 2002, 1791, 59–66. [Google Scholar] [CrossRef]
- Zhu, H.; Kennedy, T.; Ma, H.; Zhang, H.; Leil, B.; Gningue, Y. A simulation system for flexible transit services based on E-CARGO. In Proceedings of the 2018 IEEE 15th International Conference on Networking, Sensing and Control (ICNSC), Zhuhai, China, 27–29 March 2018; IEEE: Piscataway, NJ, USA, 2018; pp. 1–6. [Google Scholar]
- Nourbakhsh, S.M.; Ouyang, Y. A structured flexible transit system for low demand areas. Transp. Res. Part B Methodol. 2012, 46, 204–216. [Google Scholar] [CrossRef]
- Kim, M.E.; Levy, J.; Schonfeld, P. Optimal zone sizes and headways for flexible-route bus services. Transp. Res. Part B Methodol. 2019, 130, 67–81. [Google Scholar] [CrossRef]
- Mehran, B.; Yang, Y.; Mishra, S. Analytical models for comparing operational cost of regular bus and semi-flexible transit services. Public Transp. 2020, 12, 147–169. [Google Scholar] [CrossRef]
- Marković, N.; Nair, R.; Schonfeld, P.; Miller-Hooks, E.; Mohebbi, M. Optimizing dial-a-ride services in Maryland: Benefits of computerized routing and scheduling. Transp. Res. Part C Emerg. Technol. 2015, 55, 156–165. [Google Scholar] [CrossRef]
- Amirgholy, M.; Gonzales, E.J. Demand responsive transit systems with time-dependent demand: User equilibrium, system optimum, and management strategy. Transp. Res. Part B Methodol. 2016, 92, 234–252. [Google Scholar] [CrossRef]
- Quadrifoglio, L.; Dessouky, M.M.; Palmer, K. An insertion heuristic for scheduling mobility allowance shuttle transit (MAST) services. J. Sched. 2007, 10, 25–40. [Google Scholar] [CrossRef]
- Quadrifoglio, L.; Dessouky, M.M.; Ordóñez, F. Mobility allowance shuttle transit (MAST) services: MIP formulation and strengthening with logic constraints. Eur. J. Oper. Res. 2008, 185, 481–494. [Google Scholar] [CrossRef]
- Zhou, X.; Xi, J.; Guan, Z.; Ji, X. Dispatching design for customized bus of hybrid vehicles based on reservation data. J. Adv. Transp. 2021, 2021, 8868291. [Google Scholar] [CrossRef]
- Grahn, R.; Qian, S.; Hendrickson, C. Improving the performance of first- and last-mile mobility services through transit coordination, real-time demand prediction, advanced reservations, and trip prioritization. Transp. Res. Part C Emerg. Technol. 2021, 133, 103430. [Google Scholar] [CrossRef]
- Grahn, R.; Qian, S.; Hendrickson, C. Optimizing first- and last-mile public transit services leveraging transportation network companies (TNC). Transportation 2022, 50, 2049–2076. [Google Scholar] [CrossRef]
- Liu, T.; Cats, O.; Gkiotsalitis, K. A review of public transport transfer coordination at the tactical planning phase. Transp. Res. Part C Emerg. Technol. 2021, 133, 103450. [Google Scholar] [CrossRef]
- Erdmann, M.; Dandl, F.; Bogenberger, K. Combining immediate customer responses and car–passenger reassignments in on-demand mobility services. Transp. Res. Part C Emerg. Technol. 2021, 126, 103104. [Google Scholar] [CrossRef]
- Wang, X.; Liu, W.; Yang, H.; Wang, D.; Ye, J. Customer behavioural modelling of order cancellation in coupled ride-sourcing and taxi markets. Transp. Res. Part B Methodol. 2020, 132, 358–378. [Google Scholar] [CrossRef]
- Schyns, M. An ant colony system for responsive dynamic vehicle routing. Eur. J. Oper. Res. 2015, 245, 704–718. [Google Scholar] [CrossRef]
- Gmira, M.; Gendreau, M.; Lodi, A.; Potvin, J.Y. Managing in real-time a vehicle routing plan with time-dependent travel times on a road network. Transp. Res. Part C Emerg. Technol. 2021, 132, 103379. [Google Scholar] [CrossRef]
- Ritzinger, U.; Puchinger, J.; Rudloff, C.; Hartl, R.F. Comparison of anticipatory algorithms for a dial-a-ride problem. Eur. J. Oper. Res. 2022, 301, 591–608. [Google Scholar] [CrossRef]
- Zhou, X.; Wang, L.; Zhou, K.; Huang, X. Research progress and development trend of dynamic vehicle routing problem. Control. Decis. 2019, 34, 449–458. [Google Scholar]
- Zhang, J.; Li, W.; Zheng, Y.; Guo, R. Dynamic clustering meeting points strategy to improve operational service capability of flex-route transit. J. Transp. Eng. Part A Syst. 2023, 149, 04023038. [Google Scholar] [CrossRef]
- Ester, M.; Kriegel, H.P.; Sander, J.; Xu, X. A density-based algorithm for discovering clusters in large spatial databases with noise. In Proceedings of the Second International Conference on Knowledge Discovery and Data Mining (KDD-96), Portland, OR, USA, 2–4 August 1996; Volume 96, pp. 226–231. [Google Scholar]
- Kaufman, L.; Rousseeuw, P.J. Partitioning Around Medoids (Program PAM); Wiley Series in Probability and Statistics; John Wiley & Sons, Inc.: Hoboken, NJ, USA, 1990; pp. 68–125. [Google Scholar]
- Qiu, F.; Li, W.; Zhang, J. A dynamic station strategy to improve the performance of flex-route transit services. Transp. Res. Part C Emerg. Technol. 2014, 48, 229–240. [Google Scholar] [CrossRef]
- Qiu, F.; Li, W.; Haghani, A. A methodology for choosing between fixed-route and flex-route policies for transit services. J. Adv. Transp. 2015, 49, 496–509. [Google Scholar] [CrossRef]
- Zheng, Y.; Li, W.; Qiu, F. A slack arrival strategy to promote flex-route transit services. Transp. Res. Part C Emerg. Technol. 2018, 92, 442–455. [Google Scholar] [CrossRef]
- Zheng, Y.; Gao, L.; Li, W. Vehicle Routing and Scheduling of Flex-Route Transit under a Dynamic Operating Environment. Discret. Dyn. Nat. Soc. 2021, 2021, 6669567. [Google Scholar] [CrossRef]
- Chen, X.; Wang, Y.; Wang, Y.; Qu, X.; Ma, X. Customized bus route design with pickup and delivery and time windows: Model, case study and comparative analysis. Expert Syst. Appl. 2021, 168, 114242. [Google Scholar] [CrossRef]
- Li, Y.; Liu, Y. Optimizing flexible one-to-two matching in ride-hailing systems with boundedly rational users. Transp. Res. Part E Logist. Transp. Rev. 2021, 150, 102329. [Google Scholar] [CrossRef]
- Zheng, Y.; Li, W.; Qiu, F.; Wei, H. The benefits of introducing meeting points into flex-route transit services. Transp. Res. Part C Emerg. Technol. 2019, 106, 98–112. [Google Scholar] [CrossRef]
Figure 1.
Flex-route transit service.

Figure 2.
Interaction processes between travel choice and route planning.

Figure 3.
System operation framework.

Figure 4.
Dynamic interactive scheduling framework.

Figure 5.
Flex-route transit service with dynamic meeting points strategy.

Figure 6.
Changing trend of unserved rate and operation time window utilization under different full load rate preferences and different demand levels.
Figure 6.
Changing trend of unserved rate and operation time window utilization under different full load rate preferences and different demand levels.

Figure 7.
Changing trend of unserved rate under different actual fluctuation acceptable coefficient of travel time and different demand levels.
Figure 7.
Changing trend of unserved rate under different actual fluctuation acceptable coefficient of travel time and different demand levels.

Figure 8.
Comparison of travel costs.

Figure 9.
Changing trend of unserved rate under different ε and different demand levels.

Figure 10.
Changing trend of unserved rate under different pricing levels and different demand levels.
Figure 10.
Changing trend of unserved rate under different pricing levels and different demand levels.


Table 1.
Various operation indicators of flex-route transit at different demand levels.
| Indicators | Passenger Demand (Passengers/Trip) | |||||
|---|---|---|---|---|---|---|
| 5 | 10 | 15 | 20 | 25 | 30 | |
| Total-FRT (¥) | 112.77 | 238.92 | 402.38 | 579.40 | 800.50 | 1037.70 |
| Total-Car (¥) | 140.53 | 282.71 | 411.07 | 552.40 | 720.75 | 885.56 |
| Served-FRT (¥) | 112.77 | 234.65 | 331.25 | 412.50 | 483.64 | 520.21 |
| Served-Car (¥) | 140.53 | 279.21 | 391.21 | 470.91 | 540.52 | 564.40 |
| Unserved rate (%) | 0 | 0.21% | 8.83% | 16.50% | 24.67% | 33.82% |
| Direct unserved rate (%) | 0 | 2.50% | 19.79% | 35.83% | 44.53% | 52.67% |
Disclaimer/Publisher’s Note: The statements, opinions and data contained in all publications are solely those of the individual author(s) and contributor(s) and not of MDPI and/or the editor(s). MDPI and/or the editor(s) disclaim responsibility for any injury to people or property resulting from any ideas, methods, instructions or products referred to in the content. |
© 2024 by the authors. Licensee MDPI, Basel, Switzerland. This article is an open access article distributed under the terms and conditions of the Creative Commons Attribution (CC BY) license (https://creativecommons.org/licenses/by/4.0/).
Share and Cite
MDPI and ACS Style
Zhang, J.; Guo, R.; Li, W. Research on Dynamic Scheduling and Route Optimization Strategy of Flex-Route Transit Considering Travel Choice Preference of Passenger. Systems 2024, 12, 138. https://doi.org/10.3390/systems12040138
AMA Style
Zhang J, Guo R, Li W. Research on Dynamic Scheduling and Route Optimization Strategy of Flex-Route Transit Considering Travel Choice Preference of Passenger. Systems. 2024; 12(4):138. https://doi.org/10.3390/systems12040138
Chicago/Turabian StyleZhang, Jin, Rongrong Guo, and Wenquan Li. 2024. "Research on Dynamic Scheduling and Route Optimization Strategy of Flex-Route Transit Considering Travel Choice Preference of Passenger" Systems 12, no. 4: 138. https://doi.org/10.3390/systems12040138
Note that from the first issue of 2016, this journal uses article numbers instead of page numbers. See further details here.