Article

Allometric Relations and Scaling Laws for the Cardiovascular System of Mammals

United States Naval Academy, 590 Holloway Road, Annapolis, MD 21402, USA
Systems 2014, 2(2), 168-185; https://doi.org/10.3390/systems2020168
Submission received: 11 February 2014 / Revised: 3 April 2014 / Accepted: 11 April 2014 / Published: 22 April 2014
(This article belongs to the Special Issue Allometric Scaling)

Abstract

:
The modeling of the cardiovascular system of mammals is discussed within the framework of governing allometric relations and related scaling laws for mammals. An earlier theory of the writer for resting-state cardiovascular function is reviewed and standard solutions discussed for reciprocal quarter-power relations for heart rate and cardiac output per unit body mass. Variation in the basic cardiac process controlling heart beat is considered and shown to allow alternate governing relations. Results have potential application in explaining deviations from the noted quarter-power relations. The work thus indicates that the cardiovascular systems of all mammals are designed according to the same general theory and, accordingly, that it provides a quantitative means to extrapolate measurements of cardiovascular form and function from small mammals to the human. Various illustrations are included. Work described here also indicates that the basic scaling laws from the theory apply to children and adults, with important applications such as the extrapolation of therapeutic drug dosage requirements from adults to children.

1. Introduction

The general subject of this paper is the modeling of the cardiovascular systems of mammals. The modeling to be dealt with is that associated with the derivation and discussion of allometric relations and scaling laws for the system. The present paper also involves discussion of the significance of these laws in understanding physiological processes of mammals. Earlier experimental measurements on various aspects of the cardiovascular system of mammals have been reported by Clark [1], Brody [2], Holt et al. [3,4], Schmidt-Nielsen and Pennycuik [5], Gear et al. [6] and Hoppeler et al. [7], among others; and more recent studies on related topics include those of Dlugosz [8], Seymour and Blaylock [9], White, Blackburn and Seymour [10] and White and Seymour [11], among others. Detailed theory providing insight into the subject has also been discussed by the writer in a number of publications [12,13,14,15].
Scaling laws and the attendant similarity they indicate, when confirmed by measurements, are important in the general understanding of the cardiovascular system of humans. They can serve to illustrate that all mammals are “designed” according to the same general theory. Hence, the study of the system on the basis of measurements from other mammals can reveal important information for the human regarding physiological processes and proposed explanations. In a broader sense, the study of the system can provide guidance in dealing with complex modeling issues where different scaling laws apply to different parts of the same system.

2. The Cardiovascular System

Overall design of the cardiovascular system of mammals is well known. It consists of left and right sides of the heart (the pumps) and two major parts of the circulatory system (the pipes). The systemic part of the circulation is associated with transport of blood from the left side of the heart to the main body for exchange of oxygen and other products and its subsequent return to the right side of the heart. The pulmonary part of the circulation is associated with transport of blood from the right side of the heart to the lungs for recharge of oxygen and discharge of gaseous products and its transport back to the left side of the heart. In both cases, arterial vessels of various sizes are used to carry blood away from the heart to the capillary vessels for exchange of products and venous vessels of various sizes are used to return the blood to the heart.
Relative estimates of the inertial resistance (associated with blood acceleration) and viscous resistances (associated with blood velocity) in the various groups of vessels may be formed from representative values of vessel size. The average inertial resistance fI (with units of pressure) is described from engineering theory by the equation
Systems 02 00168 i001
where ρ denotes blood density, L and r denote, respectively, the length and radius of the vessel, n denotes the number of vessels, and QR denotes blood-flow acceleration (in units of volume per time per time). Also, the coefficient β* denotes a factor that takes into account branching of vessels from the vessels under consideration. For all but the (non-branching) capillaries, its value may be estimated as ½, and for the capillaries it value is unity. The viscous resistance (with units of pressure) is similarly described by the Poiseuille equation with branching factor, that is
Systems 02 00168 i002
where μ denotes the viscosity coefficient of the blood, and Q denotes blood-flow velocity (in units of volume per time). For investigation of relative importance of inertial and viscous effects in the arterial and capillary systems, the following ratio may be formed from these equations
Systems 02 00168 i003
Now, measurements of initial outflow from the left side of heart of the human show a relatively uniform rise to 550 mL/s in about 0.05 s [16]. The blood acceleration during the initial part of the cycle is thus about 550/0.05 = 11,000 mL/s2 and the associated average flow is about 275 mL/s, as noted in earlier work of the writer [17]. The ratio QR/Q in Equation (3) can accordingly be estimated as 11,000/275 or 40/s. Thus, with typical values of blood density ρ of 1.05 g/cm3 and viscosity µ of 0.04 dynes-s/cm2 [18] and with a radius r of 0.5 cm used for a representative artery, the equation gives the ratio fI/fv of 33, thus indicating that inertial forces can be expected to dominate in the arterial system. In contrast, with a radius r of 0.0005 cm chosen for a representative vessel from the capillary system, the equation gives 3.2 × 10⁻⁵ which indicates that viscous forces can be expected to dominatein the capillary system. Similarly, for the venous system, viscous forces can be expected to dominate because of the resulting near- steady flow of the blood after passing through the capillaries.

3. Theoretical Scaling Laws for Mammals—Review and Discussion

3.1. Scaling of Heart Dimensions

Directly associated with scaling laws for the vascular system are those associated with the heart itself. The author has considered the matter earlier [12]. In particular, it is well known on the basis of measurements that the empty heart weight varies essentially in direct proportion with mammal mass, and that the total volume of blood in the cardiovascular system likewise varies is this manner [2]. The mass and volume of the left and right ventricles, the pumping chambers of the heart, may therefore be assumed to vary directly with mammal mass, as they are part of the whole in each case. Thus, considering a ventricle as roughly cylindrical in form with length l, average radius a, and wall thickness h, the following relations may be written
Systems 02 00168 i004
and
Systems 02 00168 i005
where M denotes body mass and the symbol Systems 02 00168 i006 
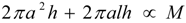
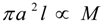
denotes proportionality. The first relation is concerned with the ventricular mass and expresses the fact that the net tissue volume (and hence its mass) is proportional to mammal mass. The second relation expresses the fact that the inside volume of the ventricle is proportional to mammal mass.
Now, the two terms in the first of the above relations must both be proportional to body mass if their sum is proportional. These two relations, together with Equation (4b), therefore require that all three dimensions of the heart ventricles must scale with mammal mass according to the relations:
Systems 02 00168 i007

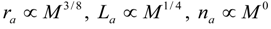
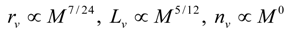
3.2. Scaling of Blood Vessels

The author has derived earlier the scaling laws for the arterial, venous and capillary vessels of mammals [12]. Details are summarized here. First, the numbers of arterial and venous vessels in the body are assumed to be constant, independent of size. Next, it is noted that the flow rate QR and flow Q in Equations (1) and (2) may, for scaling purposes, be expressed in terms of heart rate ω and ventricular volume πa2l as ω 2a2l and ω a2l, respectively. Thus, with F0 denoting the amplitude of ventricular wall force associated with periodic contractions and E denoting the elastic modulus (with units of pressure) associated with subsequent relaxations, the equation relating cardiac output Qb (average outflow) to vascular resistance may be written in dimensionless (non-unit) form as
Systems 02 00168 i008
where f denotes a general unspecified function, ra and La denote radius and length of arterial vessels, respectively; rc, Lc and nc denote radius, length and number of capillary vessels; and rv and Lv denote radius and length of venous vessels. Scaling laws follow from this relation by noticing that the left side will be fixed, independent of size, if the four ratios on the right side are fixed. Assuming constant values for the blood density ρ, the blood viscosity µ, the elastic modulus E and contractile stress amplitude F0/hl, the following relations may be written:
Systems 02 00168 i009
where M has been substituted for the product a2l, as indicated by Equation (5).
In addition to these relations, three others may be written associated with the fact that the total blood volume in mammals varies directly with mammal mass. The blood volume in the connecting vessels and the capillary system can therefore similarly be assumed to vary in this manner. The following relations thus apply:
Systems 02 00168 i010
Equations (7) and (8) provide six relations between the eight variables ra, La, rv, Lv, rc, Lc, nc, and ω. Two additional relations are thus needed for determining their variation with mammal mass. The idea behind the development of the needed additional relations is that the variables associated directly with the “characteristic” capillary system described above can be expected to apply also to the capillaries of the ventricles, since their mass is proportional to body mass. Thus, the number of capillaries in the ventricles can be considered proportional to the number of capillaries nc associated with the Equations (7) and (8). The number of related cardiac cells in the ventricles can also be considered to be proportional to the number of capillaries supplying them. Thus, the volume of a single cardiac cell can be considered proportional to the ratio of heart mass to capillary number; or, since heart mass and body mass are proportional, the volume of a single cardiac cell can be considered proportional to the ratio M/nc . The characteristic length d* of a cardiac cell is therefore expressible as
Systems 02 00168 i011
with length, diameter and wall thickness of the cells all scaling in this manner.
Now, cardiac muscle tissue consists mainly of contraction fibers which, when excited, provide the pumping action of the heart. The fibers consist of series connections of cardiac cells. Contraction is initiated in the upper heart by electrical discharge and subsequently spreads over the heart by signal propagation, causing the influx of ions into the cardiac cells making the fibers. There are two matters to be considered: (1) the heart rate as influenced by the diameter of the cardiac fibers, with the latter assumed the same as the linear dimension d* defined above; and (2) the heart rate as influenced by the influx of ions into the fibers.
Heart Rate and Fiber Diameter. It is generally known that the propagation speed c of an electrical signal in cardiac muscle fiber varies with fiber diameter d, with propagation faster in the larger diameter fibers. A simple power-law expression with c proportional to d β is typically assumed, with β denoting a constant. A value of β equal to 2/3 was determined appropriate by the author in earlier work [12] and will be used here. Implication of other values will also be considered in later remarks. Regarding heart rate, it is assumed that the period between resting heartbeats is proportional to the ratio of heart length l to signal speed c. The heart rate ω is, of course, equal to the reciprocal of this period, so that, with Equation (9) applying to d and with ω = c/l, the following relation results
Systems 02 00168 i012
Heart Rate and Ion Movement. A second relation follows from consideration of the transfer of ions into and out of the cardiac cells making the fibers so as to cause fiber contraction and recovery. Let m denote the mass of ionic substance moving into (or out of) a cardiac cell in time t. The relation for rate of transfer m/t may be written (by analogy with Fick’s law for diffusion) for a cardiac cell of surface area S and wall thickness h as
m / t = K(S / hF
where K denotes a constant (in units of time per area) and ΔF denotes the driving force. With cell diameter d and length l, the cell surface can be represented as the product of circumference πd and length l and the time for a heart cycle can be expressed as 2π/ω. Equation (11a) can thus be written as
Systems 02 00168 i013
The left-hand side of this equation is equal to the ionic mass per cell volume, and this may tentatively be assumed to be independent of mammal size. With the constant K and driving force ΔF also tentatively assumed independent of size, it can be seen that the product of heart rate ω and cell dimensions h and d must likewise be constant under change of scale. With h, d and l all scaling the same way, as d* in Equation (9), it can thus be seen that heart rate is expressible as
Systems 02 00168 i014
Equations (10) and (12), together with the six expressions of Equations (7) and (8), provide a solution for the scaling laws for the arterial, venous, and capillary vessels and heart rate. The complete solution is expressible as [12]
Systems 02 00168 i015
Systems 02 00168 i016
Systems 02 00168 i017
where it is noted that the number of arterial and venous connecting vessels na and nv are invariant with scale change. The scaling relation for the heart rate is also determined from Equations (10) or (12) as
Systems 02 00168 i018
Using Equation (5) for heart dimensions, the left-hand side of Equation (6) provides the scaling relation for the cardiac output, namely
Systems 02 00168 i019
These last two relations are in agreement (at least in an average sense) with earlier studies when a wide range of mammals were considered [12,13]. This agreement accordingly provides support for the tentative assumptions used in developing Equation (13) through Equation (15).

4.Comment on Theory and Variation of Solution

It is worthwhile to note the differences that arise if values of β different from 2/3 are used for the exponent in the above relation for propagation (or signal) speed c. For a higher value of β = 1, the modified Equation (10) and Equation (12) predict a body-mass exponent for heart rate of −2/9, that is, a power of −0.22; and that for cardiac output of 7/9, that is, a power of 0.78.
The value of 2/3 for the exponent β in the propagation-speed relation, noted in connection with Equation (10), was chosen earlier by the author [12] because it led to nominal relations for cardiac output and heart rate like Equations (14) and (15). Interestingly, if an extreme value for β of zero is assumed, corresponding to no dependence of propagation speed on fiber diameter, the resulting expressions require that heart rate varies as mammal mass to the power −1/3 and that cardiac output varies with mammal mass to the power 2/3. Thus, if the propagation-speed relation varies among certain species in the manner just described, it would be expected that the body-mass exponent for the relation for cardiac output (and related relation for Basal Metabolic Rate) would vary between 0.67 and 0.78. Interestingly, such variation has been noted and discussed by White, Blackburn and Seymour [10], and the foregoing accordingly offers a possible simple explanation within the framework of the present theory.

5. Some Comparisons with Measurements

5.1. Arterial and Venous Vessels

Holt et al. [4] have reported measurements of the aorta and inferior vena cava of mammals over size range from mouse to cow. A study of these measurements within the context of the presently discussed theory indicates that they can, in fact, be represented well by the Equations (13a) and (13c) with lead coefficients determined by regression analysis. The corresponding coefficients of determination r2 (for the coefficients) from the regression analysis also indicate excellent agreement between theory and measurement. Results are summarized below in Equations (16a) and (16b):
ra = 0.175 M3/8 (r2 = 0.99) and La = 20.6 M1/4 (r2 = 0.99)
and
rv = 0.379 M7/24 (r2 = 0.95) and Lv = 8.30 M5/12 (r2 = 0.96)

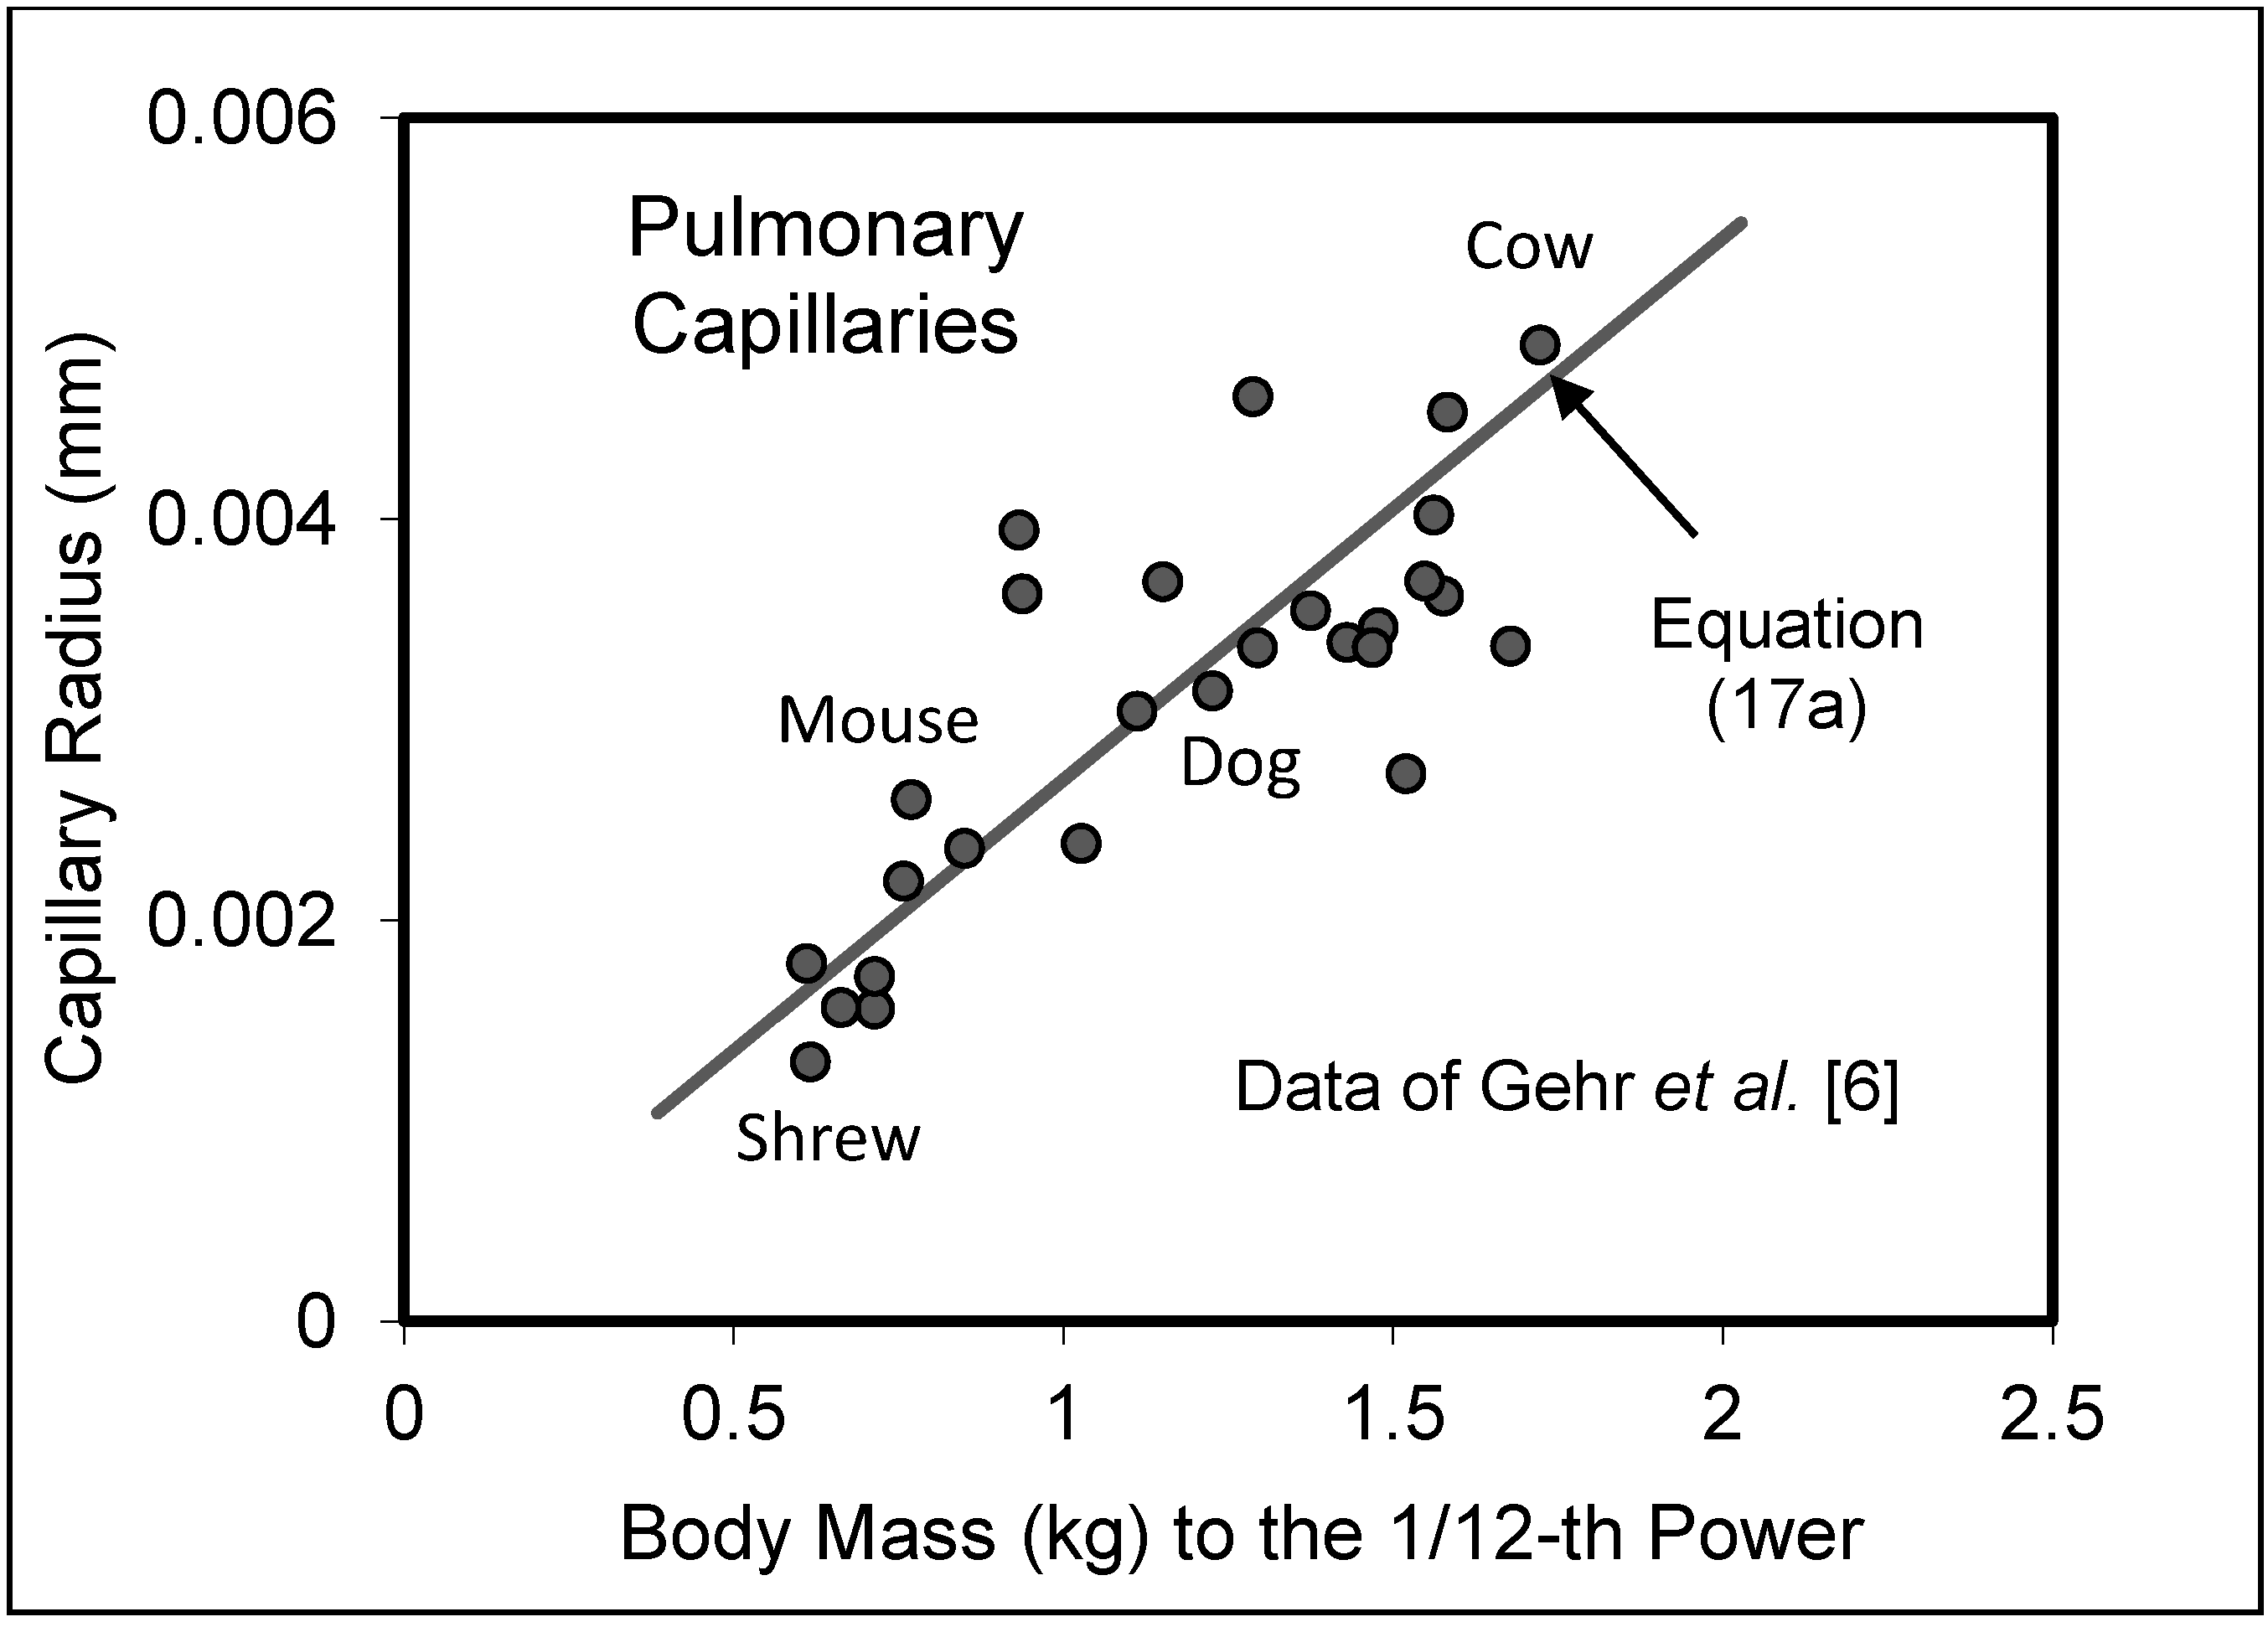
5.2. Capillary System

Considering now the capillary system, it may first be noted that direct experimental measurements are limited regarding the systemic side of the circulation, but the data available are consistent with the theory described here. In particular, there are the counting measurements of Kunkel [19] that may be regarded as evidence for the scaling law for the number nc of the capillaries. These measurements involve the number of nephrons in the kidneys of mammals of various sizes. The nephron is the basic unit in the kidney and consists of a collection of capillary vessels from which fluid is extracted from the blood and wastewater, or urine, is produced. Assuming similar function, the number of capillaries per nephron will be the same for any mammal, and hence a count of nephrons in a kidney can be considered to be proportional to a count of capillaries in the kidney. The measurements of Kunkel (mouse to ox range) were analyzed by Adolph [20] and shown to obey a power law relation, with mammal mass raised to the power 0.62, which may also be taken as 5/8 and thus is consistent with the third of Equation (13b).
There are also measurements of Kunkel [19] concerning the diameter of renal capsules that indicate variation with mammal mass to a power of essentially 1/12, as determined by Adolph [20]. This variation may be taken as evidence for the scaling relation for the radius rc given by Equation (13b), since the diameter of the renal capsules may be considered proportional to the diameter of the contained capillaries within them.
Fortunately, for the pulmonary side of the circulation, there are more direct measurements of capillary volume and surface area of the pulmonary capillaries in mammals of widely different size [6]. In average terms, the volume of the capillaries was found to be directly proportional to mammal mass, and their surface area was found proportional to mammal mass raised to the power 0.93. By simple geometry, these results lead to the conclusion that capillary radius rc varies with mammal mass to the power 0.07 and that net capillary length ncLc varies with mammal mass to the power 0.86. These exponents are in good agreement with the theoretical values from Equation (13b), that is, 1/12 (or 0.083) and 5/6 (or 0.83), respectively.
These data may also be examined for the capillary radius rc and net capillary length ncLc of individual mammals, as described by Equation (13b). This matter has been considered earlier by the author [12,13]. Best-fit calculations for the coefficients have been calculated from the data as
rc = 0.0027M1/12 (r2 = 0.95)
and
ncLc = 160M5/6 (r2 = 0.99)
Values for the capillary radius, so determined in connection with Equation (17a), are shown for illustration purposes in Figure 1. Although appreciable scatter exists, the agreement overall can be seen to be good.
Figure 1. Data (circles) for capillary radius from pulmonary side of circulation compared with 1/12-th relation of Equation (17a).
Systems 02 00168 g001

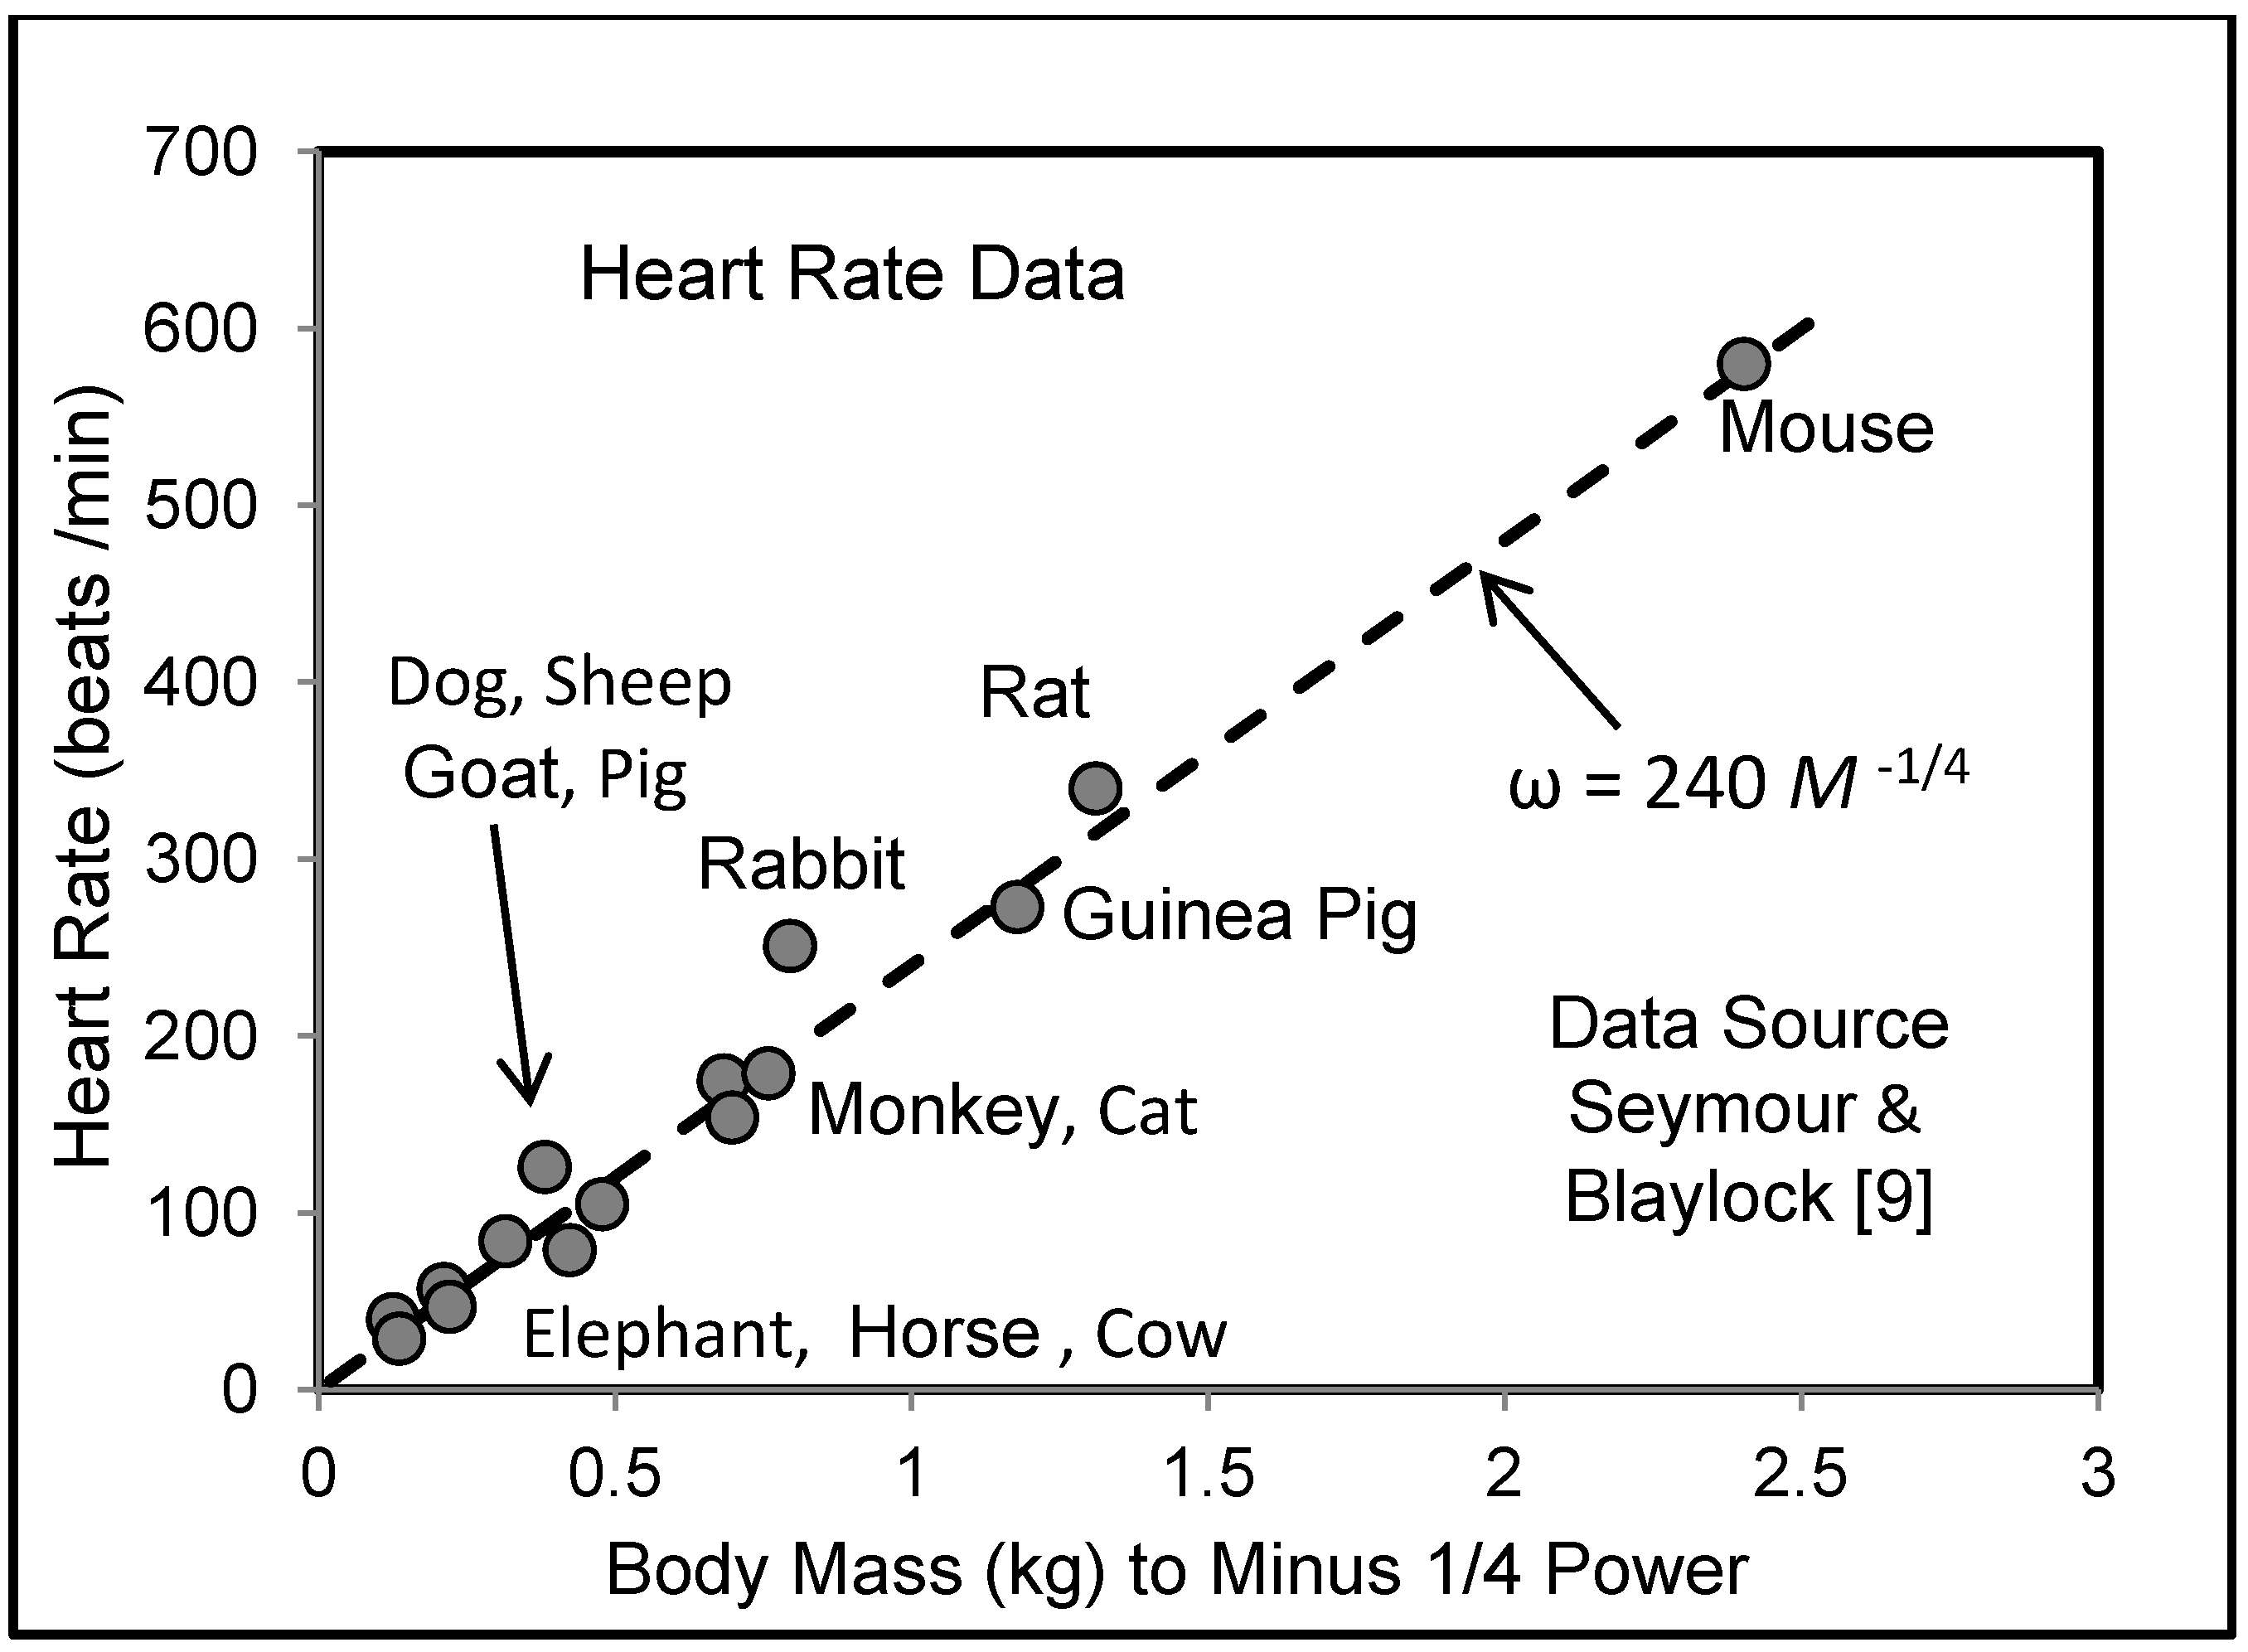
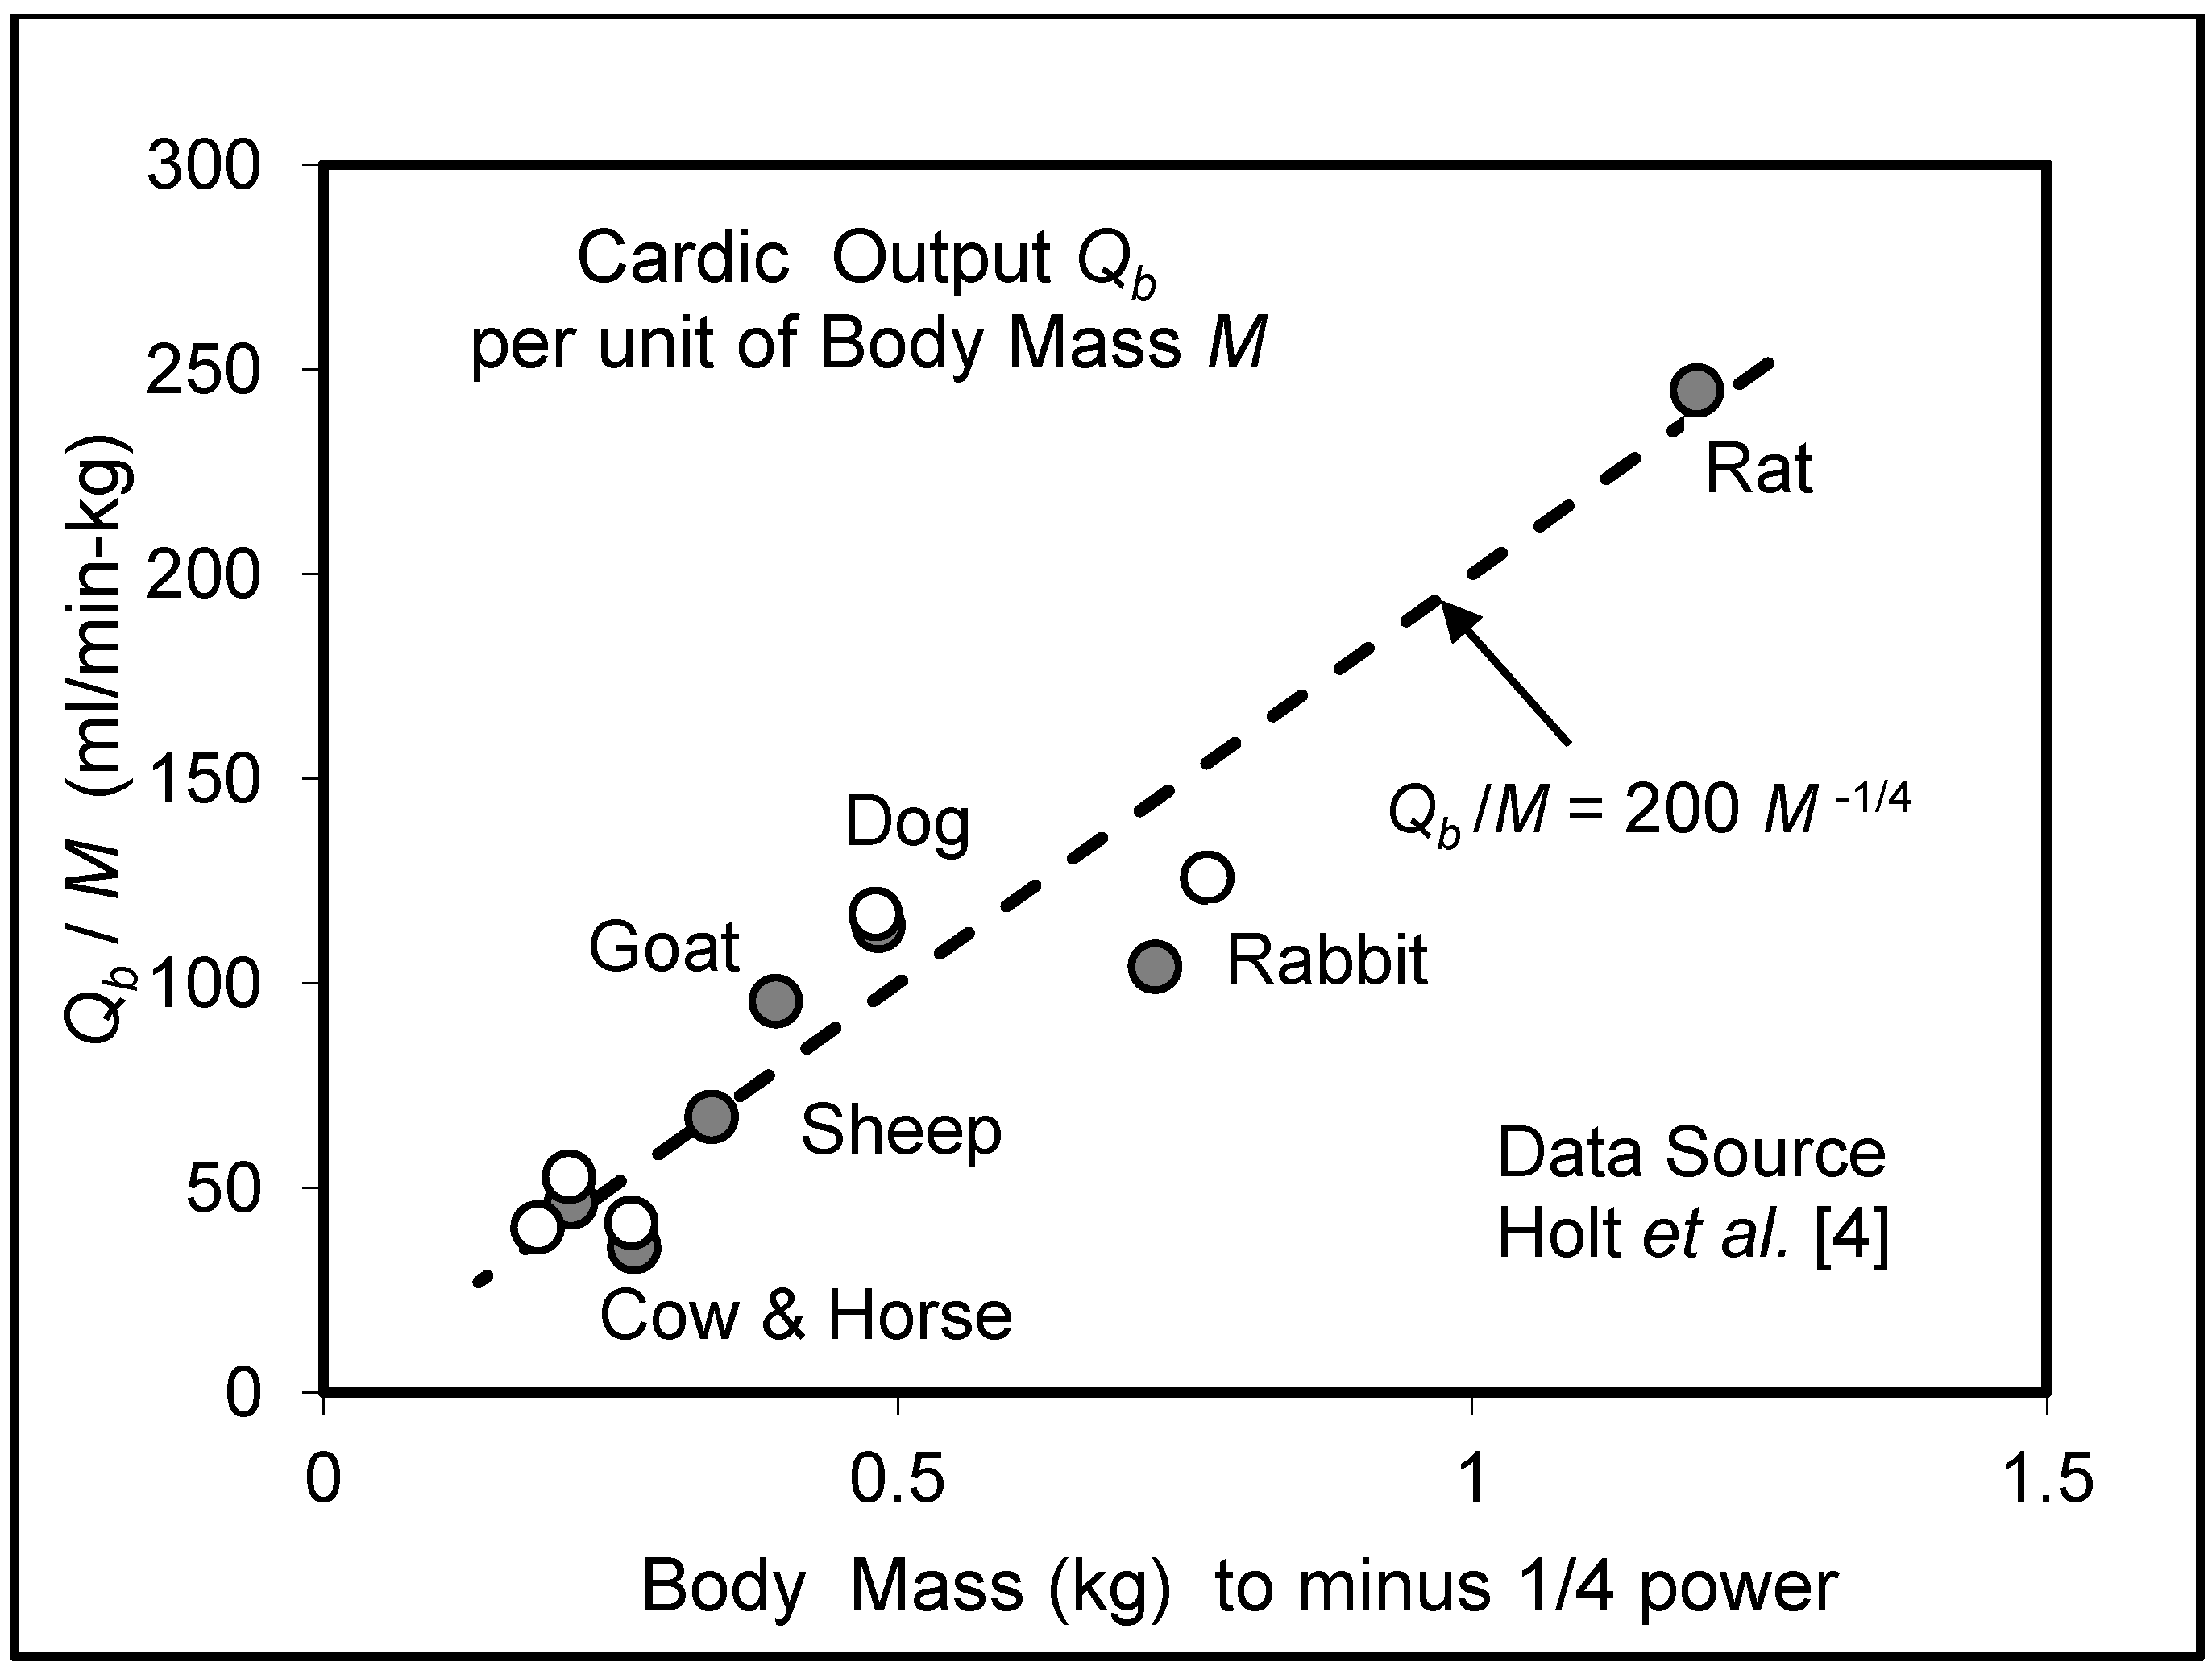
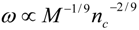
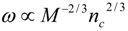
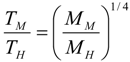
5.3. Heart Rate and Cardiac Output

Two remaining variables need discussion in connection with the basic Equation (6) and these refer to heart rate and cardiac output as associated with Equations (14) and (15). According to the theory, the former should vary with body mass to the negative ¼-th power and the latter with body mass to the positive ¾-th power. Data have been collected from works of Seymour and Blaylock [9] and Holt et al. [4] to demonstrate these well-known relations, as discussed below.
Figure 2. Data illustrating variation of resting heart rate with mammal mass to the negative ¼-th power, as required by present scaling theory.
Systems 02 00168 g002
Heart Rate. Figure 2 illustrates the excellent agreement of heart-rate measurements with the above noted dependence, as has generally been known for many years. Interestingly, the equation shown in the figure provides a heart-rate value of 82 beats per minute for human with body mass of 70 kg, consistent with, though 10% or so higher than, common experience.
Cardiac Output. Measurements of variation of cardiac output with mammal mass have been reported by Holt et al. [3]. A graphical display of these results is shown in Figure 3 where for clarity cardiac output is expressed per unit of body mass. Agreement with the indicated relation can be seen to be good. The indicated equation in the figure provides a value for cardiac output of 4,800 mL/min for the human of body mass 70 kg, in general agreement with experience.
Figure 3. Graphical display of averaged resting cardiac output per unit of body mass. Open circles denote measurements from the right ventricle and closed circles denote those from the left ventricle.
Systems 02 00168 g003

6. Effects of Vascular Size on Function

The preceding discussion has indicated that strong similarity exists in the design of mammals of vastly different size. Regarding the effect of vascular size on physiological function, two examples have already been cited, namely heart rate and cardiac output. A few more will be mentioned here.

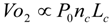
6.1. Oxygen Consumption Rate

Resting oxygen consumption rate has long been a subject of interest in physiology because of its role as fuel supply in bodily function. Measurements by Kleiber [21] and Brody and Procter [22] over a wide range of mammal sizes first indicated that this oxygen consumption rate varies essentially with mammal mass to the power 3/4. This, of course, is the same general relation as that discussed above for cardiac output, consistent with the view that resting oxygen consumption rate and resting cardiac output are proportional under change of scale.
The matter may also be examined from basic considerations, recognizing the equivalence of resting oxygen consumption rate and resting oxygen transfer rate from the capillaries. Total oxygen transfer from the capillaries is governed by the well-known diffusion equation for gases and is directly proportional to the product of the difference in oxygen pressure inside and immediately outside the capillaries and the capillary surface area nc (2π rc) Lc. It must also be inversely proportional to capillary wall thickness hc. Assuming tentatively that the ratio of oxygen pressures inside a capillary and (resistive) pressure immediately outside is relatively invariant under change of scale and that the ratio of capillary wall-thickness to capillary radius is also invariant, the resulting similarity relation is found expressible as
Systems 02 00168 i020
where P0 denotes oxygen pressure in the blood.
Earlier work by the author [12] demonstrated that that the oxygen pressure in blood, as measured by Schmidt-Nielsen and Larimer [23], can be considered proportional to mammal mass raised to the –1/12 power over the mouse to horse range. The product ncLc can be seen from Equation (13b) to be proportional to mammal mass to the power 5/6. The product of the two in Equation (18) is therefore such that oxygen transfer and consumption rate are predicted to vary as mammal mass to the power 3/4, in agreement with observation when a wide range of mammal sizes is considered.

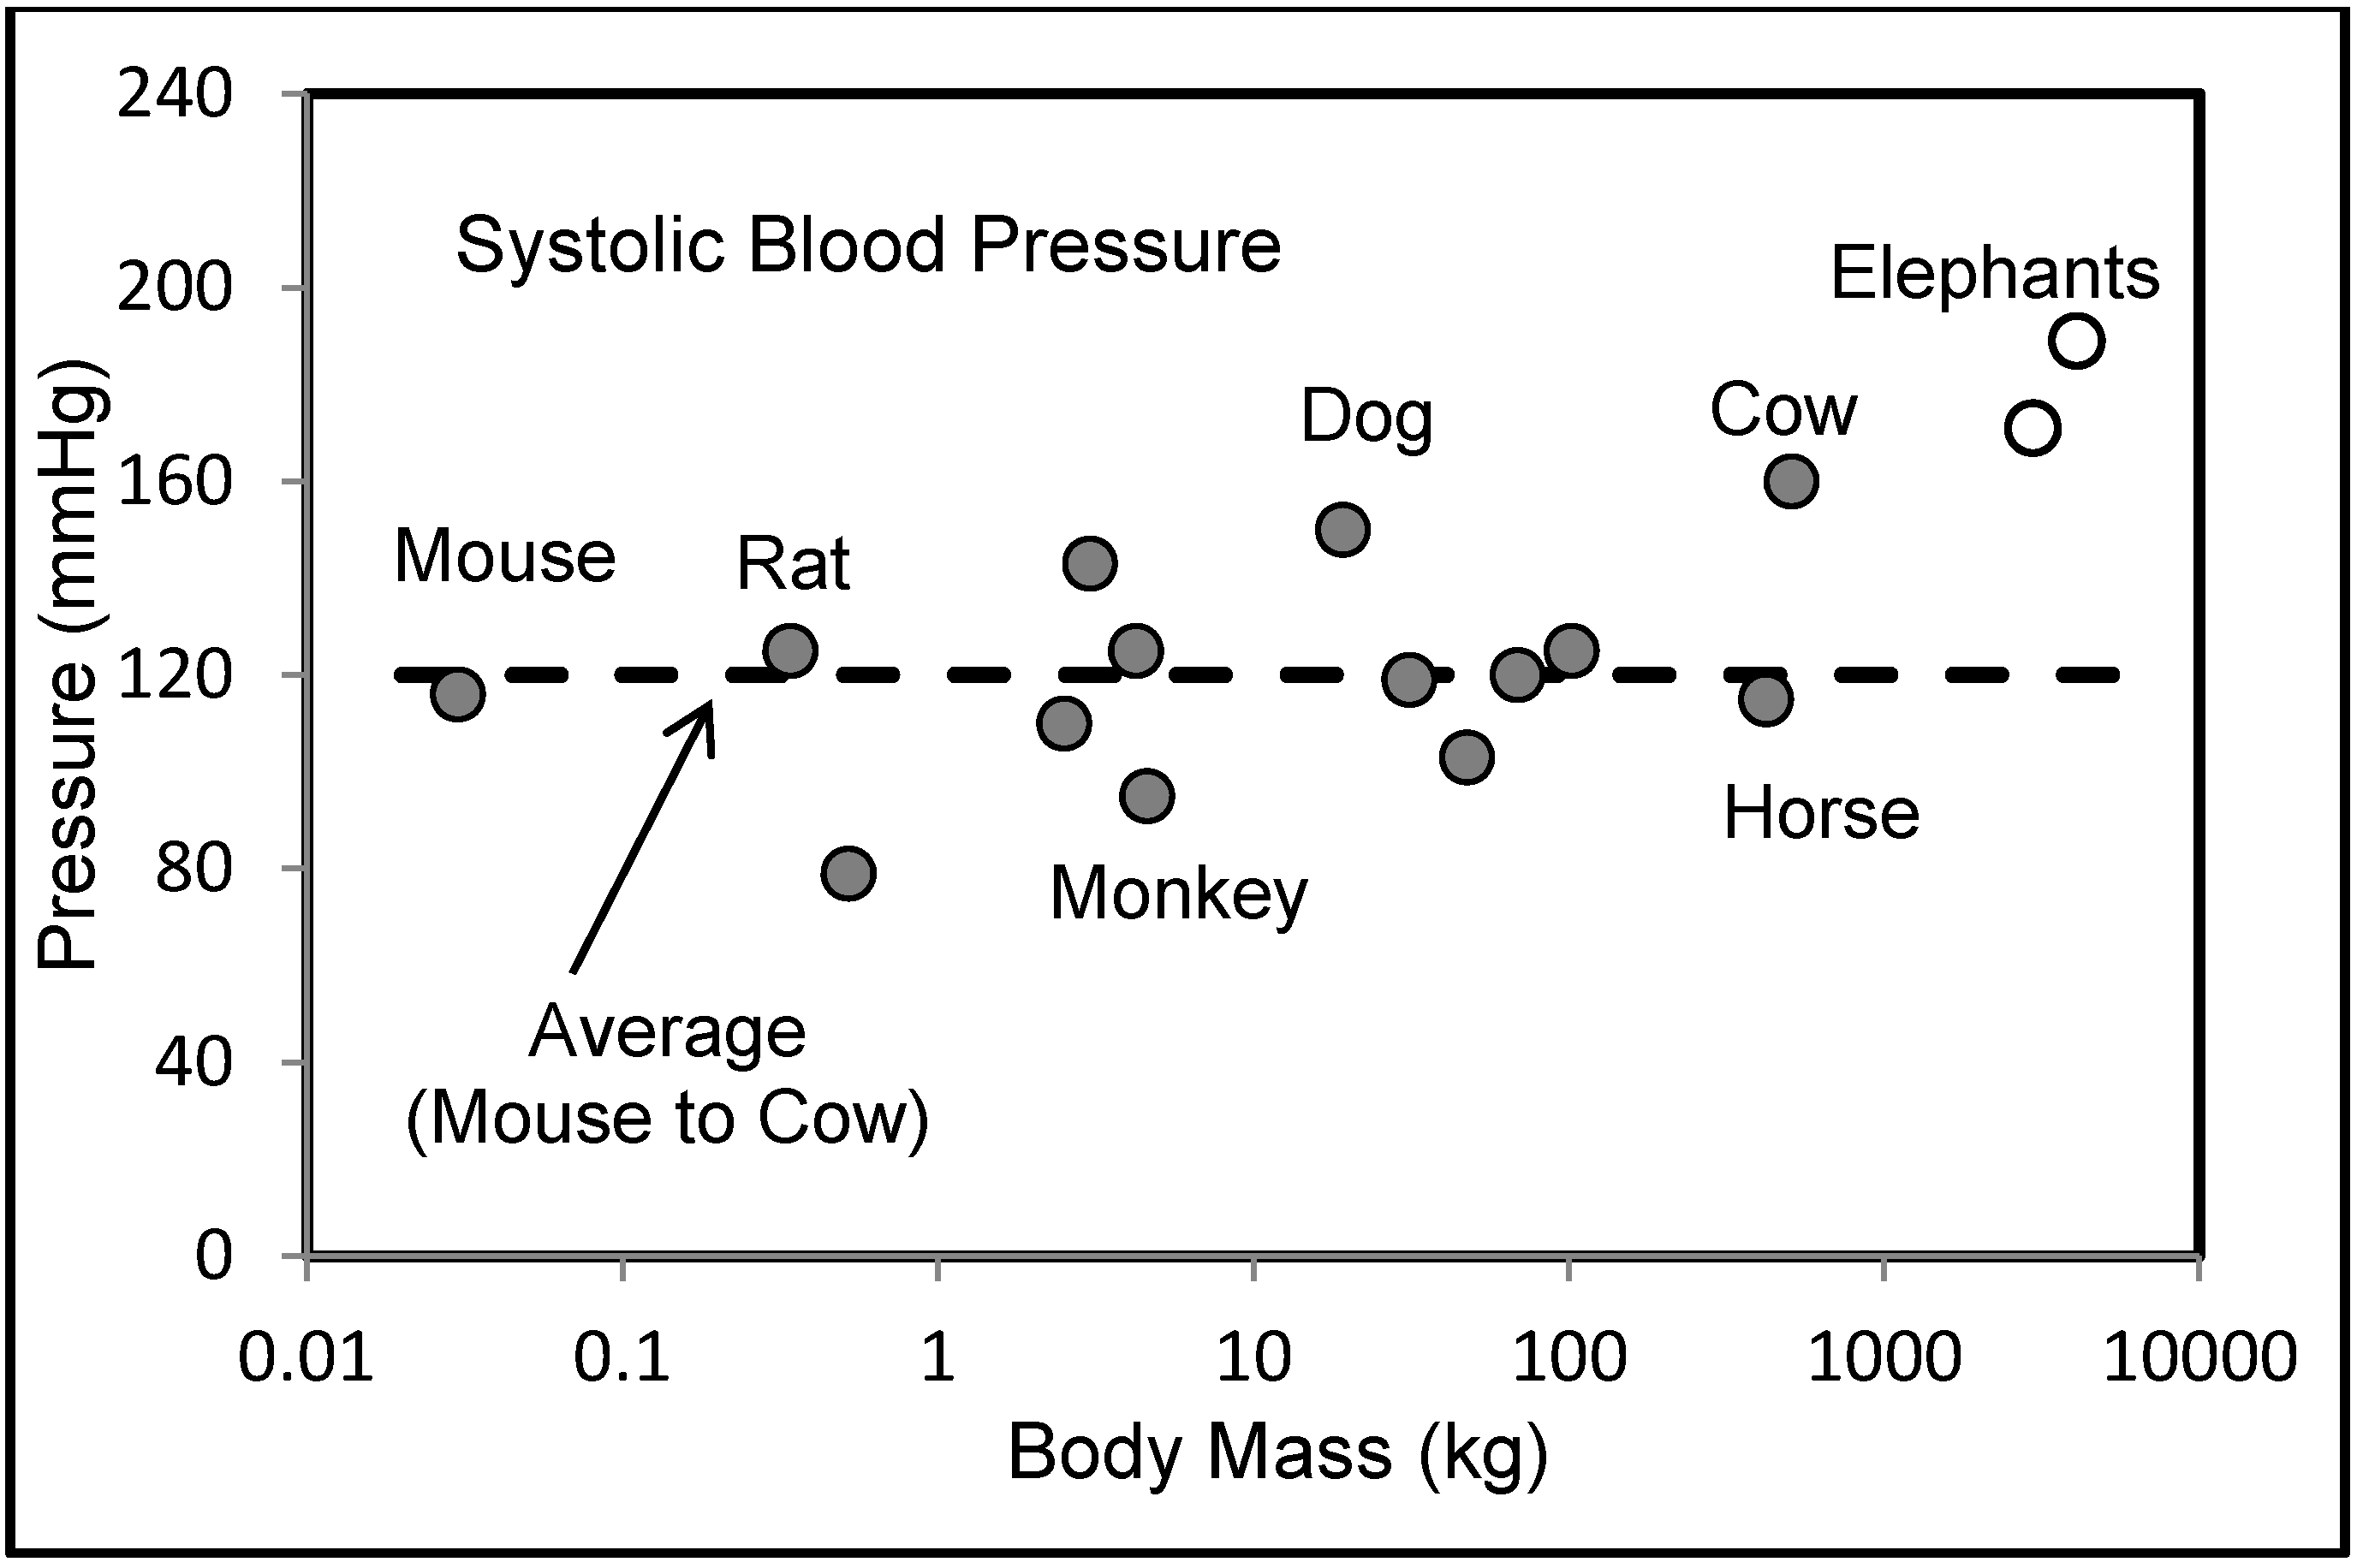
6.2. Blood Pressures

Systolic and diastolic blood pressures in the arterial system of mammals have been known for many years to be essentially independent of mammal size, at least in the resting state [24,25]. This condition is, in fact, predicted in the present work, and also in earlier work of the author [12]. Blood pressures can be expected to depend on the same variables as cardiac output. Thus, it is only necessary to replace dimensionless cardiac output on the left-hand side of Equation (6) by the dimensionless ratio P/E, with E denoting as earlier the (constant) elastic modulus of the heart muscle. Here, P can represent either the systolic or diastolic blood pressure. Consistent with the presently discussed scaling theory, all variables on the right-hand side of this modification of Equation (6) are fixed under change of scale, so that the left-hand side is also fixed. Blood pressures are accordingly predicted to be invariant under change of scale.
In addition to the earlier works of Woodbury and Hamilton [24] and Gregg, Eckstein and Fineberg [25], noted above, this result is also in general agreement with extensive measurements reported in the more recent literature, recognizing that some variability can be expected among and within individual species just as with humans where resting systolic pressures can range between 100 mmHg and 150 mmHg and still be considered with normal bounds. Some typical average measurements from the literature study by Seymour and Blaylock [9] for a number of mammals are shown below in Figure 4. The measurements for the elephant are somewhat higher than the others and may represent a deviation because of the associated very large body mass [11]. However, the measurements for the other mammals are in general agreements with the expected value from the human. In fact, the average value from mouse to cow of 120 mmHg is equal to that considered normal for the healthy human.
Figure 4. Measurements illustrating relative invariance of blood pressure with mammal size. Data from literature survey by Seymour and Blaylock [9].
Systems 02 00168 g004

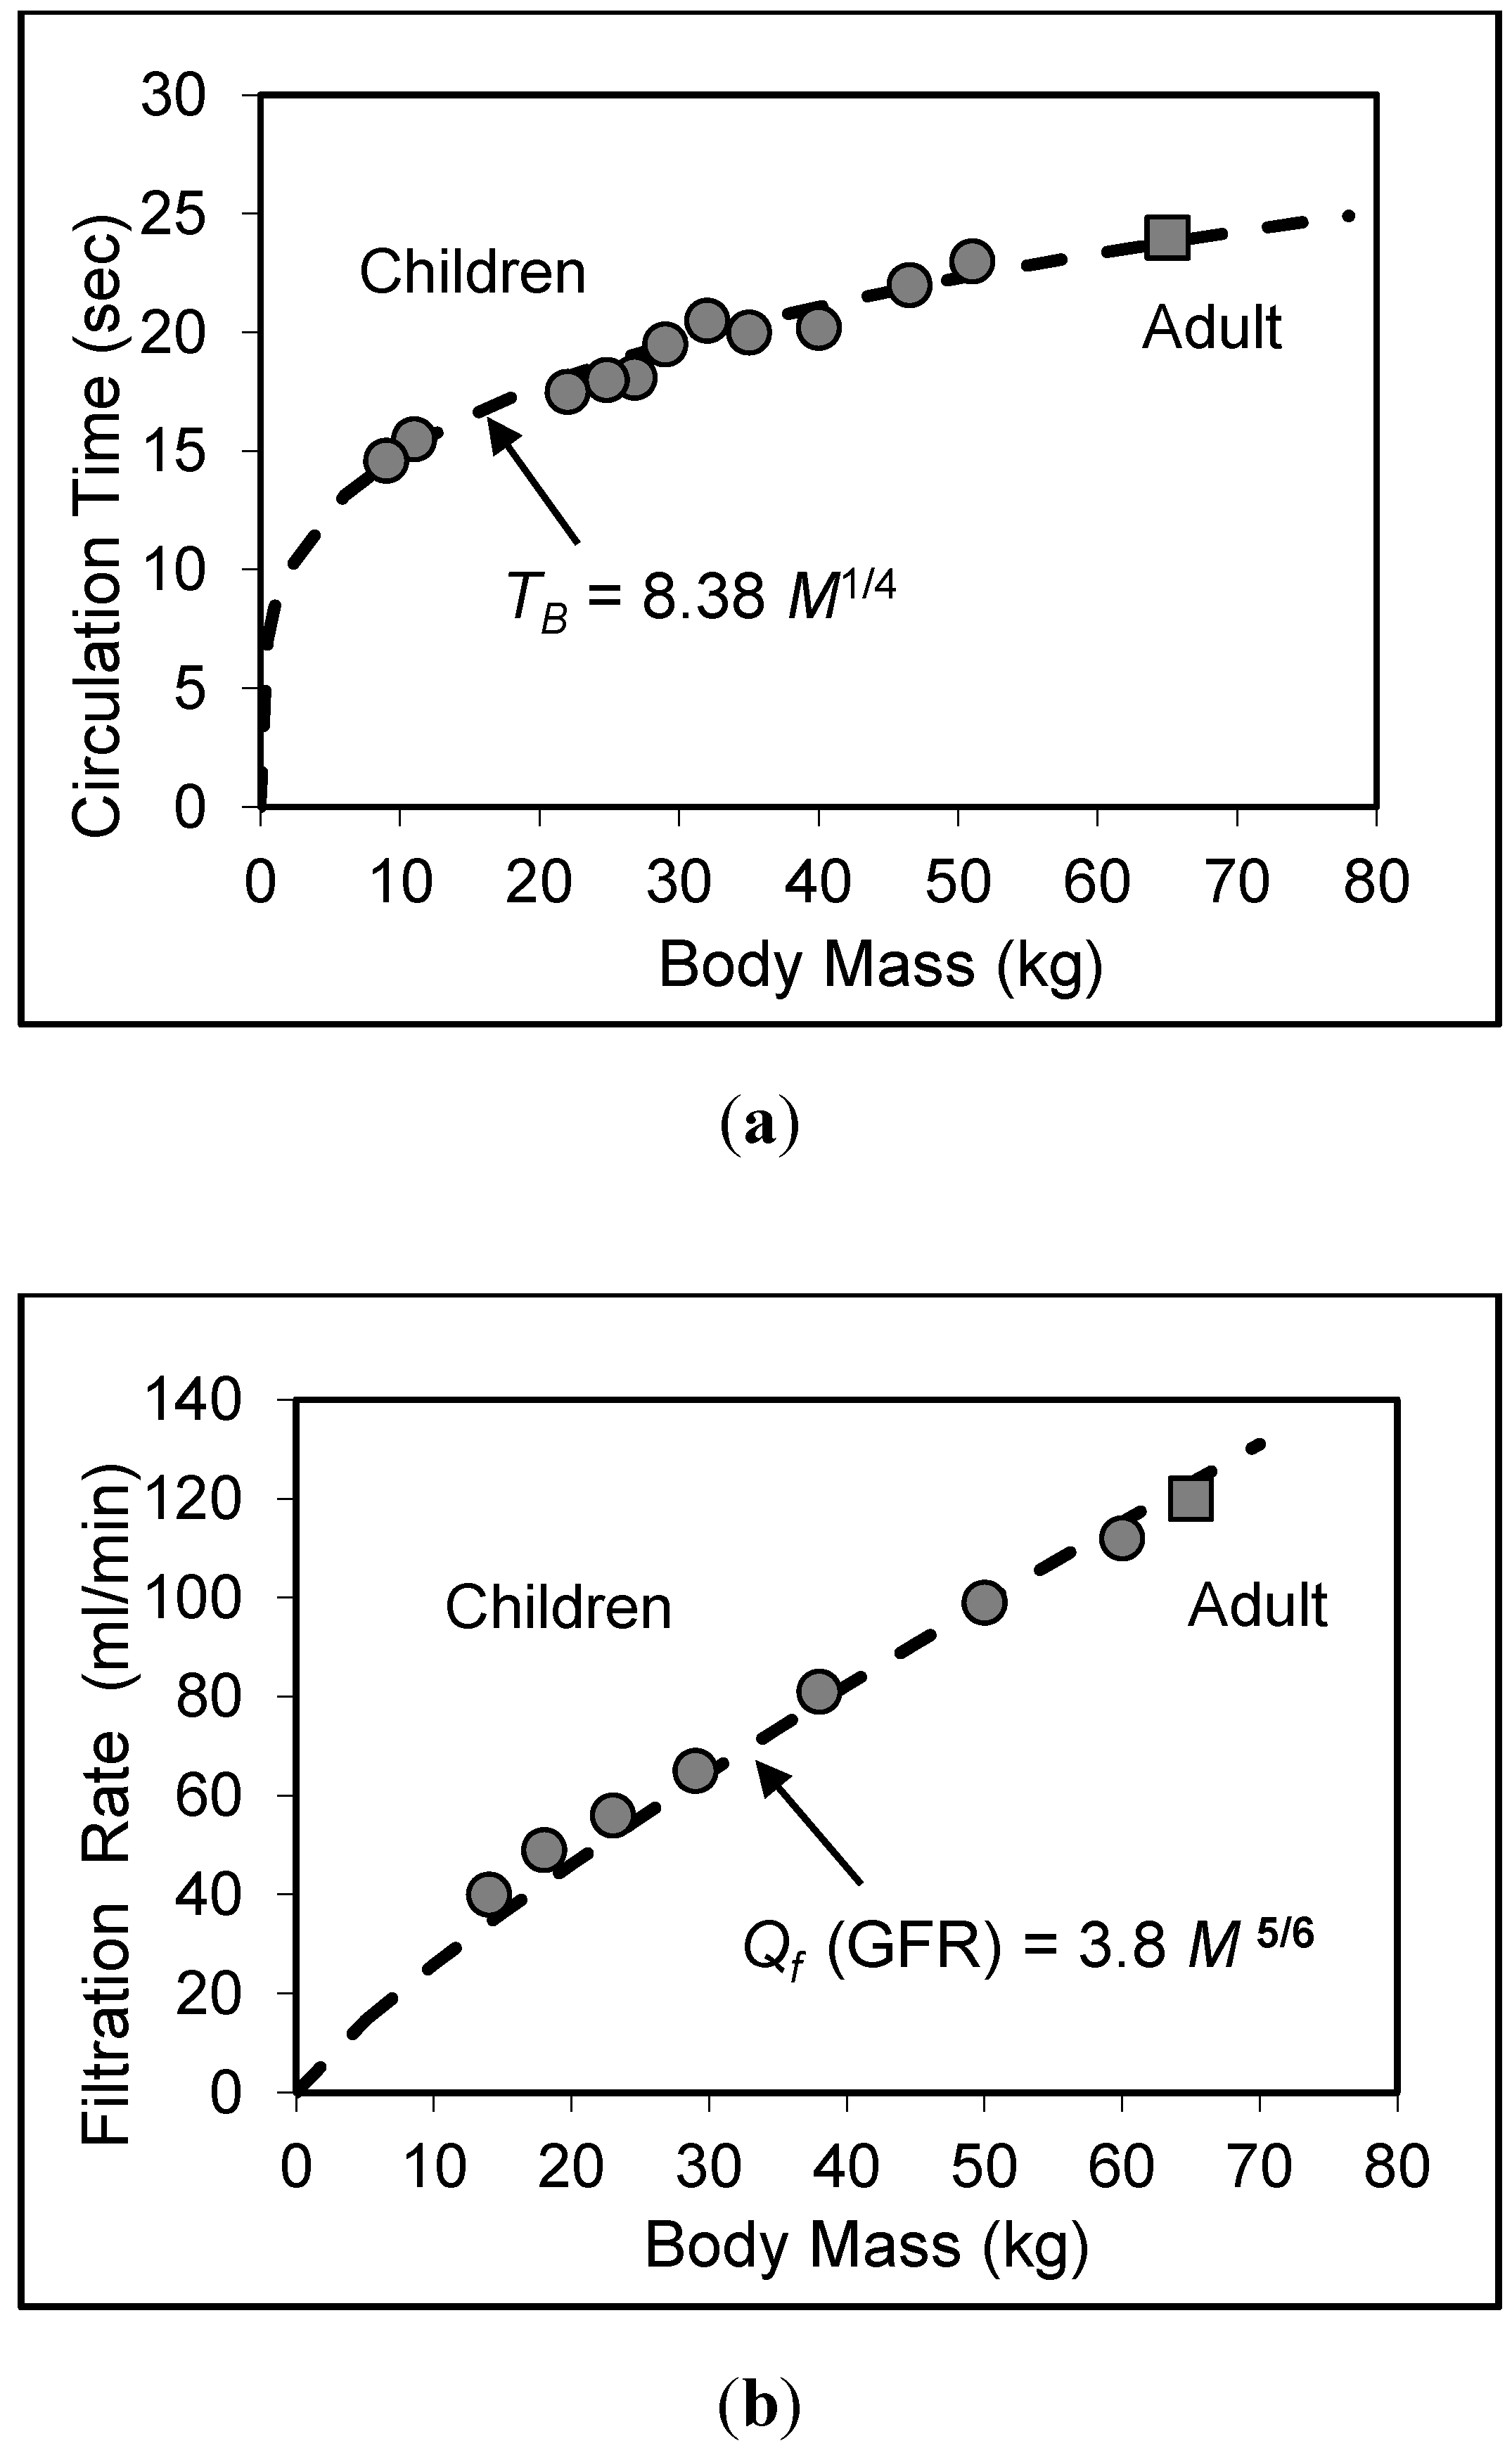
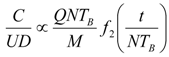
6.3. Circulation Time

The time for complete circulation of a small volume of blood around the cardiovascular system is known to be dependent on mammal size [26]. This time for the systemic system involves the time for travel through the arterial connecting vessels, the capillaries, and the venous connecting vessels. The time of travel through any of these vessels is proportional to the length of the vessel divided by the average velocity of the blood. The latter is proportional to the cardiac output divided by the cross-sectional area of the vessel. This, in turn, is proportional to the square or the vessel radius. The cardiac output, from Equation (15), is proportional to mammal mass to the power 3/4. Thus the time for travel through any vessel is described, for scaling purposes, by the general relation M−3/4 n L r2, with n, L, and r denoting variables in any one of the sets of three variables given by Equation (13).
Application of this latter relation to the arterial connecting vessels, using Equation (13a), show that the time for travel through the arterial vessels varies as mammal mass to the power 1/4. Similarly, application of Equations (13b) and (13c) for the capillary vessels and venous connecting vessels will give the same result. The same may be expected for the pulmonary system. Thus, since the total time T for complete circulation of a small element of blood around the cardiovascular system is the sum of these individual travel times, the predicted proportional relation is described by the relation Systems 02 00168 i021.
Prosser and Brown [26] have collected some typical values for the rabbit (8 s), the dog (16 s), and the human (23 s). These may be examined in terms of the indicated scaling relation in the form
Systems 02 00168 i022
where subscripts H and M denote the human and any mammal, respectively. For the human, of mass of 70 kg and circulation time of 23 s, the equation predicts for a rabbit of mass of 2 kg, a circulation time of 9 s, in good agreement with the above-cited measured value of 8 s. For a dog of mass of 20 kg, the equation predicts a value of 17 s, also in good agreement with the cited value of 16 s.

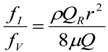
6.4. Fluid Flow across Capillary Walls

Fluid flow across capillary walls is described by a relation similar to Equation (18) for oxygen flow except that the driving force is the (essentially) scale-invariant blood pressure rather than the oxygen pressure in the blood. The equation for fluid flow Qf across capillary walls can accordingly be expressed as
Systems 02 00168 i023
The validity of this last relation can be demonstrated using measurements of glomerular flow in the kidneys of resting mammals as presented by Adolph [20] and as shown in detail by the author [12,13,14]. With the assumption that any re-absorption of the glomerular flow into the blood is governed by a like relation, the remaining fluid will then be discharged as urine flow and will likewise will be governed by an expression of the form of Equation (20). Available measurements show that this is indeed the case [12].

7. Validity of Scaling Relations for Children

A matter of importance with regard to the allometric equations and scaling laws discussed here is their validity when applied to children, particularly in connection with pediatric drug therapy. This matter has been discussed in recent work of the writer [27,28]. Two fundamental scaling relations are of primary importance: the time for circulation of an element of blood around the full circulatory path of a child and the transfer of substances out of and into the blood during the cycle. Such relations have been discussed above for mammals, in general, where circulation time was noted to vary with body mass to the 1/4-th power and transfer across capillary walls was noted to vary with body mass to the 5/6-th power. Interestingly, these same relations apply to children and adolescents with children of ages of about 2 years or more. Figure 5 illustrates this applicability for the cases of circulation time and glomerular filtration rate.
Figure 5. Data showing variation of resting circulation time and filtration rate with body mass of children and theory-based descriptions of 1/4-th and 5/6-th relations, as reported earlier by the writer [28]. Reference for circulation data is Seckel [29] and that for filtration-rate data is Schwartz and Work [30].
Systems 02 00168 g005

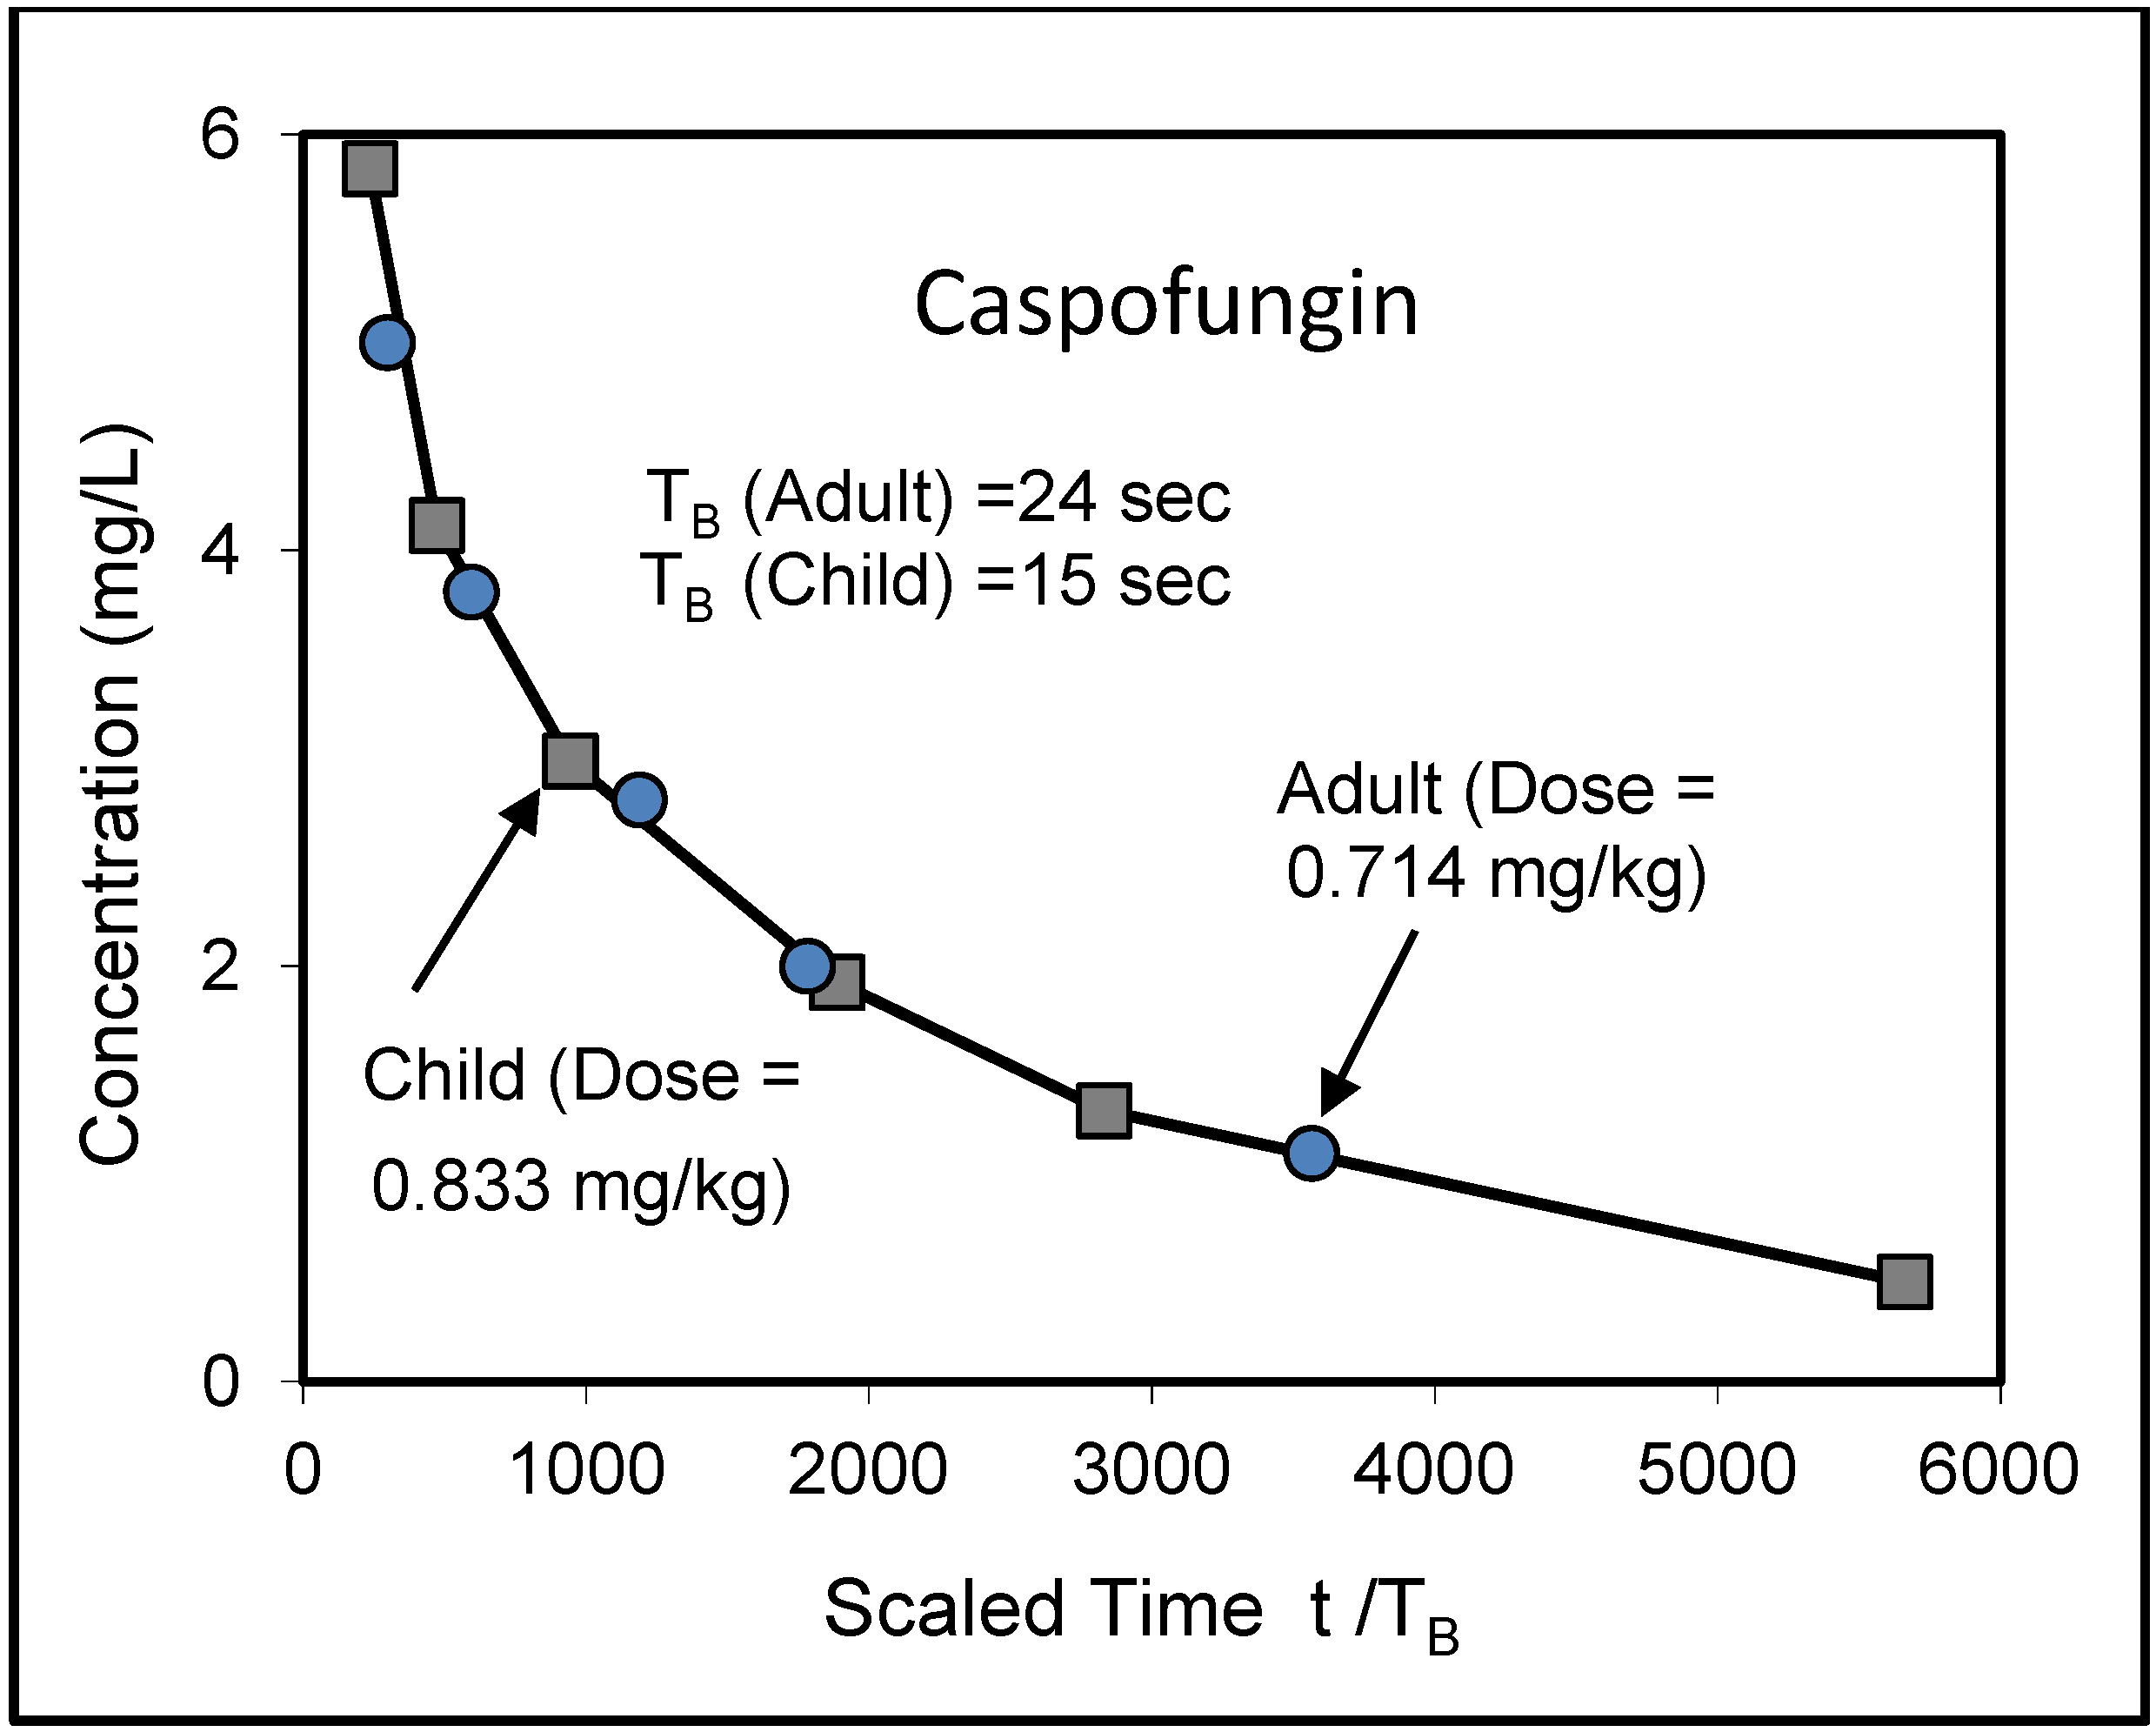
8. Application to Pediatric Drug Dosage

An important practical application of the scaling theory of the present work concerns the scaling of known therapeutic drug dose and schedule for adult humans to children. This matter is of obvious interest in biomedical engineering and has been dealt with in recent works of the writer [27,28]. The basic idea is the time-scaled matching of drug concentrations in child and adult. In particular, following earlier work of the writer, an i.v. bolus injection is considered, with subsequent back and forth capillary exchange of the drug with surroundings as the blood circulates. The free drug concentration C at time t is assumed to depend on (a) the time TB for a cycle of blood circulation, (b) a circulation number N to account for capillary exchange processes having a time scale different from that set by the blood circulation, (c) the net outward drug flow Q across the capillary walls, (d) the dose MD associated with body mass M, and (e) the blood volume VB. With relative dose MD/M denoted by D, the general relation is that the ratio of drug mass CVB in the blood to the initial drug mass DM must vary directly with the ratio of drug transport across capillary walls Qt to blood volume VB and with a general function f1 of the ratio of time t to net circulation time NTB, that is,
Systems 02 00168 i024
To limit attention to the effective part of the drug dose associated with the free concentration, the fraction U of available (unbound) drug dose can be included as a multiplier of the dose D. Using the known condition from Graham [31] that blood volume VB and body mass M are proportional for adults and children and assuming proportionality between C and Q, the expression for the free concentration can thus be written (with Qt = QNTB × t/NTB) as
Systems 02 00168 i025
where f2 = f1 × t/NTB. Scaling theory for physiologic processes, discussed above, requires further that the flow Q across capillary walls must vary with body mass M to the power 5/6 and that the time for circulation TB must vary as M to the power 1/4. Thus, the term QTB/M in Equation (22) can be seen to be proportional to M to the power 1/12.
Now, if the ratio t/NTB is fixed, the ratio on the left hand side of this relation will be proportional to the first ratio on the right. This provides the scaling law for the relative concentration C/D as a function of time. The factor U is generally the same for children as adults. The desired scaling relations for concentration at time may thus be written, for the child relative to the adult, as
Systems 02 00168 i026
where subscripts C and A denotes values for the child and adult, respectively. Similar therapeutic value is assumed for child as adult, provided concentrations satisfies the matching condition (with scaled time)
Systems 02 00168 i027
The dosing condition then follows from Equation (22) as NDM1/12 = K*, where K* denotes a constant which may be evaluated in terms of adult values to provide the scaling relation
Systems 02 00168 i028
with the explicit ratio MD/M written for D.
A simple illustration of the adequacy of the above relations may be constructed using data associated with the antifungal agent caspofungin, as reported by Walsh et al. [32] and discussed by the writer [27] within the present context. Here, the measurements indicated that the time scale of concentration is set by blood-circulation time so that the factor N has been taken to be the same for adult and child. Concentration data for adult (MA = 70 kg) and child (MC = 11 kg) are available for adult dose MD/M of 0.714 mg/kg and for child dose of 2.43 mg/kg. For the adult dose, Equation (25) requires a value for the child of 0.833 mg/kg. Measurements were for a dose of 2.43 mg/kg so that, for application here, concentration values for the child need to be reduced by the factor 0.833/2.43.
These adjustments have been made and, according to the present work, the resulting concentrations should coincide with the adult data when both are considered as a function of relative time t/TB. Results confirming this variation are shown in Figure 6, thus providing support for the validity of the scaling relations considered here.
With regard to the physical significance of Equation (25) for dose calculation, reference may be made to earlier work of the writer [33] where scaled predictions with this equation, using measured maximum tolerated doses of anti-cancer agents for dogs by Clark et al. [34], were shown to be in good agreement with measured maximum tolerated doses for humans. It may also be noted that, as a generalization of the case of single bolus dosing discussed here, the writer has considered the cases of periodic bolus dosing [27] and continuous dosing [28] of children, based on successful dose and schedule of agents for adults. A further generalization of the work has involved the case where the time scale for concentrations involves more than just the blood-circulation time [27,28].
Figure 6. Illustration of validity of Equation (25) in predicting the dose level required to match concentrations of adult and child for scaled times. Basic data source: Walsh et al. [32].
Systems 02 00168 g006

9. Effects of Strenuous Exercise

An interesting aspect of the work described in the present paper is that the cardiovascular system of mammals appears to be designed on the basis of resting conditions. This aspect has been noted earlier by the writer [14]. For a number of years, it was generally thought that scaling relations for mammals were the same for both resting and exercise states. This could be the case if physiological variables such as oxygen consumption rate and heart rate increased by the same factor for all mammals. This is now known not to be the case as a result of work by Baudinette [35], Taylor and Weibel [36], Weibel and Hoppeler [37], Bishop [38,39] and, most recently, Dlugosz et al. [8], among others.
In particular, oxygen consumption rates of mammals in strenuous exercise have been found to vary with mammal mass raised to a power of about 7/8 and heart rate has been found to vary with mammal mass to a power of about −1/8, in contrast with the corresponding resting values of 3/4 and −1/4, respectively. These results for strenuous exercise are not in question, but they do, in fact, indicate that similarity, and the accompanying general scaling laws described here for the resting state, can no longer apply for the intense exercise state.

10. Concluding Remarks

Modeling of the cardiovascular system of mammals has been discussed here, with the goal of describing relevant scaling laws for mammals of vastly different size. A main conclusion to be drawn from this work is that similarity exists for the cardiovascular system of mammals, as well as for related physiological processes, and that this similarity exists for the resting state. Associated with this similarity are scaling laws that can provide predictions of measurements from small mammals to humans for increased understanding of the cardiovascular system. The scaling laws can also provide tools to eliminate unnecessary experiments because of answers already provided by theory. Finally, as a specific application, the scaling laws can provide a means for extrapolation of therapeutic drug dose and schedule from adult to child.

Acknowledgments

I am grateful to Guest Editors Paul Agutter, Lloyd Demetrius, and Jack Tuszynski for including me in this special issue of Systems. I also thank the reviewers for their helpful comments and suggestions, and I wish to express my appreciation to Assistant Managing Editor Grace Lu for her kindness and support.

Conflicts of Interest

The author declares no conflict of interest.

References

  1. Clark, A.J. Comparative Physiology of the Heart; Cambridge University Press: Cambridge, UK, 1927. [Google Scholar]
  2. Brody, S. Bioenergetics and Growth; Reinhold Publishing: New York, NY, USA, 1945. [Google Scholar]
  3. Holt, J.P.; Rhode, E.A.; Kines, H. Ventricular volumes and body weight in mammals. Am. J. Physiol. 1968, 215, 704–715. [Google Scholar]
  4. Holt, J.P.; Rhode, E.A.; Holt, W.W.; Kines, H. Geometric similarity of aorta, venae cavae, and certain of their branches in mammals. Am. J. Physiol. 1981, 241, 100–104. [Google Scholar]
  5. Schmidt-Nielsen, K.; Pennycuik, P. Capillary density in mammals in relation to body size and oxygen consumption. Am. J. Physiol. 1961, 200, 746–750. [Google Scholar]
  6. Gehr, P.; Mwangi, D.K.; Ammann, A.; Malooig, G.M.D.; Taylor, C.R.; Weibel, E.R. Design of the mammalian respiratory system. V. Scaling morphometric pulmonary diffusing capacity to body mass: wild and domestic mammals. Respir. Physiol. 1981, 44, 61–86. [Google Scholar] [CrossRef]
  7. Hoppeler, H.; Mathieu, O.; Weibel, E.R.; Krauer, R.; Lindstedt, S.L.; Taylor, C.L. Design of the mammalian respiratory system, VIII. Capillaries in skeletal muscles. Respir. Physiol. 1981, 44, 129–150. [Google Scholar] [CrossRef]
  8. Dlugosz, E.M.; Chappel, M.A.; Meek, T.H.; Szafransks, P.A.; Zub, K.; Konarzewski, M.; Jones, J.H.; Bicudo, J.E.P.W.; Nespolo, R.F.; Careau, V.; Garland, T. Phylogenetic analysis of mammalian maximal oxygen consumption during exercise. J. Exp. Biog. 2013, 216, 4712–4721. [Google Scholar] [CrossRef]
  9. Seymour, R.S.; Blaylock, A.J. The principle of Laplace and scaling of ventricular wall stresss and blood pressure in mammals and bird. Physiol. Biochem. Zool. 2000, 73, 389–405. [Google Scholar] [CrossRef]
  10. White, C.R.; Blackburn, T.M.; Seymour, R.S. Phylogenetically informed analysis of the allometry of mammalian basal metabolic rate supports neither geometric nor quarter power scaling. Evolution 2009, 63, 2658–2667. [Google Scholar] [CrossRef]
  11. White, C.R.; Seymour, R.S. The role of gravity in the evolution on mammalian blood pressure. Evolution 2014, 68, 901–908. [Google Scholar] [CrossRef]
  12. Dawson, T.H. Engineering Design of the Cardiovascular System of Mammals; Prentice Hall: Englewood Cliffs, NJ, USA, 1991. [Google Scholar]
  13. Dawson, T.H. Similitude in the cardiovascular system of mammals. J. Exp. Biog. 2001, 204, 395–407. [Google Scholar]
  14. Dawson, T.H. Scaling laws for capillary vessels of mammals at rest and in exercise. Proc. R. Soc. Lond. B 2003, 270, 755–763. [Google Scholar] [CrossRef]
  15. Dawson, T.H. Allometric scaling in biology. Science 1998, 281. [Google Scholar] [CrossRef]
  16. Selkurt, E.E.; Bullard, R.W. The Heart as a Pump: Mechanical Correlates of Cardiac Activity. In Physiology; Selkurt, E.E., Ed.; Little Brown: Boston, MA, USA, 1971; pp. 275–295. [Google Scholar]
  17. Dawson, T.H. Modeling the Vascular System and its Capillary Networks. In Vascular Hemodynamics; Yim, P.J., Ed.; Wiley-Blackwell: Hoboken, NJ, USA, 2008; pp. 1–35. [Google Scholar]
  18. Elad, D.; Einav, S. Physical and Flow Properties of Blood, Chapter 3. Standard Handbook of Biomedical Engineering and Design; McGraw-Hill: New York, NY, USA, 2004. Available online: http://www.digital engineering library.com (accessed on 11 February 2014).
  19. Kunkel, P.A., Jr. The number and size of the glomeruli in the kidney of several mammals. Bull. Johns Hopkiins Hosp. 1930, 47, 285–291. [Google Scholar]
  20. Adolph, E.F. Quantitative relations in the physiological constitution of mammals. Science 1949, 109, 579–585. [Google Scholar]
  21. Kleiber, M. Body size and metabolism. Hilgardia 1931, 6, 315–353. [Google Scholar]
  22. Brody, S.; Procter, R.C. Relation between basal metabolism and mature body weight in different species of mammals and birds. Univ. Missouri Agr. Exp. Station Bull. 1932, 166, 89–102. [Google Scholar]
  23. Schmidt-Nielsen, K.; Larimer, J.L. Oxygen dissociation curves of mammalian blood in relation to body size. Am. J. Physiol. 1958, 195, 424–428. [Google Scholar]
  24. Woodbury, R.A.; Hamilton, W.F. Blood pressure studies in small animals. Am. J. Physiol. 1937, 119, 663–674. [Google Scholar]
  25. Gregg, D.E.; Eckstein, R.W.; Fineberg, M.H. Pressure pulses and blood pressure values in unanesthetized dogs. Am. J. Physiol. 1937, 118, 399–410. [Google Scholar]
  26. Prosser, C.L.; Brown, F.A., Jr. Comparative Animal Physiology; W. B. Saunders: Philadelphia, PA, USA, 1961. [Google Scholar]
  27. Dawson, T.H. Scaling adult doses of antifungal and antibacterial agents to children. Antimicrob. Agents Chemother. 2012, 56, 2948–2958. [Google Scholar] [CrossRef]
  28. Dawson, T.H. Scaling adult dose and schedule of anticancer agents to children. J. Cancer Res. Clin. Oncol. 2013, 139, 2035–2045. [Google Scholar] [CrossRef]
  29. Seckel, H. Blood volume and circulation time in children. Arch. Dis. Child 1936, 11, 21–30. [Google Scholar] [CrossRef]
  30. Schwartz, J.G.; Work, D.F. Measurement and estimation of GFR in children and adolescents. Clin. J. Am. Soc. Nephrol. 2009, 4, 1832–1843. [Google Scholar]
  31. Graham, G.R. Blood volume in children. Ann. R. Coll. Surg. Engl. 1963, 33, 149–158. [Google Scholar]
  32. Walsh, T.J.; Adamson, P.C.; Seibel, N.L.; Flynn, P.M.; Neely, M.N.; Schwartz, C.; Shad, A.; Kaplan, S.L.; Roden, M.M.; Stone, J.A.; et al. Pharmacokinetics, safety, and tolerability of caspofungin in children and adolescents. Antimicrob. Agents Chemother. 2005, 49, 4536–4545. [Google Scholar] [CrossRef]
  33. Dawson, T.H. Scaling laws for plasma concentrations and tolerable doses of anticancer drugs. Canc. Res. 2010, 70, 4801–4808. [Google Scholar] [CrossRef]
  34. Clark, D.L.; Andrews, P.A.; Smith, D.D.; DeGeorge, J.J.; Justice, R.L.; Beitz, G.J. Predictive values of preclinical toxicology studies for platinum anticancer agents. Clin. Cancer Res. 1999, 3, 11161–11167. [Google Scholar]
  35. Baudinette, R.V. Scaling of heart rate during locomotion in mammals. J. Comp. Physiol. 1978, 127, 337–342. [Google Scholar] [CrossRef]
  36. Taylor, C.R.; Wiebel, E.R. Design of the mammalian respiratory system. Respir. Physiol. 1981, 44, 1–10. [Google Scholar] [CrossRef]
  37. Wiebel, E.R.; Hoppeler, H. Modeling design and functional integration in the oxygen and fuel pathways to working muscle. Cardiovasc. Eng. 2004, 4, 5–18. [Google Scholar] [CrossRef]
  38. Bishop, C.M. Heart mass and the maximum cardiac output of birds and mammals: Implications for estimating the maximum aerobic power input of flying mammals. Phil. Trans. R. Soc. Lond. B 1997, 352, 447–456. [Google Scholar] [CrossRef]
  39. Bishop, C.M. The maximum oxygen consumption and aerobic scope of birds and mammals: Getting to the heart of the matter. Proc. R. Soc. Lond. B 1999, 266, 2275–2281. [Google Scholar] [CrossRef]

