1. Introduction
Decision support systems (DSSs) are software tools that are widely used in industry and are created to assist individuals in making decisions. DSSs give decision makers the ability to analyze data rapidly, as well as accelerate their decision making [
1,
2,
3,
4].
Some recent studies have investigated the enabling technology from DSSs for improving data analysis in multi-objective spaces. Studies explore topics such as the emotional process of decision making [
5], performing dynamic analysis on temporal (time-dependent) data [
6], ‘situational awareness’ to better understand the performance of different applications [
7] and optimization models for business planning [
8]. In the realm of product development, a field more closely related to the research performed in this study, researchers experimented with how decision makers implement new products effectively [
9] and also discussed creating automated product designs through product design generators (PDGs) [
10,
11].
Similarly, research is ongoing into how DSSs increase effectiveness and help with decision making by focusing the DSS on useful information [
12]. These efforts have resulted in the development of improved systems geared toward many different industries or needs, such as ambulance dispatch or flood warnings in California [
13,
14]. DSSs facilitate data fusion to support better decision making when time for additional data analysis is unavailable.
DSSs have been developed and are used for analysis purposes; however, even with the use of DSSs, data analysis can have many problems [
15]. Some challenges regarding the data include inaccurate data [
16], delayed data [
17,
18], excessive data [
19] and unorganized data [
20]. In addition, a continuing problem in industry is making effective decisions that take system-wide effects into consideration [
21]. Therefore, the combination of inadequate data analysis coupled with a limited view of system-wide effects can result in poor decisions and designs. Without proper understanding of these challenges, many DSSs are underutilized and potentially ill-constructed [
22]. Furthermore, as systems get larger and communications become faster, individuals struggle to understand how to interpret the exponentially-increasing amount of information [
23]. Large amounts of poorly-presented data can cause decision makers to make worse decisions than if they were presented with less, but focused data because of the inherent limitations on their ability to interpret all of the data simultaneously [
24]. In other words, the decision makers’ perspective of the system is limited as the system grows, which further hinders their ability to make good system-level decisions.
Having poor or limited systems analysis can cause problems in engineering and business [
25]. An example from the automobile industry illustrates the lack of system communication, analysis and integration. An automobile company in Detroit analyzed an imported car from Japan to better understand why the Japanese parts had better precision and reliability at lower cost than the American cars. In their analysis, they found that the Japanese company had used the same bolt three times to mount the engine, whereas the American company had used three different bolts for the same comparable assembly. The Japanese company did not need the additional tools and bolt inventories, which were used by the company in Detroit; as a result, assembly was faster and less expensive for the Japanese company. In America, there were three teams of engineers, each responsible for their bolt and mounting process. Although, in their limited perspective, they each achieved the requirement of mounting the engine even though each team used a different type of bolt. In contrast, there was one designer in charge of engine mounting for the company in Japan [
21]. The three teams in Detroit failed to have a view of the impact of their configuration on the system, while the designer in Japan did and therefore was able to make a better system-level decision [
26]. With an increase in the data shared and analyzed, the effectiveness of system-level decisions increases [
27].
Similarly, the lack of a system view can hinder the decision maker from choosing an optimal solution for the system [
28,
29]. A common mistake can result from focusing on and optimizing a specific sub-system or a portion of the design space at the expense of a global optimum across the entire system. Paradoxically, if every individual sub-system is optimized for efficiency, there is still no guarantee that the total system would be optimized, and in many cases, it would be impossible to “optimize” all sub-systems due to differing design objectives [
30].
Though the use of DSSs is usually well received, the implementation and use of a system-wide DSS has not been thoroughly explored. Many would agree that using a DSS is more time effective than unprocessed data; however, the implementation and use of such tools is limited and in many cases not developed to account for the entirety of the system it affects.
With effective DSSs, employees at all levels can potentially make improved decisions because they have a better view of the entire system based on quantitative analysis. Furthermore, using the data can help the decision maker with system-level decisions [
31]. DSSs have become more common in the past few years, especially with the advancement in computer technology [
32]. One way to increase productivity is by having information dynamically updated because it allows the user to analyze the data more quickly [
33].
PDGs have also been developed for instantaneous product design updates [
34]. With these PDGs, creating a product that is aesthetically pleasing, structurally sound and that meets the design requirements can be evaluated with respect to its predicted success in the market [
35]. Despite these advancements, the effectiveness of integrating a product design generator with a DSS for system-level decision making has not been fully explored across all possible interactions, though some articles have pushed into the realm of product design inside the DSS [
36,
37].
A DSS, developed for the purpose of testing if a system view can help the decision maker beyond the non-system DSS, has the potential to overcome the non-system limitations. This system DSS consists of an integrated product design generator (PDG) and a business DSS. The integration of the two shows interactions in the system that may not have been considered previously without the connection. Using this DSS, experiments were performed to show whether or not it was effective in increasing decision-making capability. It is hypothesized that the system DSS is a better method than unprocessed data and singular DSS, because it shows more trends and relationships on interactions between the design variables and assumptions in the system.
This research will focus specifically on creating an integrated system analysis wherein a new product is under consideration to be added to a company’s current product lineup. Two high-level questions guided this research: (1) How much does a system DSS improve decision making over unprocessed data? (2) What level of system integration is sufficient for communicating and demonstrating the interactions between disciplines? To achieve this objective, a system DSS was developed, linking business data with engineering models, and tested to evaluate its effectiveness in helping with decision making. Experiments and survey questions from test decision makers were implemented to evaluate the DSS’s measures of performance. To enable this testing, JMP
® [
38], a dynamic graphical software , was integrated with Solidworks
® [
39] for product engineering and MATLAB
® [
40] for business optimization.
This paper is organized as follows:
Section 2 describes this research’s methodology and development of the system DSS discussing the PDG, business DSS and the optimization process.
Section 3 summarizes the testing procedure and assessment process.
Section 4 discusses and analyzes the results from the data acquired from the user experiments, and
Section 5 contains conclusions, recommendations and future work.
2. Methodology
The methodology described in this section satisfies a few conditions. It was preferred, though not necessary, that the system DSS help make a decision in a real-world problem. This was achieved by interfacing with a company trying to decide if adding a bariatric shower chair to their product lineup was a good idea. This real-world problem met the criteria of what was needed to justify the exploration and development of an integrated system DSS, meaning that it had at least two systems, business and product design, that could be explored. The DSS would be able to support design investigations, present data trades and interactions and optimize current business practices to increase profitability. Similarly, the effects between the engineering design parameters and the financial decisions could be evaluated and compared. The multi-objective system DSS is composed of a product design generator and a business DSS allowing optimization of the business inputs, both of which are defined in the following sections.
2.1. Product Design Generator
The product design generator (PDG) is used to assist in the product design process with the capability of generating thousands of potential designs in near real time [
34,
41]. The PDG accepts user-defined inputs and updates the product and all of its specifications dynamically. As mentioned above, a parametrically-designed bariatric shower chair was selected to support the current decision faced by the sponsoring company’s decision makers.
2.2. PDG Model Development and Formulation
The PDG uses many different calculations and assumptions to generate designs and specifications. One key calculation is an estimate of a maximum load
in normal conditions on the bariatric shower chair. This is calculated by using Equations (
1) and (
2):
where the sit velocity
V is calculated assuming that the person drops onto the chair from 1.22 m (4 ft),
is the initial velocity (which is 0 m/s),
a is the user’s deceleration as they sit,
is the slowing distance (assumed to be 0.052 m (0.17 ft)) and
m is the mass of the chair’s user. This load is then split across the four legs, with the worst case scenario occurring when the user of the chair sits with most of his or her weight on one leg. The specific assumption that is made is that the user could apply up to 77% of the entire load onto one leg when they sit down, with a maximum of 90% of their weight onto the back portion and 85% onto one of the sides. The factors of safety for buckling were calculated using the buckling equation shown in Equation (
3),
where
F is the maximum critical force,
E is the modulus of elasticity,
I is the area moment of inertia,
l is the length of the leg and
K is the effective leg length factor (which is 5.08 cm (2 in) this case for the fixed-free loading condition). The maximum critical force was then divided by the worst case force
to calculate the factor of safety
shown in Equation (
4). All factors of safety under two were considered unacceptable to the design and would add penalties to the final profitability if selected.
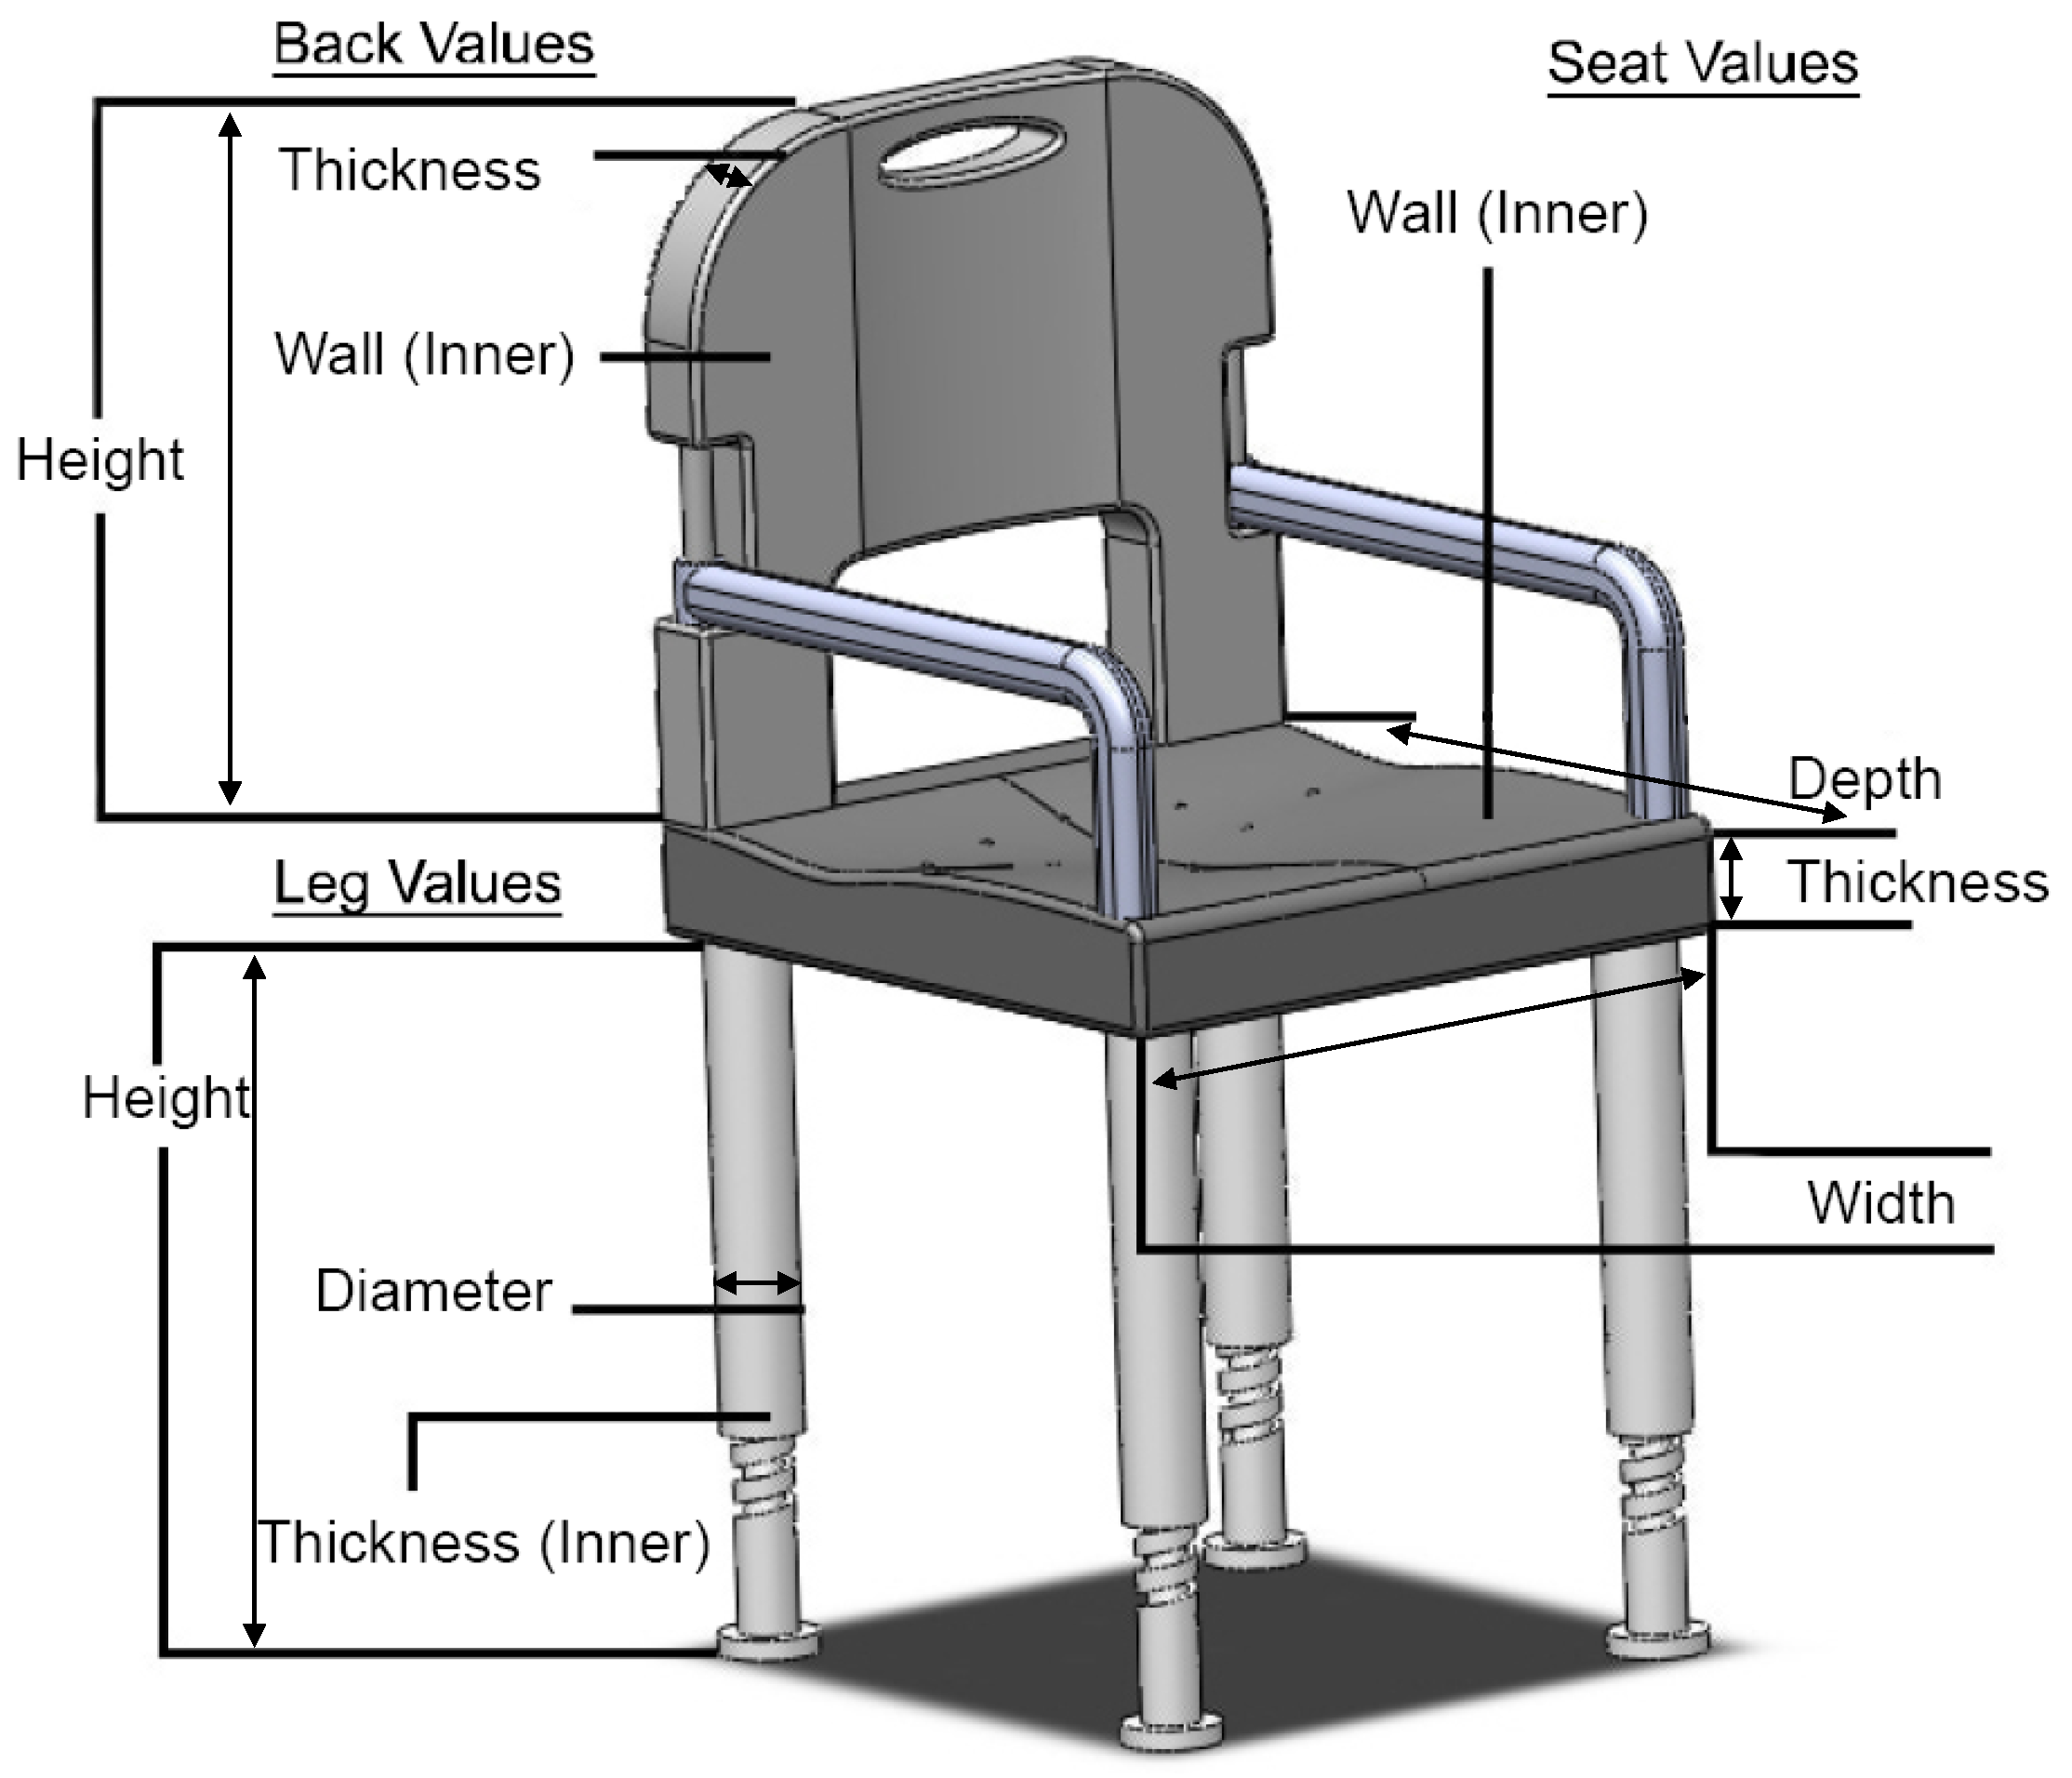
The factors of safety for stress in the width and depth of the seat base, strength of the back post and bending in the back were also calculated. A diagram showing the different sections of the chair is shown in
Figure 1. The stress in the seat base was calculated in the x and z directions, where y is the vertical plane. Boundary conditions were established with fixed points at the leg positions with the weight set at the center of the seat base. Bending in the back of the seat was calculated assuming fixed points at the left and right edges of the seat posts and a force applied in the middle of the seat back. Lastly, a bending calculation was made on the seat support posts, where the weight was focused onto the top middle of the seat back and the seat posts were fixed.
The maximum stress
on the material was calculated using the stress equation shown in Equation (
5),
where
M is the bending moment,
c is the distance to the neutral axis from the edge of the material and
I is the second moment of inertia. The factor of safeties
for the bending conditions was calculated using Equation (
6) where the yield stress
was that of PVC (5000 PSI [
42]) divided by the maximum stress
calculated from Equation (
5).
The parametric chair model was updated through a connection to Solidworks
® [
39]. This was accomplished by sending the 10 chair parameters to Solidworks
® [
39], updating the chair model with them and exporting an orthographic image of the chair. One run through the Solidworks
® [
39] CAD update required 20 s to execute; however, this was considered too long to support the near real-time analysis capability that was desired in the PDG. To enable this capability, the Solidworks
® [
39] CAD model was executed 1500 times using a Latin hypercube to uniformly explore the design spacing. Images and values were saved for each condition, and a nearest-neighbor algorithm was then implemented in the system DSS to enable the comparison of the current chair parameters to the closest parameters of a saved value. Once the nearest condition was found, it was loaded into the DSS. This was accomplished at a near real-time rate.
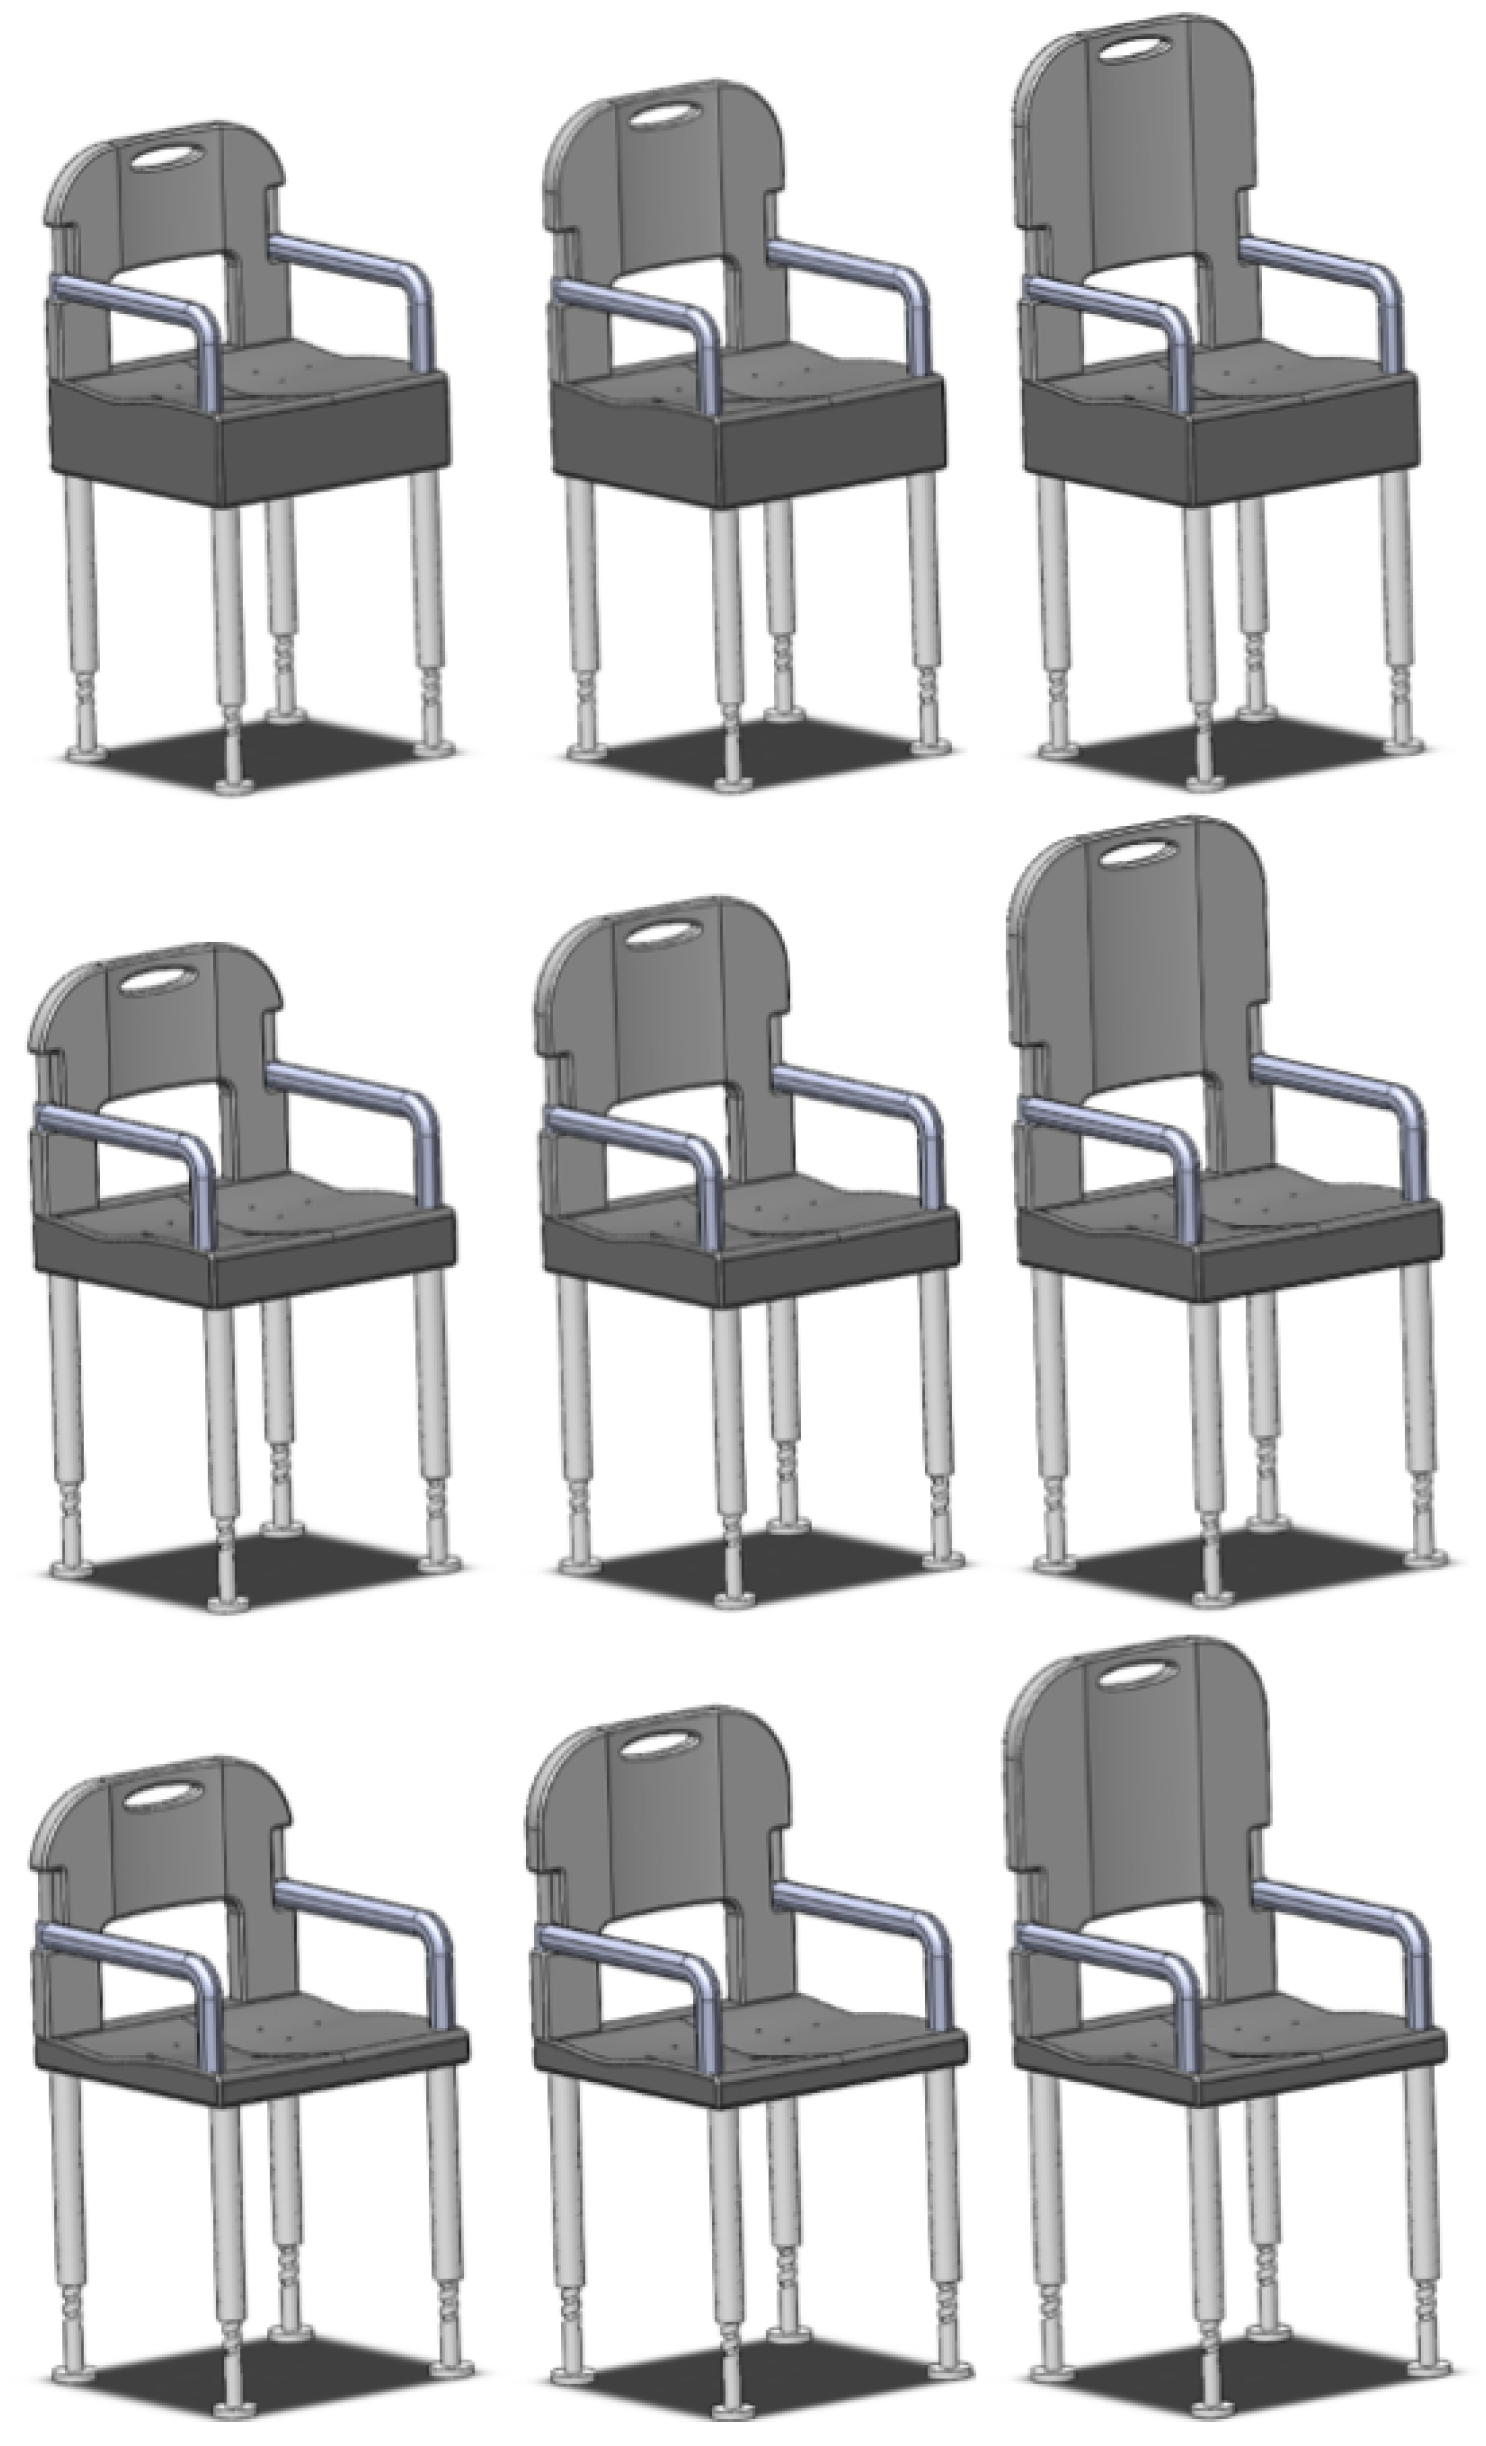
A picture collage is shown in
Figure 2 to show how the parametric parameterization of the CAD model works. In this example, we start with a random chair in the bottom-left corner. Going across the x-axis, the height of the chair back is being increased; going up the y-axis, the seat thickness is increased. Going horizontally up to the top-right corner, they both increase.
Without running the Solidworks
® [
39] model every time, the volume initially could not be calculated. Although the nearest-neighbor algorithm could have functioned for this purpose, a neural network was used because it provided greater accuracy. Using the same 1500 runs, a neural network was trained to approximate an equation that could predict the volume of the chair for any input configuration. With this equation placed inside the DSS, the full PDG could run in near real time.
The unit cost was also calculated inside the PDG by the amount of material used in the chair and an estimated added manufacturing cost. The investment cost was estimated from similar products that the company had designed.
2.3. Business Decision Support System
An analysis on the small business [
43] with which we partnered was performed using income and expenditure data from 2006 to 2014 to identify critical parameters and relationships that influence the overall profitability of the company. Optimizing these critical parameters, a business can make more profitable choices specifically in areas of product development and investment [
44].
2.3.1. Parameter Relationships
The methodology for setting up the small business model involved mapping out the inputs and outputs of the business to determine how these facets relate inside this business. The model also involved determining the constraints of the business, which could reflect the long-term financial or growth goals of the company, as well as any resource limitations.
The inputs of the business have been defined to include those aspects of the company that are determined or controlled directly by those operating the company. In this case, the inputs included:
Number of employees
Employee salaries
Floor size of working location
Investment in advertising
Product lines being sold in various product families
Product sales markup
Inventory retained
Advertising proportion among product families
Each of these inputs is dependent of each other to some extent. The top-level variables, which are changeable by the user inside the DSS, were chosen by observing which dependencies existed among all of the variables. The highest-level inputs were chosen to try to minimize making choices of lesser importance. The top-level inputs that were chosen include the total amount spent on advertising, the markup per product family, the advertising percentage for each product family and the number of product lines per product family. The products were separated into four different families for analysis. This was done rather than individual product lines because the products within each family performed similarly in terms of sales revenue and other parameters. Furthermore, this greatly simplified the analysis for the user of the tool. This created a total of thirteen input variables within the business DSS.
The outputs of the business have been defined as the parameters that result from the business operation inputs. The main outputs include the quantity of each product sold and the overall profit of the company. All equations and values used in this model were in terms of a yearly summation (e.g., the annual quantity sold, annual salary or annual advertising cost).
Profit is sensitive to all of the chosen design variables; it was found that advertising, product lines and markup are all connected to the number of sales. As advertising increases, sales also increase. With too much spent on advertising, however, the return on investment from that advertising drops, which is best described by the law of diminishing returns [
45]. Similarly, marking up the product affected the quantity of sales. With an excessive markup, no one buys the product; with too little of a markup, the business is not profitable.
JMP
® [
38] statistical software was used to analytically determine the relationships between the many mentioned parameters provided by the small company. The equations relating the various parameters were determined using fit models of actual past data discretized by year. The equations determined using JMP
® [
38] used in the optimizer include:
The markup multiplier equation per product family was obtained using the quantity sold from a product family versus markup
at that same quantity. The regression equation for these data followed an inverse relationship, meaning that as the markup increased, the quantity sold decreased. Four equations were found for these regressions. One equation was made for each of the four product families; an example is shown in Equation (
7). All future examples are values used for the bariatric shower chair scaled from one of the other lines.
The quantity of products sold per product family was developed using a two-dimensional linear surrogate model. This model is a function of advertising expense per product family
and number of product lines per family
. The markup ratio was used as a normalized scaling factor. Equation (
8) shows an equation generated by the regression.
Further equations that were generated for analysis include:
Revenue from one line was calculated by multiplying the projected quantity of sales by the production cost
and the markup ratio as shown in Equation (
9). The production cost for the chair in this instance is passed in by the PDG. In lines other than the chair, it is already determined by the current cost for the company to make that product.
The total revenue for the company was calculated by adding all of the revenue from the individual lines as shown in Equation (
10).
Product investment cost for the year was given by the number of new product lines multiplied by the cost of adding a product line
and divided by the number of years
Y the company plans to pay off the investment, as shown in Equation (
11).
The total investment for the company was calculated by adding all of the investment costs from the individual lines as shown in Equation (
12).
The total number of sales was calculated by adding together the five product line sales as shown in Equation (
13).
The number of employees was determined to be a function of how much work needed to be done and was defined as the total quantity of products sold in the company divided by a fixed number of quantity able to be handled per employee. The company stated that the parameter that increased their need for employees was more sales; based on their current setup, 8000 sales were assumed. The employee calculation is shown in Equation (
14).
The inventory was calculated as 5% of the total annual quantity sold comparable to their current sales-to-inventory ratio. This is shown in Equation (
15).
The required space was calculated such as to allow a given square footage per employee and a given square footage per inventory item, as shown in Equation (
16).
The office cost was simply an annual rental square footage cost per month multiplied by the calculated office size in terms of square footage multiplied by 12 months, as shown in Equation (
17).
The total salary cost was calculated as the quantity of employees multiplied by the average salary
S. The salary of each employee was assumed to be $75,000. This is shown in Equation (
18).
2.4. Problem Constraints
Sixteen different constraints were potentially active in the business optimizer. The constraints related to business operation included a maximum yearly operating office cost of less that $35,000, a maximum yearly total salary cost of $350,000, a minimum number of three employees and a maximum annual product investment cost of $100,000. The advertising cost was also constrained to be 11% of the total gross revenue, which has been shown in previous studies to be an optimal percentage [
46]. These constrained equations were defined to encourage sustainable growth of the company since growing too quickly can be detrimental to a business [
47].
Additional constraints used for successful optimizer operation included the quantities sold, salary costs and non-negative revenues. Furthermore, the markup multiplier used in calculating the markup ratio must be greater than zero, and the total percentage of advertising costs for the different product families needed to add to 100%.
Constraints were also applied to ensure the optimizer performed within reasonable limits. These bounds provided limits on advertising, the number of product lines that could be added per year, the markup ratio and the percentage of advertising cost that could split per product family. The lower bound for product lines per family is the current amount of products for a given category (there is assumed to be no cost to retain an existing product line). The upper bound for product lines per family is two more than the lower bound (except for the bariatric chair, which only has the current design that can be added) because two is considered the maximum number of product lines that can be added in a year for a product family due to resources and time required for development. The upper bound for advertising allocation to a single line is 80%, because all of the advertising should not be spent on one line.
2.4.1. Optimization
Optimization is a growing field with increasing areas of application. One of these areas has been to optimize and improve business performance [
48,
49,
50]. Due to the complex nature of a business, the actual application of various optimization methods is difficult and generally involves data mining and the hiring of analysts to break the business down into manageable and related components [
51,
52]. The costs of such tools can be prohibitively expensive for small, start-up companies [
53]. In order for these companies to remain competitive and have an opportunity to survive in such a market, simplified optimization methods with readily available information and tools need to be developed. Silva provided one such example of how optimization can be used to find effective business parameters [
54].
While it is possible to attempt a multi-objective optimization through maximizing revenue and minimizing expenditures, a single-objective optimization to maximize the company’s profit was sufficient. This approach retained both the aforementioned desired objectives of minimizing expenses and maximizing sales revenue combined into one objective in the optimization. By reducing the number of objectives to a single-objective problem, a relatively simple constrained optimization was able to be utilized to maximize desired profit. The total profit
P was calculated using outputs from many of the previous equations as shown in Equation (
19), where
is total money spent on advertising and
is the total material cost.
An optimizer was used to vary the inputs while adhering to constraints to find optimum input values to maximize the profit of the business. The gradient-based sequential quadratic programming (SQP) algorithm was used within this optimizer and provided an optimum within 19 major iterations and 343 function calls. For this application, the fmincon optimizer in MATLAB
® [
40] was used, which is an SQP-type algorithm. The optimizer converged to a single solution consistently, which suggests a properly-formulated problem that avoids ill-conditioned functions. Design constraints and constraint scaling were used to provide improved optimizer performance.
The outputs of the optimizer included optimum values for total advertising expenditure and product lines added, markup percentage and distribution of advertising funds in each of the four product families. Other outputs calculated by the optimizer, which were not design variables, provided very useful information to the company, including the yearly projected profit, number of employees, inventory, office costs and total salary expense.
The established scenario included five product lines. Four of the lines were modeled directly from past sales; however, the fifth, the bariatric chair, was modeled by scaling down a similar product line with comparable information. The chosen line upon which to model the chair was the toilet seat line. This line was scaled down to about one-twentieth under the assumption that the demand for the bariatric chair is smaller due to it being more specialized than the products in the toilet seat line. Furthermore, as a new product, it could take some time to build up momentum in sales.
Regarding the fifth product line in the optimizer, the optimizer took in values from the PDG that were calculated for investment cost, material costs and sales penalties for bad designs. With the connection between the PDG and the optimizer established, the decision maker could change the chair parameters to explore the design space and find which chair was optimal for the company needs.
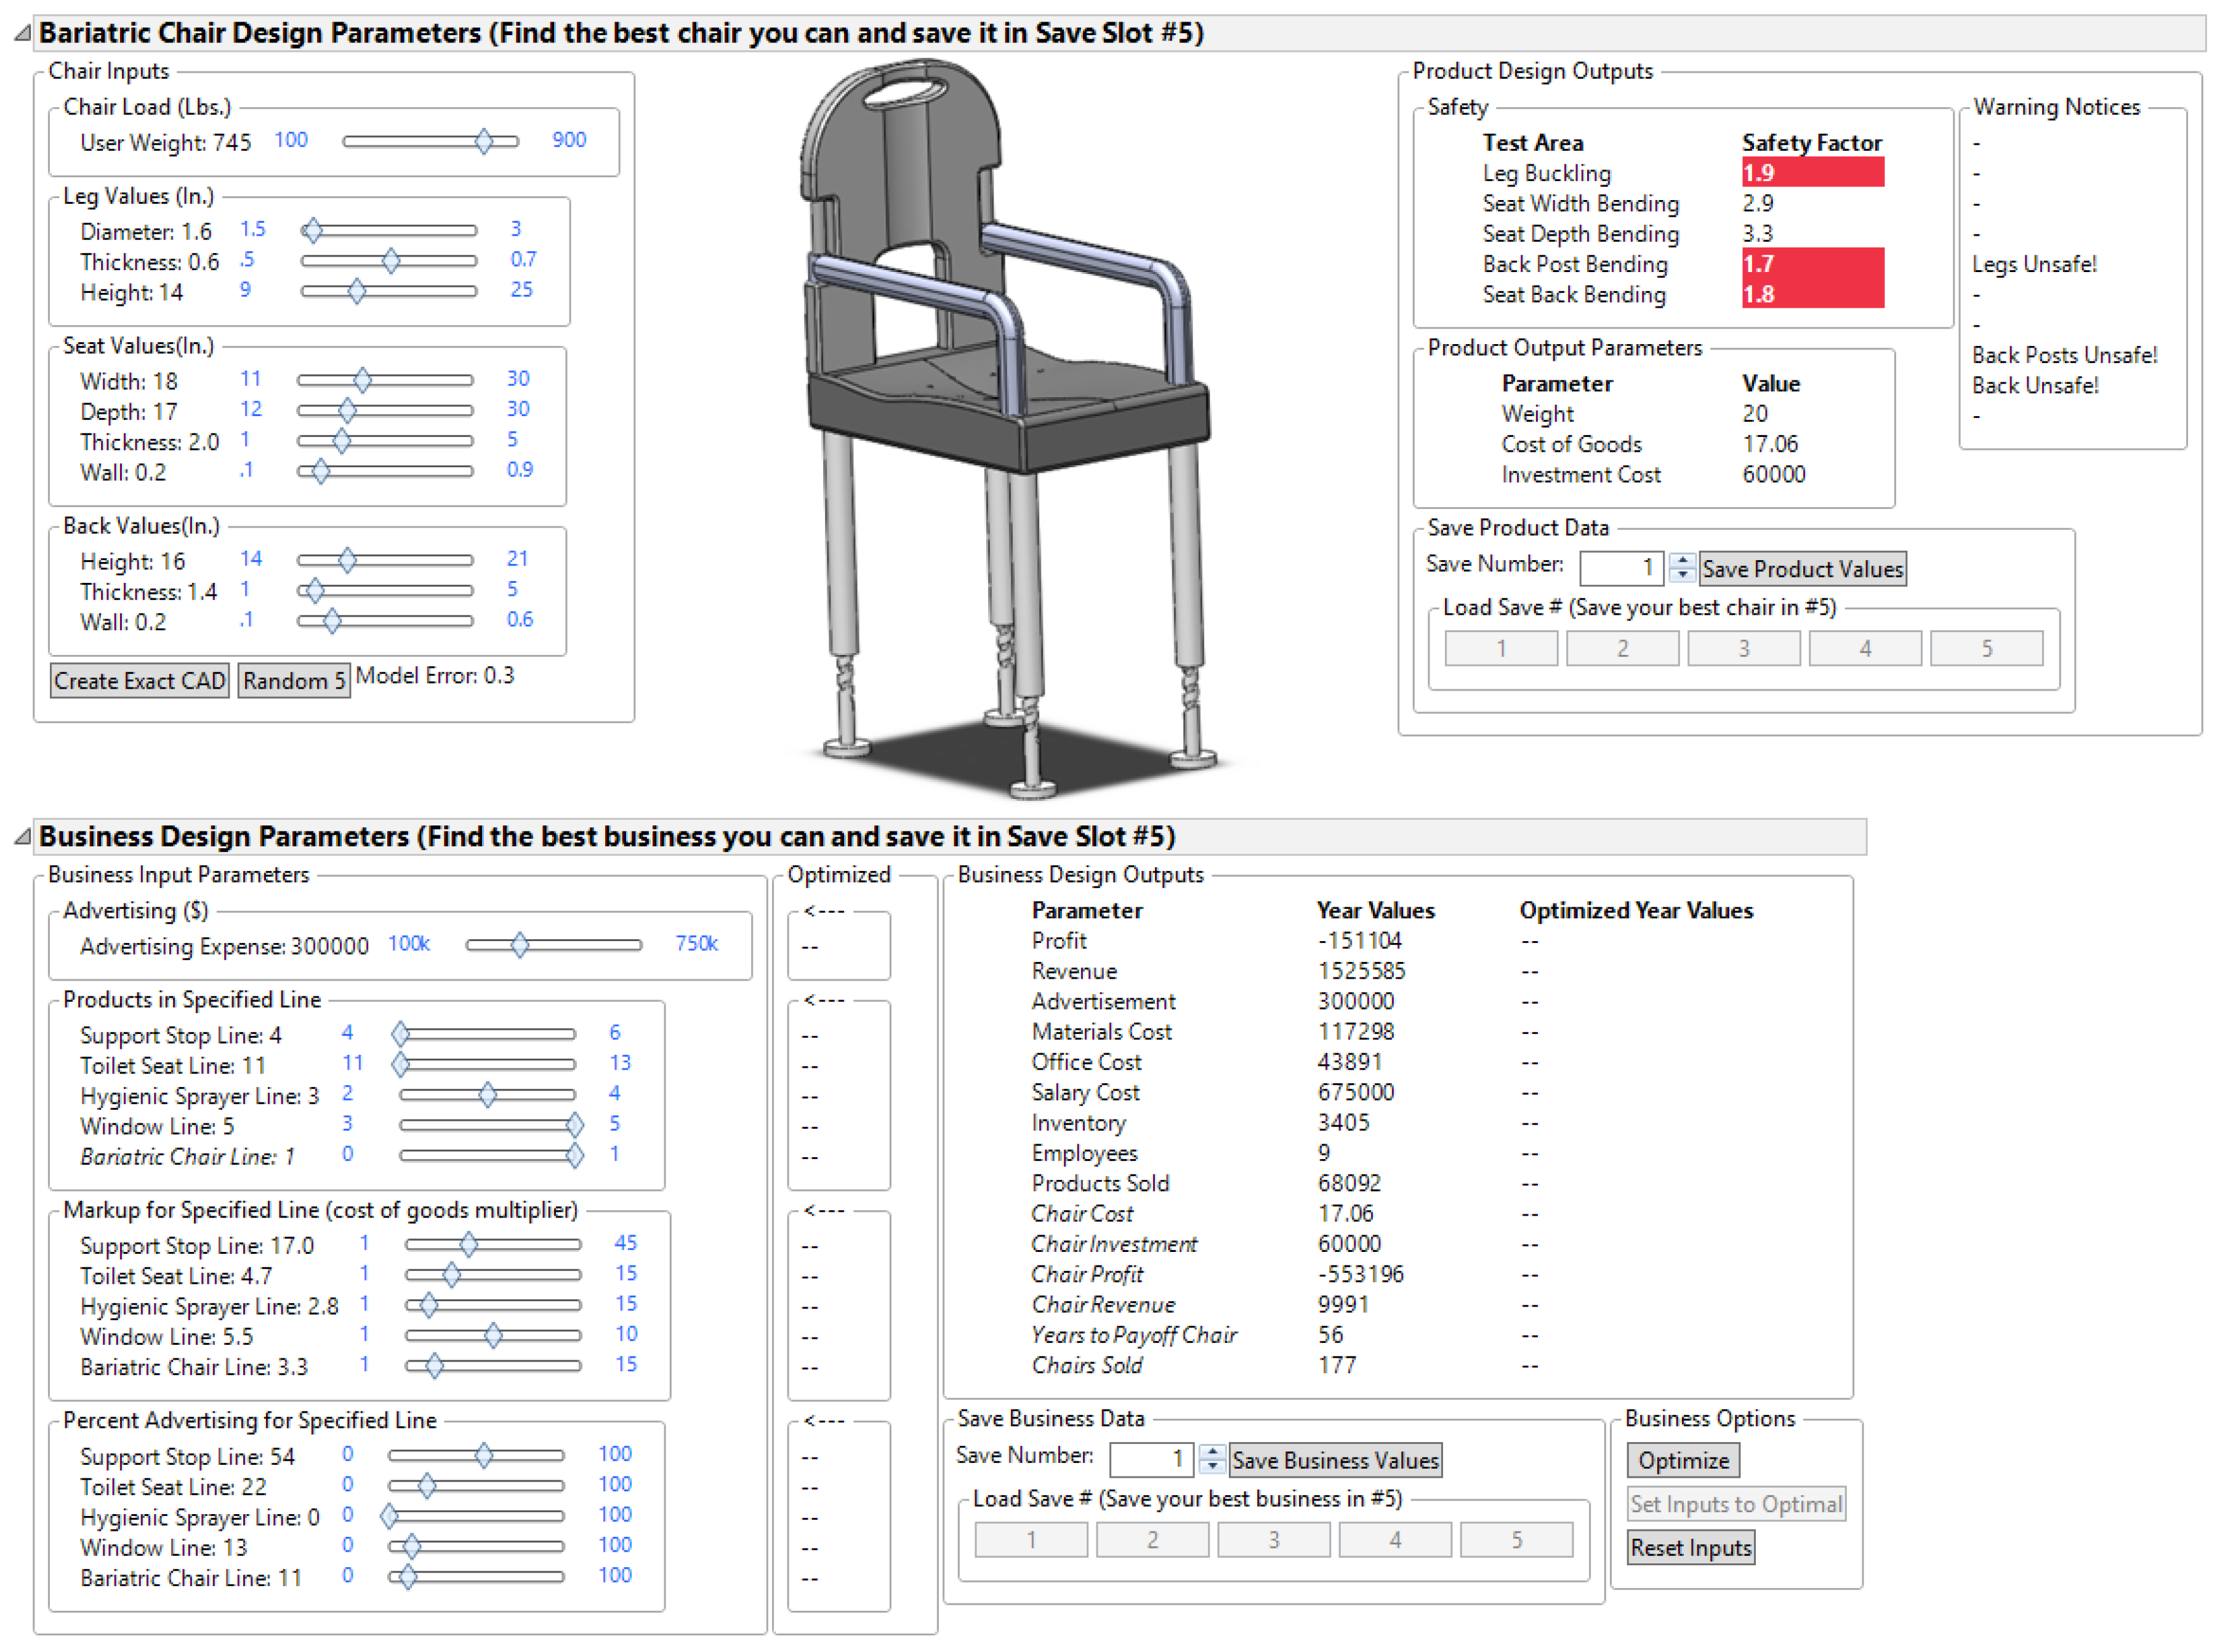
2.5. System DSS
The integration of the business DSS and the product design generator is called the system DSS. The system DSS is developed in JMP
® [
38] and is dynamically updating, meaning that whenever any input value changes, it updates any related outputs in near real time. For example, if the chair variables are changed, the adjustments are reflected in both systems. The system DSS is shown in
Figure 3 with the PDG on the top and the business DSS on the bottom.
The data flow from the inputs on the left to the outputs on the right in the PDG and business DSS with the option to save the design at the bottom right of each section. An alternate program such as Excel
® [
55] may have been used to do similar calculations. However, the dynamic nature of the PDG would not have been as effective as it is in the JMP
® [
38] software package, such as in the case of the updating chair image, some data visualizations and in other capabilities.
4. Results and Analysis
4.1. User Testing Sample and Time
A majority of the testers were college students in the 18- to 27-year-old age range. Many were mechanical engineering students familiar with software tools used in engineering design and analysis. Although the difference in age, skill level and work experience may have had some effect on the results, the differences in experience should not have significantly changed the outcomes of the study.
There was a total of 44 testers who volunteered a combined total of 15 h to evaluate the data and system DSS. The average decision maker took about 21 min to complete the experiment, the longest 55 min and the shortest 9 min.
4.2. Unprocessed Data vs. System DSS
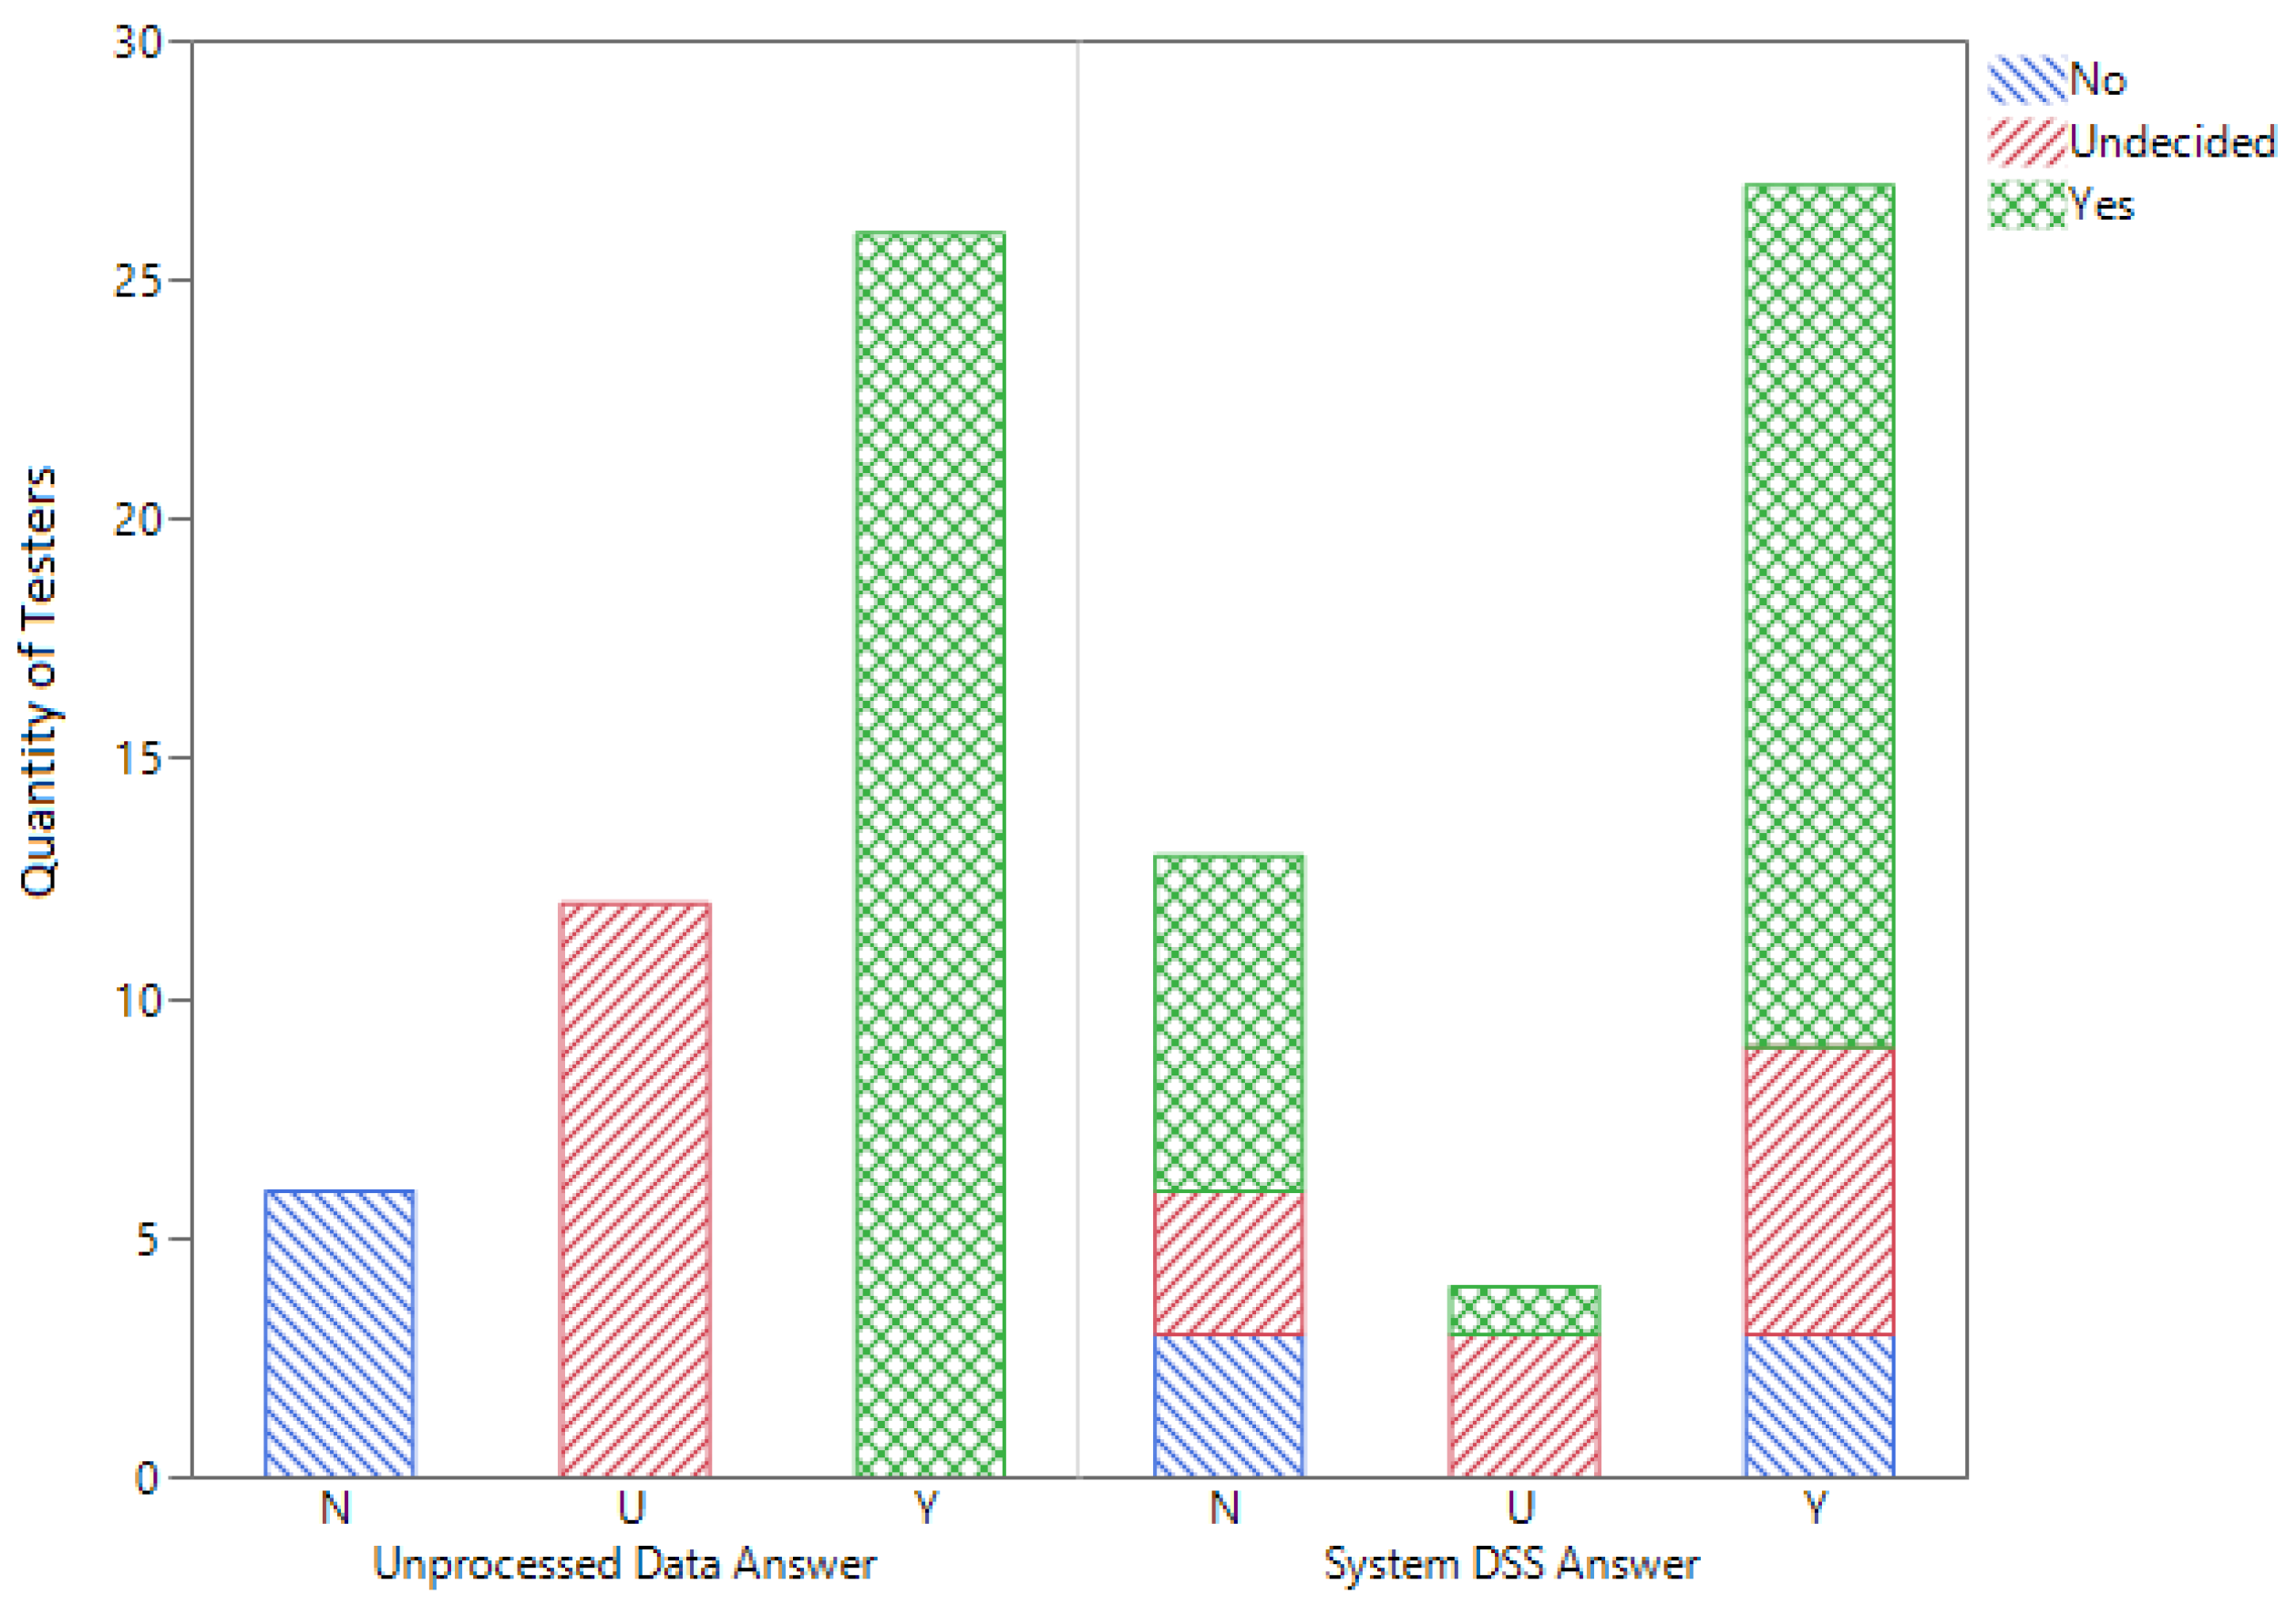
As the testers used the unprocessed data, they generally made a decision based solely on the information they were provided and engaged in no further analysis of their own. The data contained nothing but a summation table and the raw data. A few decision makers summed up items that were not explicitly stated like total expenditures. In general, decision makers looked at the tabled company data and how it was performing and decided if adding the chair was a good investment. The data indicated that the company was doing well over the past eight years with consistent growth in revenue and profit. Many of the testers stated it would be a good idea to add a new product based on the fact that the company had previously been doing well. When asked if the chair should be added, one user states “Yeah. The profit seems high enough that you might as well go for more!” This attitude was representative of other users. A good percentage of other testers stated that there was not enough information to gauge the demand for this sort of item. When asked the same question, a different user states “No, because there is not enough evidence that there is demand for this product.”, which is also a common answer among those that disagreed that the chair was a good investment. Using the unprocessed data, 73% of the users came to a conclusion; 59% of users would add the chair and 14% would not. After using the DSS, 45% of the users changed their answer. In the end, 61% of users would add the chair, 30% would not and 9% did not know. The distribution of the choices users made is shown in
Figure 5. After using the system DSS, 91% of decision makers came to a conclusion, meaning that 75% of the users who were beforehand unsure were now able to make a decision. This means 45% of users changed answers, which shows that many were not sure of their answer after using just the unprocessed data. With the system DSS, they were able to evaluate information that caused them to change their answer.
4.3. Test Result Analysis
An analysis was performed to compare the users’ best solutions against the optimized solution, as well as a solution of random selections. Of the 44 testers, 30 had an answer that was comparable to the optimizer, and all users had answers that were profitable. An average of completely randomized answers bears highly negative profits, so all users were considered to have chosen better than random using the tool. This demonstrates that the users did discover solutions that were better than random and in many cases at the same level as the optimizer.
4.4. Survey Analysis
At the conclusion of testing, decision makers were asked 12 questions; three were free response questions, and the other nine were questions that were rated using the following scale: strongly agree (5), agree (4), neutral (3), disagree (2), strongly disagree (1). The survey questions and the average rating for each question are shown in
Table 1.
It was found that a decision maker could better see the interactions between the business and the product design from the survey. It was also noted that they were able to better understand the trade-offs between the two. One tester stated, “I thought the interaction between business and engineering data was very helpful in seeing the connection between the two.” Comments like these were found for both system tests even though there was less of an interactive view in the constrained system.
Based on the high average rating for some of the questions, it was observed that decision makers found the tool to be more effective than using unprocessed data. Decision makers also found that they had a better view of the system with the DSS than with the unprocessed data. The questionnaire showed that the hypotheses were correct, meaning it was more effective in time and ability to help a decision maker find an answer.
Since each of the decision makers was presented with one of the two treatments for the system DSS (constrained or unconstrained), the differences in answers to the questions across the two groups could be compared. As shown in
Table 1, only the first question, regarding trade-offs, showed a statistical difference between the perceived interactivity of the constrained and unconstrained system DSSs. However, it was also noted that Question 5 did not show significance, and because of the close nature and wording of Questions 1 and 5, the low chi-squared value for Question 1 was discounted.
4.5. Analysis of Test Variants
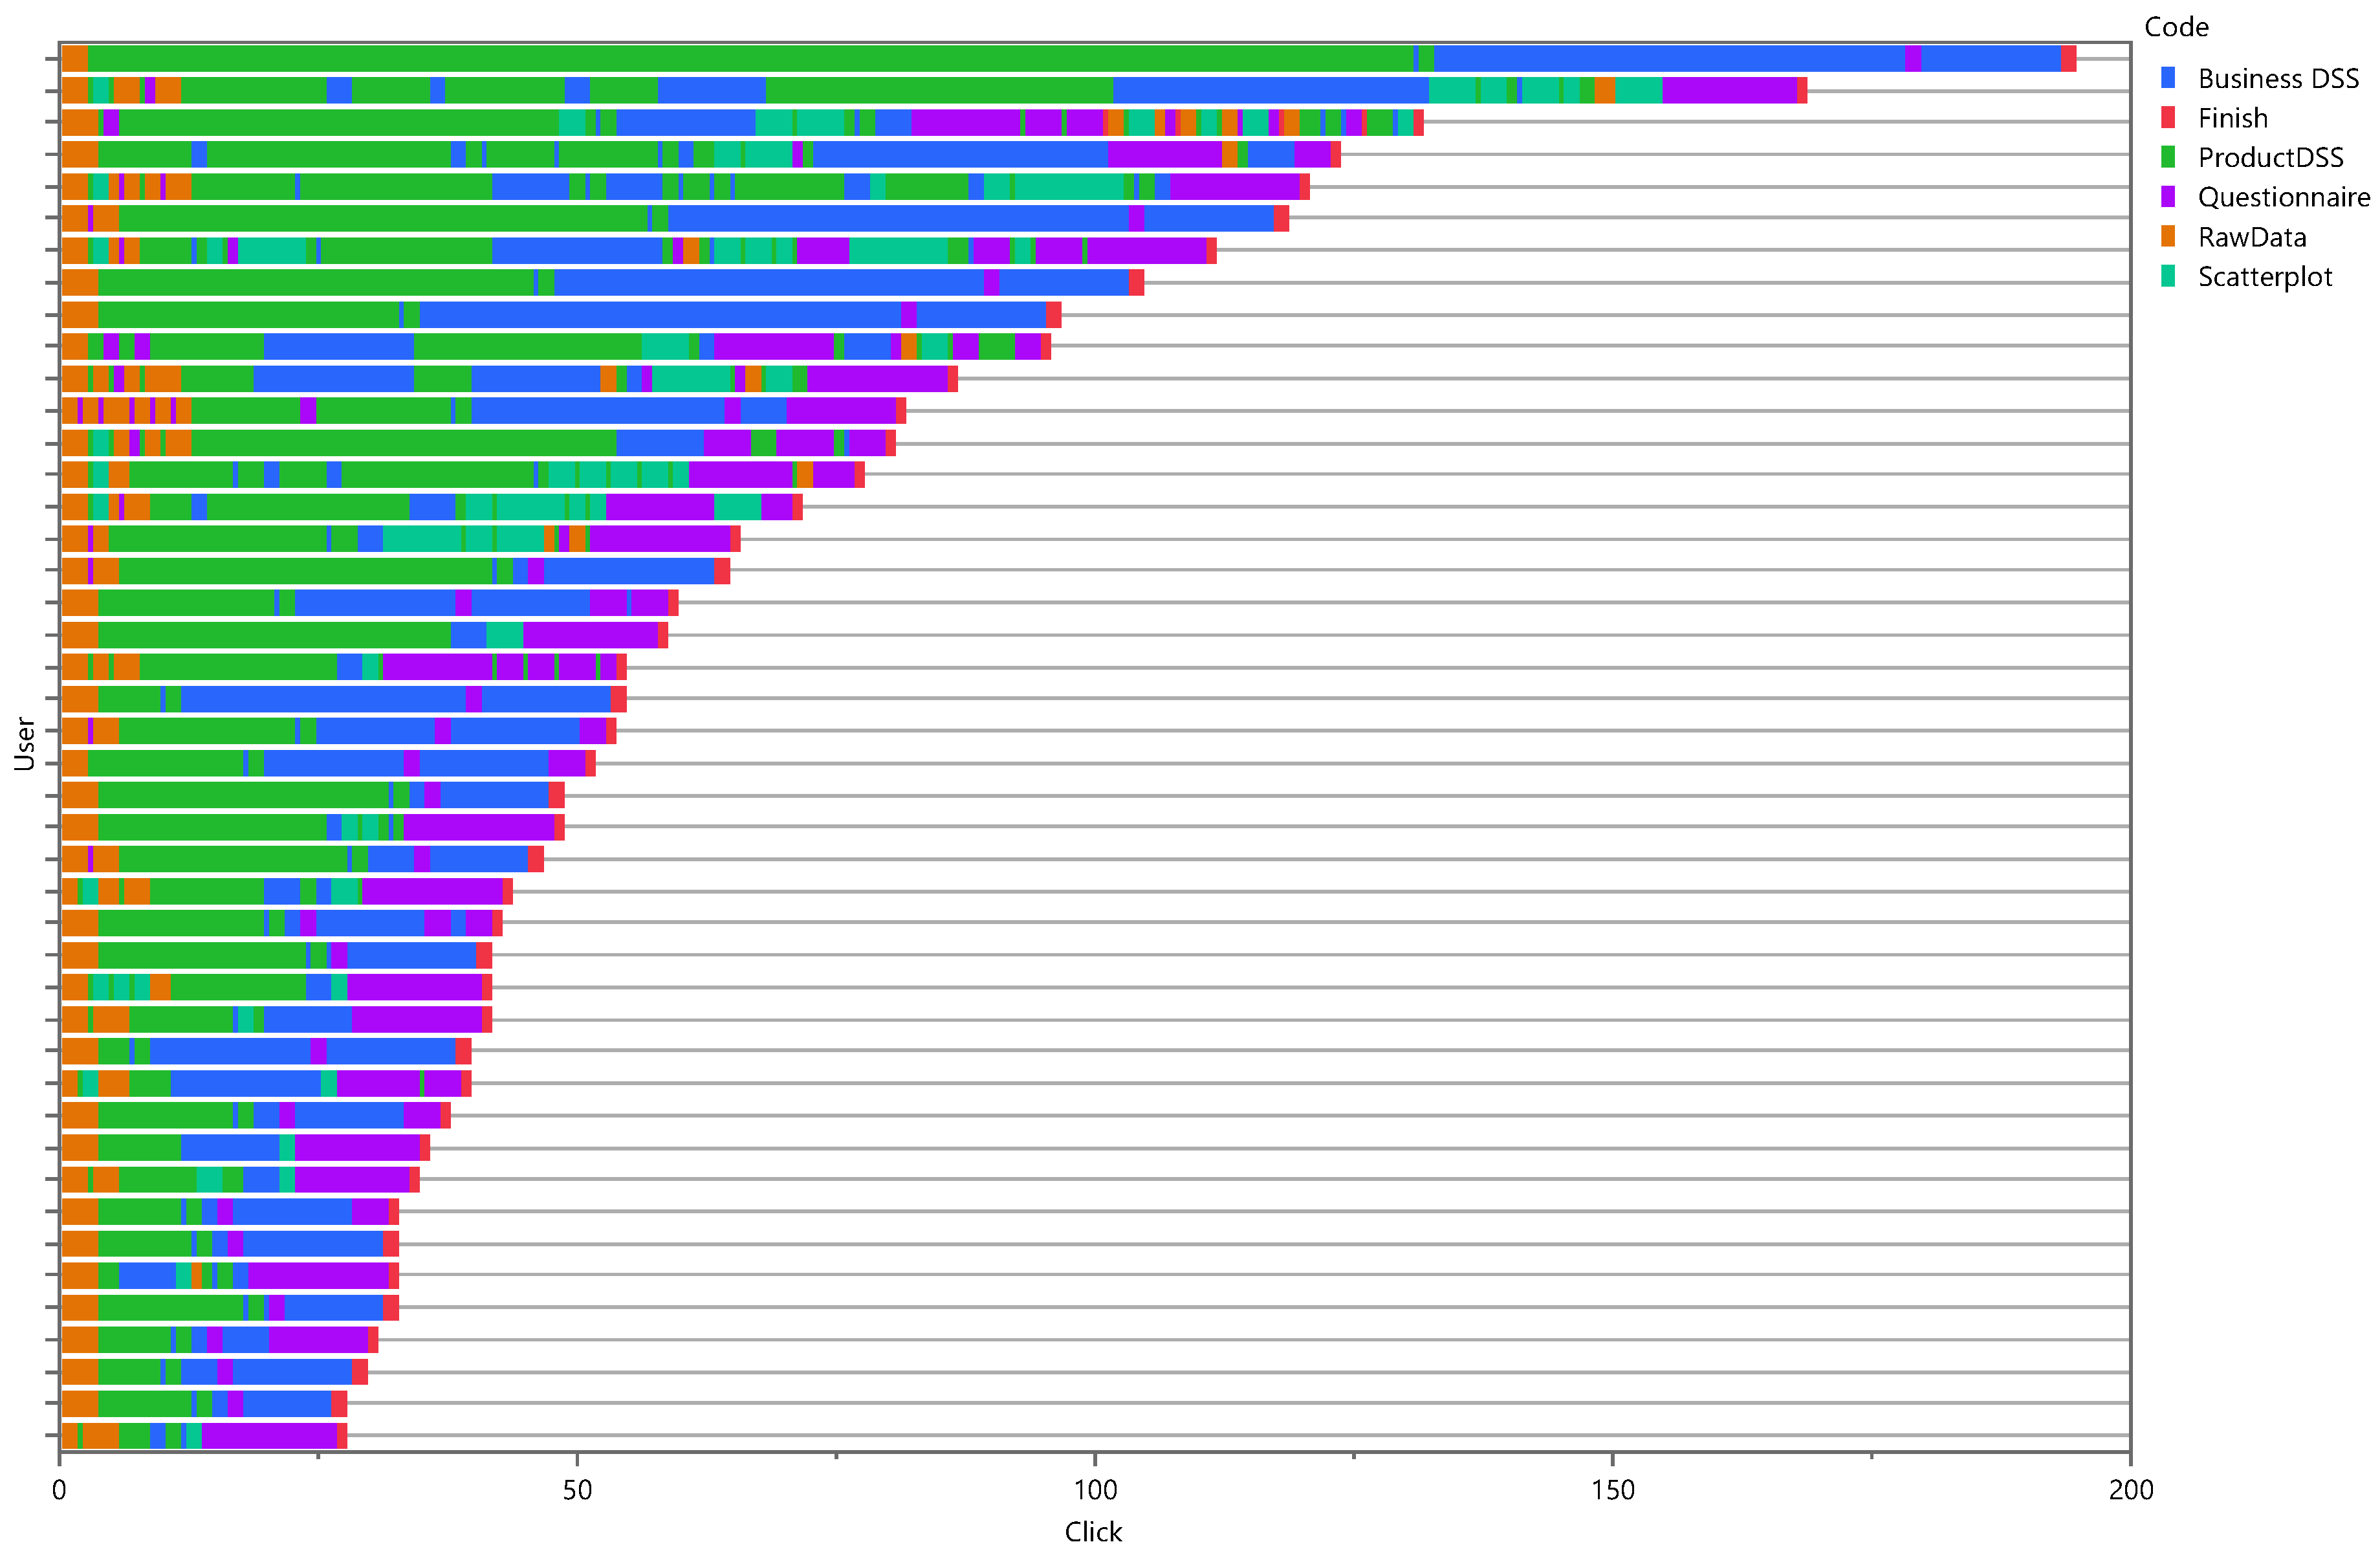
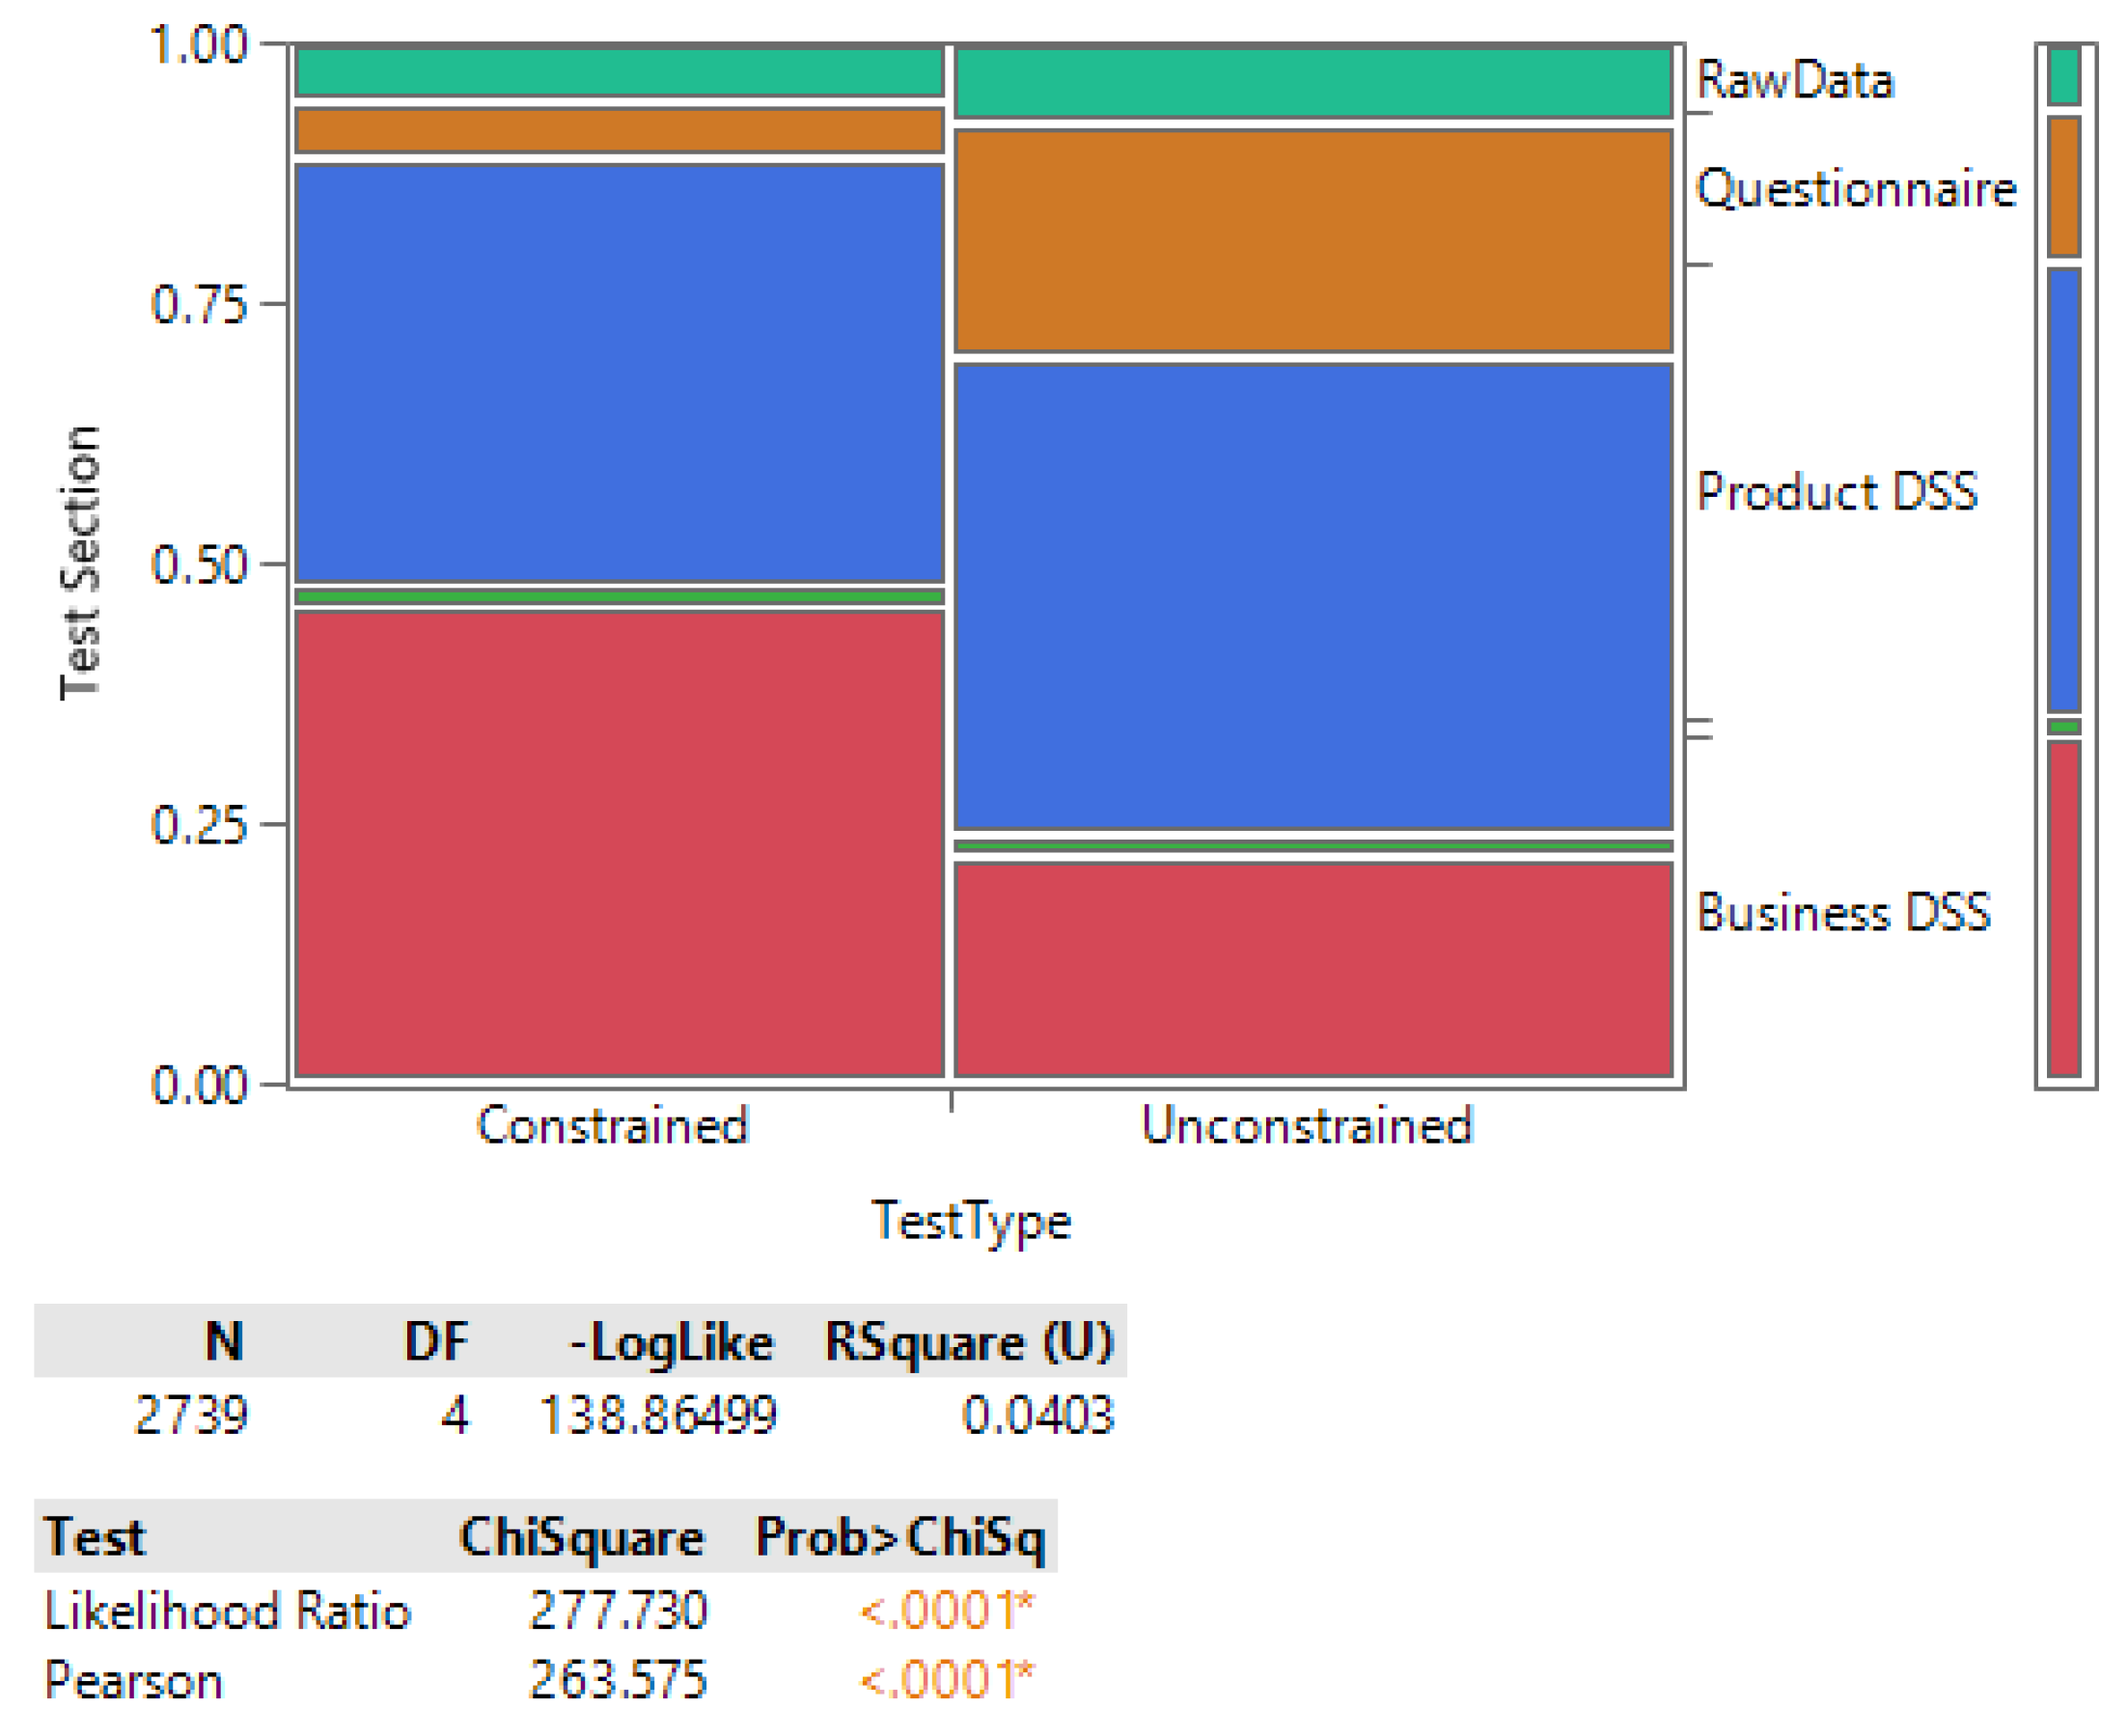
An analysis was performed using the event recording data shown in
Figure 4. The test was to see whether or not the users spent their clicks in a manner that was statistically different when using one test variant or the other. It was found, with a
p-value of less than 0.0001, that there was a difference between the two tests as far as what the user was clicking. This is shown in
Figure 6. This was interesting because it showed that the users had spent more or less time on certain sections dependent on the test variant.
It is seen that the constrained users spent significantly more clicks on parameters that were within the business DSS section. This may have been because users felt overwhelmed with all of the information being on one page in the unconstrained test, while in the constrained test, the PDG and business sections were on their own tabs. Conversely, it might have been that when presented with the PDG and business analysis in the unconstrained test, testers with an engineering background were perhaps more familiar with the PDG type of analysis, so they spent more time on it.
Furthermore, it is seen that users with the unconstrained test looked at the survey questions (questionnaire tab) more frequently, which might suggest that they were more interested in what they were trying to answer than the constrained users.
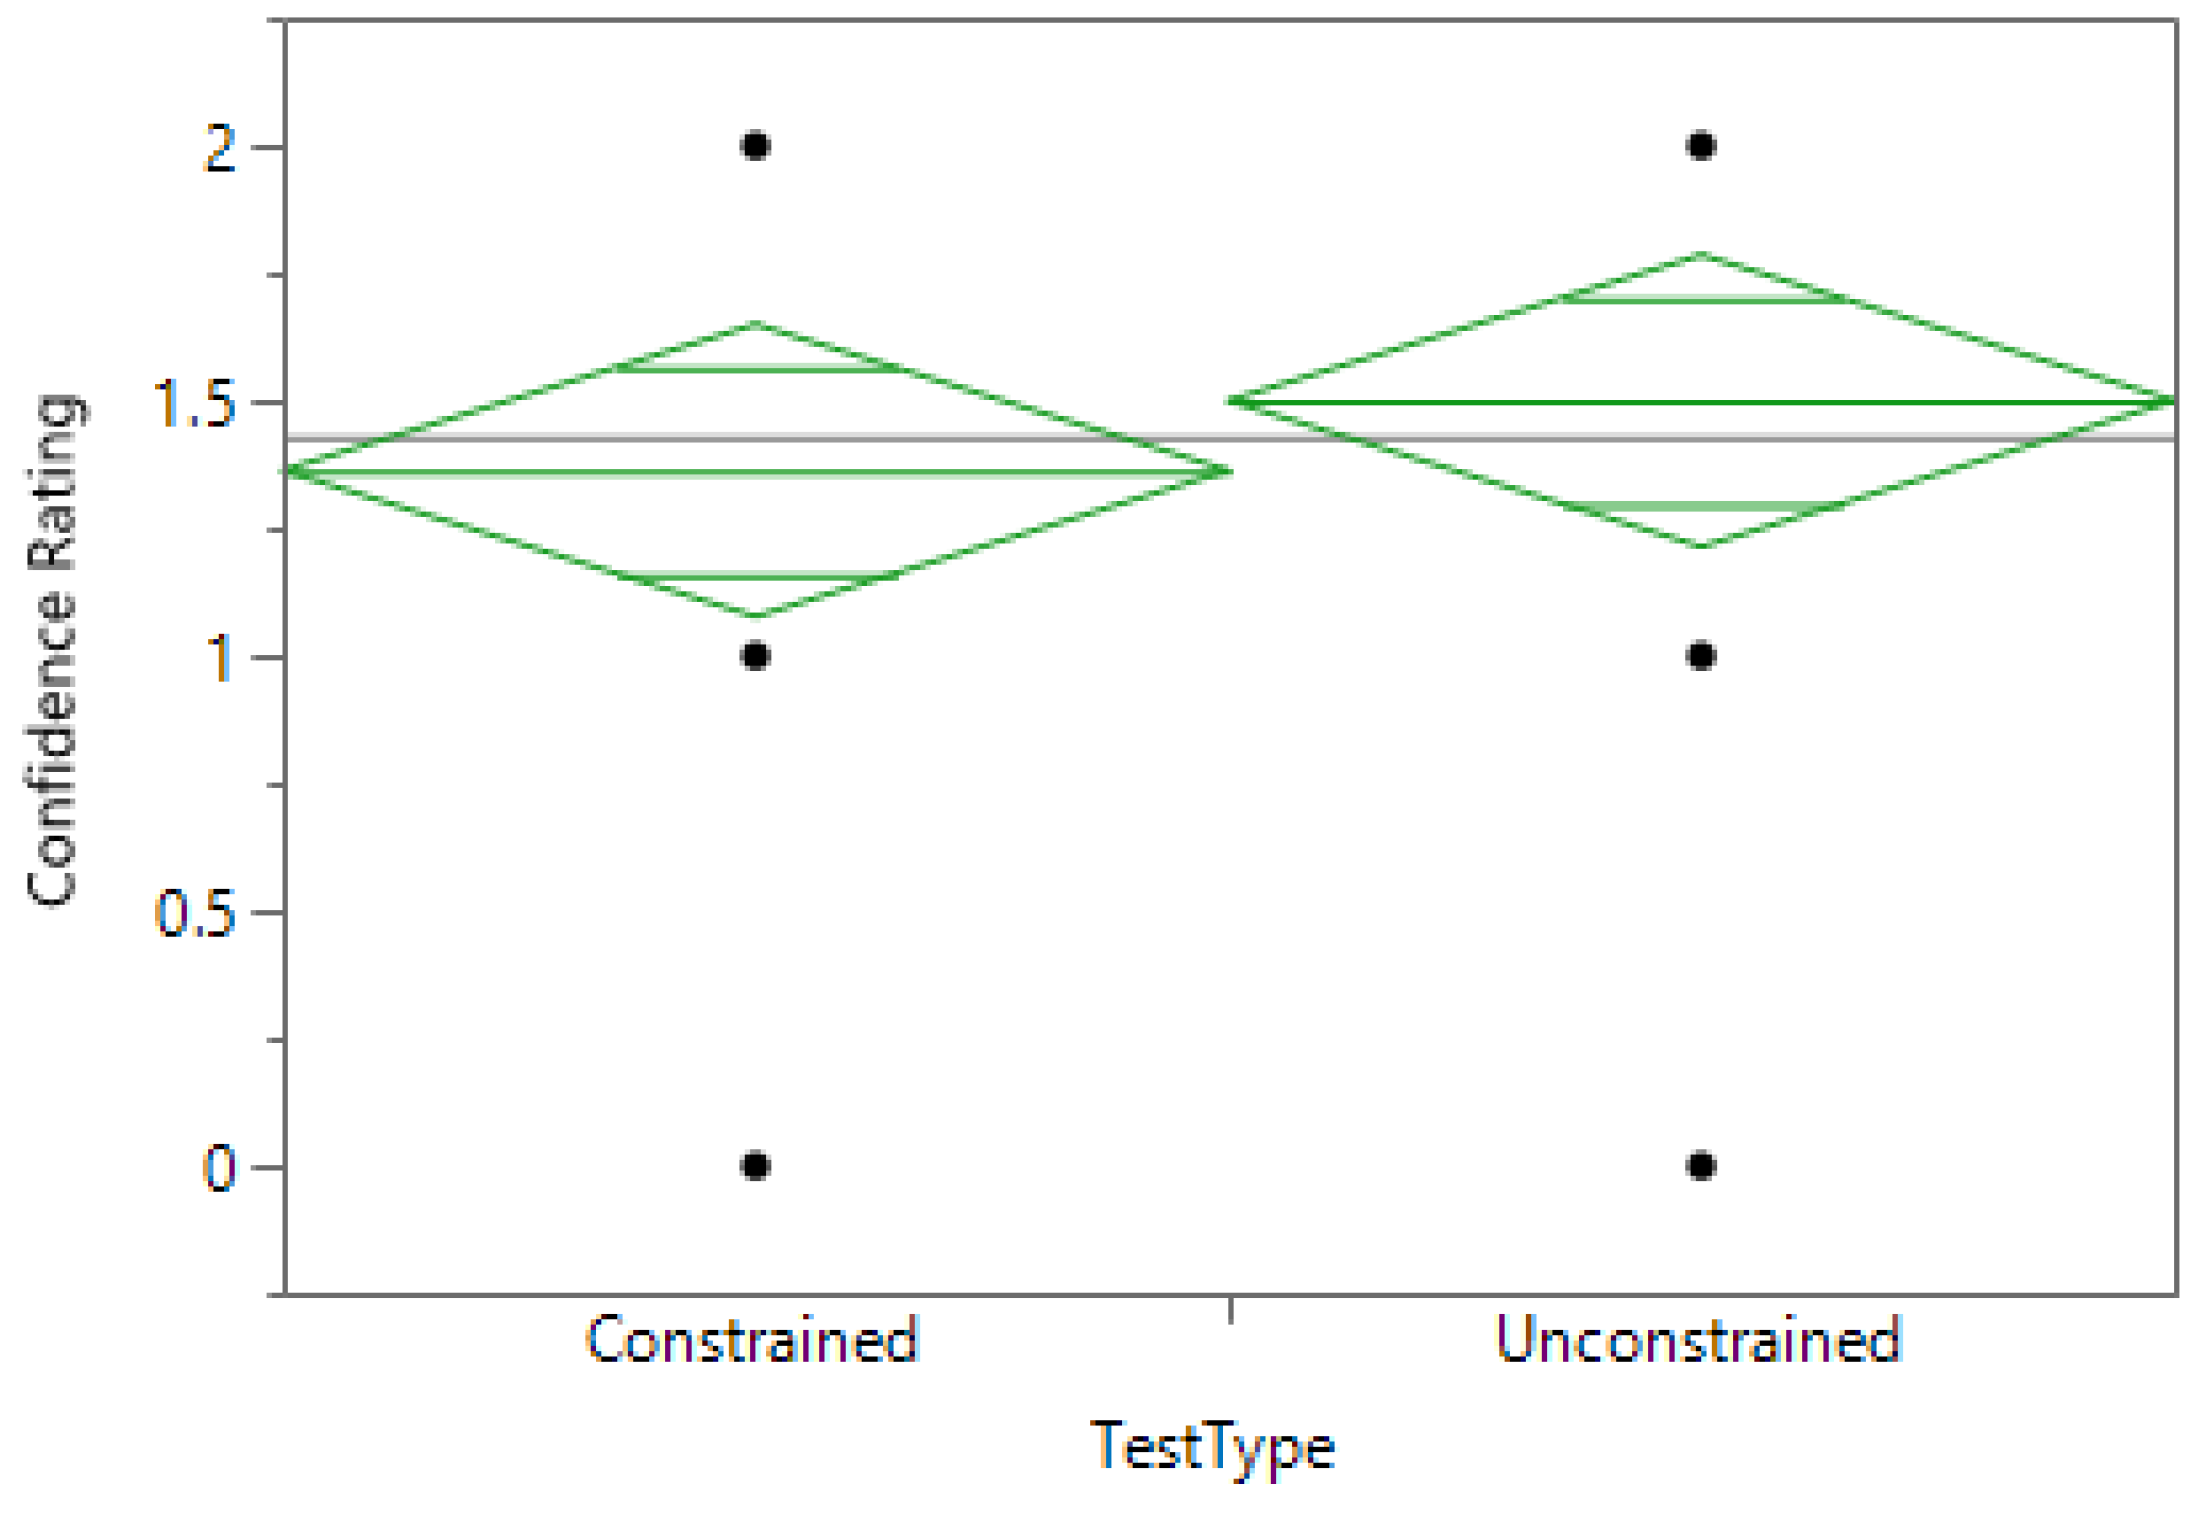
It was also tested if decision makers had more confidence in their final answers using one test or another. This was done by rating the user’s written answers, asking whether they would add the chair or not, on a scale where zero was unsure, one was somewhat confident and two was fully confident. The results of this test are shown in
Figure 7. This was found to have no significant difference.
4.6. Closing the Loop
After this tool was created, it was given to the company that initially had the question about adding the product. One of the employees of the company went through and did the analysis for himself. He remarked in the survey about whether or not to add the chair, “Based on the payback time, it does appear to be a good product to add to our line. We are currently in the process of adding a chair similar to the one in Troy’s program based on his recommendations.”
5. Conclusions
DSSs have been developed and used in the past; however, the effectiveness of integrating the DSS with other systems so that it showed the system effects has been given little attention, specifically in the area of product design and business integration. The system DSS in this research was developed to see if a system view is more useful than having unprocessed data or a non-system DSS. The system DSS consisted of an integrated PDG and business DSS. Using these two system tools, the effects of product design on the business could be analyzed. Results confirmed that the DSS increases the effectiveness of decision makers’ decisions by helping them better understand the decision they were making over using the unprocessed data. However, being able to view small dynamic changes in the system did not help the user come to better conclusions, nor was it shown in the survey that such was the case. Decision makers rated the tool quite well in the survey questions regardless of the test type. From this, it can be concluded that the system DSS is in fact more useful than other analysis forms. However, an interesting conclusion was also made that the two types of DSSs that were presented showed no difference on the decision maker’s ability to make decisions.
5.1. Recommendations
Due to the favorable response of users in this testing scenario, the authors consider the design and usage of a system DSS to be useful in industry. Furthermore, the more complex a system is, the more beneficial a tool becomes. However, in designing a simple product or system, the benefits are somewhat reduced since developing an entire system DSS takes significant time and effort relative to how long it takes to do the analysis iteratively. In a scenario where the system being analyzed is affected by many factors that are hard to visualize (e.g., flash memory devices, military systems), a tool similar to the one developed could be very beneficial because it will allow the analyst to account for interactions that would not otherwise be seen.
5.2. Future Work
There is a large amount of work that has been performed in the area of decision support systems, which is evidenced by the many articles and journals entirely dedicated to the subject. However, the integration of systems into multi-disciplinary analysis tools is lacking. Adding to this, a focus on standardization by creating an easy to use framework that can accept numerous types of equations to assist in the decision maker’s ability to create an interactive DSS could be of great benefit. The principles of visualization, optimization and dynamic analysis are used in many DSSs, and if functionality were added to make these tools connect to various datasets and engineering models, additional directions of research could be particularly beneficial to explore in improving decision making.


