An Integrated Participatory Systems Modelling Approach: Application to Construction Innovation
by
 , , , and
Emiliya Suprun
1,2,3 ,
,
Oz Sahin
1,2,3 ,
,
Rodney Anthony Stewart
1,2,3,* ,
,
Kriengsak Panuwatwanich
4 and
and
Yaroslav Shcherbachenko
5 1
School of Engineering and Built Environment, Griffith University, Gold Coast, QLD 4222, Australia
2
Cities Research Institute, Griffith University, Gold Coast, QLD 4222, Australia
3
GCCRP Systems Modelling Group, Griffith University, Gold Coast, QLD 4222, Australia
4
School of Civil Engineering and Technology, Sirindhorn International Institute of Technology, Thammasat University, Pathum Thani 12120, Thailand
5
Housing Fund, Severnyy, 308519 Belgorod Region, Russia
*
Author to whom correspondence should be addressed.
Systems 2018, 6(3), 33; https://doi.org/10.3390/systems6030033
Submission received: 26 June 2018
/
Revised: 19 July 2018
/
Accepted: 14 August 2018
/
Published: 20 August 2018
(This article belongs to the Special Issue Systems Thinking: Concepts, Issues, and Applications in Large Complex Systems)
Abstract
:This paper presents a novel five-stage integrated participatory systems modelling (IPSM) approach that can be used for a range of systems dynamics (SD) applications. The IPSM approach was formulated considering the advantages and disadvantages of existing SD modelling approaches, as well as balancing the competing goals of SD model development efficiency and robustness. A key feature of the IPSM approach is that stakeholders are central to each of the five stages of the modelling process from problem scoping, to scenario analysis and strategy implementation recommendations. Each stage of the IPSM approach was demonstrated through a case study of the innovation diffusion process in the Russian Federation construction industry. This highly complex innovation system could only be sufficiently understood using a SD model that was conceptualised, critiqued, codified, tested and utilised, by the relevant actors within that system (i.e., stakeholders). The IPSM approach facilitated the efficient formulation of the SD model for the case study application. The case study SD model simulation results indicate that sufficient government incentives and the active promotion of strong collaborative linkages between construction companies and universities are two key enablers of innovation development in the Russian Federation construction industry.
1. Introduction
This research was motivated by a desire to feasibly build a holistic model that could aid the development of suitable innovation diffusion strategies for the Russian construction industry. This decision support tool would need to be developed within time, cost and robustness constraints, be able to handle the non-linear nature of the innovation process and encapsulate the various interrelationships among diverse components of the dynamic and complex construction innovation system. System dynamics (SD) modelling was considered a powerful technique for integrating social and technical phenomena into qualitative frameworks and quantitative models [1]. Such models focus on feedbacks within a system and enable them to investigate the behaviour of system components over time based on the numerical analysis of developed equations. Furthermore, given the multi-actor nature of the system under study, high uncertainty and the lack of empirical data availability, a new SD model development approach needed to be purpose-built before commencing the data collection phase of the study. A critical review of existing approaches led to the design of a novel integrated participatory systems modelling (IPSM) approach. The IPSM approach integrates the advantageous features of existing approaches while mitigating their weaknesses and employs a feasible level of active stakeholder engagement for all stages of the SD modelling cycle. The participatory elements include questionnaire-based opinion surveys, face-to-face interviews, direct consultations and a series of stakeholder workshops. The modelling process is highly iterative and a modeller, together with an engaged stakeholder group are encouraged to continuously improve the SD model elements when applying the herein advocated IPSM approach. The methodology is considered to be efficient in getting stakeholders with divergent interests and perceptions of the studied problem to be engaged in the modelling process for bringing together their knowledge and expertise. Moreover, the IPSM approach highly supports meeting mutual interests of stakeholders in an integrated way within co-designing of the model and co-decision making, which subsequently leads to promoting social learning.
In this paper, the developed IPSM approach has been applied to the innovation process in the Russian construction industry context where data was solicited from stakeholders. The scope of the theoretical framework for the Russian construction innovation system has a strong focus on the core actors of the government, industry and academia and their interrelationships. The construction sector plays a key role in any country’s economy. However, the innovation implementation process in the construction industry has been extremely slow [2,3,4,5]. One of the reasons is a significant gap between the creation of theoretical foundations for technology within R&D and their absorption and application in mass production. Consequently, stronger interaction between research and industrial organisations is needed to foster greater rates of innovation diffusion. In other words, it is very important to foster the pursuit of the common interests of all of the system’s actors in order to improve innovation [6,7,8]. Given the ever-changing political context, the Russian government prefers to take measures aimed at supporting the demand for domestically produced innovative goods and services [9]. By 2017, the construction industry was estimated to contribute about 5.6% of the Russian GDP. The government has the objective to increase the industry’s GDP contribution to 6.8% by 2030 [10]. To achieve this bold target considering the constraints of a challenging financial period ahead, Russian construction sector companies would need to increase their focus on innovative activities that significantly enhance productivity. Although, domestic manufacturers produce a wide range of traditional building products, Russian construction industry products and services are not well-presented internationally with a high dependence on importation. Moreover, technological weaknesses and outdated practices and processes are forcing national companies to lag behind innovative foreign competitors. Systemic barriers within the Russian country context also need to be overcome before a culture for innovation takes hold in the industry. A robustly developed SD model can be used as a strategic planning tool for government agencies seeking to promote industrial development in the most efficient and effective manner.
Following the introduction, this paper is structured as follows: Section 2 reviews, compares and discusses various participatory SD modelling approaches presented in the literature. Section 3 elaborates on the five core stages of the developed IPSM approach utilised for the case study application. Section 4 applies the novel IPSM approach for the development of an evidence-based SD model for the innovation process in the Russian construction industry. Lastly, Section 5 presents conclusions, research limitations and future research directions.
2. Review of Participatory SD Modelling Approaches
Typically, the SD modelling process is carried out through the following stages. Firstly, the problem definition stage, which clarifies the problem and identifies variables having an influence on it [1,11,12]. Then, the conceptual model is built, which reveals relationships among the variables. The conceptual model is further developed into a comprehensive computerised model followed by an analysis of model behaviour. Finally, scenario analysis is conducted to uncover the most efficient and effective pathways to derive better outcomes from the system over medium to long-term timeframes.
SD models are simulation-based, and, hence, data intensive. Both, quantitative and qualitative data is used throughout the modelling procedure. Nevertheless, incorporating qualitative inputs into SD models is very challenging [13]. However, reliable empirical data is often not available to support causal relationships for many of the elements contained within SD models. This challenge was especially evident for the difficult case of innovation process SD modelling in the context of the Russian construction industry, where relevant industry data was often not publicly available or did not exist [14]. Consequently, in such circumstances, the engagement of stakeholders and experts during most of the stages of the SD modelling process becomes essential. They can be involved in any modelling phase from identifying the problem to be investigated to scenario and policy alternatives development. Hence, participatory modelling approaches enable a modeller to understand specific situations and contexts by eliciting information from stakeholders with relevant backgrounds. Subsequently, the stakeholder engagement process connects the discussion and assessment of the problem-related factors encountered during the modelling process, facilitates the generation of dynamic hypotheses and the formulation of scenarios and finally ensures that only fit-for-purpose strategic options are being analysed [13,15]. A brief overview of the various types of participatory modelling approaches used for SD model building is provided below. We also introduce the novel IPSM approach, which will be described in detail in the next section.
Group model building (GMB): GMB is a process of building visual qualitative conceptual models (i.e., causal loop diagrams (CLDs)) and quantitative dynamic models (i.e., SD) jointly with stakeholders [16,17,18]. Different GMB sessions can have different purposes such as identification of a dynamic hypothesis, discussion around the system boundary, examination of potential scenarios of policy implementation, to name a few. So-called standardised ‘scripts’ are used by facilitators and modellers during the modelling sessions as templates. Usually, the modelling process is used to translate individual viewpoints of the participants into a common modelling language (i.e., feedback loops, stocks, flows, time delays). In other words, it enables modellers to confidentially link the information regarding various elements and causal relations collected from stakeholders into of a model. GMB sessions are capable of building mutual understanding, however, a consensus among stakeholders with diverse backgrounds has to be reached in order to formulate a powerful model.
Mediated modelling (MM): MM is a similar process to GMB. However, this approach is mostly applied to model environmental issues [19,20]. Moreover, stakeholders are involved more in the development of a dynamic simulation model, while stakeholders participating in GMB sessions focus a lot on the conceptual phase of the modelling cycle. The MM process requires a high level of commitment from stakeholders along with intensive participation in order to reach a consensus.
Grounded theory (GT): GT approach relies heavily on qualitative data analysis based on ‘coding’ of textual data [21,22] that can be collected through interviews with stakeholders as well as can be retrieved from transcriptions of different-sourced interviews, observations, memoranda, or any kind of textual data. The process of transforming the data into model insights consists of a set of techniques from the identification of categories or concepts across the texts to linking them to explicit meaningful theories. While coupling with SD modelling, GT contributes primarily to the model conceptualisation stage by providing a solid foundation for the formulation of the dynamic hypothesis and identification of relationships among the problem-related variables in a targeted system. However, the model parameters need to be quantified by a modeller while predictive descriptions regarding the system behaviour and decision-making strategies can still be retrieved from the interview data.
Delphi method (DM): DM is combined with SD modelling in situations where no or very limited historical data is available. For instance, a modeller can use judgmental data retrieved from Delphi groups to obtain unknown parameters, policies and non-linear relations to be included in the model [23] Moreover, experts can be asked to emphasise importance scores and time sequencing. The stakeholders are involved in the process individually by responding to questionnaires or completing online discussion lists. However, they can interact virtually and anonymously to share their opinions on particular issues. Usually the surveys last two to four rounds until the reasonable level of consensus is reached. In fact, it is not always possible to obtain a reliable level of agreement. Nevertheless, such technique allows participants to express their own views on a problem, while taking into account the opinions of other experts. As a result, a modeller arrives at a good understanding of the key issues under discussion.
Integrated participatory systems modelling (IPSM): This novel IPSM approach for SD model development is proposed herein and has the key feature of integrating the empirical structural analysis impact matrix cross-reference multiplication applied to a classification (MICMAC) technique [24] with a subsequent series of stakeholder workshops [8]. It enables a modeller to obtain stakeholders knowledge explicitly, not only for the SD model formulation but also for the conceptualisation and policy-testing stages of a modelling process.
Application of one or another participatory modelling approach depends on many factors such as context of application, research goals, stakeholder involvement structure, to name a few [16,18,25]. The important aspects to consider during the selection of a particular participatory modelling approach can be categorised into the following parameters: time and cost needed for a model development; ability to incorporate different stakeholders’ opinions and ensure successful social learning among participants of the modelling process; ability to deal with complex problems; expected level of consensus among stakeholders; and size of stakeholder community.
First of all, it is important to highlight that each of the techniques can relate to the time taken for a model development and cost of the modelling process. In general, stakeholder engagement is time-consuming, expensive and labour-intensive process to a modelling team. Flexible inclusiveness is also important for dealing with complex problems that involve diverse stakeholders at different levels. Hence, it becomes essential to incorporate perceptions of various categories of stakeholders separately. At the same time stakeholders with divergent interests and perceptions of the problem need to participate together in order to ensure strong cooperation among them, to incorporate co-designing of the model and co-decision making, which subsequently leads to building trust and promoting social learning. Social learning is the process where stakeholders consider the motives of each other, acquire their knowledge and bring their expertise to enhance their understanding of the system and meet their mutual interests in an integrated way. Different approaches allow to reach various levels of consensus among stakeholders. Undoubtedly, this aspect is critical in gaining the scientific knowledge related to the problem being addressed. Nevertheless, it can become a difficult task to reach a consensus and to make the decision as some authoritative participants significantly affect other stakeholders’ perceptions leading to lack of objective judgment. Hence, it is useful to couple a number of techniques where consensus is not the key. The number of participants needed for addressing a problem can affect stakeholder participation in the various modelling stages. Particularly for modellers, it can be very challenging to involve many relevant experts given the financial conditions, time restrictions and general busyness of potential stakeholders. System problems can be distinguished based upon their degree of complexity. Understandably, not all of the reviewed approaches are suitable in solving the complex issues.
A critical comparison of peculiarities of the mentioned participatory approaches is provided in Table 1, which emphasises their strengths and weaknesses accompanied by differences in the modelling process according to the selected parameters.
As can be seen in Table 1, these approaches have common similarities, however, there are shortcomings to take into account. IPSM approach considers advantages and disadvantages of existing participatory modelling approaches and incorporates the nuances of continuous stakeholder engagement that is capable of significantly influencing the perceptions associated with phenomena found in complex systems.
3. Developed IPSM Approach for SD Modelling Applications
The core of the proposed modelling procedure is the development of an SD model that can aid interpretation of the complex cause-and-effect relationships between government, academia and industry within the construction innovation system. The visualisation of the IPSM process is illustrated in Figure 1. For each stage, a number of activities are included. They are outlined in further detail below.
3.1. Stage 1: Problem Scoping
The first stage of the modelling process is to identify the problem to be investigated and to distinguish the essential system components [26]. Moreover, it is important to engage with the relevant stakeholders (e.g., representatives from construction and related industries, public sector, universities and the research community) in order to produce a high-quality SD model. Experts assist a modeller in collecting information about the problematic issues and continuously validate the output of the model.
In the present study, a comprehensive literature review was performed followed by an exploratory study conducted to identify the most significant factors within the construction innovation system that influence the low rate of innovation diffusion. By doing so, a questionnaire survey was carried out and a statistical analysis was performed to explore the barriers, enablers and strategies that most significantly affect construction innovation diffusion. Then, a qualitative approach of data collection consisting of in-depth interviews was employed to contextualise stakeholders’ perceptions on the problem under study.
3.2. Stage 2: Conceptualisation
After defining the dynamic problem, the task is to decide upon a preliminary list of main variables and a suitable time horizon for further model simulation. Subsequently, a conceptual model representing the problem within the system can be built by simplifying assumptions underlying a model design [12,13,27]. This simplification is done based on available data and knowledge of the relevant stakeholders.
Most of the system variables are qualitative and cannot be analysed quantitatively. Hence, the variables need to be assessed in order to develop a CLD and further formulate a computerised SD model. First of all, consultations with expert stakeholders are held to confirm a list of the most essential elements that describe the dynamics of the system. The next step is to conduct a structural analysis using the MICMAC technique that allows stakeholders to describe the system and quantify the relationships among the selected factors [28,29]. By doing so, experts participate in an opinion survey in the form of one-on-one structured interviews in order to complete a cross-impact matrix linking all constitutive elements of the system. Subsequently, causal feedback loops between the elements can be distinguished, followed by the creation of a conceptual model in a form of a CLD.
In general, CLDs describe the structure of the system, its variables and their mutual interactions. System elements are connected by causal relations characterised by a certain polarity. Thus, links that produce change in the same direction (increasing or decreasing) between causes and effects are marked with a positive sign. Conversely, links that produce change in a different direction (i.e., if a cause increases, the effect decreases and vice versa) are marked with a negative sign. Double lines across the arrows represent delayed information, that is, a time lag between a cause and its effect. Furthermore, it is necessary that a loop polarity be determined. Reinforcing (also known as positive) loops accelerate change within systems to produce growth or decline, while balancing (also known as negative) loops counteract change within systems to produce stabilising behaviour [1,25,26].
Additionally, identification of system archetypes within CLDs can assist a modeller in the explanation of system structure and behaviour. An archetype is a well-defined structure, which reveals leverage points for policy intervention to overcome system challenges, works as a reference to generate various strategies for dealing with the underlying structure of the system and analyses the dynamics of possible scenarios of complex systems. Typically identified system archetypes are the following [30]: fixes that fail; limits to growth (limits to success); success to successful; shifting the burden; eroding goals; tragedy of the commons; and escalation.
The next research step refines the initial conceptual model generated from the MICMAC analysis. By doing so, a first round of stakeholder workshops should be held to: extend the created CLD; discuss dynamic hypotheses; and capture expert opinions in regard to specific construction and innovation management.
Although CLD is widely recognised as a powerful modelling tool, it is not capable of representing the dynamics of the system precisely because the changes over time cannot be seen. To overcome this limitation, an SD model development is required as a next stage. Using the proposed IPSM approach as a precursor to the construction of a simulation model ensures that the developed SD model is based on a solid theoretical foundation supported by competent expert opinions and judgments.
3.3. Stage 3: Dynamic Model Formulation
While a conceptual stage aims to structure the system problems in a qualitative form, the formulation of a computerised model assists a modeller in both problem structuring and problem solving in a quantitative way [11]. Once a conceptual model has been developed, it is translated into a computerised mathematical model in the form of a stock and flow diagram that is more detailed than a CLD. For the purposes of the model formulation, a stakeholder workshop needs to be held to identify the key stock and flow structure for the system under study, to distinguish the system sub-models and to discuss the behaviour of certain variables over time. Participants need to determine the main variables that are considered to be accumulated levels that produce the behaviour in a system over time (stocks) and variables that are rates that change the identified level variables (flows) [20,31,32].
As a next step, a modeller needs to start connecting the variables by writing a set of equations and populating them with values to create a first iteration of the mathematically formulated SD model. Using additional qualitative data or general patterns that cannot be found in the literature or produced from the previously conducted research steps (i.e., structural analysis with MICMAC) should be used. Once the initial SD model has been constructed by a modeller, another workshop should take place to develop an adequate mathematical representation of the situation which is being researched. Discussion should be conducted around the best way to: evaluate certain variables; define the initial values of some uncertain levels, rates and auxiliary variables; and identify potential management strategies, key levers, policies and decision-making interventions. It is worth noting that sometimes the values and functions can be added to the model as assumptions, as the modeller will revise them for every iterative step and continuously increase their precision. The extracted data has to be translated into an SD programme. This study used Vensim® software version DSS 7.2, developed by the Ventana systems [33].
The formulated SD model needs to be refined after the workshops. It is necessary to transfer all of the collected qualitative data into mathematical form (e.g., if-then rules, general patterns, certain probabilities and Monte-Carlo sensitivity analysis). Then, several preliminary SD simulations has to be completed in order to fully parameterise and calibrate the developed SD model.
3.4. Stage 4: Model Analysis
The model analysis stage is essential in establishing confidence in the model correctness and usefulness before it can be used for decision making, scenario runs and policy analysis [12,13]. Undoubtedly, it is important to understand why and how certain model output emerged. In particular, the model testing process explores how sensitive a model output is to changes in model parameters and how well the modelled system corresponds to real world behaviour. Once the model is subsequently validated, it is capable of supporting decisions when considering policy design. Nevertheless, according to Forrester and Senge [34], “there is no single test which serves to ‘validate’ a system dynamics model. Rather, confidence in a dynamic simulation model accumulates gradually as the model passes more tests and as new points of correspondence between the model and empirical reality are identified.” In other words, SD models are not validated but tested as truthful so modellers (and the users) can gain more confidence about the model [35]. Moreover, models cannot be proved valid but can be judged as complex systems are dynamic and change unpredictably.
While there is no single approach to testing SD models, there is a great number of validation tests depending on the particular purpose the model needs to be properly assessed for [1,26]. A sensitivity analysis is essential for the identification of parameters that have strong effects on the model outputs related to certain policy implications. In other words, the degree to which the system changes reveals the model’s sensitivity to these parameters.
Validation tests are usually based on: a model’s structural validity to ensure the structure of the model is an appropriate representation of the system (e.g., extreme conditions test, parameter verification test, etc.); and behavioural validity to ensure the model is able to produce an acceptable output behaviour with sufficient realism and quality (e.g., behaviour prediction test, change-behaviour test, etc.).
First of all, each equation needs to be checked to confirm the unit’s consistency (i.e., dimensions of the left part of the equation are the same with the right part). Additionally, the robustness of a model can be continuously tested by comparing it to the initially generated reference modes. Model validation is a gradual process of establishing confidence in an SD model.
In order to build the confidence regarding the model usefulness and realism, we constantly involved stakeholders throughout the modelling process via stakeholder workshops and expert consultations. Stakeholders engagement ensured the model outputs adequately reflect the real situation by adjusting the modelling logic.
3.5. Stage 5: Model Use and Recommendations
The last stage in the modelling procedure is the model use stage, that is, model application in decision-making and policy design that incorporates a system perspective for when there is uncertainty [15,20,25]. In this research, outputs from the conducted structural analysis with MICMAC and consultations with stakeholders were used to define and evaluate the potential strategic pathways to apply the policies to overcome innovation diffusion challenges in the Russian construction industry. Moreover, experts assisted a modeller in discussing important scenario settings and distinguishing strategically important policies associated with guidelines and recommendations.
Scenario planning and analysis will be dependent on the research problem being studied. For this study, the model’s behaviour is analysed in the context of different transition pathways [36,37]. The transition scenarios concept considers a range of scenarios that incorporate one ‘business as usual’ situation with no transition occurring and four other different kinds of transition pathways, depending on the two most relevant and most uncertain drivers for the construction innovation. In this research, a range of plausible futures are to be discussed with stakeholders in the form of ‘What if’ questions related to a number of scenarios that arise from various regimes, level of collaboration among the actors and goals within the construction innovation system.
After agreeing on the key scenario settings and most effective policies, a modeller applies these conditions to the model and creates decision rules and recommendation frameworks. This process is more than just changing the parameters values and includes the optimisation of the resilience of the system in the face of external changes. As mentioned above, it is important to engage stakeholders in this process in order to potentially implement the planned changes. Moreover, the last stage of the modelling process does not end when a particular problem is solved as it can be applied for solving some similar problems. For application details regarding each stage of the modelling process and stakeholder engagement methods, please refer to the next section and Table 2, respectively.
4. Application of IPSM Approach to Construction Innovation
As previously mentioned, the chosen IPSM approach aims to support the understanding of the multi-dimensional construction innovation process by actively involving stakeholders (Table 2). The study participants were: researchers and academics specialising in construction management, civil and structural engineering; designers, project managers and directors of construction companies; and public servants with roles related to the construction industry. Readers should note that detailed Supplementary Materials (SM) augment this IPSM application. SM-1 describes the profile of the stakeholders involved in the case study.
4.1. Case Study: Construction Innovation System in the Russian Federation
The theoretical framework of the construction innovation system and the main actors examined in this study, is illustrated in Figure 2 representing the dynamic feedback phenomenon. A detailed background of the case study including the Russian construction industry context, Russian construction innovation policy, and so forth, is provided in SM-2.
4.2. Stage 1: Problem Scoping
As the first stage of the systems modelling process, a comprehensive review of the existing literature was performed followed by an exploratory study in order to define the problem to be addressed, identify the research goals and set the foundations for the further structuring of the problem. By doing so, experts were engaged to gather data about current situation in the construction industry in Russia as well as to discuss and analyse the barriers and drivers that most significantly affect construction innovation diffusion. The problem to be modelled was identified to be focused on the poor innovation performance in construction that should be seen in the light of the industry complexity and the inherent dynamics of the innovation diffusion within the construction innovation system. Hence, the overarching research goal was to define what policy recommendations and various innovation planning strategies the Russian government, industry and universities should implement to achieve the robust development of the construction industry and overcome the excessive conservatism over time.
4.3. Stage 2: Conceptualisation
Model conceptualisation phase assists a modeller in structuring the systems problem and assigning the model boundaries. This stage is particularly important for our research given the multi-actors nature of the system under study and lack of data involved. In order to achieve a higher level of innovation activity within the construction sector it is fundamental to identify how the cause-and-effect relationships among the variables of the innovation system can be combined into a complex model. The use of the conceptual model allows for a comprehensive assessment of the impact of various policies and deeper investigation on system’s behaviour under various scenarios.
4.3.1. Structural Analysis
Structural analysis using the MICMAC technique was performed to identify key factors and their influences on each other. The analysis enables a modeller to underline the variables that are essential to the system’s evolution. A unique feature of the IPSM approach presented herein is that is uses the empirically conducted structural analysis procedure to aid CLD formulation.
Once the list of the most relevant variables within the construction innovation system was confirmed, a cross-impact analysis was performed in order to identify the role of the variables. By doing so, an opinion survey with the stakeholders was conducted. The experts quantified potential relationships between the system’s elements based on four rates of direct influence of the variables on each other: no influence (0); weak influence (1); medium influence (2); and strong influence (3). Figure 3 shows an aggregated structural analysis matrix linking the constitutive variables [28]. The next step aimed to indicate the influence and dependency level of each variable by calculating the sums of each row and column. The MICMAC software [24] was used to cumulate the rows and the columns for each element. As a result, the variables were ranked based on their dependency and influence level (Figure 4).
As previously mentioned, taking into account the complexity and inherent dynamics of the problem under study, various stakeholder views should be systematically interpreted in light of several essential pathways to a rational decision-making process. Consequently, the variables were ranked for three groups of the system’s actors separately, according to their influence on other variables and the system as a whole (Figure 5 and Figure 6). The ‘Industry’ category was represented by construction firms’ employees and design engineers (Table SM-1.1). The ‘Government’ participants were experts in the construction and innovation policies area. The ‘Academia’ participants were researchers and academics working in engineering and construction management fields.
According to the conducted structural analysis outcomes, there is a high level of agreement among the three groups of interviewed experts on identification of the role of various elements in relation to the construction innovation system. For instance, there is a prevailing focus on public strategies and collaboration metrics such as level of R&D activity, R&D collaboration and applied research. Nevertheless, some of the factors seem to be more essential for the industry and universities than for the government and vice versa. Thus, construction firm representatives and researchers tend to believe that the public sector plays a primary influential role in the innovation diffusion process as the level of administrative barriers, government incentives and regulation are seen to be impacting the level of innovation performance in the sector the most. On the other hand, public servants prefer the industry itself to take more initiatives in boosting the innovative activity, increasing private R&D expenditure and undertaking more research activities along with the research institutions. As mentioned above, construction firms and academia are the actors that generate innovation while government actions are the most significant drivers to innovation in Russia. Consequently, it is fundamental to understand the different and common interests of all actors within the construction innovation system in order to improve the industry’s innovative capabilities and innovation performance. In terms of the dependent variables, all the groups agreed that the innovation implementation outcomes (e.g., quality of construction projects, client satisfaction and profit maximisation) are highly dependent.
One of the main goals of the structural analysis using impact matrix cross-reference multiplication applied to a classification (MICMAC) technique is to understand individual roles of the elements within the system under investigation which in turn assists a modeller with recognising the key variables associated with strategies and policies, formulated and enforced by decision makers. Those roles could be identified from direct or indirect influence/dependence maps that are generated by MICMAC software (Figure 7 and Figure 8).
Every variable could be classified into the following categories depending on the quadrant they belong to:
- Influential variables act as input variables that exert strong influence on other elements and the system as a whole when they change. On the other hand, those factors are not dependent on the others. This group of variables must have a priority for decision makers when considering strategic actions and policy design under different scenarios.
- Dependent variables represent output variables that have low influence but are the most impacted by other variables and the system.
- Relay variables are both highly influential and dependent. These variables describe the system and condition of its dynamics as they are the most unstable and could change to be input or output variables.
- Autonomous variables are neither influential nor dependent and have low potential to affect the system. In other words, these variables exist within the system but are not controlled by the dynamics of the model.
As can be seen, the key influential and relay variables again confirm the importance of the public sector’s role within the construction industry in Russia (Figure 7).
The comparison between the maps for direct and indirect influences reveal hidden key variables or influences. Some of the factors have higher potential to change the dynamics of the system. For instance, the profit maximisation variable became more influential, proving to be not only an important result of successful innovation implementation but also a significant motivating factor while considering investing in innovative solutions. The level of tax incentives variable became less influential while the government incentives variable shifted to become more influential. Hence, government support in the form of additional grants, funds and subsidies is a more significant driver that encourages construction firms to innovate.
4.3.2. CLD Development
After the role of each variable was identified, it was necessary to look at the system as a whole in order to understand how the variables are interrelated. Therefore, as the next step, influence graphs were created using the MICMAC software [24] to highlight the networks of elements that influence one another. Interconnections among the variables were indicated by arrows that represent different levels of impact of the variables on each other from weak to strong. Within the context of systems modelling, these arrows illustrate the dynamic behaviour of the system while the influence diagrams are associated with a cause-and-effect diagram (Figure 9). It is clear that MICMAC influence graphs are not user-friendly, particularly for the stakeholder engagement purposes. However, as mentioned previously, the graphs work as an initial reference for the logical building of a CLD. The process of a qualitative model construction is always subjective. Nevertheless, the transformation of the generated influence diagrams into the systems conceptual model in a form of a CLD is based on a comprehensive analysis of interconnections among dynamic variables. Furthermore, a solid theoretical foundation along with previously conducted exploratory study followed by expert participation sessions corroborate the modelling process. The visualization of conversion of the influence graph into a CLD is illustrated in Figure 9.
As can be seen in Figure 9, only the strongest connections among the key variables were observed. The analysis investigates how the elements affect each other and how their actions can be transmitted throughout the system. It also should be taken into account that relations between some of the variables can occur through other variables. Additionally, a modeller applies the accurate knowledge when identifying positive and negative causal relationships by answering the question: ‘What are the impacts of variable i on variable j at the present?’ The polarity is ‘+’ when two elements change in the same direction (i.e., increase or decrease together). The polarity is ‘−’ when one variable increases while the other decreases and vice versa.
Seven main feedback loops emerged from the constructed CLD representing involvement of the industry, government and academia in the innovation process within the construction innovation system (Table 3). The relationships among the variables are dominated by reinforcing loops. The same reinforcing loop can have positive or negative impact on the system, depending on how the loop is triggered. In other words, reinforcing processes can be helpful for improving the innovation performance in the construction industry, or can serve to hinder the industry development. The positive description of the identified feedback loops is provided below.
R1 industry motivation: The innovation implementation leads to an increase in construction companies R&D activity as a result of quality improvement and client satisfaction as ones of the most essential industry motivation points. Subsequently, stronger involvement of construction organisations in research activities enhances further applied research.
R2 government’s role: By playing various roles in the construction innovation process a government has the power to make the industry and universities collaborate in order to provide the basis for absorbing and implementing R&D results. In other words, the strengthening of government intervention in the innovation process through various incentive mechanisms leads to greater partnerships and collaborations between the actors of the construction innovation system by supporting strategic innovative projects with greater industry participation. Subsequently, these connections build a robust foundation to the further development of public universities and research centres following by greater need for government involvement.
R3a, R3b practical application: Given the nature of construction innovation, it is necessary to transfer laboratory ideas and research results to the practical environment, which in turn leads to new opportunities for research centres to develop, test and evaluate new technological solutions.
R4 reduction of regulatory burden: The Russian government tends to take measures aimed at promoting the production of domestic innovative materials and technologies as a response to inflicted Western sanctions. The process affects changes in construction-related legislation, rules and building codes, that leads to simplifying administrative procedures. Hence, simplification of administrative procedures increases the chances of strengthening the contracts between universities, research centres and construction companies, which in turn enhances import substitution process.
R5 need for innovation: As a main client, the government is able to significantly influence and motivate construction companies to innovate through increasing the demand for cutting-edge products and processes in order to promote domestic science and further industry development.
There is a balancing loop B1 that represents side effects and consequences that can hinder the innovation process. Consequently, in order to limit the negative impacts of increasing costs and decreasing R&D activity, additional promotions (loops B2 and B3) are needed in order to boost the economic interest of firms without forcing them to wait for short-term economic benefits.
B1 expectation of short-term profit: Following a client’s requirements for implementing innovative solutions, a construction company, however, experiences significant business expenses. As a result of the increase in the quality of the final product, construction costs can be high and lead to low profits in the short-term prospective. Hence, construction companies prefer to stay conservative and do not invest in R&D. This leads to a drop in the industry’s interest in being innovative.
B2 support for innovation: High costs may be significant due to the implemented innovative solutions and make it hard for construction firms to compete. As a result, insufficient industry’s innovative activity takes place. This situation pushes the government to intervene by applying appropriate fiscal measures and incentive mechanisms in order to increase the attractiveness of research investments and stimulate not only those who implement innovations but also those who discover and develop them.
B3 overcoming isolation: In the majority of cases the insufficient technical and technological capabilities of construction companies hinder the industry’s ability, not only to implement innovative solutions but also to quickly adapt to new opportunities. In order to cope with the unwillingness of the industry to innovate, the government implements policies that promote science and invests in higher education and techno-parks to entice public R&D activity first. This in turn establishes integrated R&D collaborations required for effective implementation of technology-using strategies and research commercialisation and boost industry participation in the process [6].
As the next step, stakeholder workshops were conducted to refine and extend the initial conceptual model created on the base of the structural analysis with MICMAC. As a result, a representation of the problematic situation of innovation diffusion within the construction innovation system was generated (Figure 10). A comprehensive description of the step-by-step CLD extension and the feedback loops within the model is given in SM-3.
4.3.3. System Archetypes
In order to more effectively understand the root causes of the challenges and complex management issues, visualise the high leverage interventions and predict the system behaviour, four system archetypes were identified in the CLD representing the construction innovation system in Russia. The archetypes include limits to growth, shifting the burden, tragedy of the commons and eroding goals. As an example, two archetypes are explained below: limits to growth and shifting the burden.
The limits to growth archetype represents a process where accelerating growth is limited by a constraint that restricts growth or success. In other words, a period of growth initially starts due to the reinforcing loop, then is followed by a period of deceleration as the balancing loop inflicts limits and, eventually, pushes back on the reinforcing loop. As a result, a virtuous or a viscous cycle occurs due to the continuing efforts that lead to diminishing returns as limits are approached [30]. A number of large and medium-sized construction firms in the Russian Federation were identified to have this archetype since the growth in the number of innovative companies becomes constrained as feedback dominance shifts from a reinforcing to a balancing loop (Figure 11).
As detailed in Supplementary Materials SM-3, imitative construction companies and firms involved in R&D accelerate the industry development. This reinforcing loop is the engine of the level of innovation in the construction sector growth. However, the process has a balancing loop which limits this growth, that is, approaching market saturation that gradually decreases the number of potential innovative companies (Figure 11). Mainly large and medium-sized construction firms tend to have a potential capability to implement innovative solutions in the Russian context. Consequently, strategies to increase the market size become one alternative issue to improve the innovation performance. Moreover, the innovation rate is affected by companies’ readiness to adopt innovations from competitors or develop their own. Within the government program in which prospective companies have effectively received financial support, they have a tendency to invest in innovative solutions in order to become competitive and improve the business performance indicators.
The shifting the burden archetype describes a situation where relatively simple quick fixes lead to apparent success and, as a result, become addictive in tackling the urgent problems before dealing with ambiguous and complicated situations. On the other hand, more fundamental solutions are not attractive as they take much longer to apply and require a large commitment of resources. However, these quick fixes have only temporary benefits and cause serious side effects that escalate the real problem [30]. Consequently, the initial problem reoccurs over time with greater intensity that leads to significant delays in implementing long-term fundamental solutions to the problem. An ‘Innovators vs. imitators’ problematic situation was identified within the CLD to have this archetype as ‘firefighting’ behaviour which usually prevails among potential innovative construction organisations. There is a tendency to adopt innovative solutions from other successful companies (i.e., imitate others) rather than boosting innovation by collaborating with researchers and scientists (Figure 12).
As discussed previously, when there is a need to implement innovations in the construction process, companies have two options to become innovative: to be involved of the R&D activity or adopt already known technological know-how. Both options have a significant impact on the industry development due to active innovation diffusion process. However, the imitative strategy is much less cost and labour intensive, and, therefore, tends to become a priority among companies willing to introduce novel solutions and technologies. Unfortunately, it is a quick fix gradually leading to diminution in the already relatively weak interest of firms in R&D progress (Figure 12). In the long term, investing in local research and science would create know-how, new employment and industrial development. Therefore, the strategy to overcome low innovation performance problems should focus on strengthening the university-industry links and allocate resources to support domestic R&D.
4.4. Stage 3: Dynamic Model Formulation
After the model refinement stage, stakeholder workshops were held (Table 2) in order to translate the created CLD into a quantitative dynamic model to allow simulation of the system. The quantitative model is presented as a stock and flow diagram which is a graphical representation of a mathematical model. Such diagrams are able to capture the model structure and the interrelationships between the variables. The equations of the model have been regulated by using data from the development strategies [10,38], statistical sources [39,40], previously conducted structural analysis with MICMAC and stakeholder workshops. One of the main outcomes of the model is behaviour of the ‘level of innovation’ variable that measures the frequency to which construction enterprises perform technological innovative activities. Due to the complexity of the stock and flow diagram, only an extract of the stock and flow diagram that represents the core of the innovation diffusion process in the construction industry is provided (Figure 13). Stocks are symbolised by rectangles; flows are represented by arrows that flow into the stock (inflows) and out of the stock (outflows); and clouds represent the sources or sinks for the flows.
As mentioned previously, the proposed model of the construction innovation system integrates the core structure of the Bass diffusion model [41,42,43] from the industry-wide perspective. Innovation and imitation rates represent the number of construction companies that implement technological innovation through R&D and adopt from others annually, respectively. Additionally, based on the discussions with experts, we introduce an ‘Innovativeness attraction rate’ variable. In other words, a construction firm may be potentially capable of becoming innovative, however, a number of significant conditions influence its decision to consider higher investments in cutting-edge ideas. Hence, potential innovative companies should be willing to innovate before becoming actual innovative companies.
Innovativeness attraction rate (Equation (1)) is influenced by a number of factors aggregated into an ‘Attractiveness of being innovative’ term defined in collaboration with the stakeholders.
where represents the innovativeness attraction rate; is potential innovative companies; represents the attractiveness of being innovative; and is time for industry to adjust to attractiveness factors.
‘Attractiveness of innovation’ is an index, which takes normalized values between 0 and 1 and refers to how strong is a company’s desire to implement innovations based on the following important factors:
- business performance of construction companies is a function of a company’s profitability and client satisfaction as ones of the most essential industry motivation points;
- level of government support refers to a state of public support and public policies (e.g., federal targeted programmes and direct financial investments); and
- level of administrative barriers to innovation represents barriers related to the conservative building codes and standards, technical regulation, to name a few.
All of the influential variables have values of 0 to 1 (0 to 100%, alternatively). The normalization procedure is based on the literature [3,5,8,14,44], government reports [10,38] and stakeholder workshops. Table 4 shows categories of the three variables-indicators. A comprehensive explanation of every category is given in SM-4.
Given the highly qualitative nature of the key variables, the relationships between them need to be quantified. In the modelling process, the specified non-linear relationships are used as lookup functions. In order to identify the influence of each of the mentioned factors on the attractiveness level, experts were asked to create a graphic description of the relationship between the variables [27,45]. Figure 14a–c illustrate distinguished non-linear relationships between change in the ‘Level of administrative barriers to innovation,’ ‘Level of government support’ and ‘Business performance of construction companies’ and the change in ‘Attractiveness of innovation,’ respectively.
Figure 14a implies that the higher the ‘Level of administrative barriers to innovation,’ the less desirable innovations are seemed to be for companies. It is simply because the time and investments needed to overcome these impediments sometimes are not worth it. Subsequently, lower levels of barriers contribute positively to the innovation process. This relation is consistent with literature [2,3]. The graph represents an exponential decay behaviour created by a reinforcing loop. The relationship between attractiveness and government support is defined by a goal seeking behaviour arising from a balancing loop (Figure 14b). The more government provides incentives for construction organisations the more they tend to be involved in the innovation process. However, as discussed with the experts, government funding is constrained and incentives will not go forever. Moreover, at some participants pointed out, companies have to be able to invest in know-how themselves. Finally, the relationship between attractiveness and business performance of companies that implemented innovation is graphically presented as an S-shaped growth (Figure 14c). In other words, the growth of the attractiveness level rises rapidly after an initial slow growth but then gradually slows until the state of the system reaches 1.
Attractiveness of innovation is an index that aggregates three functions mentioned above. However, the roles of the impacting elements are not equal. The weight of each variable affecting attractiveness of innovation was calculated based on the previously conducted structural analysis with MICMAC (Table 5).
Hence, the equation for the ‘Attractiveness of innovation’ is the following:
where is attractiveness of innovation index; represents the level of attractiveness of innovation as a function of the level of administrative barriers to innovation; is the level of attractiveness of innovation as a function of the level of government support; represents the level of attractiveness of innovation as a function of the industry business performance.
It is important to understand that any action taken by the government, industrialists or research institutes do not have immediate consequences. Thus, according to the government reports [10,38] and expert judgment, it takes approximately 2 years for construction companies to consider implementing innovative solutions as a result of active government involvement in the innovation process, high business performance and reduced administrative and regulatory burden.
A comprehensive explanation of the SD model, including definitions, units, equations, assumptions and sources of data is given in SM-4.
4.5. Stage 4: Model Analysis
Once the SD model was developed, it needs to be tested. There are a variety of tests to improve simulation models [1,12]. We first verified dimensional consistency of the model in order to test its structural validity. Then a number of validation tests were conducted to check whether the model behaves realistically under extreme conditions. For instance, we checked that if the level of administrative barriers to innovation was insurmountable, the level of government support was insufficient and the business performance of construction companies implementing innovation was poor, then the attractiveness of innovation stays stable and maintains its initial value. As a result, the number of innovative companies practically does not change as there is no motivation for them to be involved in the innovation process. A conducted sensitivity analysis confirmed that the model functions are sensitive to the parameters of the model as would be expected in real life.
The simulation horizon was set to as twenty years to be able to explore the behaviour in the level of innovation change up to 2035 and compare the results with the government forecasts [10,38]. The ability of the SD model to reproduce the behaviour that is observed in the real-world, constitutes another validation test known as a behaviour reproduction test. The test showed that the model can produce behaviour patterns similar to the government forecast once the initial values are met correctly. The government forecast has been discussed in SM-2 and the simulation results are shown in Figure 15.
Table 6 shows a comparison of the model output and the forecast in the period between 2015 and 2030. In the set of simulations, a pessimistic (baseline) scenario and an optimistic scenario are equivalents of the government predictions in the development strategies of 2017 and 2015, respectively (Table 6).
On one hand, the baseline scenario was close to the readjusted targets provided in the 2017 government predictions, that is, the proportion of construction companies implementing technological innovation (i.e., 6.8% versus 7%). On the other hand, the SD model indicates that the initial ambitious plan of the government in 2015 was practically not achievable, that is, predicted 18% versus simulated 12.7%. It does not mean that such results cannot happen in the foreseen future, however, a reconstruction of the construction innovation system in Russia needs to be done in order to achieve this optimistic level of innovation.
Table 7 shows different settings for the model variables. It is worth noting that within the optimistic scenario, values for the level of business performance and government support are high accompanied by an acceptable level of administrative barriers. The rate of companies involved in R&D and adopting innovative solutions from competitors also increase the number of innovative companies. Nevertheless, as mentioned previously, only large and medium-sized construction firms have a potential capability to implement innovative solutions. The proportion of such companies is around 15% in the base year. Hence, another thing to consider while investigating potential pathways to rational decision-making along with innovation planning strategies is to support the increase of the market size.
The model’s purpose is to serve as a virtual environment where various assumptions can be tested and explored to evaluate future scenarios. The model relatively closely matched the government’s more recent forecasts and tended to reproduce the main pattern of the predictions. Therefore, it can be considered to produce plausible dynamics for the system being studied. Moreover, the model development process was based on expert stakeholder input. The developed SD model was deemed to be sufficiently robust for stage 5 of the IPSM approach (i.e., scenario analysis and recommendations).
4.6. Stage 5: Model Use and Recommendations
For the purposes of scenario and policy analysis followed by a further model implementation, a set of simulations is required to get insights about the effects of selected strategies on future performance of the construction industry. Generally speaking, scenarios help to outline how behaviour of the system may change based on different sets of assumptions. Considering the dynamic multi-actor nature of the innovation system in the Russian construction sector, scenario analysis was chosen to be based on the transition scenarios that are meant to outline qualitatively different directions of how the construction innovation system might evolve in the future, based on different sets of assumptions [32,46,47]. Potential levers, policies and a range of plausible futures that incorporate various strategies were discussed with stakeholders and, as a result, four dynamic transitional pathways were presented for analysis.
With respect to innovation diffusion process, the uncertainty is seen in how the construction industry development is going to be achieved: by creating conditions for efficient domestic R&D; improving regulation; and supporting collaboration within the innovation system. These core ‘futures’ of the industry translated into the four transition scenarios illustrated in Figure 16. Utilisation of the developed SD model, through employing the innovative IPSM approach, for these four innovation ‘futures’ scenarios is outside the scope of the current paper and will be presented in future work.
5. Conclusions and Future Research Directions
Any problem can be presented as a system of interrelated factors while a model is a representation of a certain system. The purpose of the model is to deal with a specific problem by creating a simplified representation of reality rather than reflecting the system in detail [12]. This paper presents the formulation of a novel IPSM approach and demonstrates its application for building an SD model for innovation in the Russian Federation construction industry.
The proposed methodology is different from all the other participatory modelling approaches as it provides a flexible way of data collection grounded in empirical structural analysis followed by a series of well-formalised workshops. The IPSM approach is capable of bringing together and involving stakeholders at all levels of participation, providing understanding of a structure of the system and behaviour resulting from the relationships between essential variables; and not only conceptualising the existing system but can also highlighting the potential effects of alternative scenarios over time. Moreover, it assists a researcher with moving between qualitative and quantitative data analysis techniques allowing the use of soft data in SD model building.
The application of the IPSM has some advantages with compared to other participatory approaches as summarised in Table 1. These advantages include moderate time taken for a model development; moderate cost of a model development approach; high social learning among stakeholders participating in the modelling process; ability to incorporate different stakeholders’ opinion separately; degree of consensus reached during the modelling process; number of participants for a model development; and ability to deal with complex problems. A critical comparison of various participatory modelling approaches is provided in Section 2 of the paper, which reviews the methods strengths and weaknesses accompanied by differences in the modelling process according to the selected parameters. Based on the conducted review, it can be concluded that all approaches have not only common similarities but also a number of shortcomings to consider. IPSM approach takes into account advantages and disadvantages of existing participatory modelling approaches and, hence, may be considered to be an efficient participatory modelling procedure for building SD models in cases with similar problems to solve as well as where uncertainty in scientific knowledge and the lack of empirical data availability are the dominants.
The structure of the introduced approach and the objectives of integration were successfully exemplified by the case study of the innovation diffusion process in the Russian Federation construction industry. The methodology was found useful in getting various stakeholders with diverse backgrounds to participate and bringing together their knowledge and views. This is particularly important when limited budget to conduct the study takes place accompanied by geographical distribution of stakeholders. The conceptual and SD models co-developed with stakeholders were able not only to capture the interdisciplinary with interrelated technical, economic and regulatory components but also to identify and evaluate key variables, alternative management options and the strength of relationships between variables. Moreover, one of the greatest advantages of IPSM approach over other participatory modelling approaches to develop SD models and support decision-making is that its flexible and easily enough to be understood and communicated and is most suited to modelling contexts where high levels of cooperation exist between diverse actors that make up the system.
Based on the outcomes of the derived SD model using the IPSM approach, it can be concluded that support of research organisations and R&D is one of the most important conditions for the development of innovation potential in promoting new construction products and services. Specifically, it is essential for sufficient incentive mechanisms, such as government grants and subsidies that promote long-term collaboration between construction companies and research institutions. Moreover, the SD model identified streamlined administrative requirements and greater opportunities for designers to satisfy technical regulations and standards using innovative products and construction techniques as being key enablers for generating innovation in the Russian construction industry.
The model revealed two core linked dynamic hypotheses describing the problem under investigation. The first dynamic hypothesis centres on how the industry, academia and the government can collaborate in order to support domestic R&D and accumulate innovation capabilities in the whole construction innovation system. The second hypothesis represents the cooperative activities of the industry, academia and the government aiming to most effectively diffuse a stock of already known innovations throughout the industry. Given the current situational context of the Russian Federation, participants indicated that it is the government’s mission to encourage national industry and research institutions to collaborate together to foster greater rates of innovation, with a reduced reliance on imports and international technology transfer.
The reported findings should be interpreted in light of a couple of primary research limitations. First of all, it is not possible to objectively validate the developed SD model, as there are no proofs for absolute correctness of the SD model for this complex socio-technical problem. Nevertheless, the IPSM approach incorporates stakeholder input at most stages of the SD model development process. Secondly, the closed nature of the Russian construction industry meant that it was sometimes challenging to efficiently solicit responses from industry professionals and government officers. Nonetheless, as shown in the stakeholder engagement plan (Table 2) the authors managed to obtain required expert opinion through a combination of group workshops and one-on-one consultations. Lastly, this research was conducted in the context of the Russia’s construction management and innovation policies, with stakeholders representing industrialists, academics and public servants based in Russia. However, many of the relationships between the actors within innovation systems are universal and the challenges arising from investigating these relationships are common in many industries and countries. Hence, the IPSM approach can be implemented by decision makers, practitioners and researchers in an international context, taking differences in regulations and market structures into account.
Further research is focused on using the herein developed SD model for identifying the potential pathways to rational decision-making along with associated policy and practice recommendations that aim to improve construction innovation performance in the Russian Federation. SD modelling will be conducted considering the various country and industry macro context transition scenarios that could arise. Regardless of the macro environment, all plausible scenarios and levers considered in the SD model must have a strong focus on the role of government policy in supporting innovation.
Supplementary Materials
The following are available online at https://www.mdpi.com/2079-8954/6/3/33/s1, SM-1. Stakeholder profile; SM-2. Background of the case study; SM-3. Summary of feedback loops within the extended causal loop diagram; SM-4. Summary of variables within the stock and flow diagram of innovation diffusion in the construction industry.
Author Contributions
E.S. performed the review of the pertinent literature, collected and analysed the data, built the model and drafted the paper. O.S., R.A.S. and K.P. revised the manuscript. Y.S. assisted with organising stakeholder workshops and consulted the researchers throughout the modelling process.
Funding
This research received no external funding.
Acknowledgments
The authors acknowledge Griffith University for granting the Griffith University Postgraduate Research Scholarship (GUPRS) to Emiliya Suprun. The authors also would like to thank survey respondents, participants of the stakeholder workshops and individuals that consulted the researchers throughout the modelling process. This research would not have been possible without their valuable insights and contribution.
Conflicts of Interest
The authors declare no conflict of interest.
References
- Maani, K.E.; Cavana, R.Y. Systems Thinking, System Dynamics: Managing Change and Complexity; Prentice Hall: Auckland, New Zealand, 2007. [Google Scholar]
- Dansoh, A.; Oteng, D.; Frimpong, S. Innovation development and adoption in small construction firms in ghana. Constr. Innov. 2017, 17, 511–535. [Google Scholar] [CrossRef]
- HSE. Innovative Construction Materials and Technologies: Their Influence on the Development of Urban Planning and Urban Environment; National Research University Higher School of Economics: Moscow, Russia, 2013. [Google Scholar]
- Miozzo, M.; Dewick, P. Building competitive advantage: Innovation and corporate governance in european construction. Res. Policy 2002, 31, 989–1008. [Google Scholar] [CrossRef]
- Ozorhon, B.; Oral, K. Drivers of innovation in construction projects. J. Constr. Eng. Manag. 2017, 143, 04016118. [Google Scholar] [CrossRef]
- Kim, H.; Park, Y. Structural effects of r&d collaboration network on knowledge diffusion performance. Expert Syst. Appl. 2009, 36, 8986–8992. [Google Scholar]
- Malerba, F. Sectoral systems of innovation and production. Res. Policy 2002, 31, 247–264. [Google Scholar] [CrossRef] [Green Version]
- Suprun, E.; Sahin, O.; Stewart, R.; Panuwatwanich, K. Model of the Russian Federation construction innovation system: An integrated participatory systems approach. Systems 2016, 4, 29. [Google Scholar] [CrossRef]
- TASS. Sanctions as a Way to Support Domestic Producers. Available online: http://itar-tass.com/ekonomika/1379999 (accessed on 1 April 2018).
- RSCI. Updated Innovative Development Strategy for the Construction Industry in Russia for the Period Up to 2030; Ministry of Construction, Housing and Utilities of the Russian Federation: Moscow, Russia, 2017.
- Forrester, J.W. Industrial Dynamics; Massachusetts Institute of Technology Press: Cambridge, MA, USA, 1961. [Google Scholar]
- Sterman, J. Business Dynamics: Systems Thinking and Modeling for a Complex World; McGraw-Hill Education: Boston, MA, USA, 2000. [Google Scholar]
- Eker, S.; Zimmermann, N.; Carnohan, S.; Davies, M. Participatory system dynamics modelling for housing, energy and wellbeing interactions. Build. Res. Inf. 2017, 1–17. [Google Scholar] [CrossRef]
- Suprun, E.V.; Stewart, R.A. Construction innovation diffusion in the russian federation. Constr. Innov. 2015, 15, 278–312. [Google Scholar] [CrossRef]
- Voinov, A.A. Systems Science and Modeling for Ecological Economics; Elsevier Science: Amsterdam, The Netherlands, 2010. [Google Scholar]
- Andersen, D.F.; Vennix, J.A.M.; Richardson, G.P.; Rouwette, E.A.J.A. Group model building: Problem structing, policy simulation and decision support. J. Oper. Res. Soc. 2007, 58, 691–694. [Google Scholar] [CrossRef]
- Scott, R.J.; Cavana, R.Y.; Cameron, D. Recent evidence on the effectiveness of group model building. Eur. J. Oper. Res. 2016, 249, 908–918. [Google Scholar] [CrossRef] [Green Version]
- Vennix, J. Group Model Building: Facilitating Team Learning Using System Dynamics; Wiley: Chichester, UK, 1996. [Google Scholar]
- Antunes, P.; Santos, R.; Videira, N. Participatory decision making for sustainable development—The use of mediated modelling techniques. Land Use Policy 2006, 23, 44–52. [Google Scholar] [CrossRef]
- Van den Belt, M. Mediated Modeling: A System Dynamics Approach to Environmental Consensus Buildin; Island Press: Washington, DC, USA, 2004. [Google Scholar]
- Strauss, A.; Corbin, J. Basics of Qualitative Research: Techniques and Procedures for Developing Grounded Theory; Sage Publications: Thousand Oaks, CA, USA, 1998. [Google Scholar]
- Yearworth, M.; White, L. The uses of qualitative data in multimethodology: Developing causal loop diagrams during the coding process. Eur. J. Oper. Res. 2013, 231, 151–161. [Google Scholar] [CrossRef] [Green Version]
- Chen, H.; Wakeland, W.; Yu, J. A two-stage technology foresight model with system dynamics simulation and its application in the chinese ict industry. Technol. Forecast. Soc. 2012, 79, 1254–1267. [Google Scholar] [CrossRef]
- MICMAC. Structural Analysis. Available online: http://en.laprospective.fr/methods-of-prospective/softwares/59-micmac.html (accessed on 1 April 2018).
- Grösser, S.N. Complexity management and system dynamics thinking. In Dynamics of Long-Life Assets: From Technology Adaptation to Upgrading the Business Model; Grösser, S.N., Reyes-Lecuona, A., Granholm, G., Eds.; Springer International Publishing: Cham, Switzerland, 2017; pp. 69–92. [Google Scholar]
- Ruutu, S.; Casey, T.; Kotovirta, V. Development and competition of digital service platforms: A system dynamics approach. Technol. Forecast. Soc. 2017, 117, 119–130. [Google Scholar] [CrossRef]
- Hovmand, P. Community Based System Dynamics; Springer: New York, NY, USA, 2014. [Google Scholar]
- Godet, M. Creating Futures: Scenario Planning as a Strategic Management Tool; Économica: London, UK, 2006. [Google Scholar]
- Onyango, E.A.; Sahin, O.; Awiti, A.; Chu, C.; Mackey, B. An integrated risk and vulnerability assessment framework for climate change and malaria transmission in east Africa. Malar. J. 2016, 15, 551. [Google Scholar] [CrossRef] [PubMed]
- Senge, P.M. The Fifth Discipline: The Art and Practice of the Learning Organization, 2nd ed.; Random House Business: New York, NY, USA, 2006. [Google Scholar]
- Uriona, M.; Pietrobon, R.; Varvakis, G.; Carvalho, E. A preliminary model of innovation systems. In Proceedings of the 30th International Conference of the System Dynamics Society, St. Gallen, Switzerland, 22–26 July 2012. [Google Scholar]
- Walrave, B.; Raven, R. Modelling the dynamics of technological innovation systems. Res. Policy 2016, 45, 1833–1844. [Google Scholar] [CrossRef]
- Vensim DSS. Simulation Software. Available online: http://vensim.com/download/ (accessed on 1 April 2018).
- Forrester, J.W.; Senge, P.M. Tests for building confidence in system dynamics models. TIMS Stud. Manag. Sci. 1980, 14, 209–228. [Google Scholar]
- Sahin, O.; Bertone, E.; Beal, C.; Stewart, R.A. Evaluating a novel tiered scarcity adjusted water budget and pricing structure using a holistic systems modelling approach. J.Environ. Manag. 2018, 215, 79–90. [Google Scholar] [CrossRef] [PubMed]
- Kubiszewski, I.; Costanza, R.; Anderson, S.; Sutton, P. The future value of ecosystem services: Global scenarios and national implications. Ecosyst. Serv. 2017, 26, 289–301. [Google Scholar] [CrossRef]
- Markard, J.; Raven, R.; Truffer, B. Sustainability transitions: An emerging field of research and its prospects. Res. Policy 2012, 41, 955–967. [Google Scholar] [CrossRef]
- RSCI. Innovative Development Strategy for the Construction Industry in Russia for the Period Up to 2030; Ministry of Construction, Housing and Utilities of the Russian Federation: Moscow, Russia, 2015.
- FSSS. Russian Federation Federal State Statistics Service. Available online: www.gks.ru/ (accessed on 1 April 2018).
- Gorodnikova, N.; Gokhberg, L.; Ditkovskiy, K. Indicators of Innovation in the Russian Federation: Data Book; National Research University Higher School of Economics: Moscow, Russia, 2017. [Google Scholar]
- Bass, F.M. A new product growth for model consumer durables. Manag. Sci. 1969, 15, 215–227. [Google Scholar] [CrossRef]
- Baur, L.; Uriona, M. Diffusion of photovoltaic technology in germany: A sustainable success or an illusion driven by guaranteed feed-in tariffs? Energy 2018, 150, 289–298. [Google Scholar] [CrossRef]
- Kunc, M. Simulating the evolution of industries using a dynamic behavioural model. In Proceedings of the 22nd International System Dynamics Conference, Oxford, UK, 25–29 July 2004. [Google Scholar]
- Eriksson, P.E.; Szentes, H. Managing the tensions between exploration and exploitation in large construction projects. Constr. Innov. 2017, 17, 492–510. [Google Scholar] [CrossRef]
- Ford, D.N.; Sterman, J.D. Expert knowledge elicitation to improve formal and mental models. Syst. Dyn. Rev. 1998, 14, 309–340. [Google Scholar] [CrossRef]
- Farla, J.; Markard, J.; Raven, R.; Coenen, L. Sustainability transitions in the making: A closer look at actors, strategies and resources. Technol. Forecast. Soc. 2012, 79, 991–998. [Google Scholar] [CrossRef]
- Geels, F.W. Ontologies, socio-technical transitions (to sustainability), and the multi-level perspective. Res. Policy 2010, 39, 495–510. [Google Scholar] [CrossRef]
Figure 1.
An integrated participatory system modelling process.

Figure 2.
Theoretical framework of the construction innovation system.

Figure 3.
Matrix of direct influence.

Figure 4.
Ranking of variables influence and dependency.

Figure 5.
Influence ranking of variables by different actors within the construction innovation system.
Figure 5.
Influence ranking of variables by different actors within the construction innovation system.

Figure 6.
Dependency ranking of variables by different actors within the construction innovation system.
Figure 6.
Dependency ranking of variables by different actors within the construction innovation system.

Figure 7.
Influence/dependence map for direct influences in the construction innovation system.

Figure 8.
Influence/dependence map for indirect influences in the construction innovation system.

Figure 9.
Conversion of the direct influence graph into a CLD.

Figure 10.
Development of an extended CLD.

Figure 11.
Number of large and medium-sized construction firms: Limits to growth archetype.

Figure 12.
Innovators vs. imitators: Shifting the burden archetype.

Figure 13.
Stock and flow diagram of innovation diffusion in the construction industry.

Figure 14.
Relationship between the level of attractiveness of innovation and (a) level of administrative barriers, (b) level of government support and (c) business performance of construction companies.
Figure 14.
Relationship between the level of attractiveness of innovation and (a) level of administrative barriers, (b) level of government support and (c) business performance of construction companies.

Figure 15.
SD model simulation results.

Figure 16.
Construction innovation ‘futures’ transition scenarios.


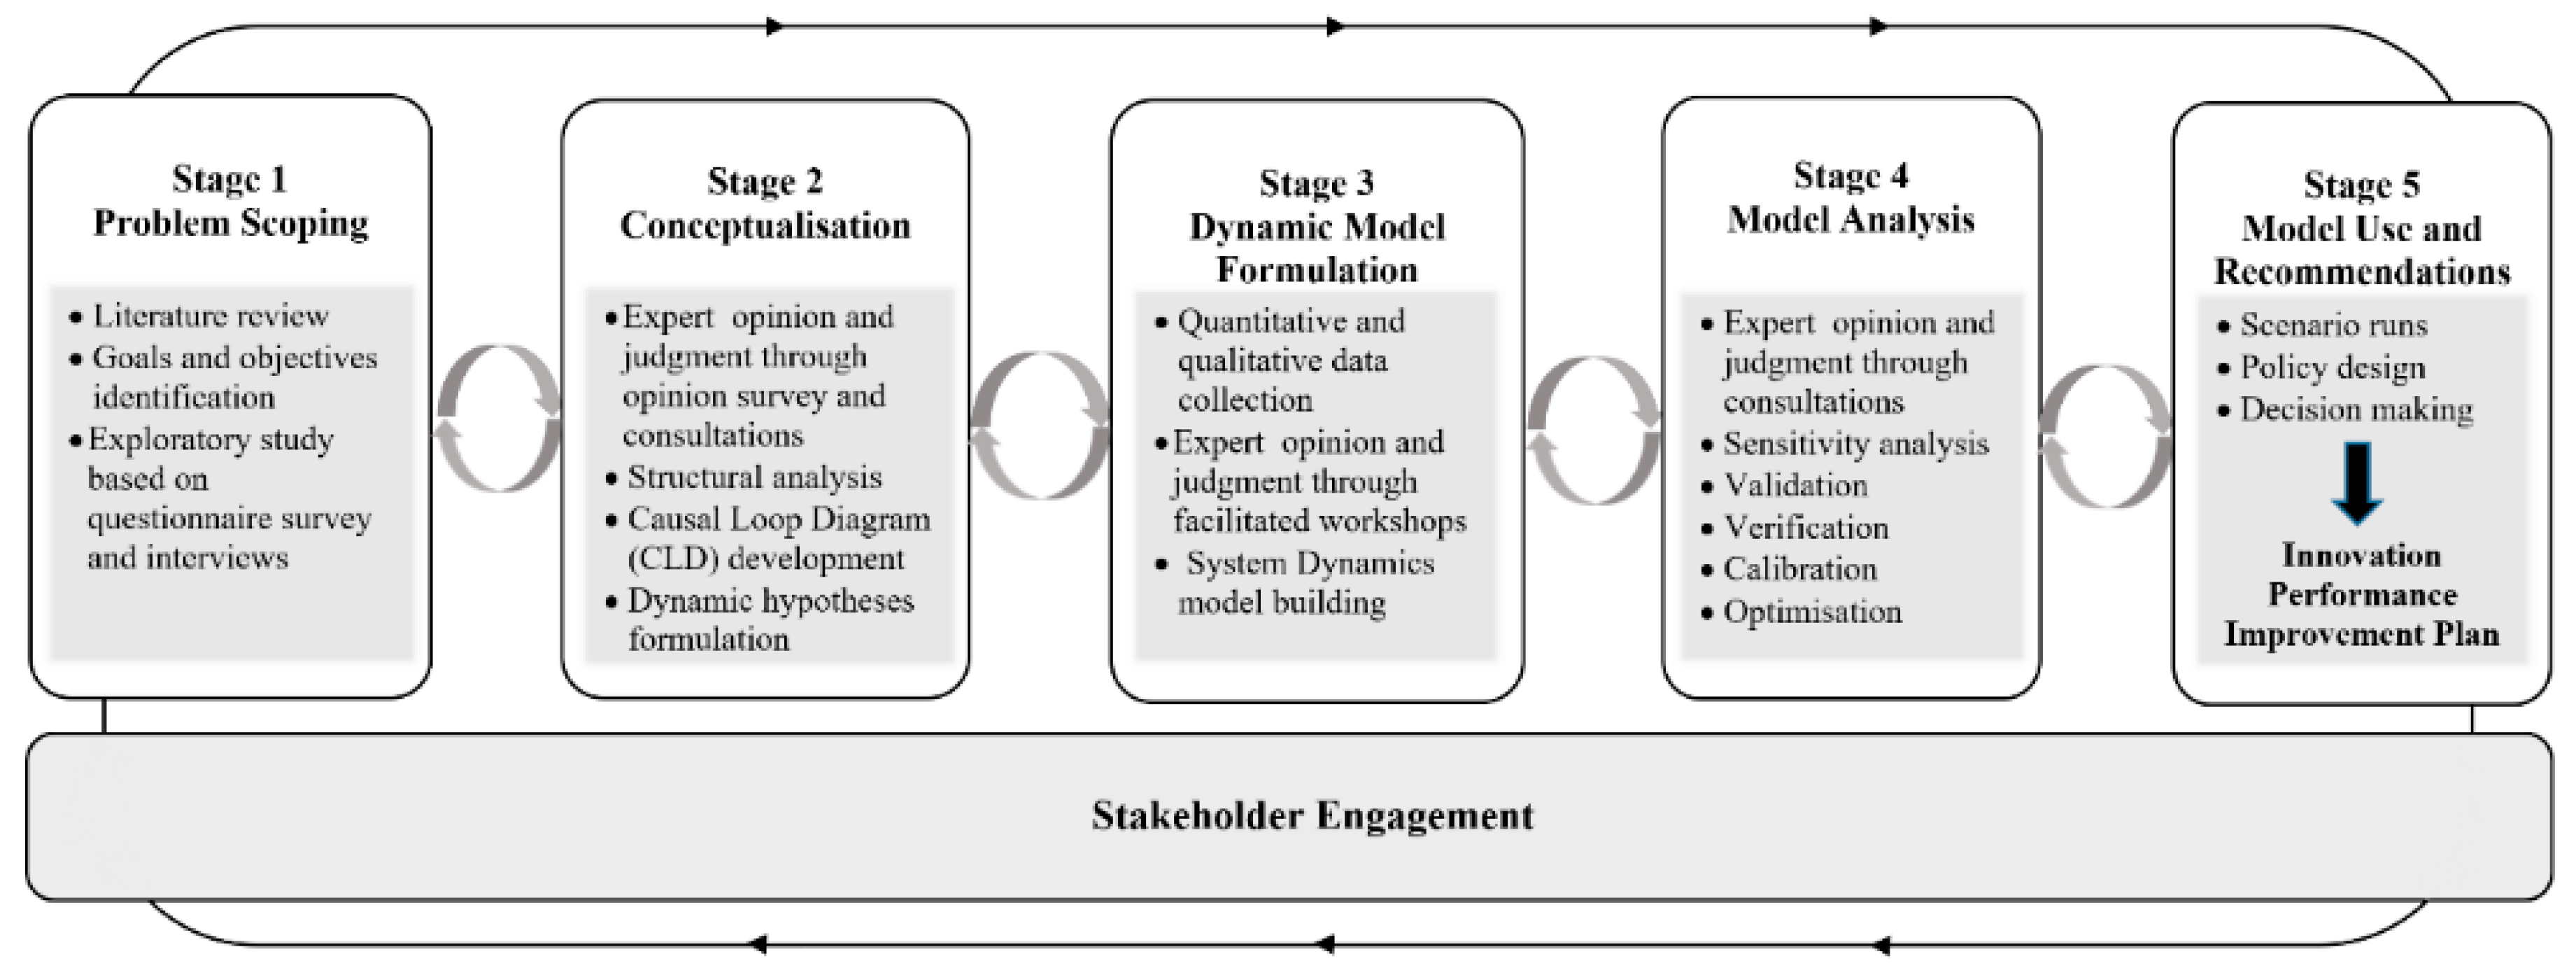
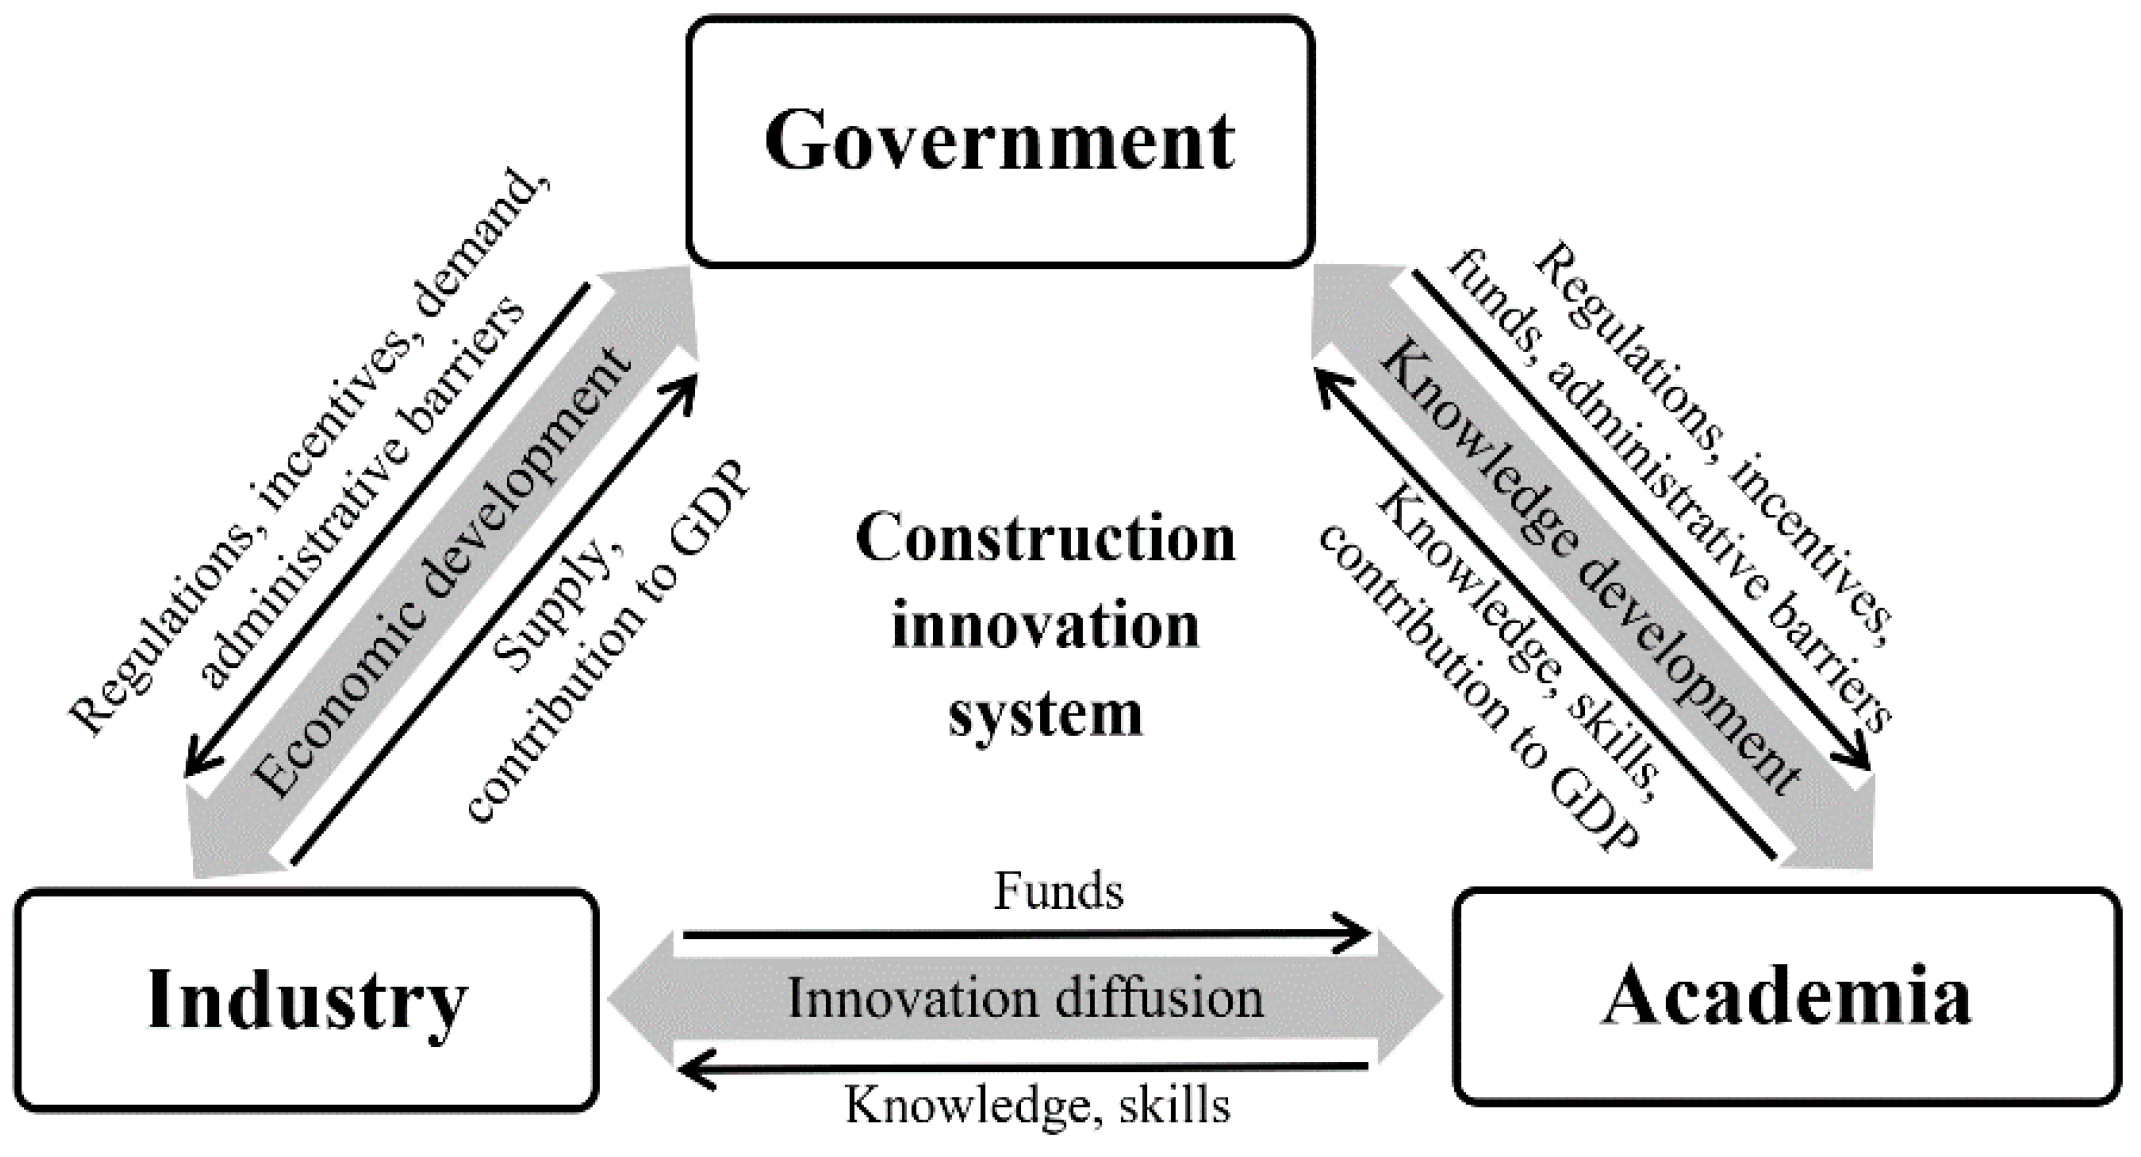
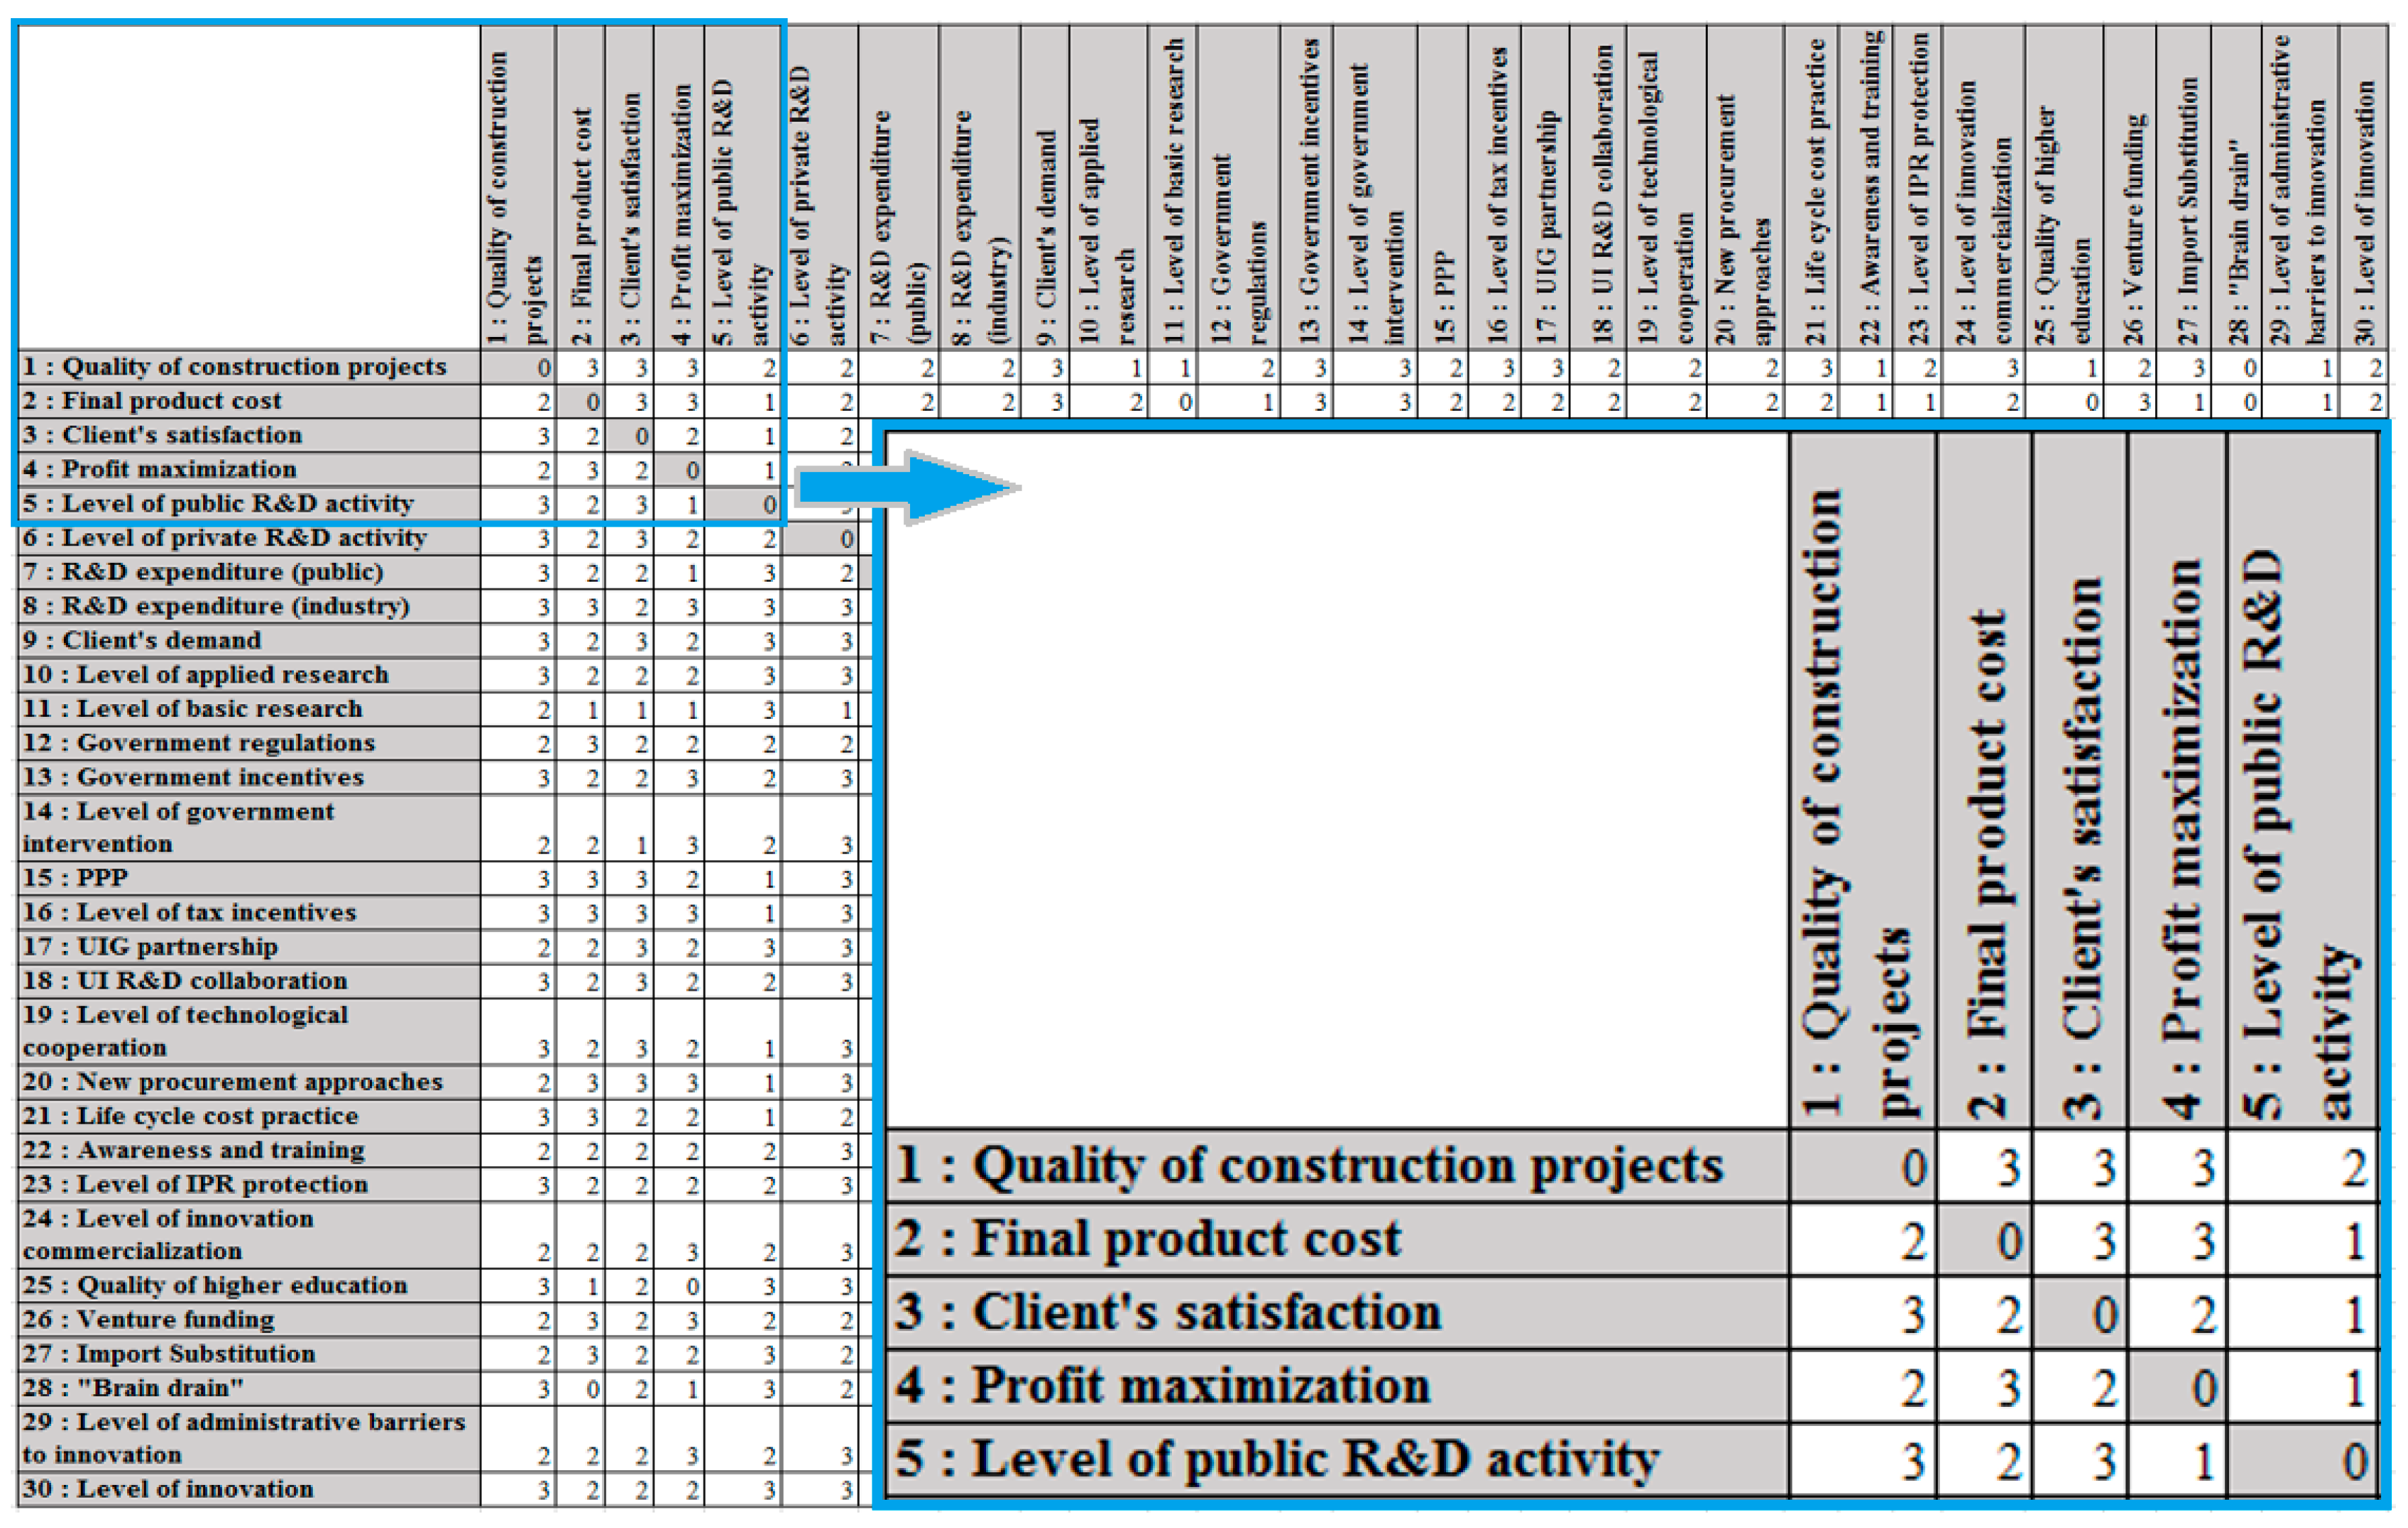
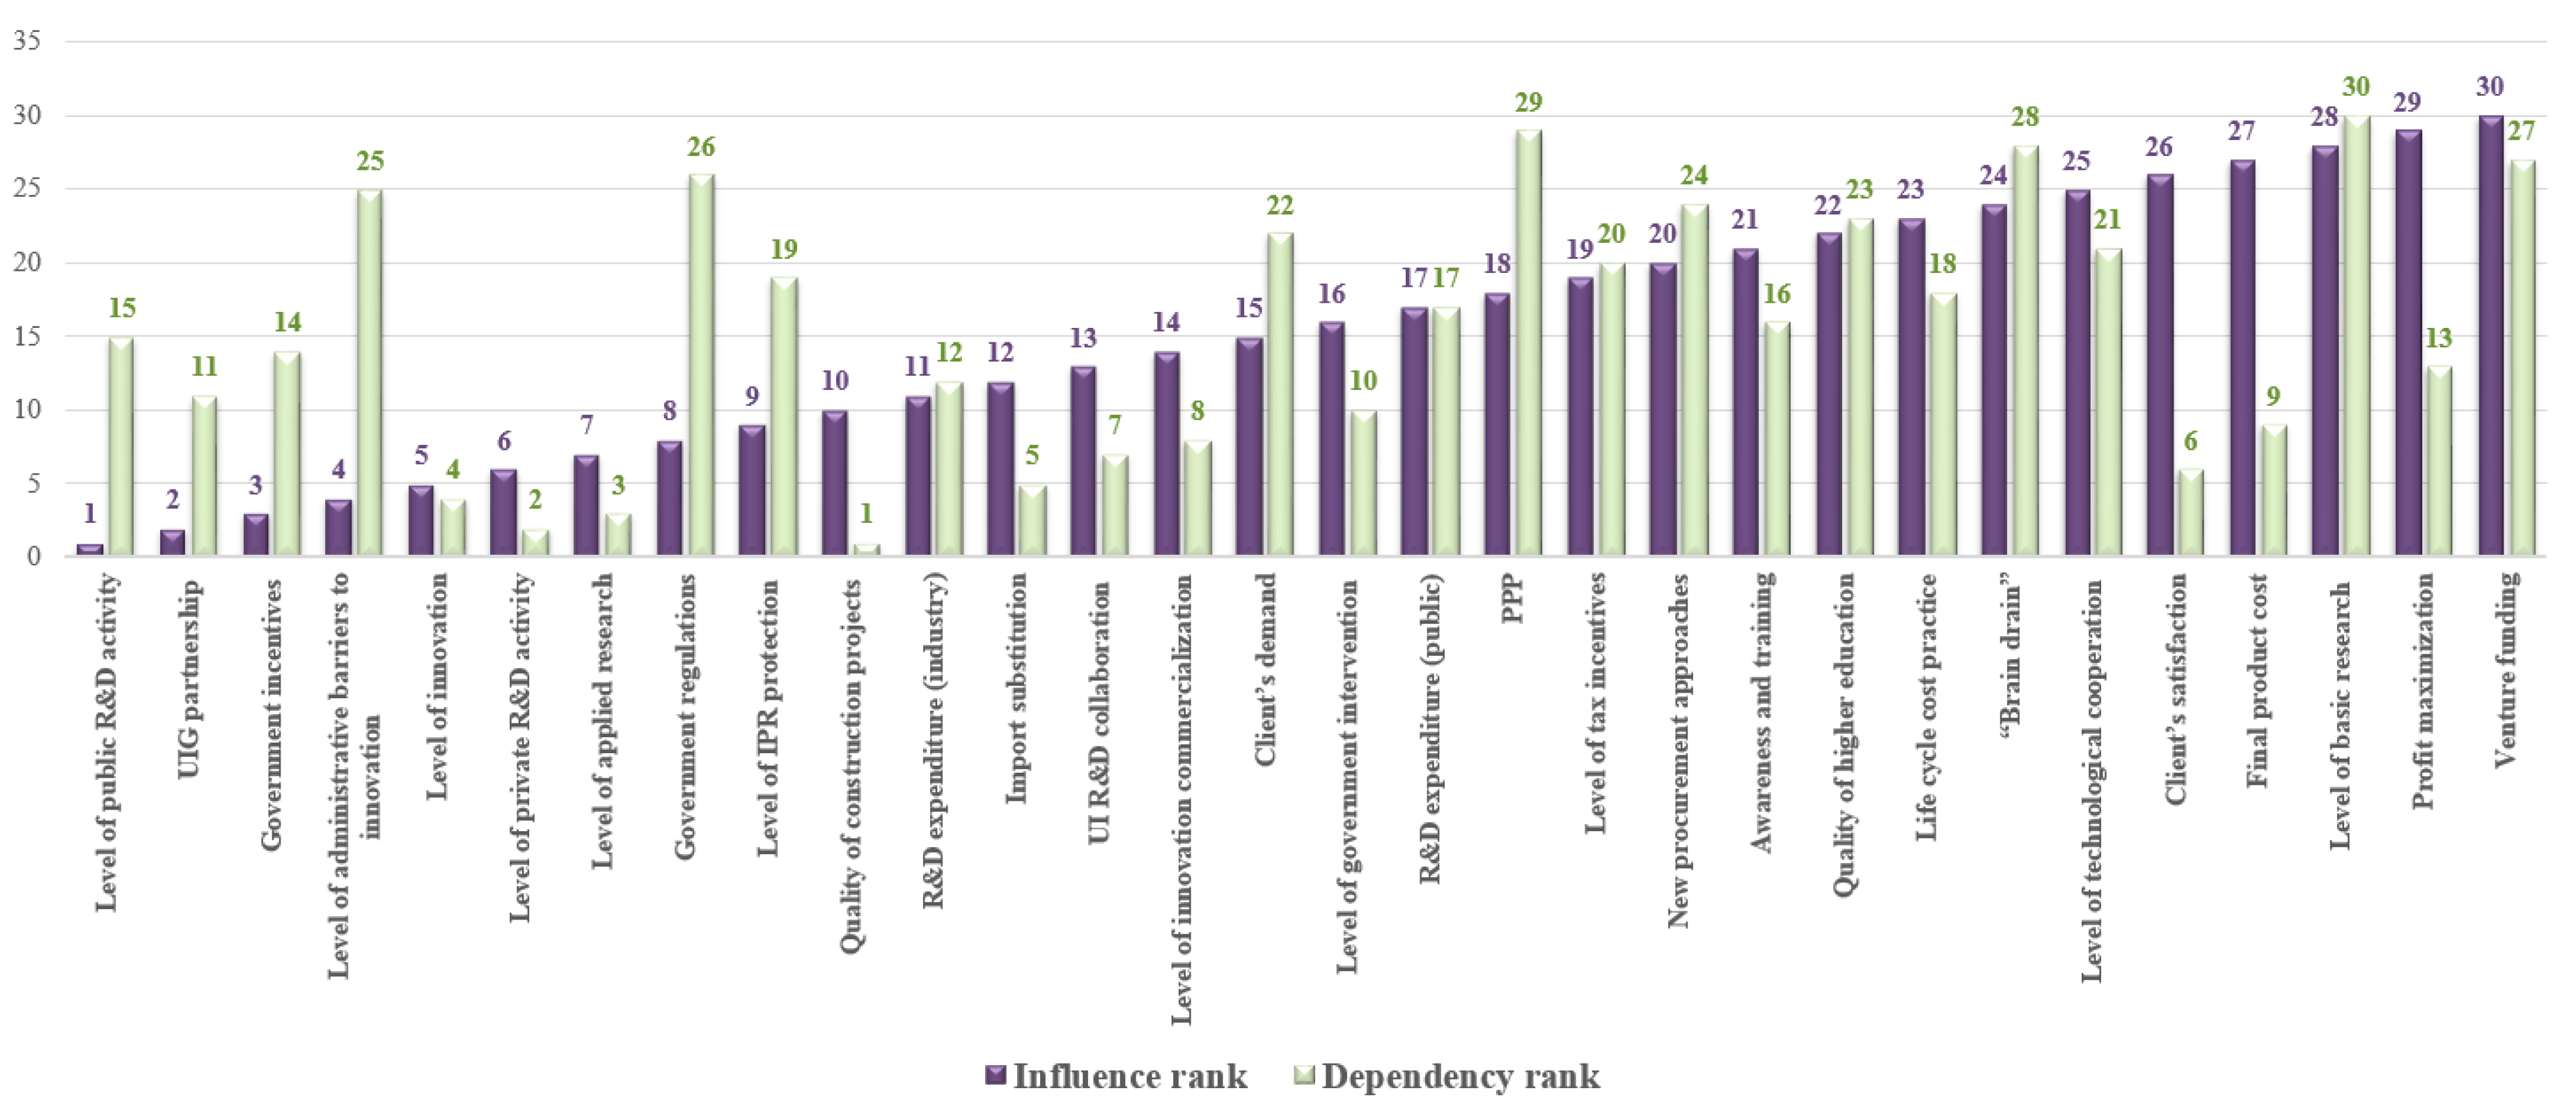
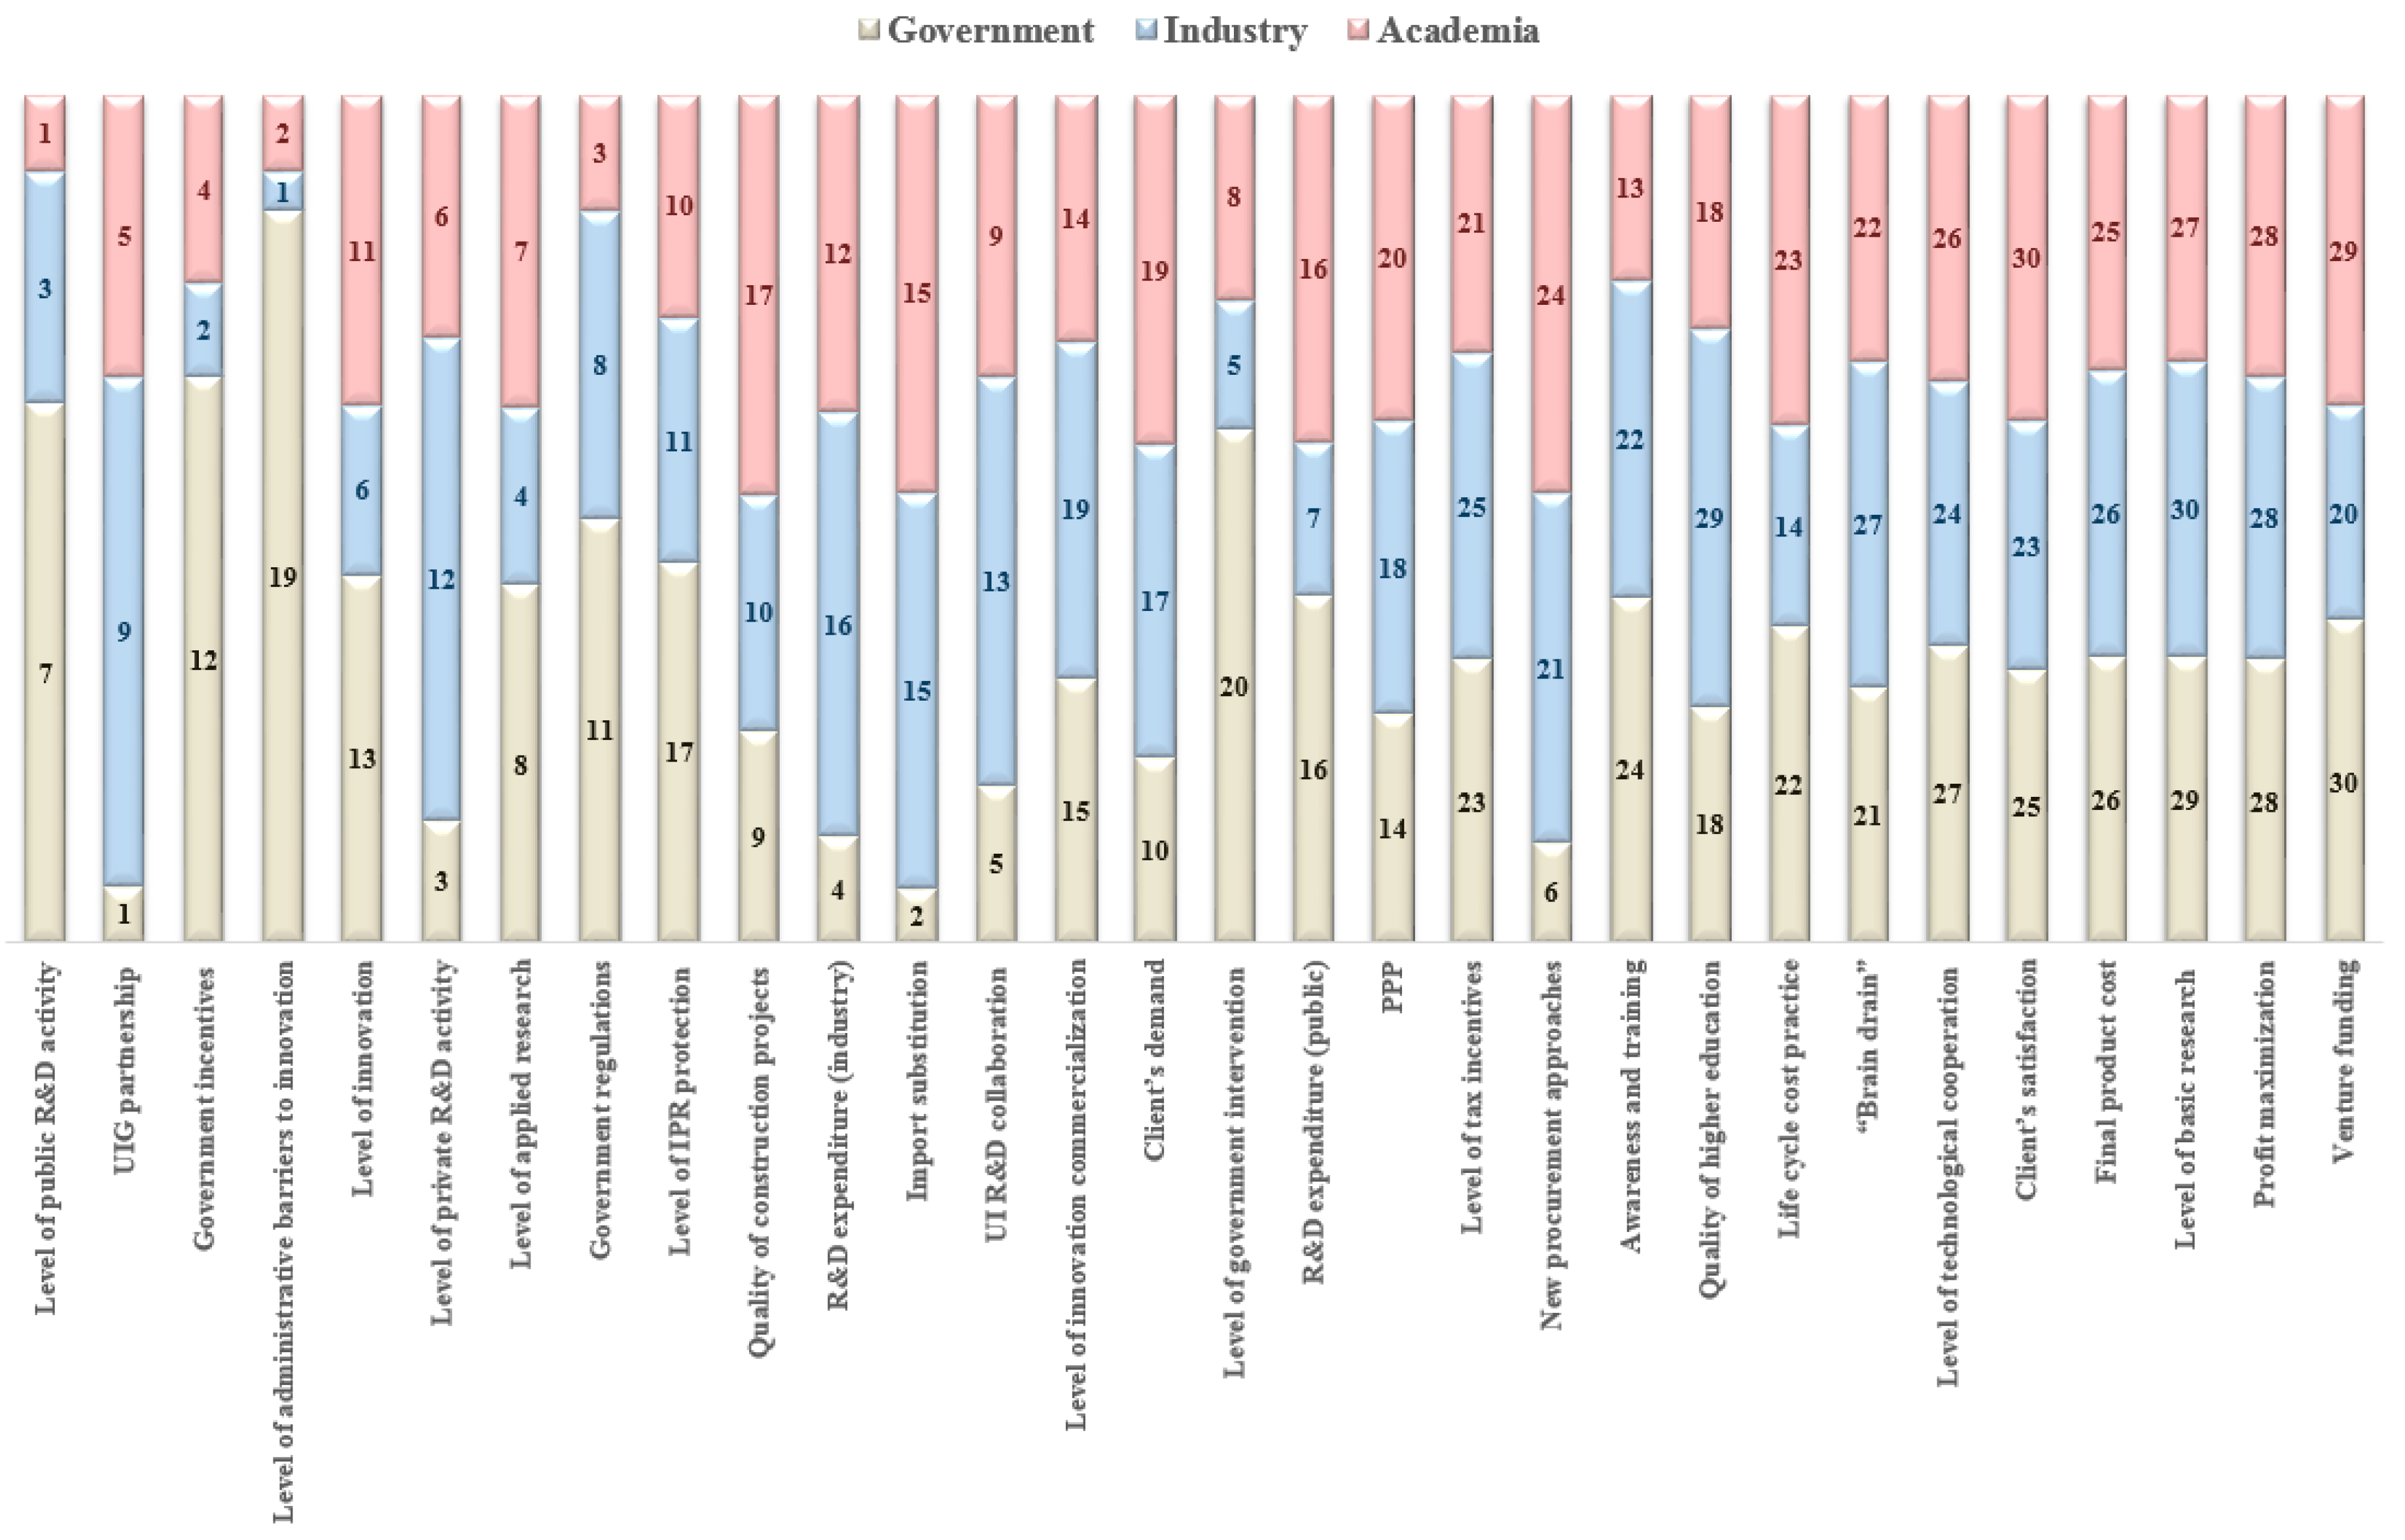
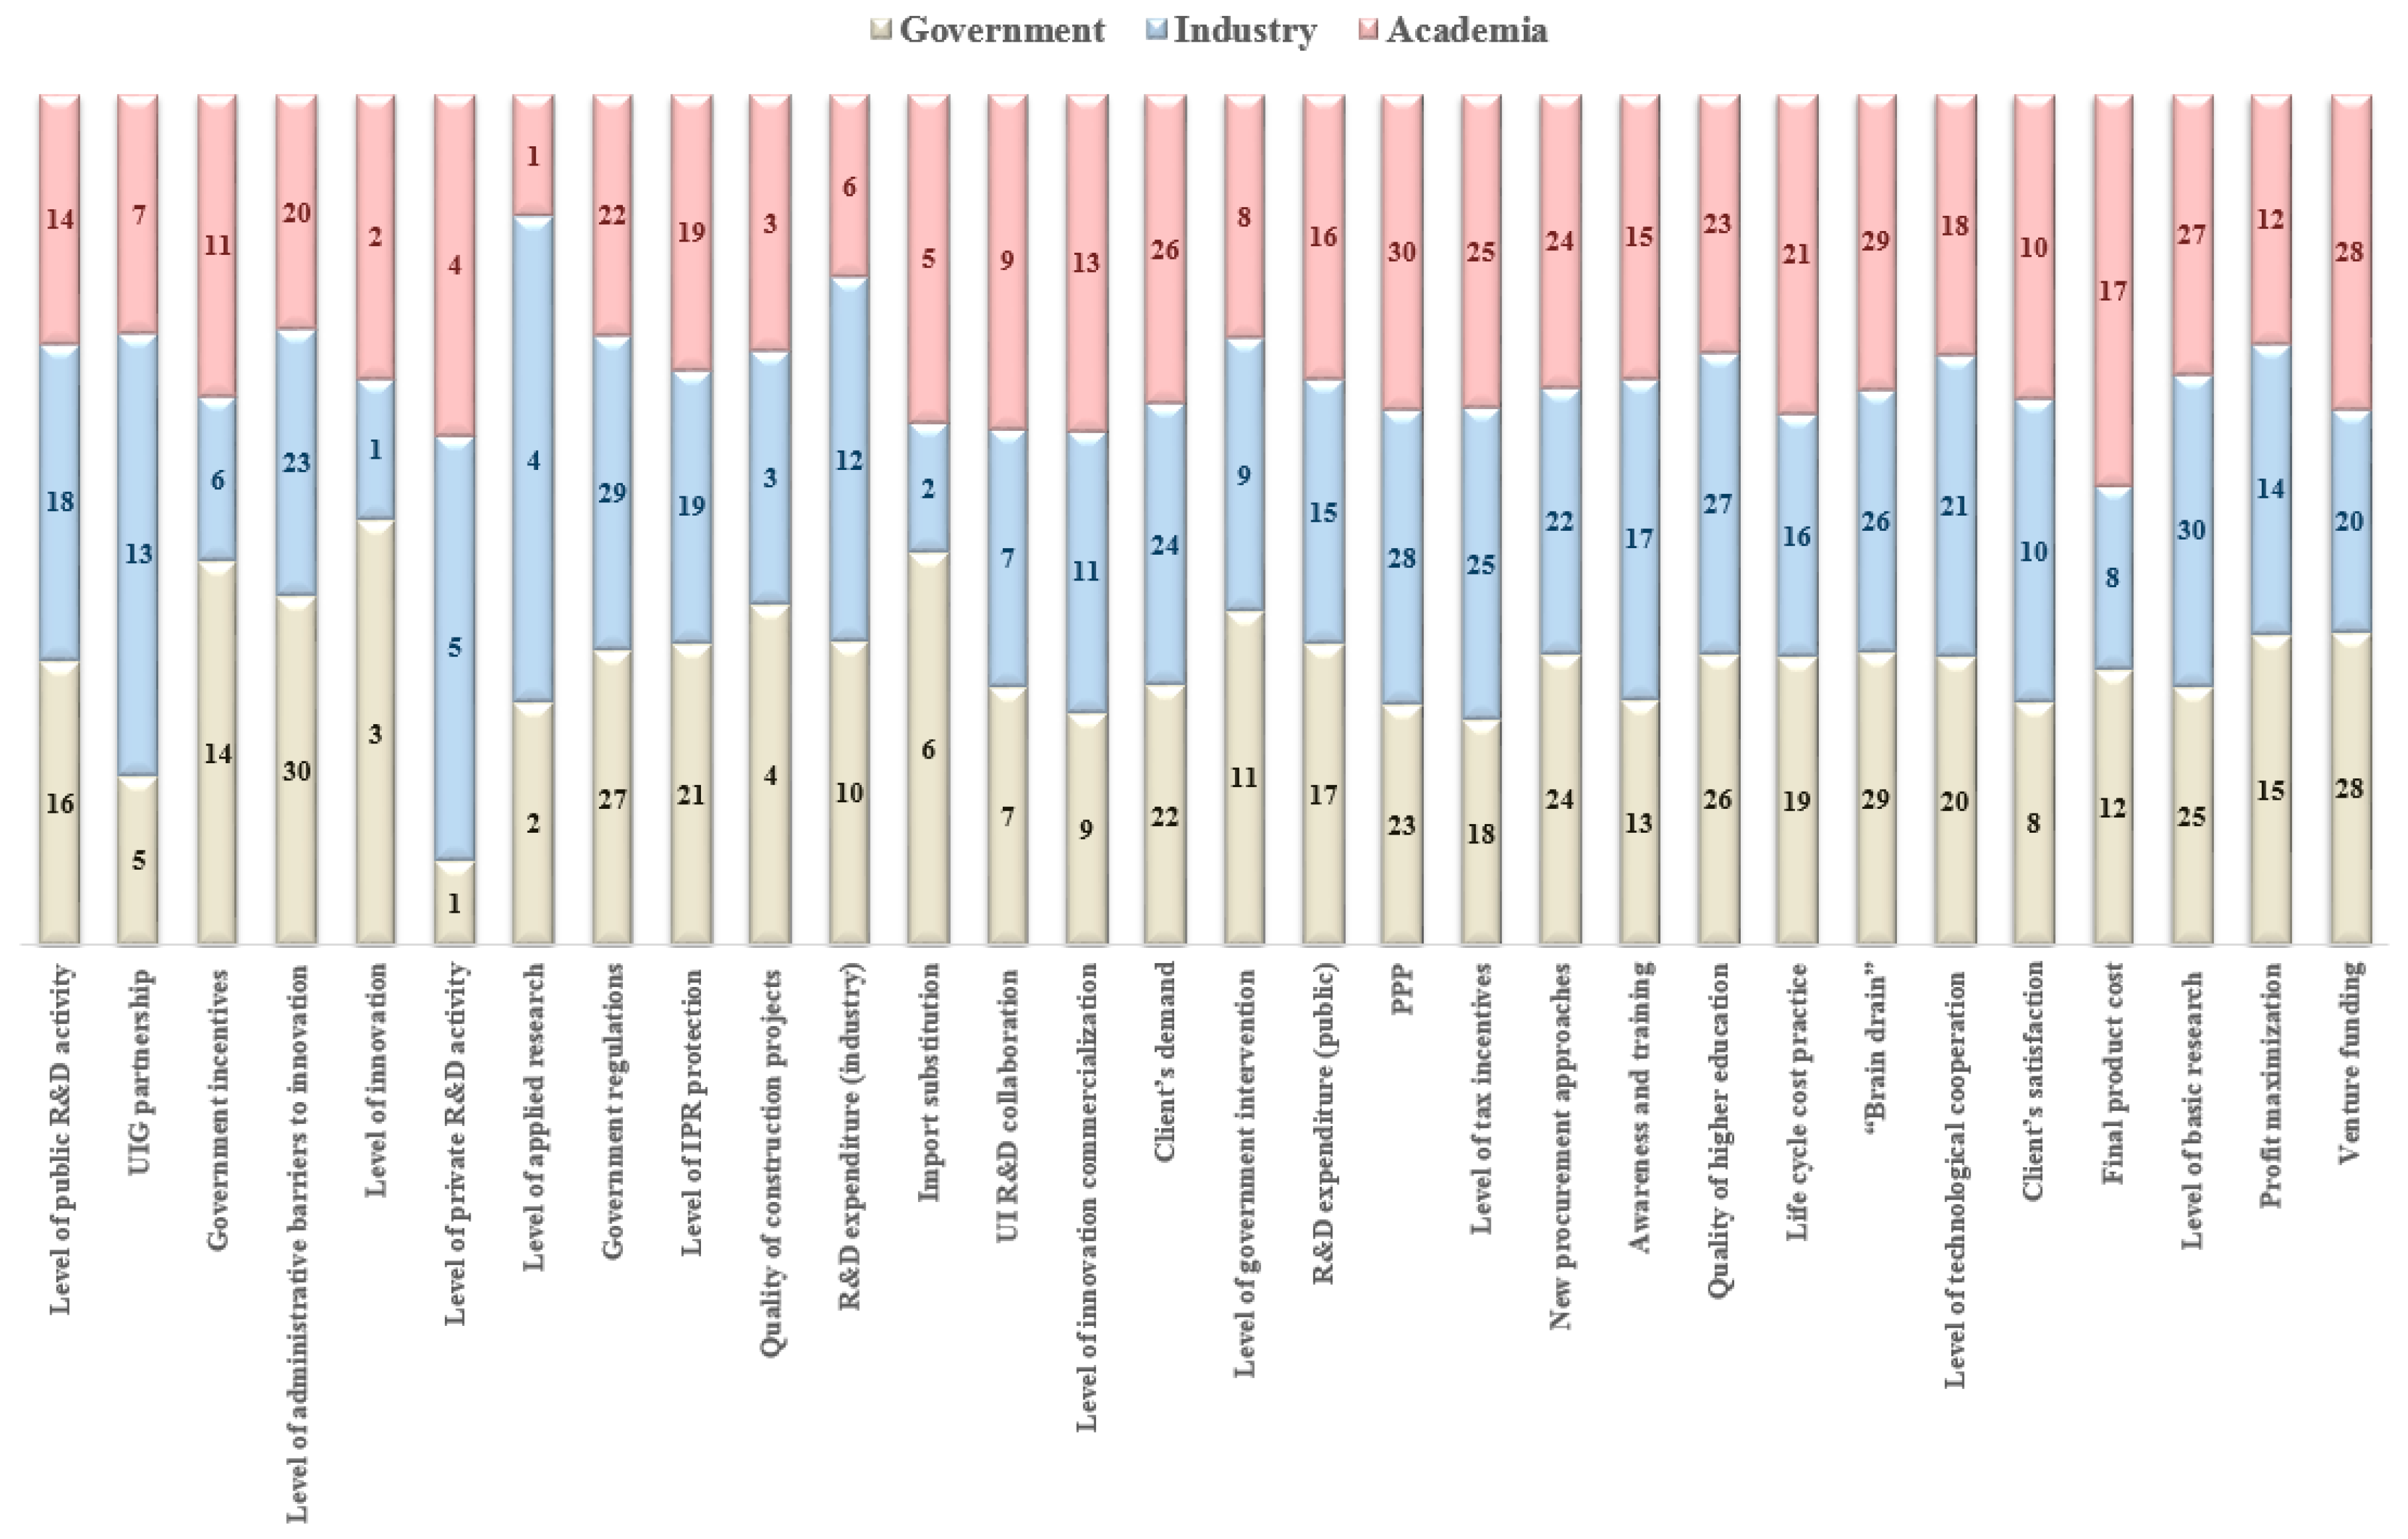
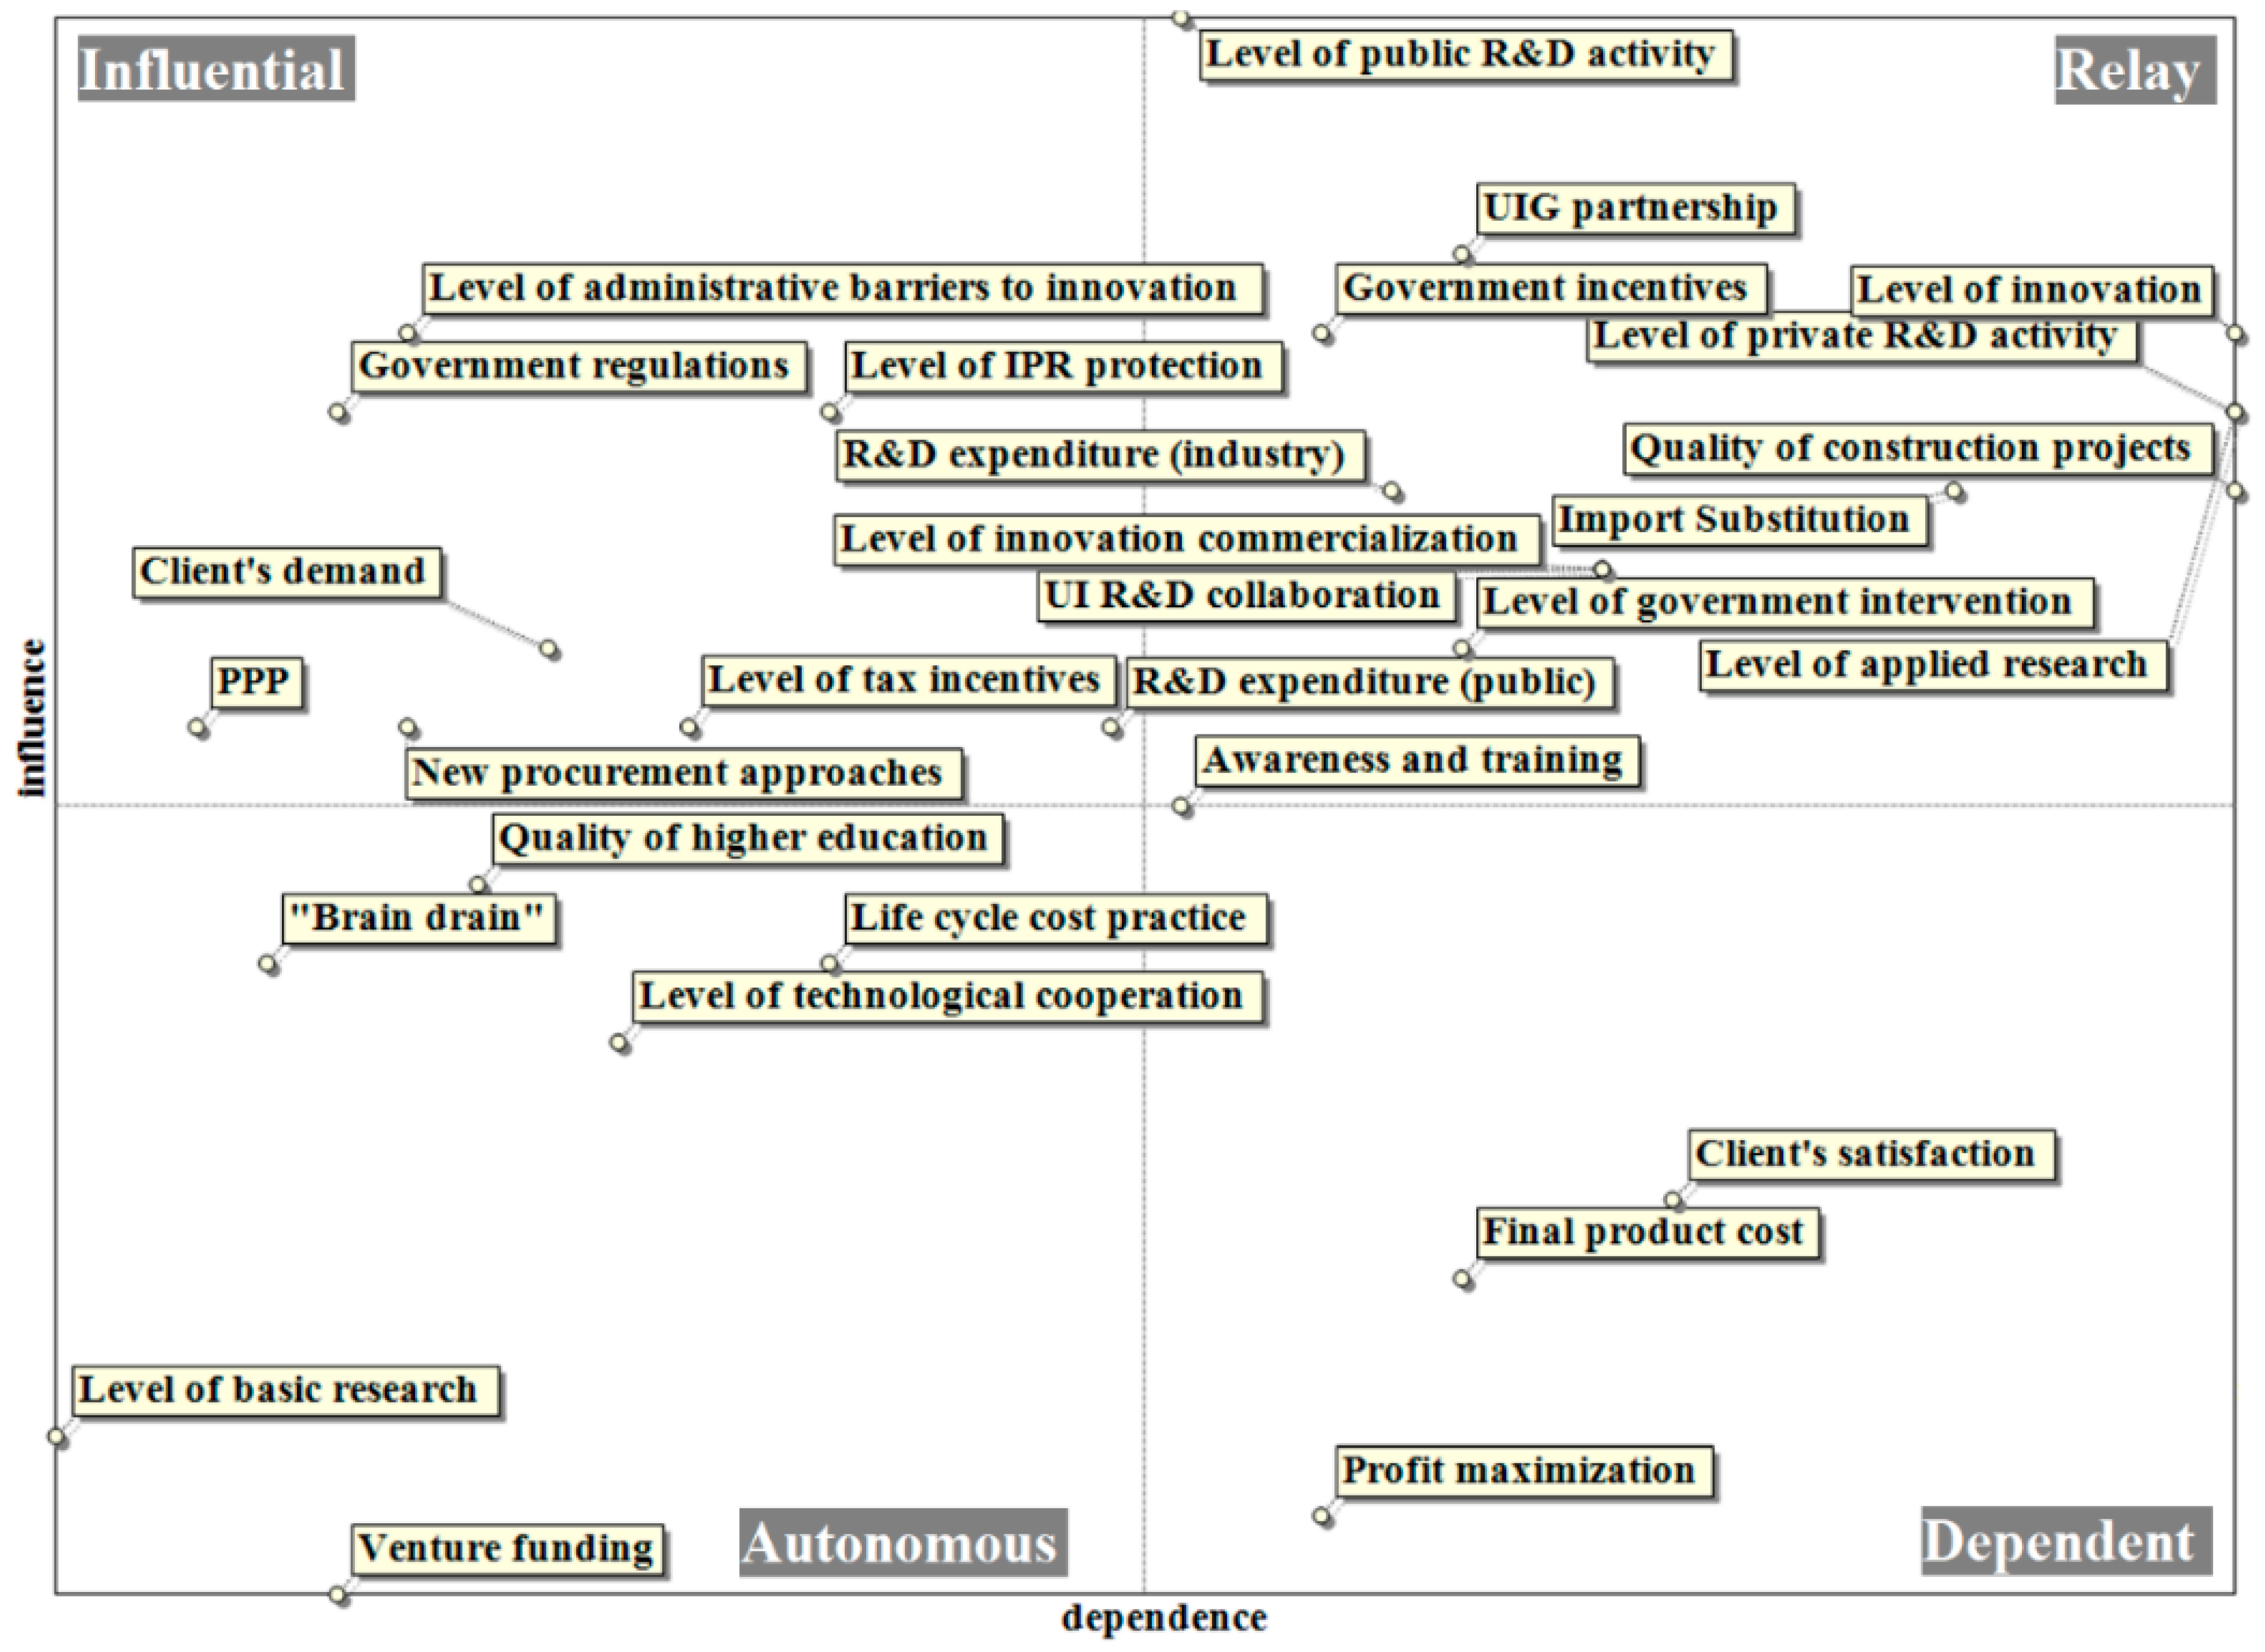
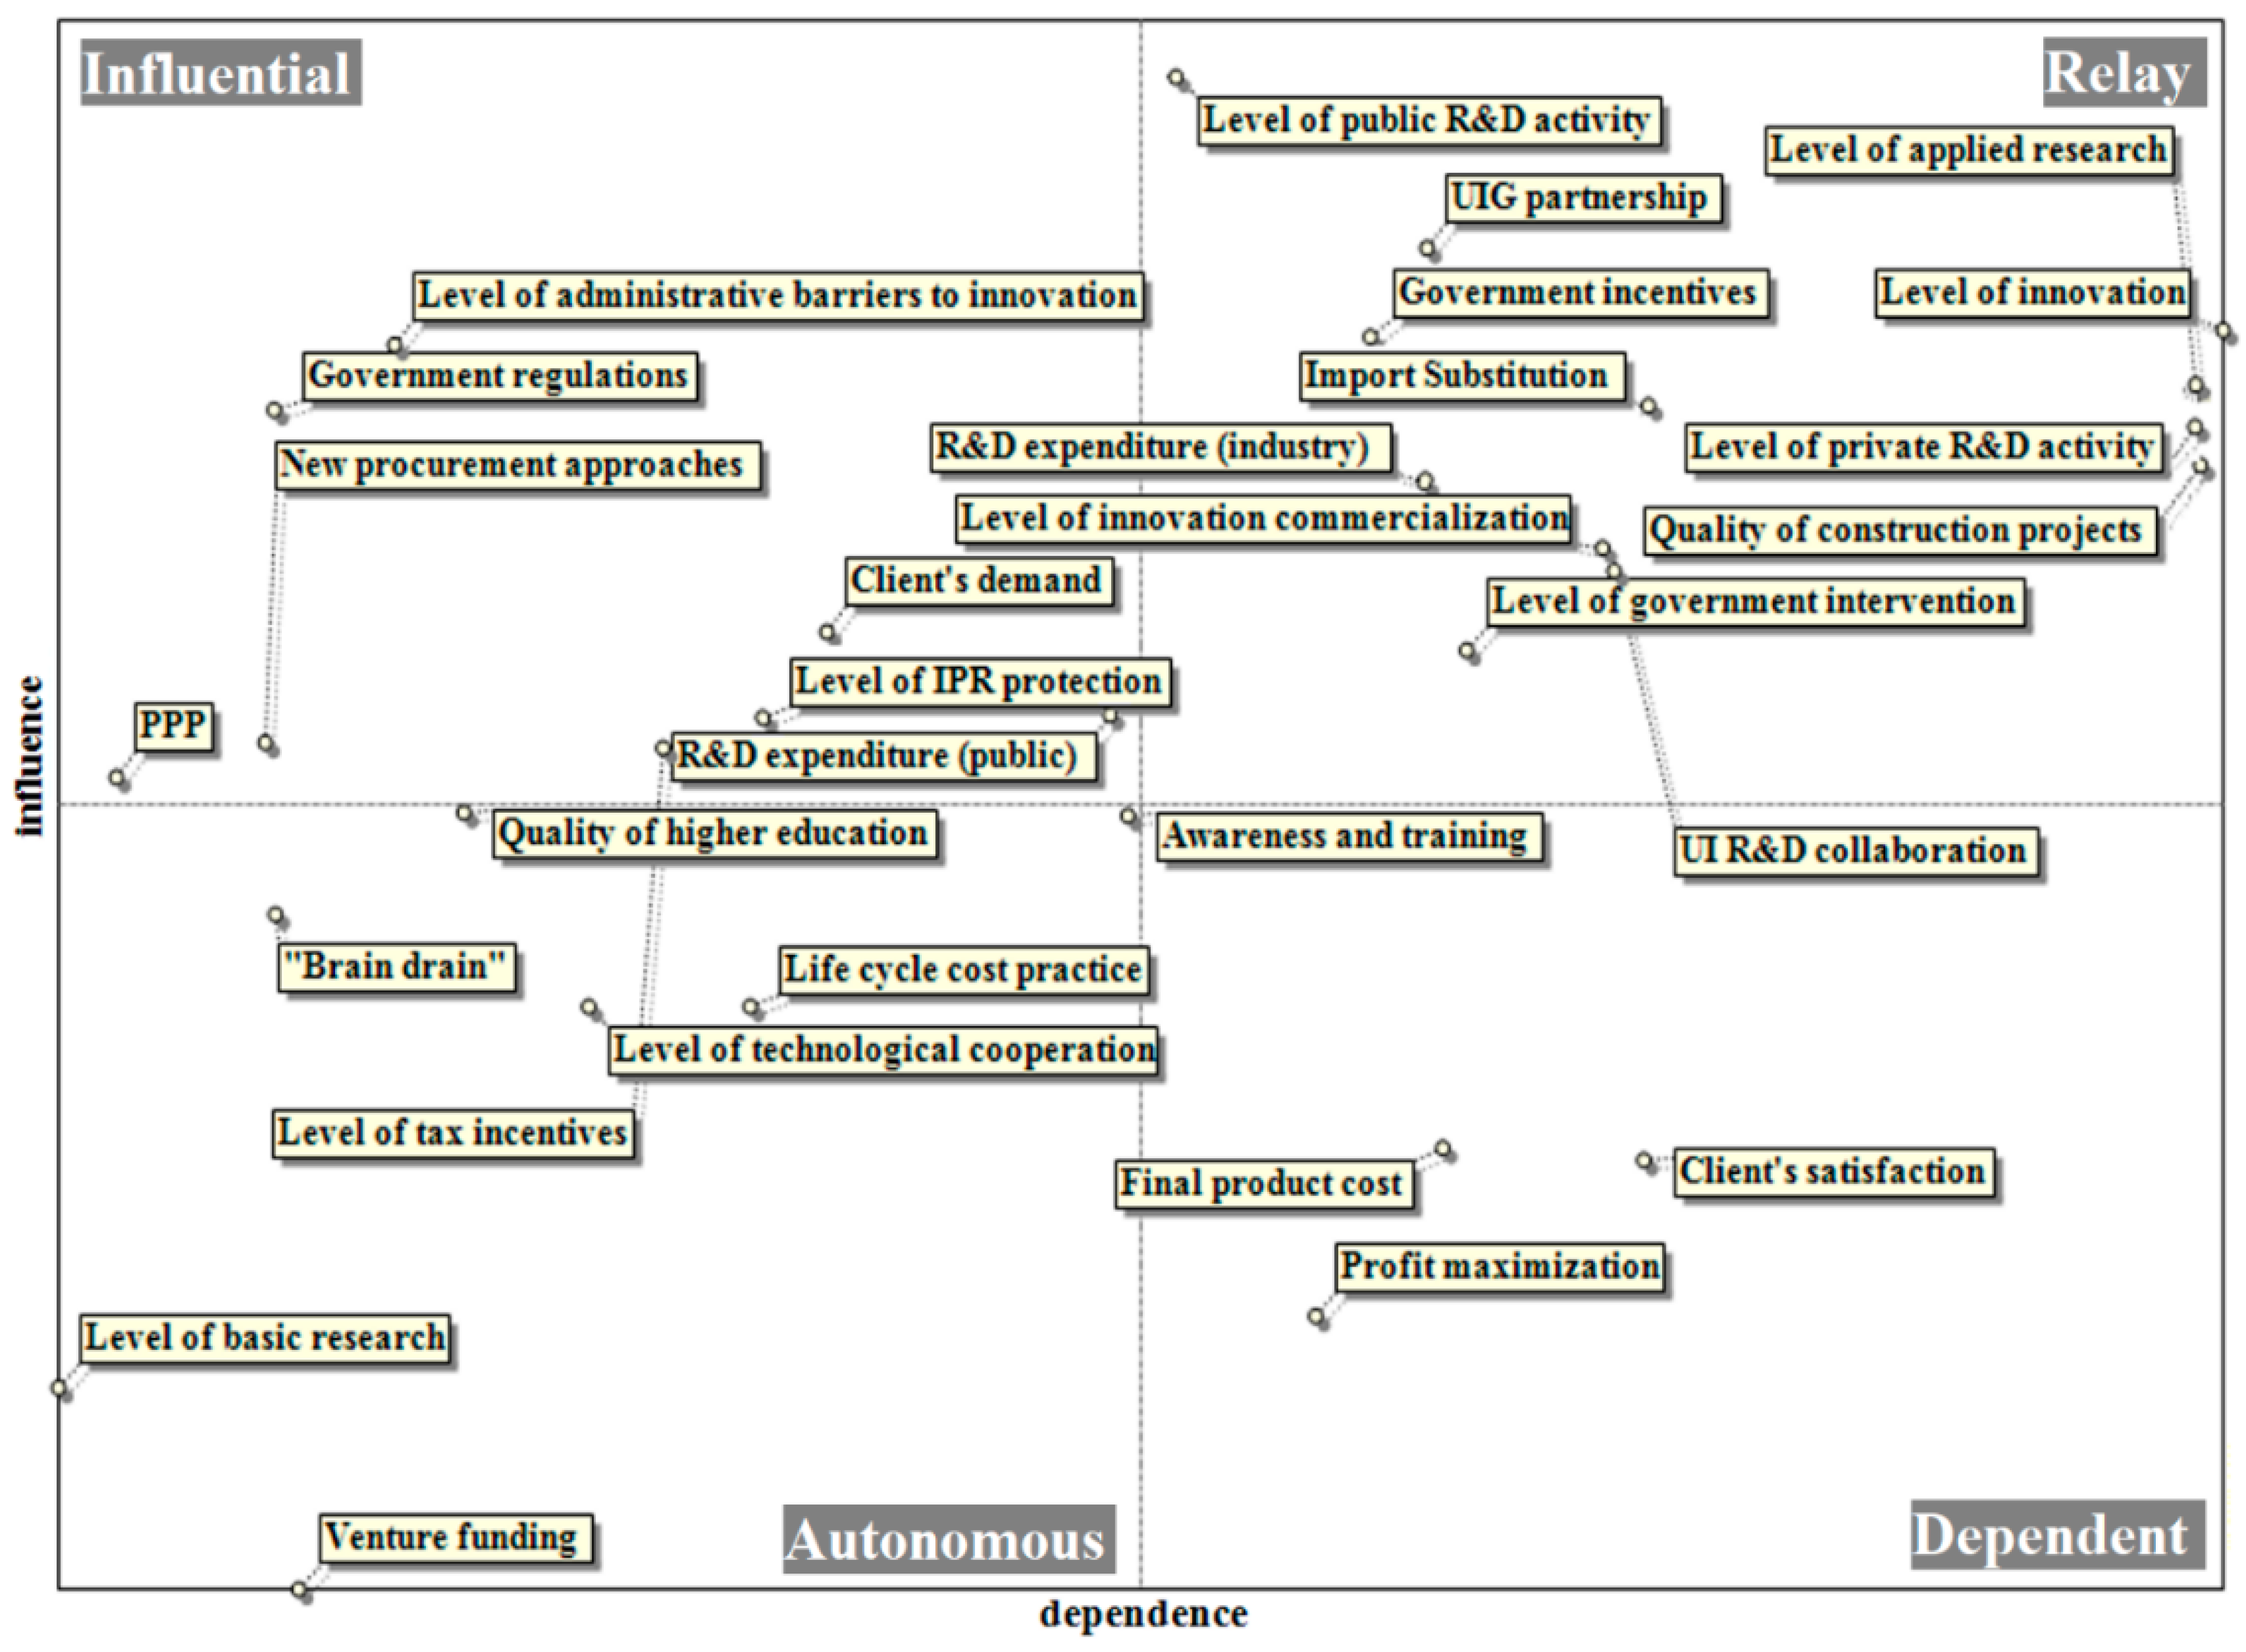
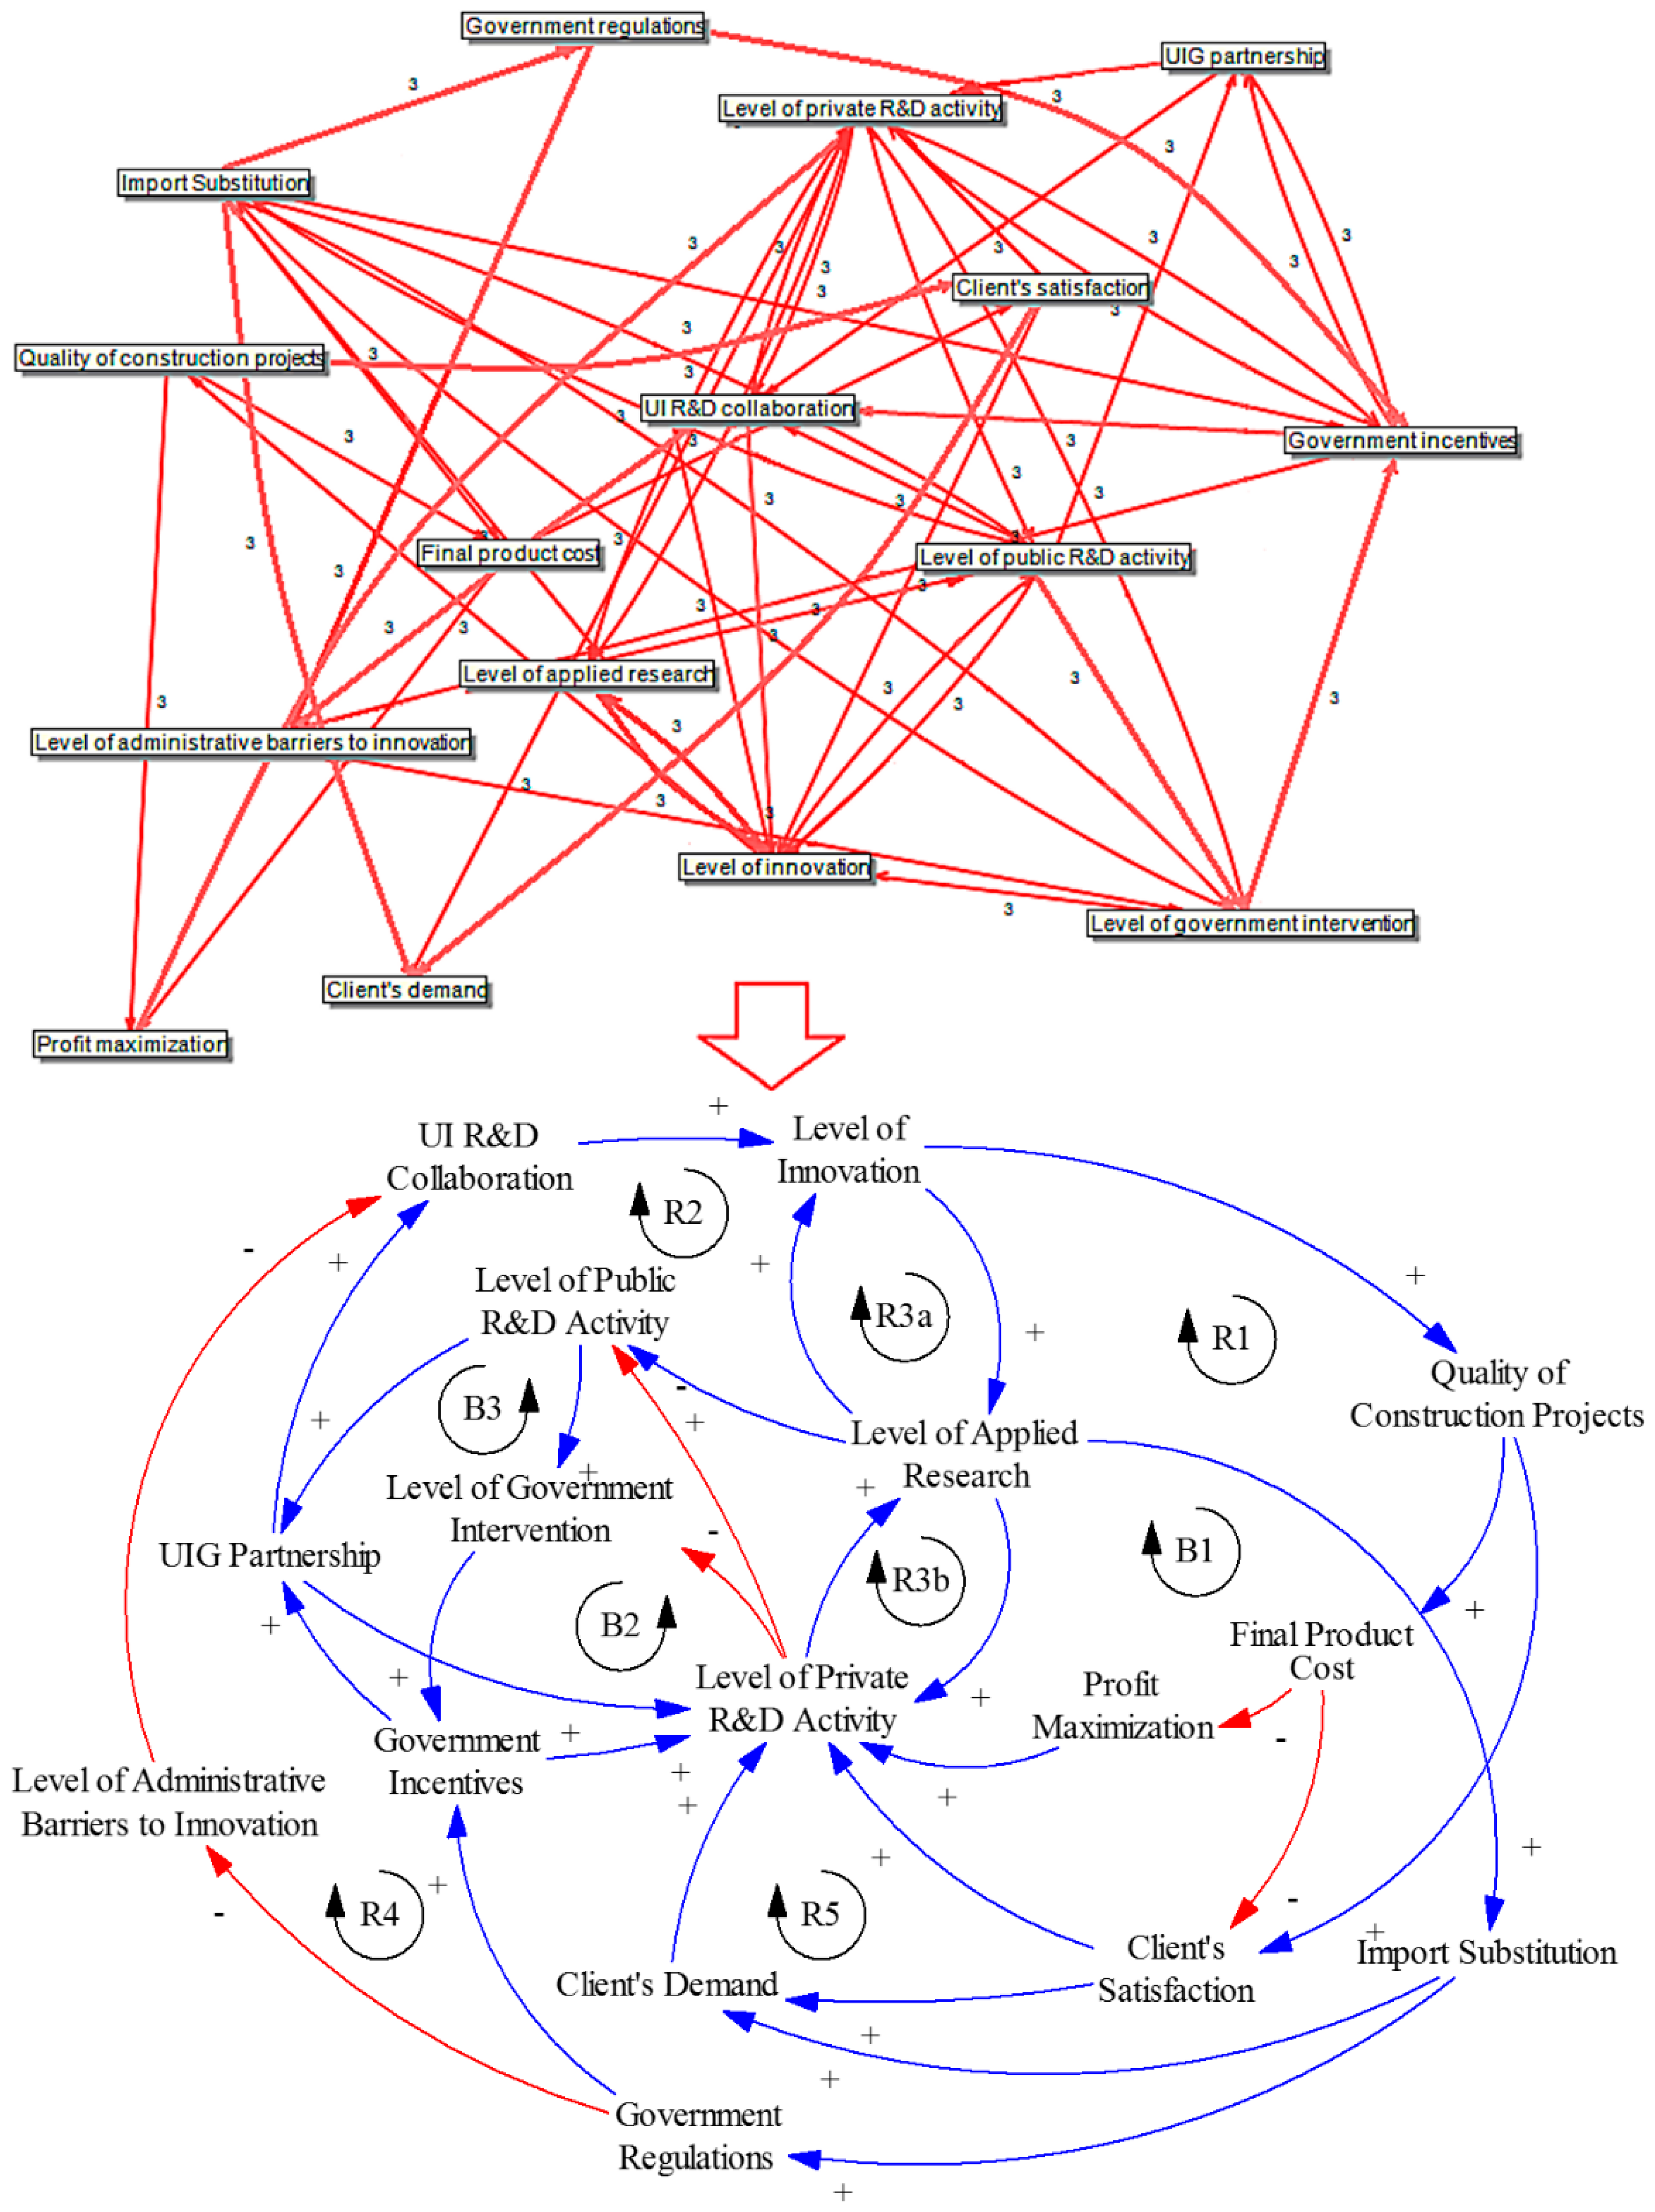
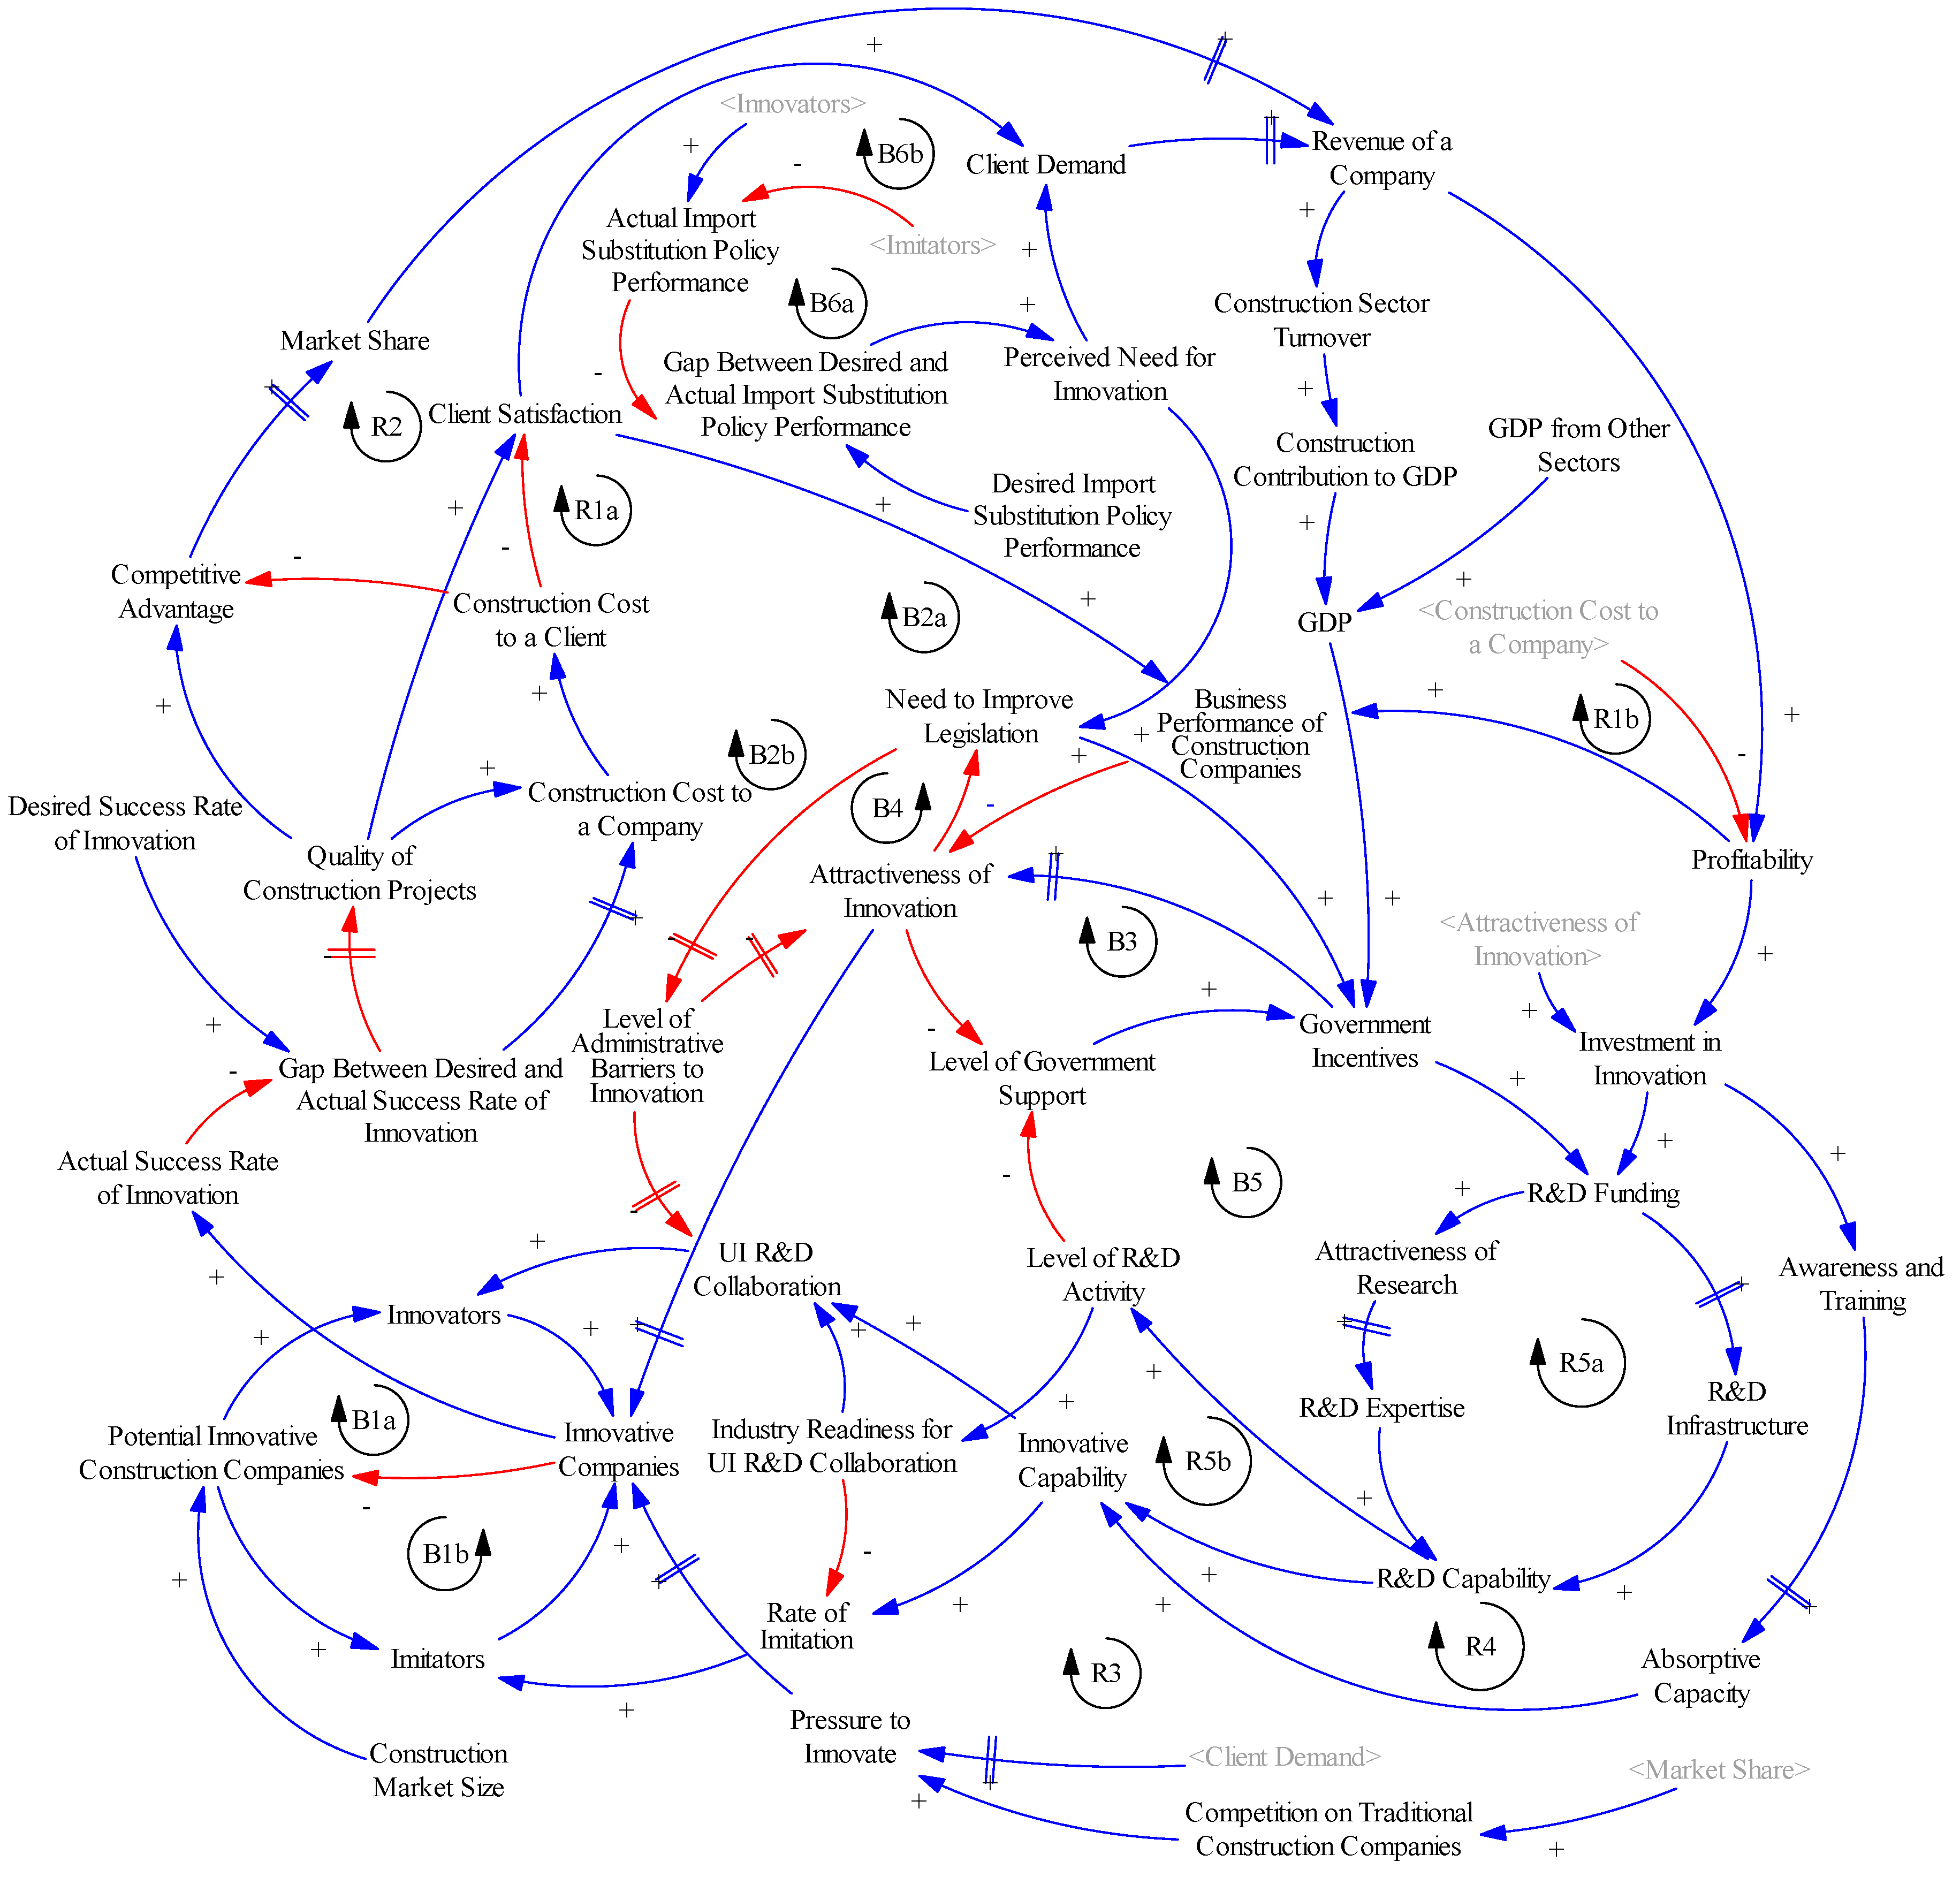
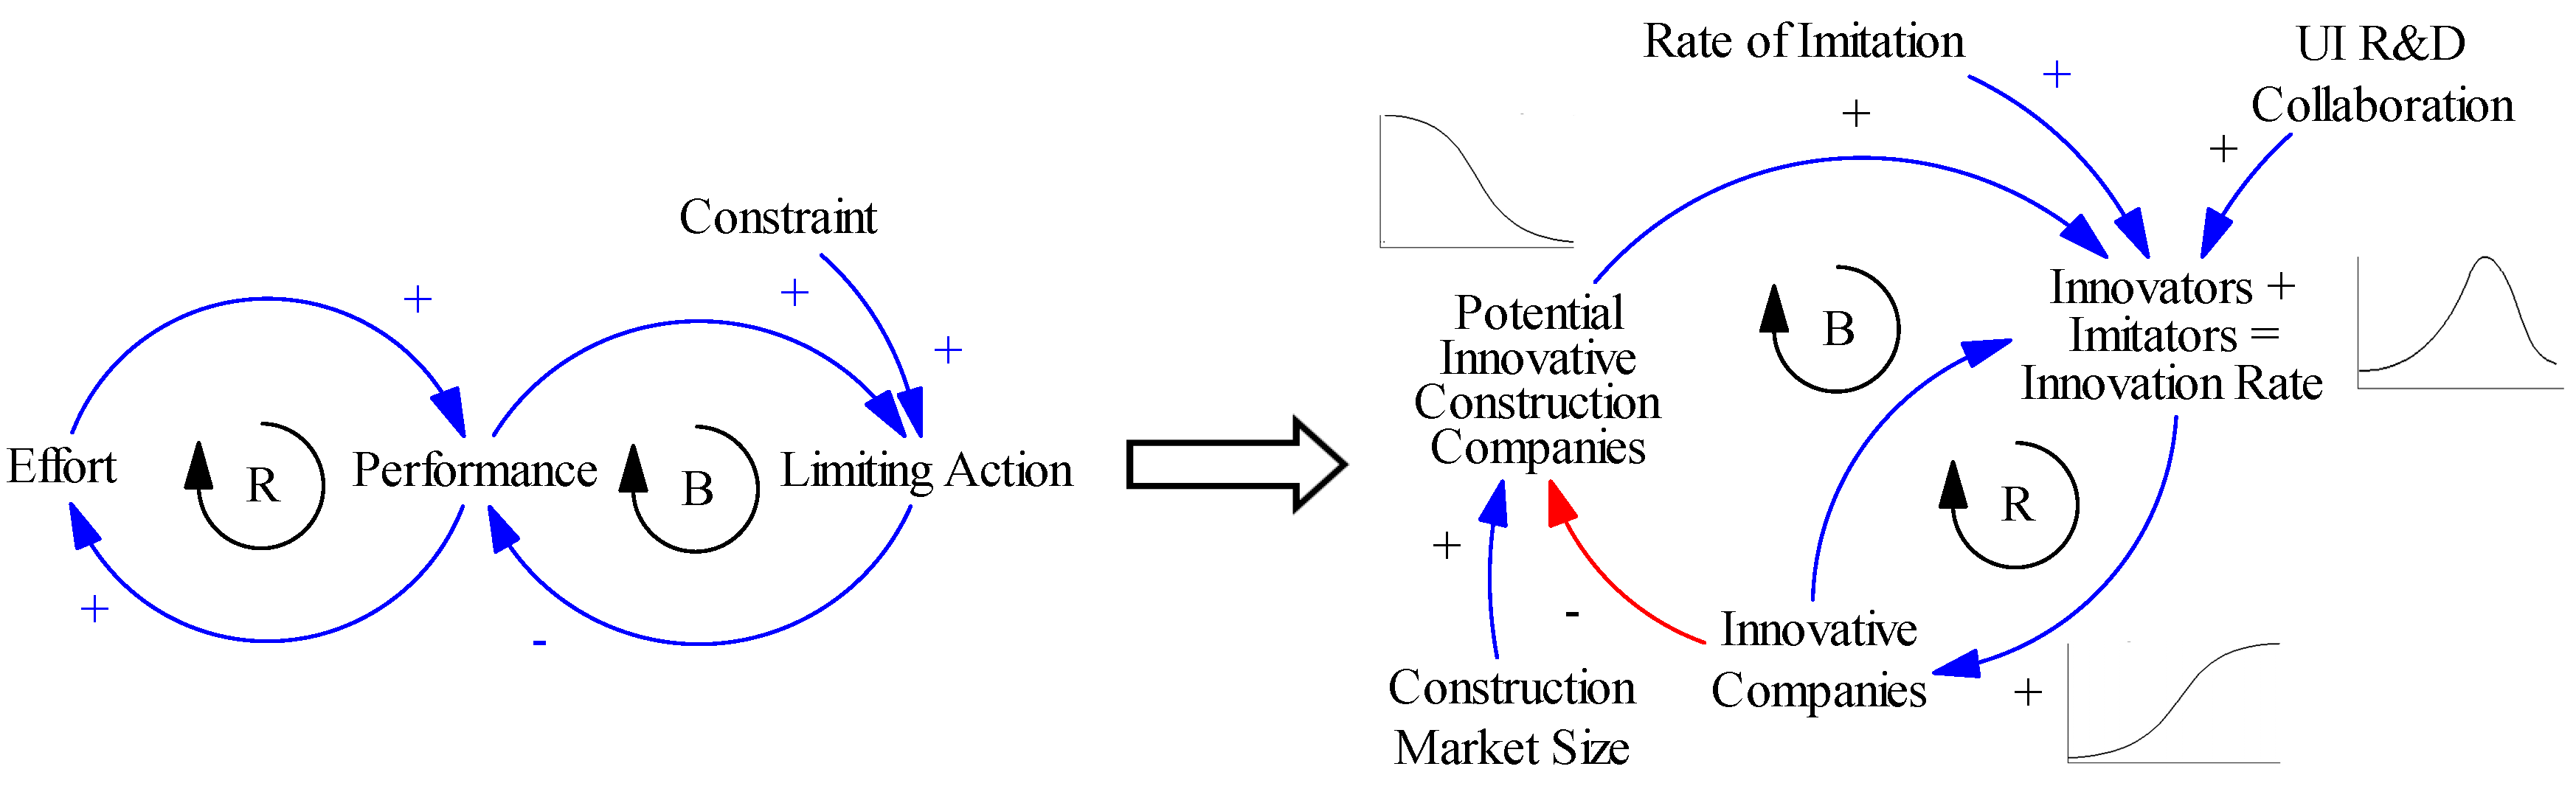
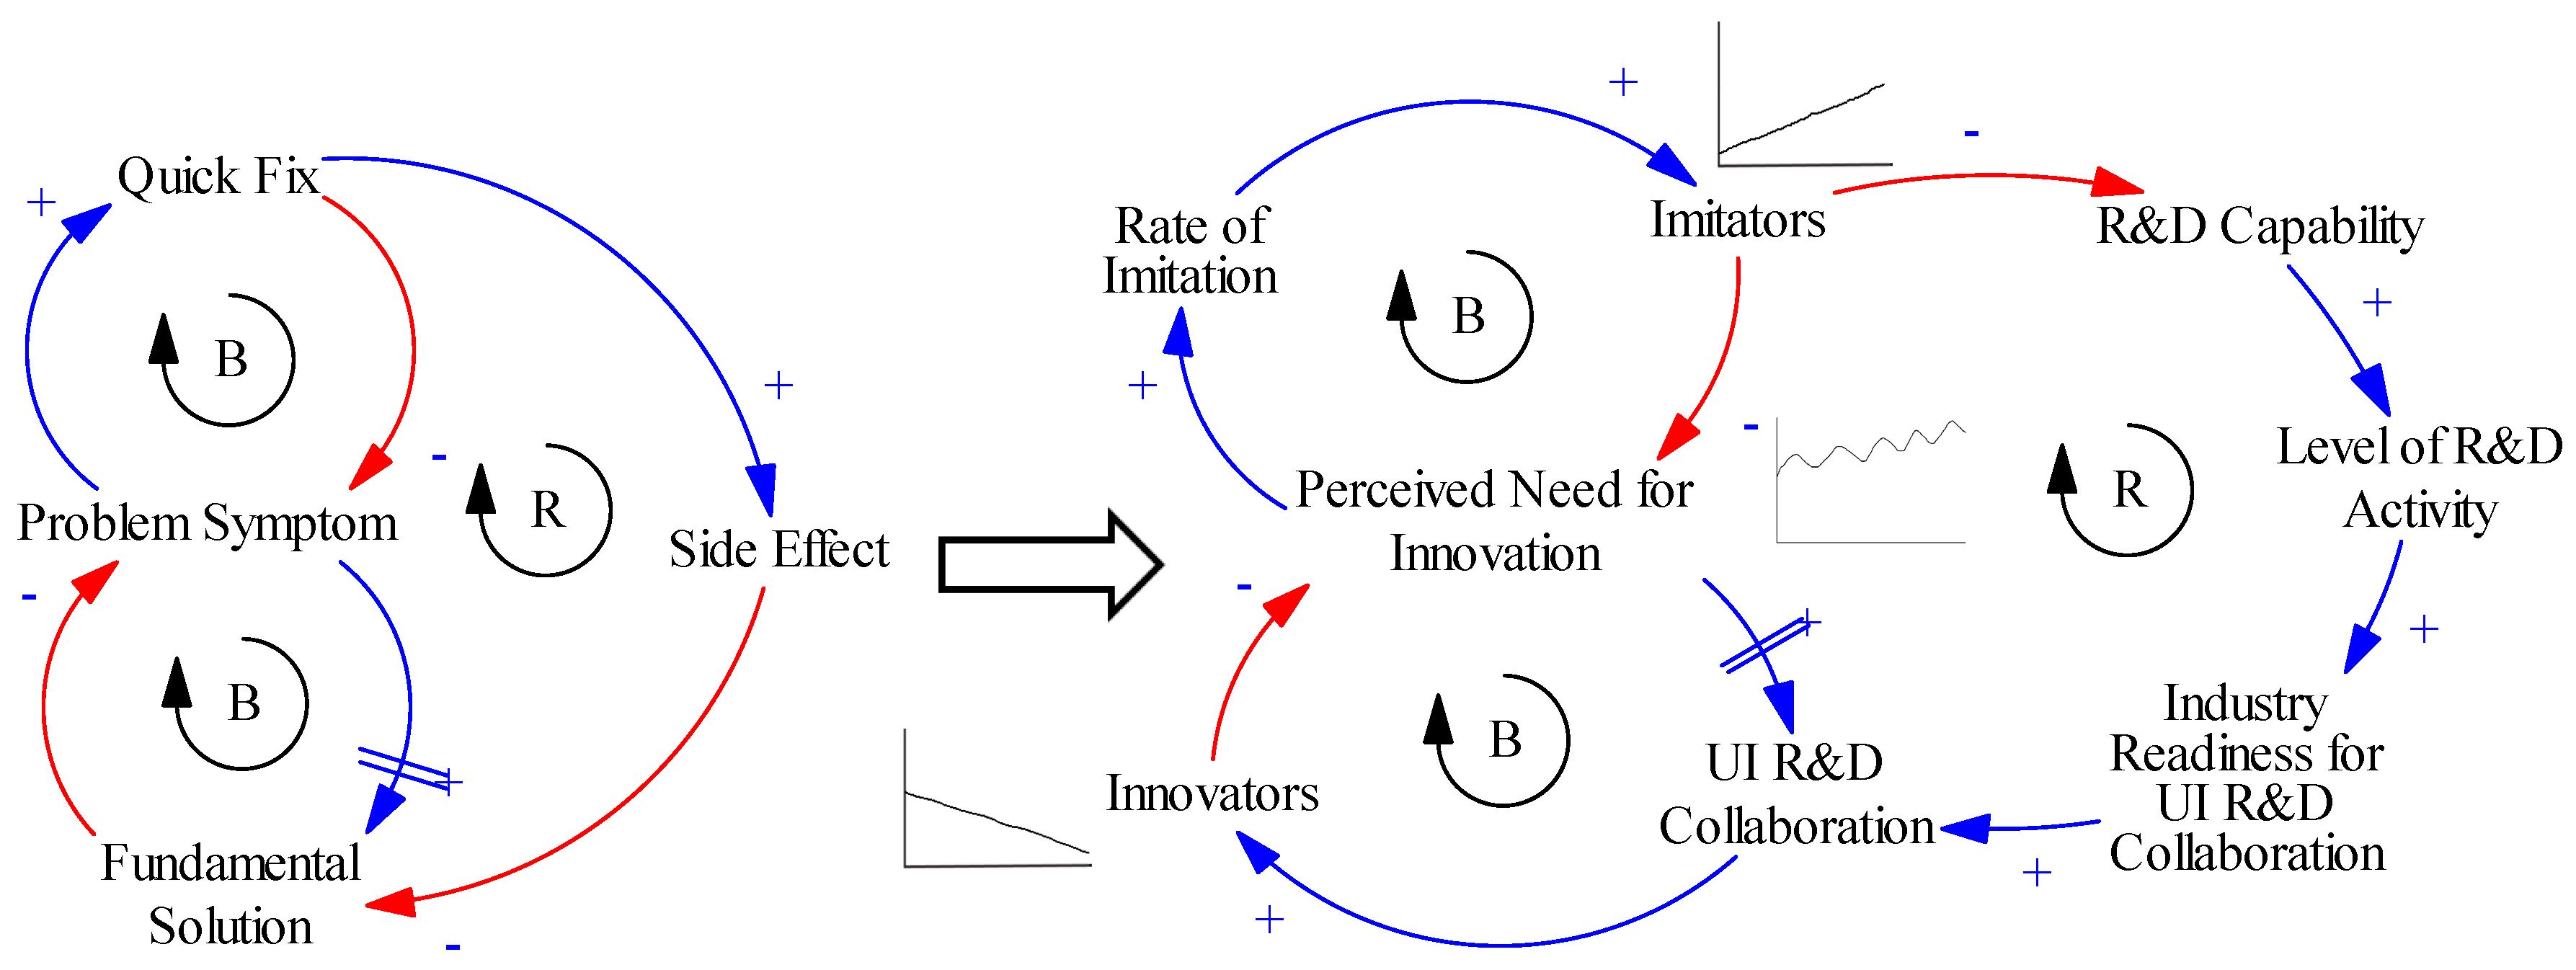
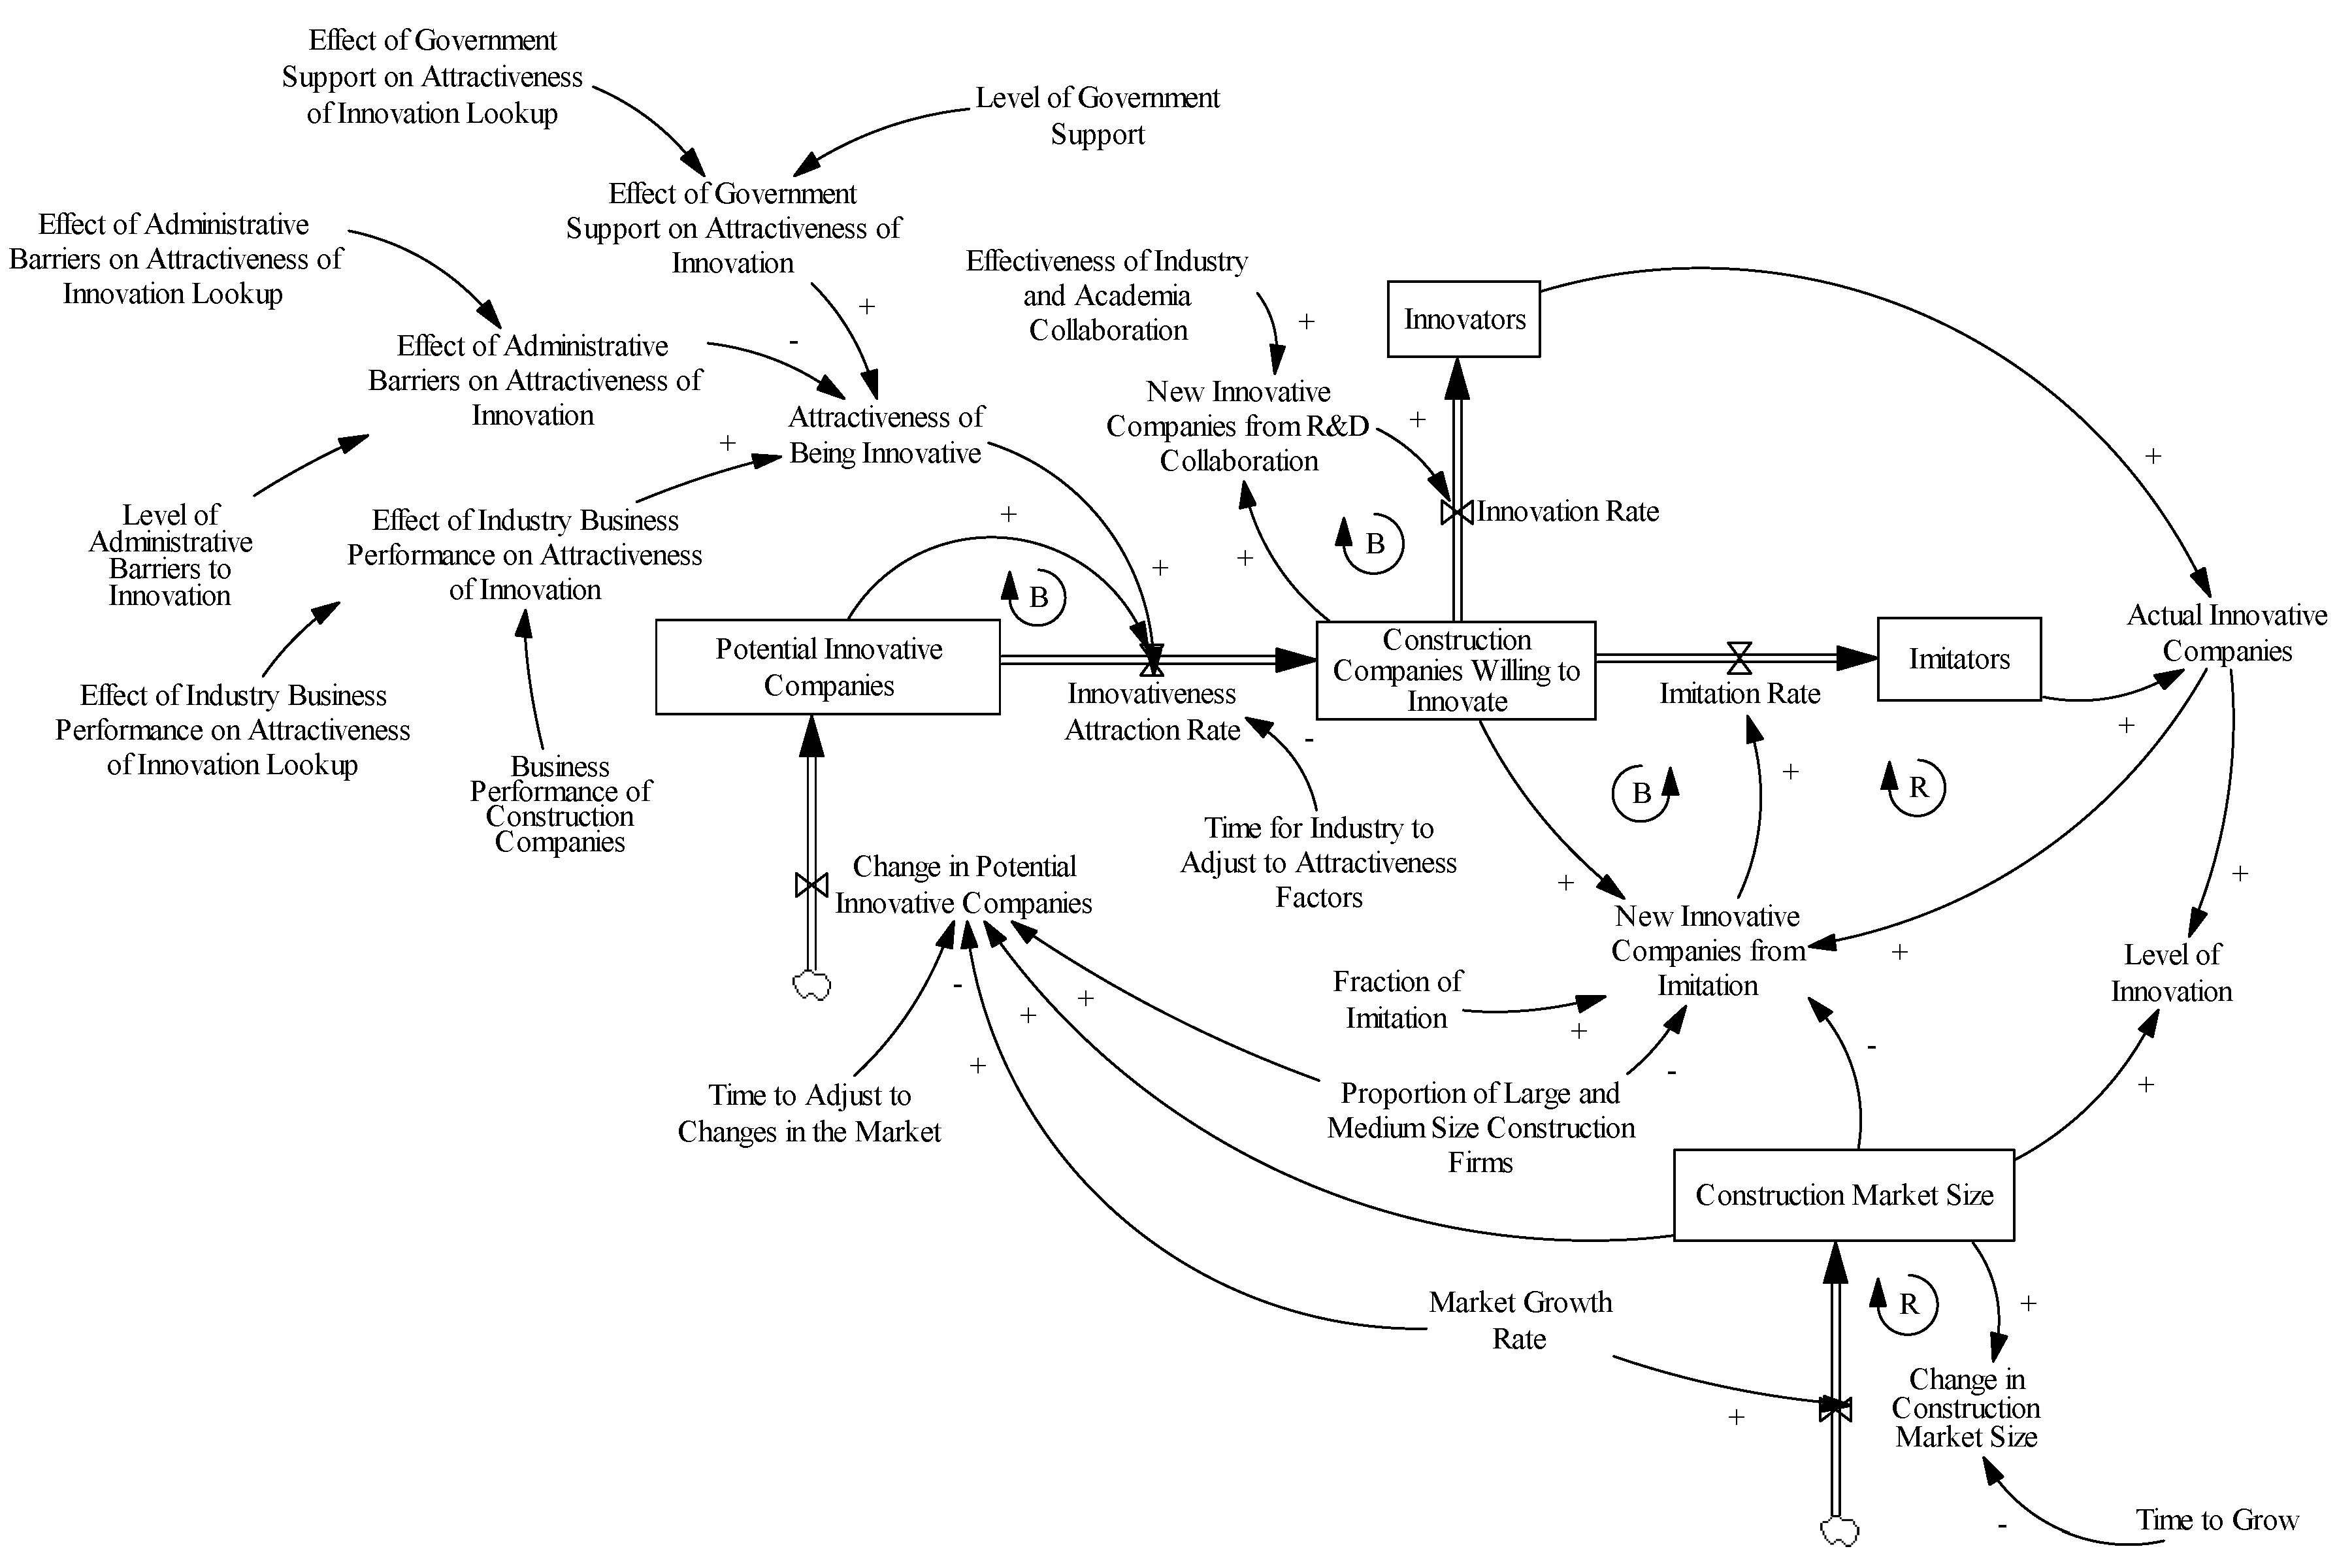
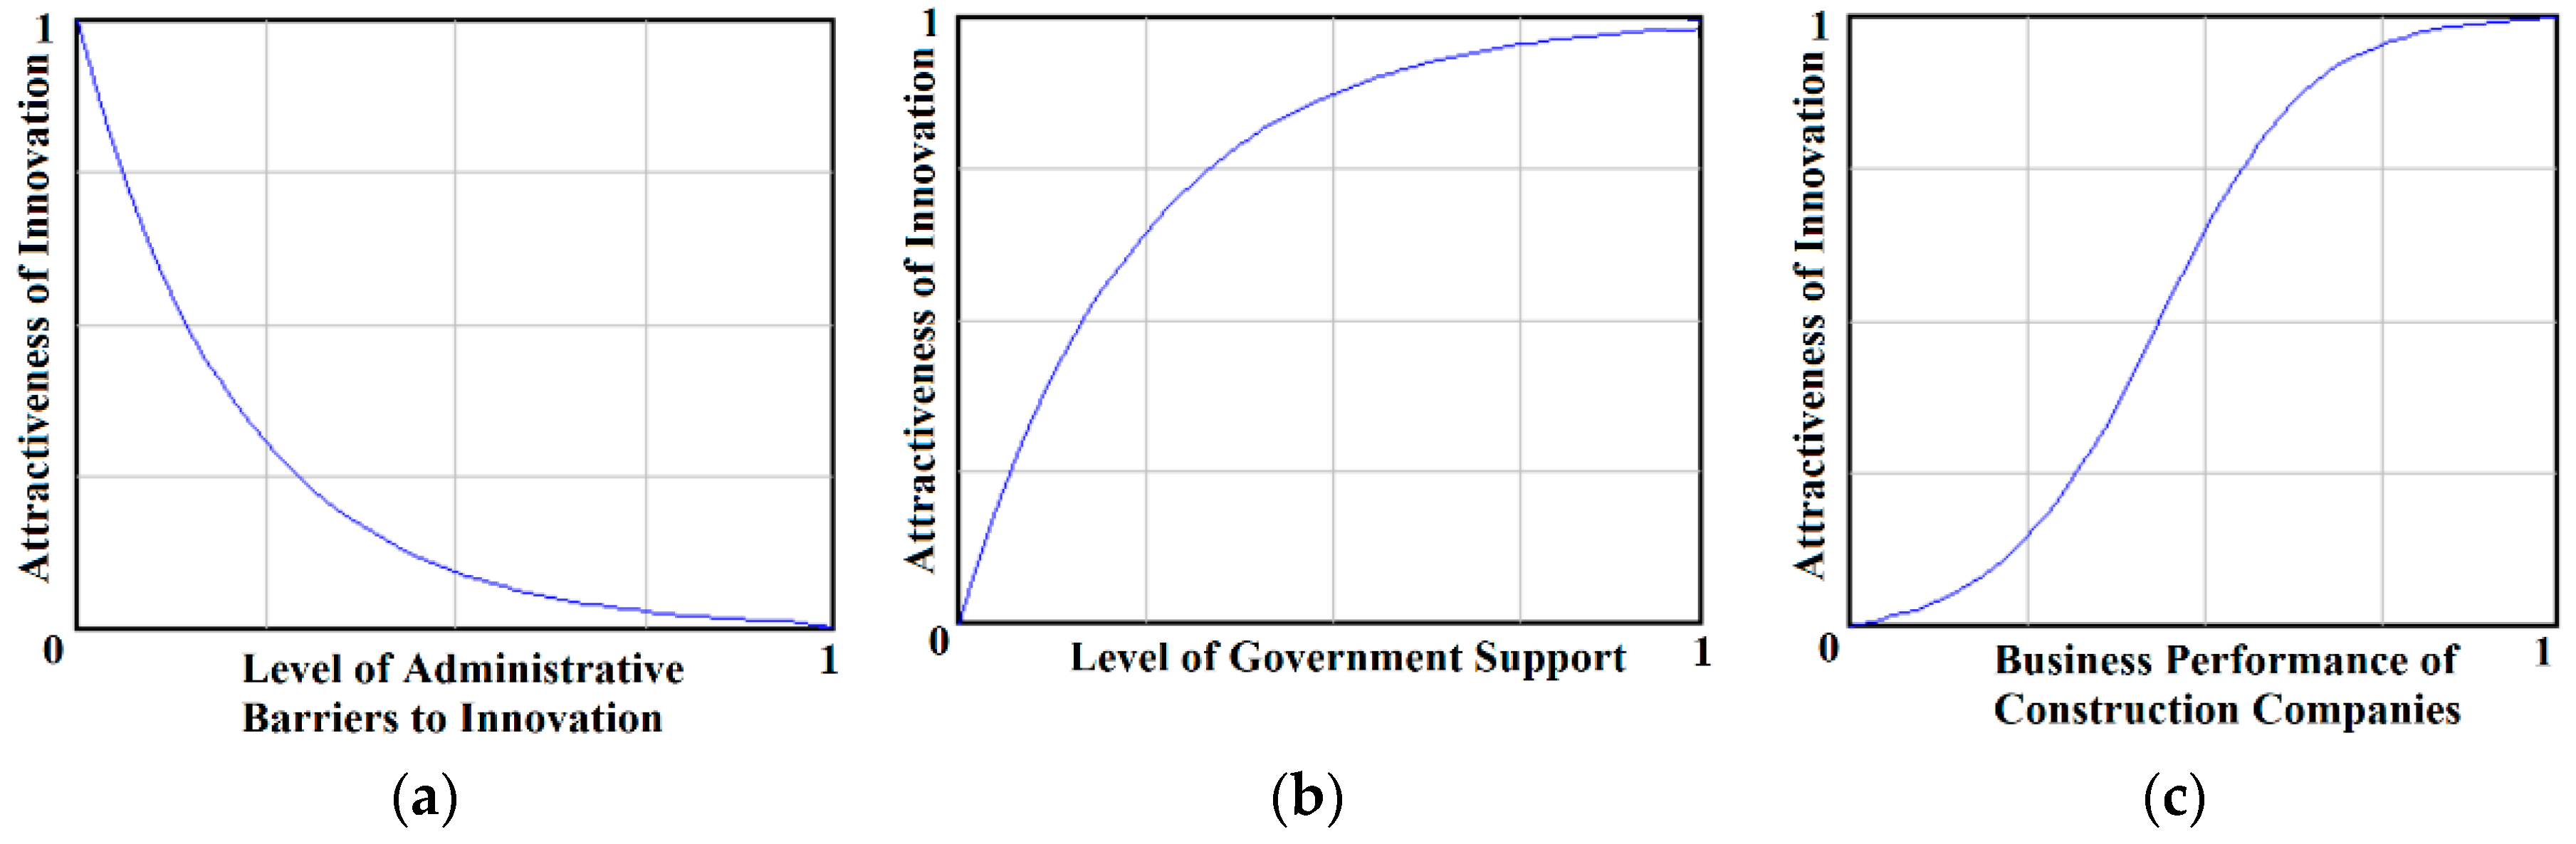
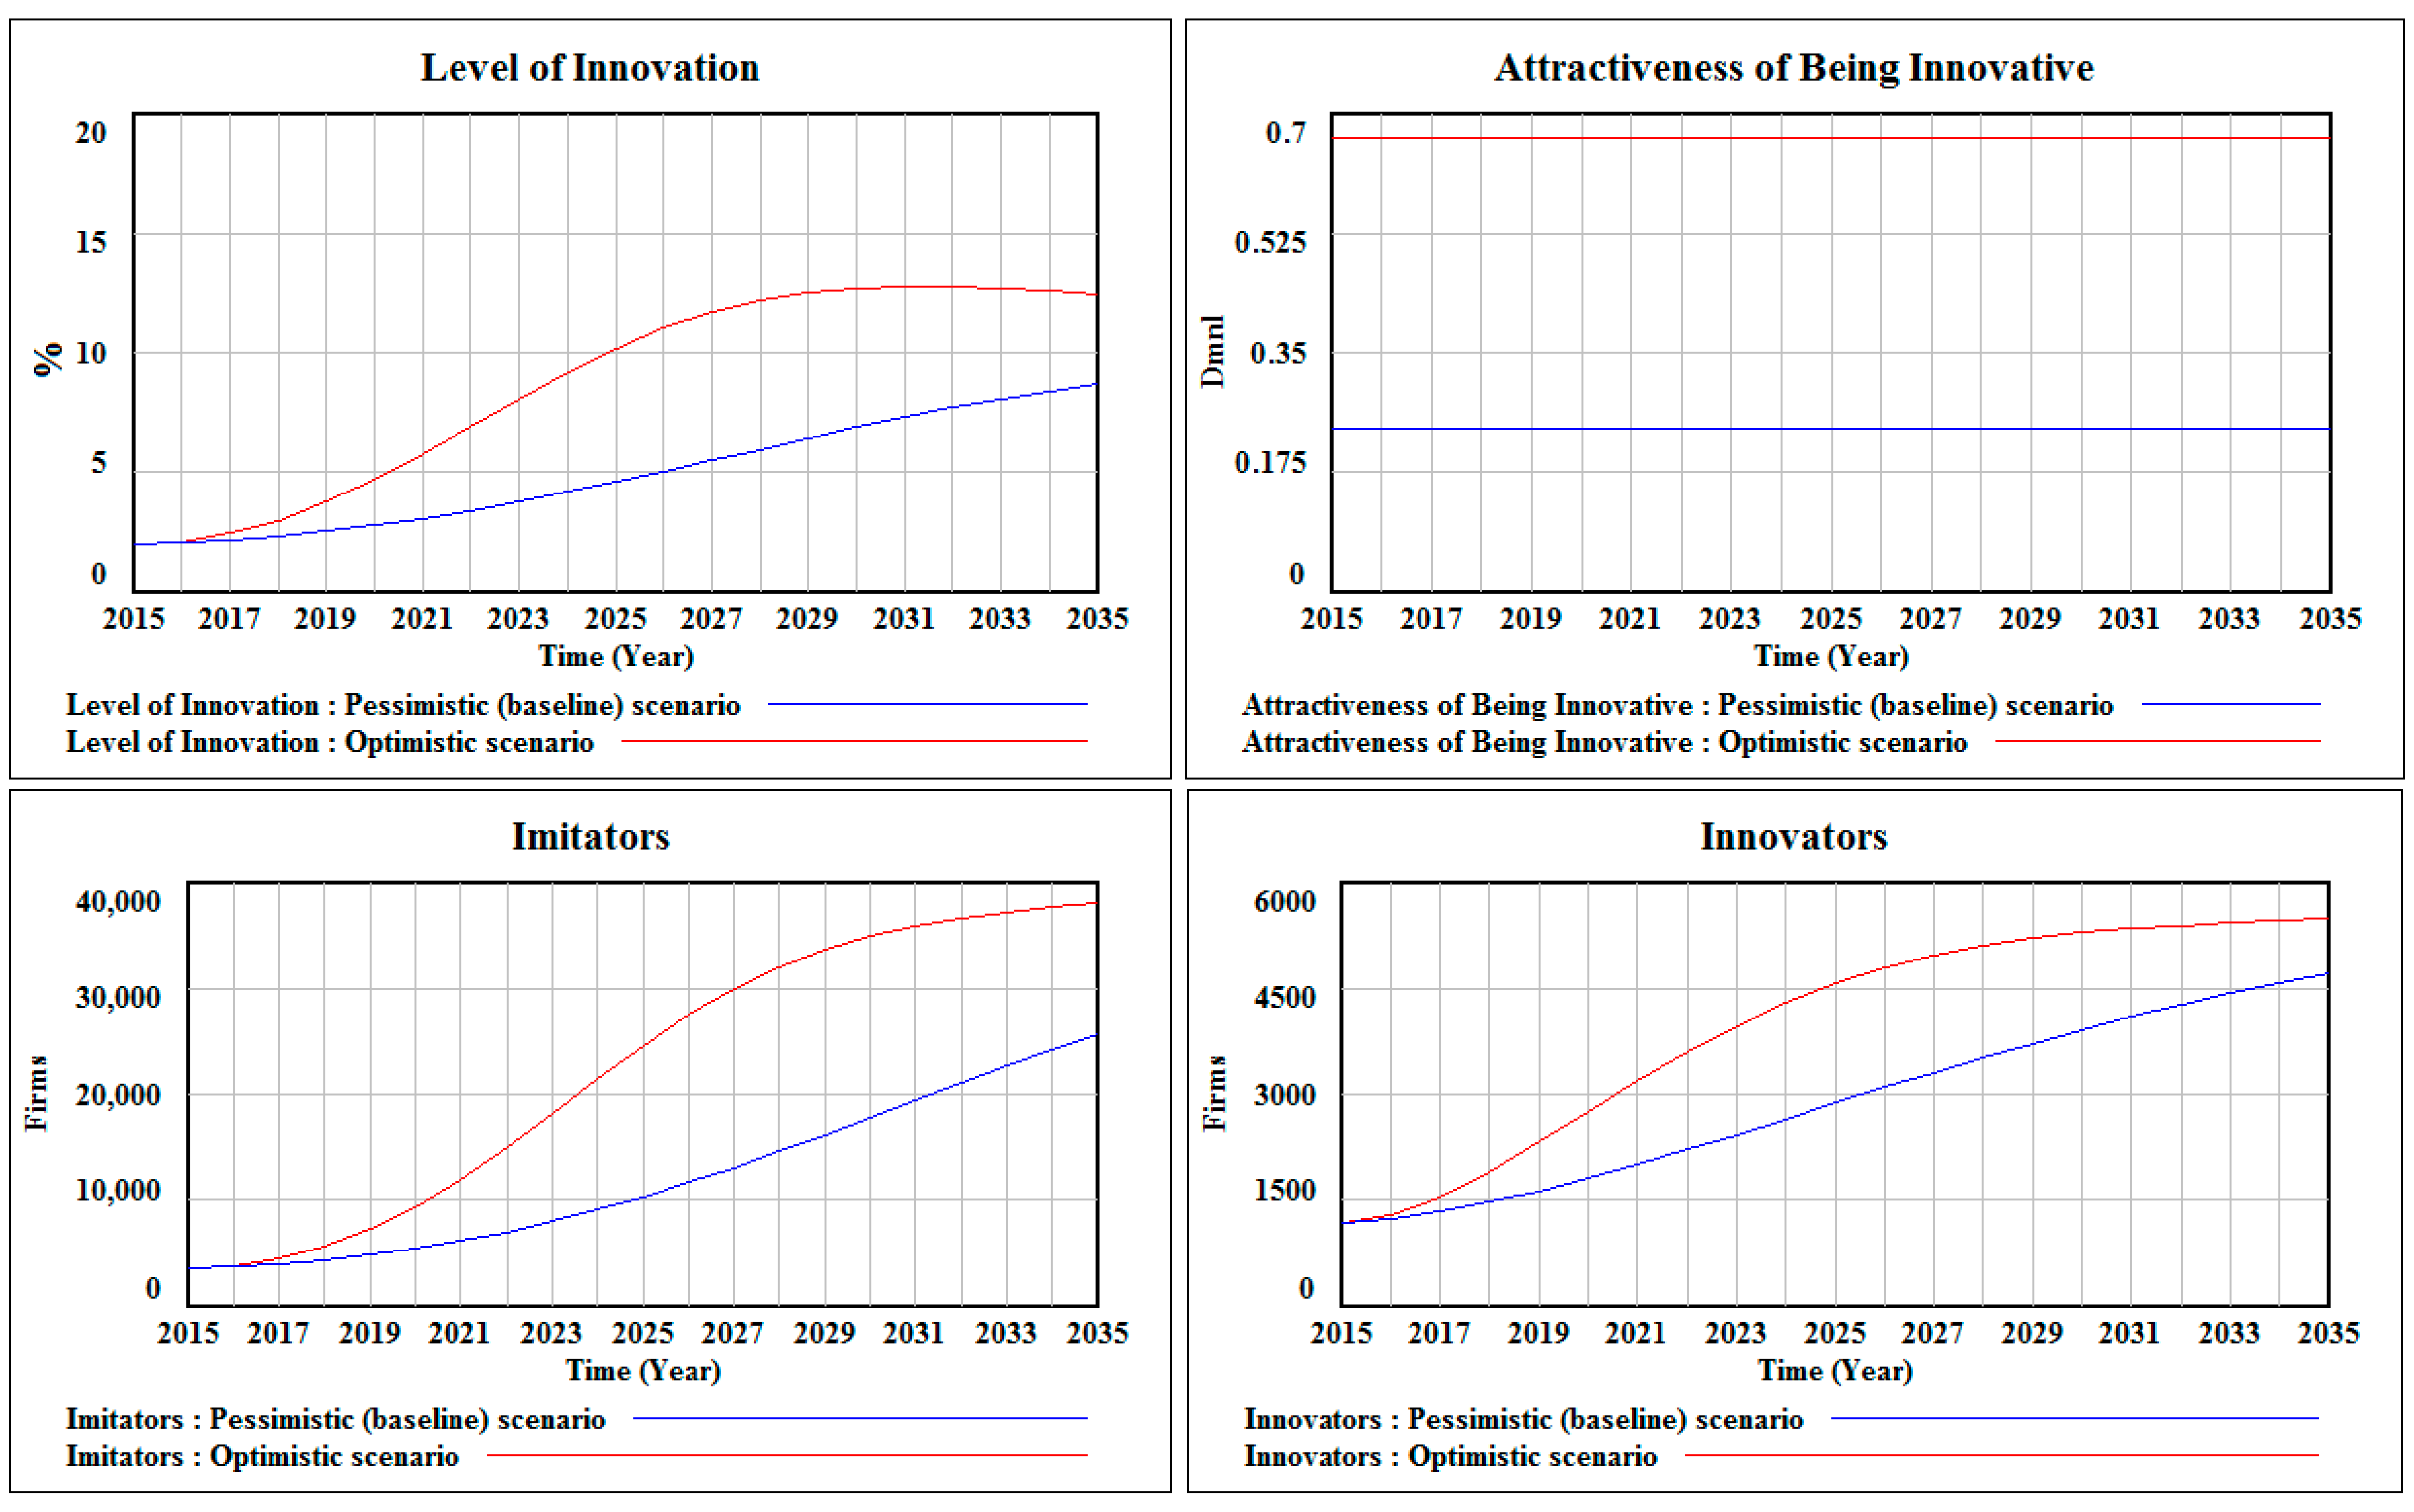
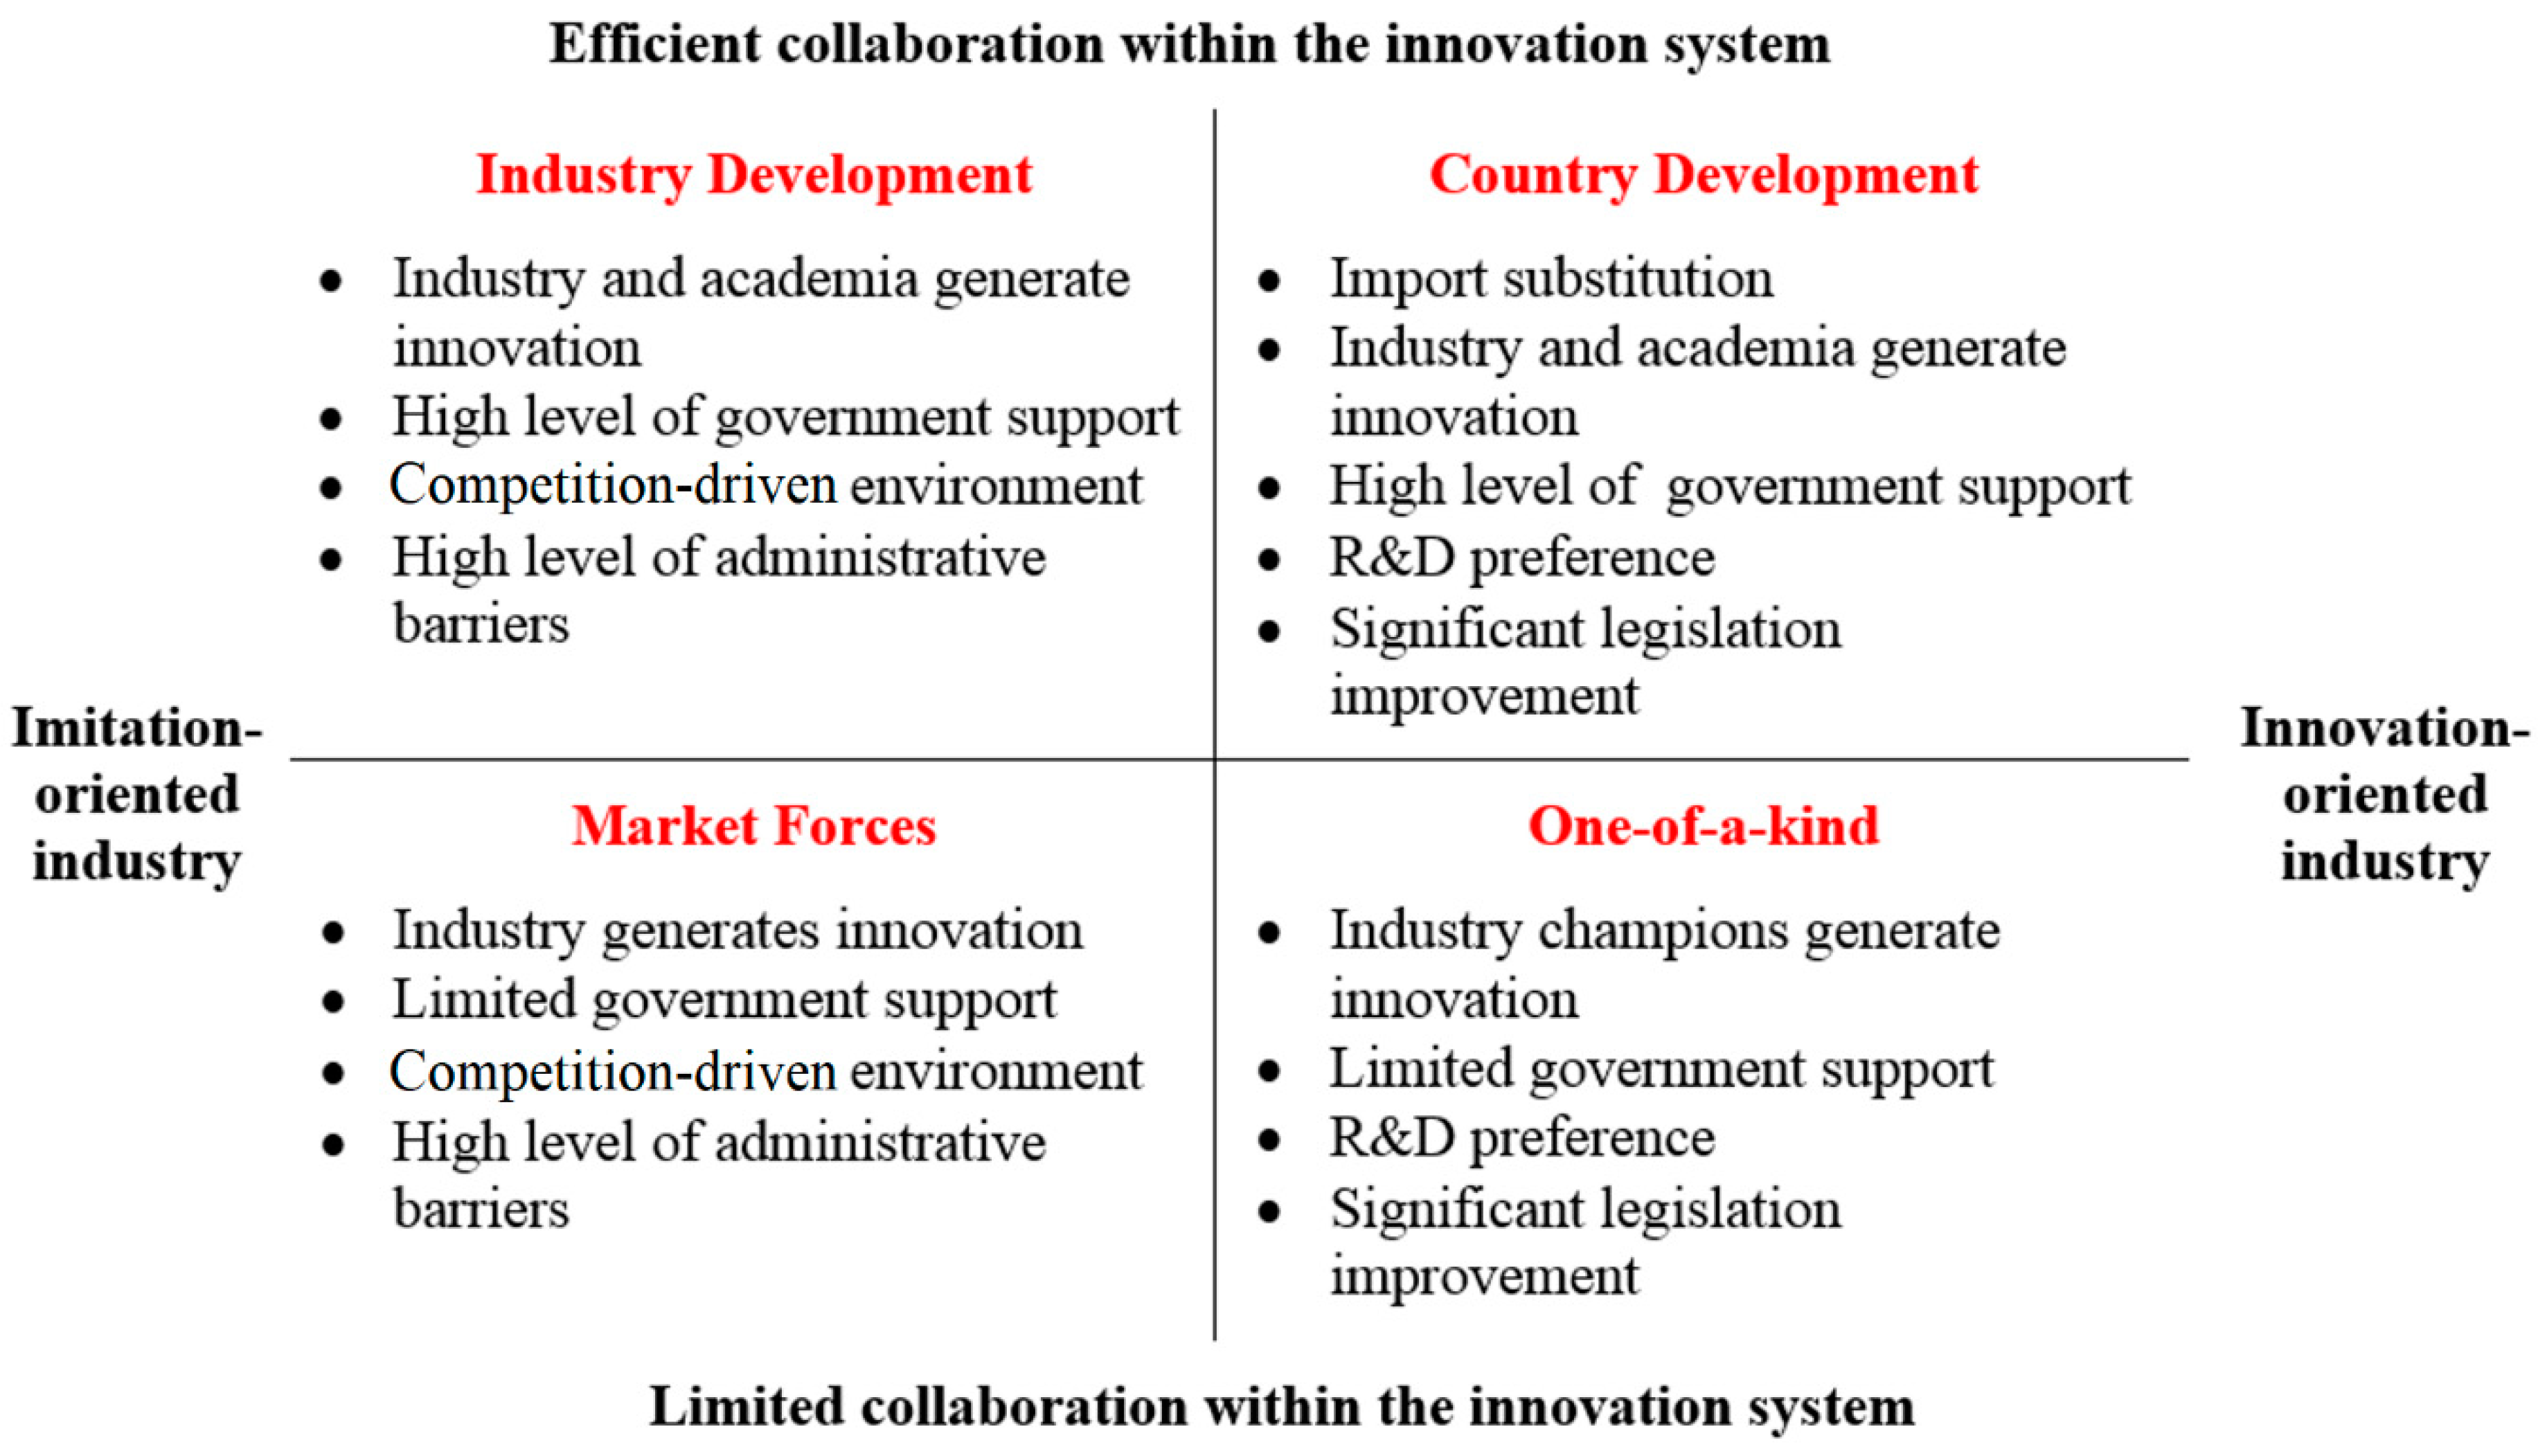
Table 1.
A comparison of strengths and weaknesses of techniques used for SD model building.
| Method | Strengths | Weaknesses | T * | C | L | I | C | P | D |
|---|---|---|---|---|---|---|---|---|---|
| GMB |
|
| High | High | High | No | Yes | No | Yes |
| MM |
|
| High | High | High | No | Yes | No | Yes |
| GT |
|
| High | High | Low | No | No | Yes | Yes |
| DM |
|
| High | High | Moderate | Yes | No | Yes | No |
| IPSM |
|
| Moderate | Moderate | High | Yes | No | No | Yes |
* T = time taken for a model development; C = cost of a model development approach; L = social learning among stakeholders participating in the modelling process; I = ability to incorporate different stakeholders’ opinion in separate sessions (i.e., flexible inclusiveness); C = requirement for group consensus at workshops; P = requirement for a large number of participants for a model development; and D = ability to deal with complex problems.
Table 2.
Participation of stakeholders in each stage of the IPSM process.
| Task | Purpose | Input | Output | Stakeholder Engagement Form | Sample Questions |
|---|---|---|---|---|---|
| Modelling stage 1. Problem scoping | |||||
| Exploratory study |
| Proposed research goals and objectives, comprehensive literature review |
| Questionnaire survey and one-on-one semi-structured post hoc interviews |
|
| Modelling stage 2. Conceptualisation | |||||
| Identification of the key variables |
| Comprehensive literature review and exploratory study outcomes |
| One-on-one consultations with expert stakeholders (here after experts) |
|
| Structural analysis using the MICMAC technique |
| Expert opinion and judgment |
| Opinion survey through one-on-one structured interviews |
|
| Confirmation of the system boundary |
| Final conceptual model based on the MICMAC analysis |
| Three facilitated 2-h workshops |
|
| Modelling stage 3. Dynamic model formulation | |||||
| Initial SD model development |
| Preliminarily SD model produced based on the previous modelling steps |
| A facilitated 1-day workshop |
|
| Equation writing and parametrization |
| Initial SD model of the construction innovation system |
| A facilitated 1-day workshop |
|
| Modelling stage 4. Model analysis | |||||
| Model validation and calibration |
| Refined SD model representing the problem of innovation diffusion in the construction industry |
| One-on-one expert consultations |
|
| Modelling stage 5. Model use and recommendations | |||||
| Scenario and policy analysis |
| Final SD model |
| One-on-one expert consultations |
|
Notes: Task = research steps within each of the five modelling stages participants were involved into; Purpose = goals that researchers targeted to achieve within each research step/task; Input = previous research steps outcomes and/or data needed to successfully perform a particular task via stakeholder participation; Output = outcomes of the stakeholder involvement within each research step/task; Stakeholder engagement form = different methods to engage stakeholders and collect data (i.e., via surveys, interviews, workshops, consultations); and Sample questions = Questions participants were asked during interviews, workshops, consultations and so on.
Table 3.
Summary of the main feedback loops in CLD.
| Feedback Loops | Loop Name | Structure | Key Message |
|---|---|---|---|
| R1 | Industry motivation | Level of innovation → Quality of construction projects → Client’s satisfaction → Level of private R&D activity → Level of applied research → Level of innovation | Increase in construction companies R&D activity due to improving business performance |
| R2 | Government’s role | Level of government intervention → Government incentives → UIG partnership → UI R&D collaboration → Level of innovation → Level of applied research → Level of public R&D activity → Level of government intervention | Government involvement in the construction innovation process |
| R3a, R3b | Practical application | Level of applied research → Level of innovation → Level of applied research Level of applied research → Level of private R&D activity → Level of applied research | Necessity of research results application |
| R4 | Reduction of regulatory burden | Import substitution → Government regulations → Level of administrative barriers to innovation → UI R&D collaboration → Level of innovation → Level of applied research → Import substitution | Building environment for the development of domestic innovations |
| R5 | Need for innovation | Client’s demand → Level of private R&D activity → Level of applied research → Import substitution → Client’s demand | Requirements of the import substitution policy |
| B1 | Expectation of short-term profit | Level of innovation → Quality of construction projects → Final product cost → Profit maximization → Level of private R&D activity → Level of applied research → Level of innovation | Industry’s conservatism due to high expenses and insufficient short-term profits |
| B2 | Support for innovation | Level of private R&D activity → Level of government intervention → Government incentives → Level of private R&D activity | Necessity of additional support in order to boost an innovative activity |
| B3 | Overcoming isolation | Level of private R&D activity → Level of public R&D activity → UIG partnership → Level of private R&D activity | Implementation of policies that promote R&D collaboration |
Table 4.
Qualitative scale for the variables impacting attractiveness of innovation.
| Variable | Scale (%) | Characterisation |
|---|---|---|
| Administrative barriers | <20 | Acceptable |
| 20–39 | Medium | |
| 40–59 | High | |
| 60–79 | Excessive | |
| 80–100 | Insurmountable | |
| Government support | <20 | Insufficient |
| 20–39 | Poor | |
| 40–59 | Adequate | |
| 60–79 | Sufficient | |
| 80–100 | High | |
| Industry business performance | <20 | Poor |
| 20–39 | Unsatisfactory | |
| 40–59 | Satisfactory | |
| 60–79 | Good | |
| 80–100 | Excellent |
Table 5.
Identification of attractiveness of innovation index through MICMAC analysis.
| Variables Impacting Attractiveness of Innovation | Components of the Impact Variables (Used in the MICMAC Analysis) | Components’ Rate of Influence on the Level of Innovation | Impact Variables’ Rate of Influence | Weight of Variables Impacting Attractiveness of Innovation (%) |
|---|---|---|---|---|
| Administrative barriers | Level of administrative barriers to innovation | 68 | 68 | 41.2 |
| Government support | Government regulations | 46 | 54 | 32.7 |
| Government incentives | 63 | |||
| Level of government intervention | 54 | |||
| Industry business performance | Quality of construction projects | 48 | 43 | 26.1 |
| Client satisfaction | 41 | |||
| Profit maximization | 40 | |||
| 165 | 100.0 |
Table 6.
Government forecast and simulation results for the level of technological innovation (%).
| Year | Government Forecast | Simulation Results | ||
|---|---|---|---|---|
| RSCI, 2017 | RSCI, 2015 | Pessimistic (Baseline) | Optimistic | |
| 2015 | 2 | 2 | 2 | 2 |
| 2016 | 2.3 | 3.5 | 2.1 | 2.1 |
| 2017 | 2.6 | 4.2 | 2.2 | 2.5 |
| 2020 | 3.5 | 9 | 2.8 | 4.7 |
| 2025 | 4.5 | 14 | 4.6 | 10.2 |
| 2030 | 7 | 18 | 6.8 | 12.7 |
Table 7.
Input and output parameter values for pessimistic and optimistic scenarios.
| Parameters | Pessimistic (Baseline) Scenario | Optimistic Scenario |
|---|---|---|
| A: Input parameters | ||
| Business performance of construction companies (Index) | 0.4 | 0.7 |
| Level of government support (Index) | 0.4 | 0.8 |
| Level of administrative barriers to innovation (Index) | 0.7 | 0.2 |
| Rate of industry and academia collaboration | 0.011 | 0.017 |
| Rate of imitation | 0.22 | 0.33 |
| B: SD simulation output parameters | ||
| Attractiveness of innovation (Index) | 0.238 | 0.665 |
| Innovators (No. firms) | 3912 | 5281 |
| Imitators (No. firms) | 17,710 | 34,860 |
| Actual innovative companies (No. firms) | 21,620 | 40,140 |
| Level of innovation (%) | 6.8 | 12.7 |
© 2018 by the authors. Licensee MDPI, Basel, Switzerland. This article is an open access article distributed under the terms and conditions of the Creative Commons Attribution (CC BY) license (http://creativecommons.org/licenses/by/4.0/).
Share and Cite
MDPI and ACS Style
Suprun, E.; Sahin, O.; Stewart, R.A.; Panuwatwanich, K.; Shcherbachenko, Y. An Integrated Participatory Systems Modelling Approach: Application to Construction Innovation. Systems 2018, 6, 33. https://doi.org/10.3390/systems6030033
AMA Style
Suprun E, Sahin O, Stewart RA, Panuwatwanich K, Shcherbachenko Y. An Integrated Participatory Systems Modelling Approach: Application to Construction Innovation. Systems. 2018; 6(3):33. https://doi.org/10.3390/systems6030033
Chicago/Turabian StyleSuprun, Emiliya, Oz Sahin, Rodney Anthony Stewart, Kriengsak Panuwatwanich, and Yaroslav Shcherbachenko. 2018. "An Integrated Participatory Systems Modelling Approach: Application to Construction Innovation" Systems 6, no. 3: 33. https://doi.org/10.3390/systems6030033
Note that from the first issue of 2016, this journal uses article numbers instead of page numbers. See further details here.