Article

Urban Mines of Copper: Size and Potential for Recycling in the EU

Department of Industrial Chemistry “Toso Montanari”, University of Bologna, 40136 Bologna, Italy
*
Author to whom correspondence should be addressed.
Resources 2017, 6(1), 6; https://doi.org/10.3390/resources6010006
Submission received: 29 November 2016 / Revised: 18 January 2017 / Accepted: 18 January 2017 / Published: 24 January 2017

Abstract

:
Copper is among the most important metals by production volume and variety of applications, providing essential materials and goods for human wellbeing. Compared to other world regions, Europe has modest natural reserves of copper and is highly dependent on imports to meet the domestic demand. Securing access to raw materials is of strategic relevance for Europe and the recycling of urban mines (also named “in-use stock”) is a significant mean to provide forms of secondary copper to the European industry. A dynamic material flow analysis model is applied to characterize the flows of copper in the European Union (EU-28) from 1960 to 2014 and to determine the accumulation of this metal in the in-use stock. A scrap balance approach is applied to reconcile the flow of secondary copper sent to domestic recycling estimated through the model and that reported by historic statistics. The results show that per capita in-use stock amounts at 160–200 kg/person, and that current end-of-life recycling rate is around 60%. The quantification of historic flows provides a measure of how the European copper cycle has changed over time and how it may evolve in the future: major hindrances to recycling are highlighted and perspectives for improving the current practices at end-of-life are discussed.

Graphical Abstract

1. Introduction

Copper (Cu) is among the most important metals by production volume and variety of applications, providing essential materials and goods for human wellbeing. Compared to other world regions, Europe has modest natural reserves of Cu [1,2] and is highly dependent on imports to meet the domestic demand. Securing access to raw materials is of strategic relevance for Europe and in 2010 the European Commission (EC) created a methodology [3] to classify raw materials deemed critical on the basis of two indicators: the economic importance of a given material in the European economy and its potential supply risk. The methodology was first applied in 2011 and a revision followed in 2014. None of the two assessments identified Cu as a critical raw material for Europe: overall, a medium economic importance is attributed to Cu but a negligible supply risk is computed for this metal [3,4].
Other methodologies have been developed in the past years by governments and institutions and although the criticality evaluation is performed considering more or less similar dimensions (i.e., economic relevance, supply risk, and environmental implications), the way in which indicators are calculated varies considerably method by method [5,6,7,8,9]. If the economic importance of Cu is beyond doubt considering the unique properties of this metal employed for many everyday uses, the risk of supply constraints seems to be more debatable. In particular, when other factors that can limit future material supply are considered such as the mine production peak [2], or the vulnerability to supply restrictions due to the absence of adequate substitutes [10], the criticality level of Cu increases. Variations between different criticality assessments and for different geographical levels are understandable [11]. Also, concerns about mine production peaks and mineral reserves’ adequacy to satisfy future Cu demand are downsized when all the potentially extractable resources are taken into account, reducing the matter to the way the society can extract the maximum value from resources through its production and consumption patterns [12].
In this context, recycling is universally considered as an effective action to secure access to raw materials; for Cu, eliminating losses during and after use is estimated to determine up to 25% reduction in the global primary Cu input [13]. In fact, Cu is among the most recycled metals, but its global end-of-life recycling has modest performance [14,15]. In light of the prospective of future Cu demand [16], improving Cu recycling rates is necessary to enhance Cu supply and the recycling of urban mines (also known as above-ground reserves or in-use stock, IUS) is a significant mean to provide valuable forms of secondary Cu.
A quantitative evaluation of Cu scrap generated is a pre-condition for efficient recovery. Material flow analysis (MFA) is among the most suitable and versatile techniques to balance physical flows along the lifecycle of a target material [17]. MFA was applied to investigate the anthropogenic cycle of several materials such as construction minerals [18,19] and plastics [20,21,22]. Metals, however, captured most of the research interest due to their importance in modern technology and strong correlation with the human development [23]. In recent years, several studies have analyzed the anthropogenic Cu cycle at different geographical levels, providing a measure of several performance indicators (e.g., end-of-life recycling rate, EOL-RR). Most of these studies applied MFA as a systematic evaluation of flows and stock over time or for a given year. Ayres et al. (2002) provided a pioneer perspective on the lifecycle of Cu and on the future of Cu recycling [24]; Graedel et al. (2004) presented a first characterization of global and regional Cu cycles [25]; Gerst (2009) built on MFA results a perspective on possible Cu IUS scenarios [26]. More recently, Glöser et al. (2013) applied dynamic MFA to global Cu flows, providing novel information on recycling indicators [15]. At the European level, the Yale Stock and Flows model was applied extensively to investigate the multilevel anthropogenic Cu cycle and considerable attention was given to the characterization of Cu flows at end-of-life [27,28,29,30]; Ruhrberg (2006) assessed the recycling efficiency of Cu from end-of-life products in Western Europe [31].
Although these studies have provided an outstanding knowledge of the anthropogenic Cu cycle in Europe, major results are dated as they refer to the second half of the 1990s. Considering (i) the rapid increase of the metal demand in developed economies; (ii) the relevance of Cu in the European metal industry; and (iii) the importance of Europe in the global Cu cycle, we believe that an update of the European Cu flows and stocks is timely and needed. In this study, the European (EU-28) Cu cycle is analyzed by dynamic MFA from 1960 to 2014. The historic perspective adopted in this work provides a novel insight on how Cu flows have evolved over the years and enable a perspective on improvements to increase secondary Cu flow. The results of this analysis are expected to contribute positively to enhance the Cu recycling industry in the region and to constitute a basis for further assessments.

2. Methods

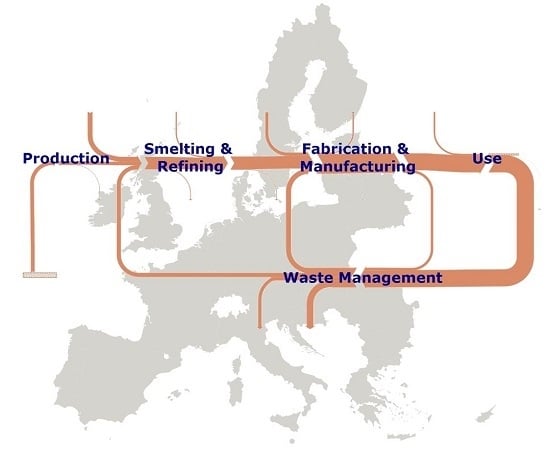
2.1. The Anthropogenic Lifecycle of Cu

Sulfide ores and Cu oxides are the main virgin sources of primary Cu. Cu is converted to its metal form through several pyrometallurgical steps, which encompass extraction and comminution of the mineral, roasting, smelting, converting, and refining. Cu anodes, which are the product of the smelting step, are refined electrolytically to increase the purity of the Cu metal form. The hydrometallurgical route bypasses smelting and involves leaching, solvent extraction and electrowinning stages. Cu cathodes, which are the refining output, enter fabrication and manufacturing stages in which the unwrought Cu forms are shaped to semifinished goods and employed in end-use products. A large fraction of refined Cu is remelted before the creation of shapes for alloying purposes. Copper alloys have the total content by weight of alloying elements other than Cu at >2.5%; most common Cu alloys are brasses (Cu-Zn alloys), bronzes (Cu-Sn alloys), cupro-nickel (Cu-Ni alloys), nickel silvers (Cu-Ni-Zn alloys), and aluminum bronze (Al-Cu alloys). For simplicity, hereafter we use the term Cu for indicating both Cu and Cu alloys.
Obsolete Cu products that are discarded at end-of-life are collected for recovery or disposed. The majority of Cu waste that is collected for recovery undergoes functional recycling in which Cu functionality is preserved in new products. Some of the Cu can be entrapped in alloys that follow other management routes in which Cu is lost as a tramp element; for instance, Cu in steel alloys remains an impurity and brings no functionality to the recycled steel. According to common definitions, secondary Cu sources include either residues from fabrication and manufacturing stages (known as new scrap) and Cu waste and scrap generated at end-of-life and collected for recycling (i.e., old scrap). Depending on the scrap quality, secondary Cu flows can follow two main routes: direct remelting, in which high quality Cu scrap is melted directly by fabricators, and secondary smelting, in which the Cu scrap of lower quality needs further refining before its utilization in new materials and goods. Most new scrap undergoes direct remelting. Old scrap is generally treated through secondary smelting, but some obsolete Cu products are suitable to direct melting leading to a partition between the fates of old scrap.

2.2. The European Cu Model

A dynamic MFA model was created using Microsoft Excel® and applied to quantify Cu flows from 1960 to 2014 in the European Union (EU-28). For each main phase of the Cu lifecycle, the model accounted for inflow, outflows, process efficiencies, losses, and accumulation in the IUS. A detailed description of the MFA model (Figures S1–S2), accounting equations, data sources and major assumptions (Tables S1–S10) is reported in the Supplementary Materials. The expanded perspective on Cu flows and related IUS proposed in this work has required considerable gathering of accurate input data. Because several assumptions and proxy data were employed in the modeling, we have evaluated the confidence of our estimates through data reconciliation using the Substance Flow Analysis (STAN) software [32].
Historic information on domestic production of Cu commodities was found for annual mine extraction, smelting production, primary and secondary refined production, and for fabrication of semifinished goods in metal statistics yearbooks [33]. End-use market shares were employed to disaggregate the utilization of Cu into its major applications: building and construction, electrical and electronic products, industrial machinery and equipment, transportation equipment, consumer and general products. Examples of Cu goods covered by each end use sector are reported in Table 1. Historic market shares data were obtained for selected years from the International Wrought Copper Council backwards to 1987 [34]; for 2008–2014, the Thomson Reuters GFMS reports were consulted [35]. Values for the missing years between 1987 and 2008 were interpolated, while US data were used as proxies for 1960–1986 [36]. Uncertainty associated with domestic production values reported in literature and historic market shares was assumed to be negligible. New scrap was modeled according to fabrication and manufacturing recovery efficiency rates as reported in [15]. According to the same source, 90% of new scrap was assumed directly melted and the remaining 10% entered the old scrap market.
European trade statistics were considered to quantify imports and exports of commodities containing Cu; historic records were mainly derived from the United Nations Commodity Trade Statistics database [37]. Because these flows are expressed in terms of product weight, mass conversion factors were required to transform this information into Cu weight; to this aim, average Cu contents for ores and concentrates, unrefined and refined Cu forms, semifinished and finished goods were applied [28,31,38,39]. Uncertainty ranges were set arbitrarily based on a common sense of the uncertainty affecting this type of trade flows [40], i.e., an uncertainty range at ±10% was considered for imports and exports from mining through fabrication because Cu forms embedded in these stages have well known Cu contents and relatively low variability. For finished goods, the percentage of Cu content can vary remarkably compared to the mean values because material breakdown may have changed either due to innovation and progress in manufacturing design and processing over time. Other uncertainty is due to different composition of materials and goods that are grouped together under the same classification code. Traded flows of finished goods were attributed ±20% uncertainty.
The amount of Cu apparently consumed (i.e., domestic production + imports − exports) in end-uses constitutes the final demand of Cu or the flow into use. A top-down approach was followed to determine the accumulation of Cu in the IUS. Such an approach considers the Cu flow into its major uses and then lifespan distribution models are applied to simulate the generation of scrap and obsolete products at end-of-life. In-use dissipation losses are estimated according to the methodology described in [42]. The conservation of mass performed for each year of the analysis provided an estimate of the cumulative Cu IUS.
Annual Cu flows out of use generated from each application sector were aggregated into five waste type categories [15] to enable a representative modeling of the regional waste management. Collection and preprocessing rates [31] for construction and demolition waste (C&D), electrical and nonelectrical industrial waste (IW), end-of-life vehicles (ELV), waste of electrical and electronic equipment (WEEE), and municipal solid waste (MSW) were applied to compute the amount of Cu old scrap domestically recovered for recycling in a given year. This flow was further increased by the amount of new scrap not directly recycled by fabricators in the same year. In turn, a fraction of Cu old scrap with high quality returned to fabrication and manufacturing: in the model this flow is computed as difference between the reported Cu input to direct melting and the estimated amount of new scrap used directly for fabricated goods. Annual net-imports of Cu waste and scrap were estimated from metal statistics yearbooks [33]; old scrap have generally high variability in terms of metal content and ±20% of uncertainty was assumed for trade flows of Cu waste and scrap.
The remaining fraction of Cu scrap was modeled to input the secondary domestic production of Cu cathodes. Historic records for secondary Cu cathodes production reported in [33] enabled a scrap balance approach to reconcile [32] the amount of Cu scrap sent to domestic recycling estimated by the model with the amounts reported by producers. Uncertainty associated with endogenous values was determined by means of the error propagation law. Standard deviation either attributed or computed through the model embodies different types of uncertainty, varying from bias in annual data records, ranges of Cu content in materials and goods, hidden flows such as trade of second-hand goods and Cu contained in informal/illegal trade of goods. These types of uncertainty may contribute differently along the Cu’s lifecycle and a clear disaggregation among them was not possible to achieve because of lack of information.

3. Results

We show the cumulative EU-28 Cu cycle in Figure 1 and the best estimate for 2014 in Figure 2. The main lifecycle phases (i.e., mining, smelting, refining, fabrication, manufacturing, use, and waste management are displayed as dark red bars, while brownish arrows are made proportional to the magnitude of Cu content. The two cycles have different base years and the magnitude of Cu flows has changed over the time span considered; however, no major differences are notable in the two figures: the EU-28 has reached a well-established and stable network of Cu industries that cover the entire lifecycle of this metal. We describe the 2014 cycle in more detail as a snapshot of the contemporary Cu cycle in Europe and compare historic evolution of traded flows, IUS accumulation, and secondary Cu production to provide novel insights for improving Cu scrap recycling.

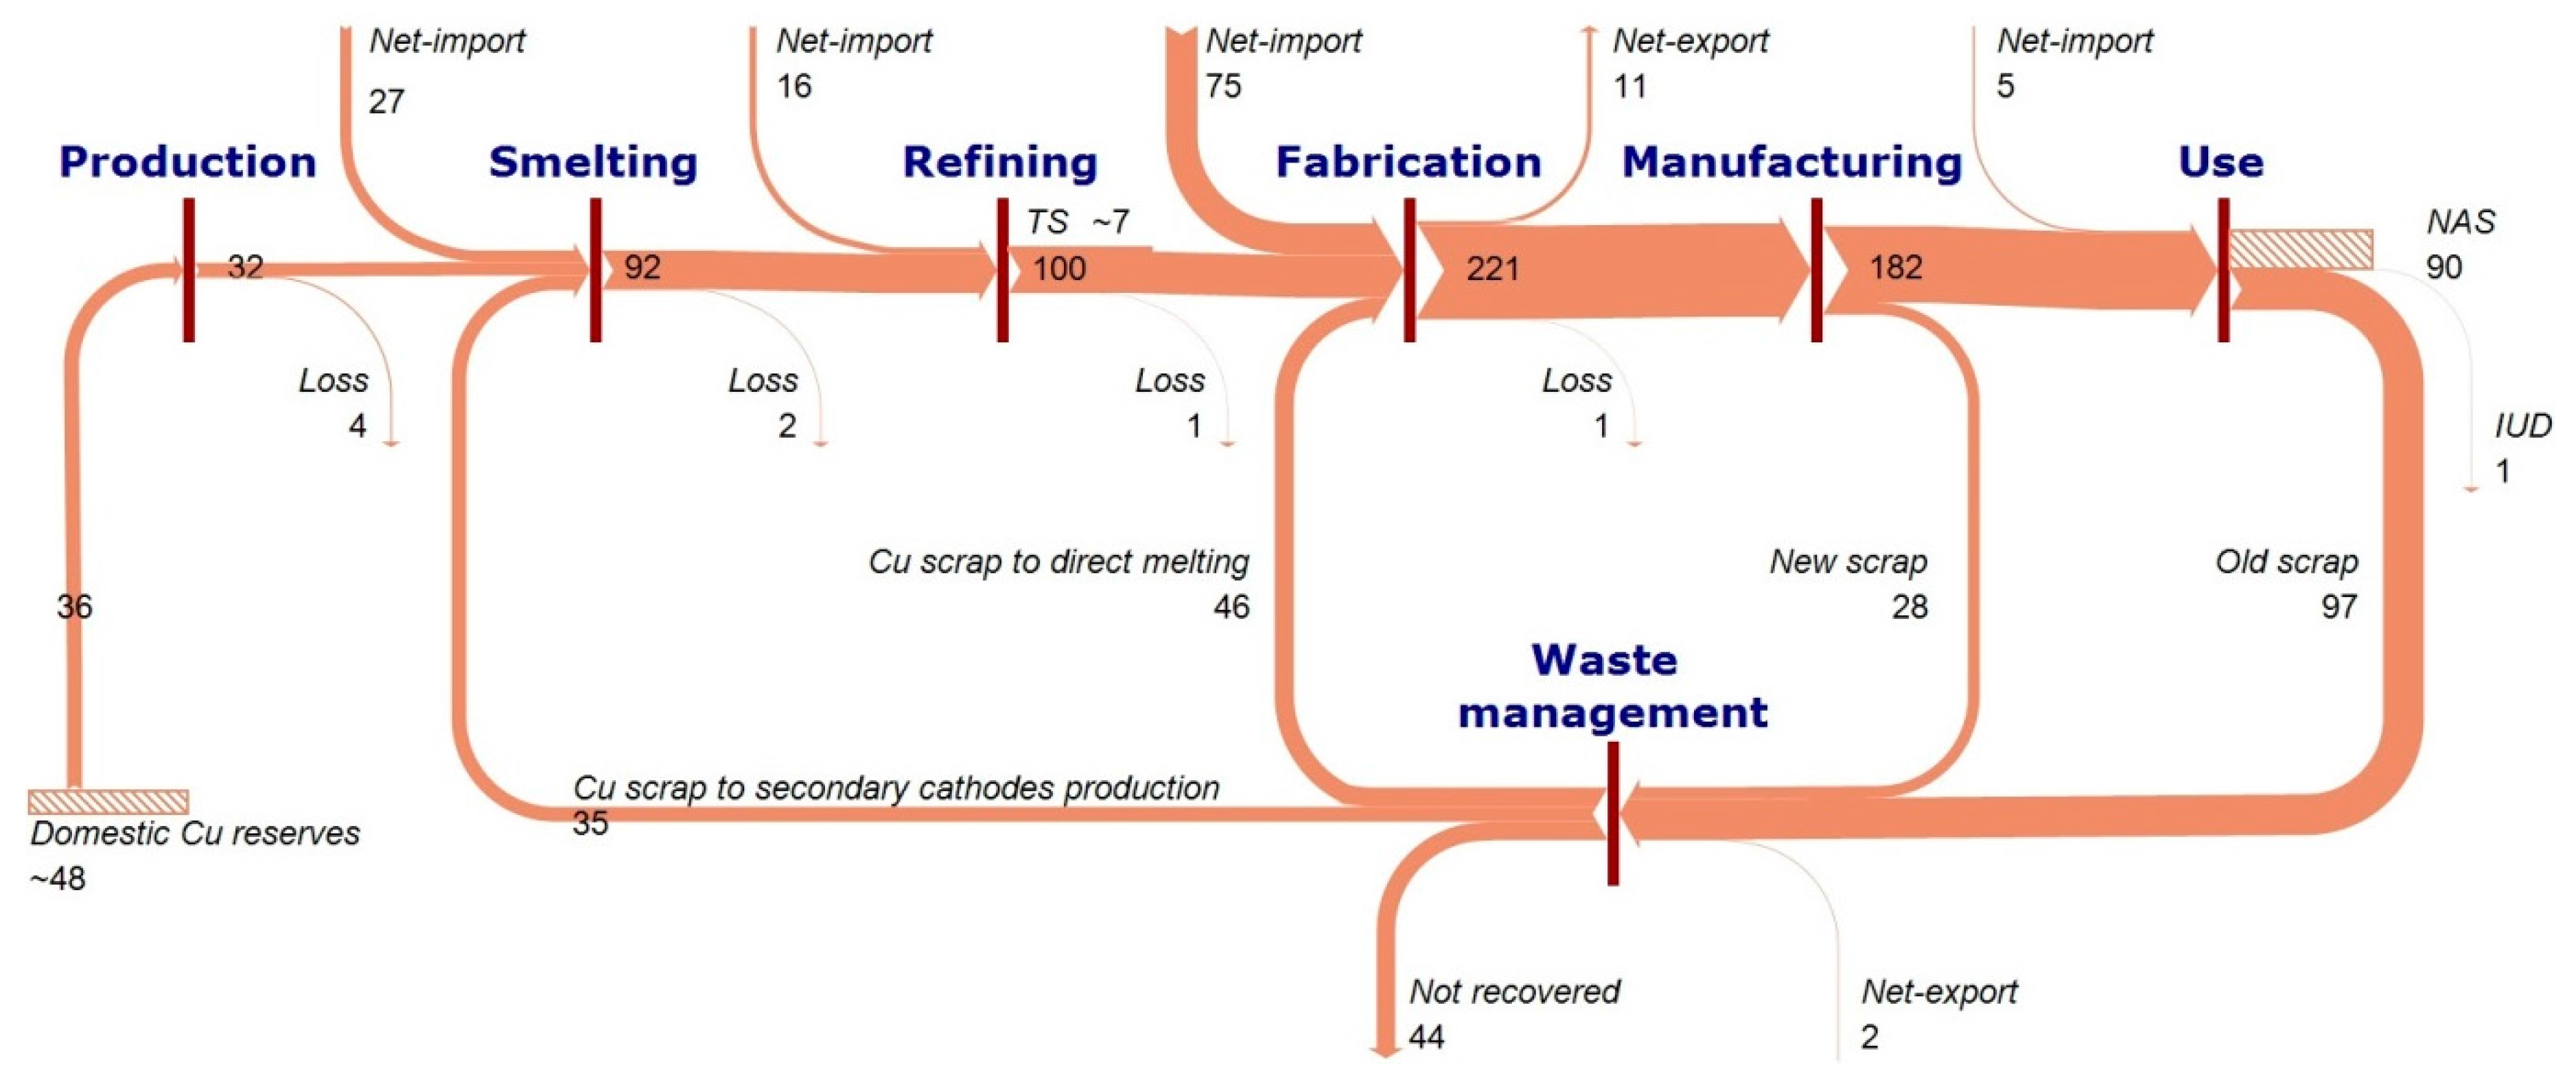
3.1. The Contemporary Cu Cycle

About 800 Gg of Cu from virgin ores were extracted in Europe in 2014. This amount represents about half of the regional demand of primary Cu and required a net-import of (i.e., import − export) 1000 Gg Cu in concentrates. Including secondary smelting production, total unrefined Cu production amounted to ~2450 Gg that, together with the additional amount of 264 Gg Cu coming from trading partners, determined an input of more than 2700 Gg to domestic refining. The domestic apparent consumption of refined Cu forms (i.e., domestic refined production + net-imports of Cu cathodes), amounted to more than 3200 Gg and fed fabrication of semifinished goods such as Cu profiles, bars, rods, sheets, plates, strips, foils, tubes, pipes, wires, castings, powder, and flakes. New scrap coming from manufacturing and old scrap with high quality and directly melted by fabricators resulted in a further addition of 1044 Gg Cu. Of the total amount of Cu utilized in fabricated goods (i.e., ~4000 Gg Cu), less than 10% was net-exported while European manufacturers employed the remaining part for the creation of finished products. Cu in end-use applications amounted to about 3500 Gg; the additional net-imports of ~340 Gg Cu contained in finished products, resulted in a total Cu flow into use of about 3800 Gg. Many end-use applications of Cu have relatively long lifespans, retaining the metal in the IUS for decades. The difference between the amount of Cu into use and the amount of Cu discarded in obsolete products at end-of-life and waste (estimated by means of a top-down approach, see the Supplementary Materials for more details) in a given year constitutes the net-addition to the IUS: in 2014, this quantity amounted to about 284 Gg Cu. The largest amount of Cu scrap was generated by the construction and demolition waste (~1555 Gg), followed by MSW and WEEE (~870 Gg), IW (~725 Gg), and ELV (~355 Gg). Due to inefficiency during collection and processing of Cu waste, of the total amount of scrap generated, about 40% was not recovered and disposed. This fraction includes also Cu flows that undergo non-functional recycling. About 2100 Gg of Cu old scrap entered the scrap market after collection and separation; the addition of ~50 Gg of new Cu scrap from manufacturing increased by a little the total amount of scrap available for secondary production. Of this amount, more than 700 Gg Cu were exported to trading partners (mainly China), 562 Gg Cu were demanded for direct melting and 872 Gg Cu fed domestic secondary smelters.

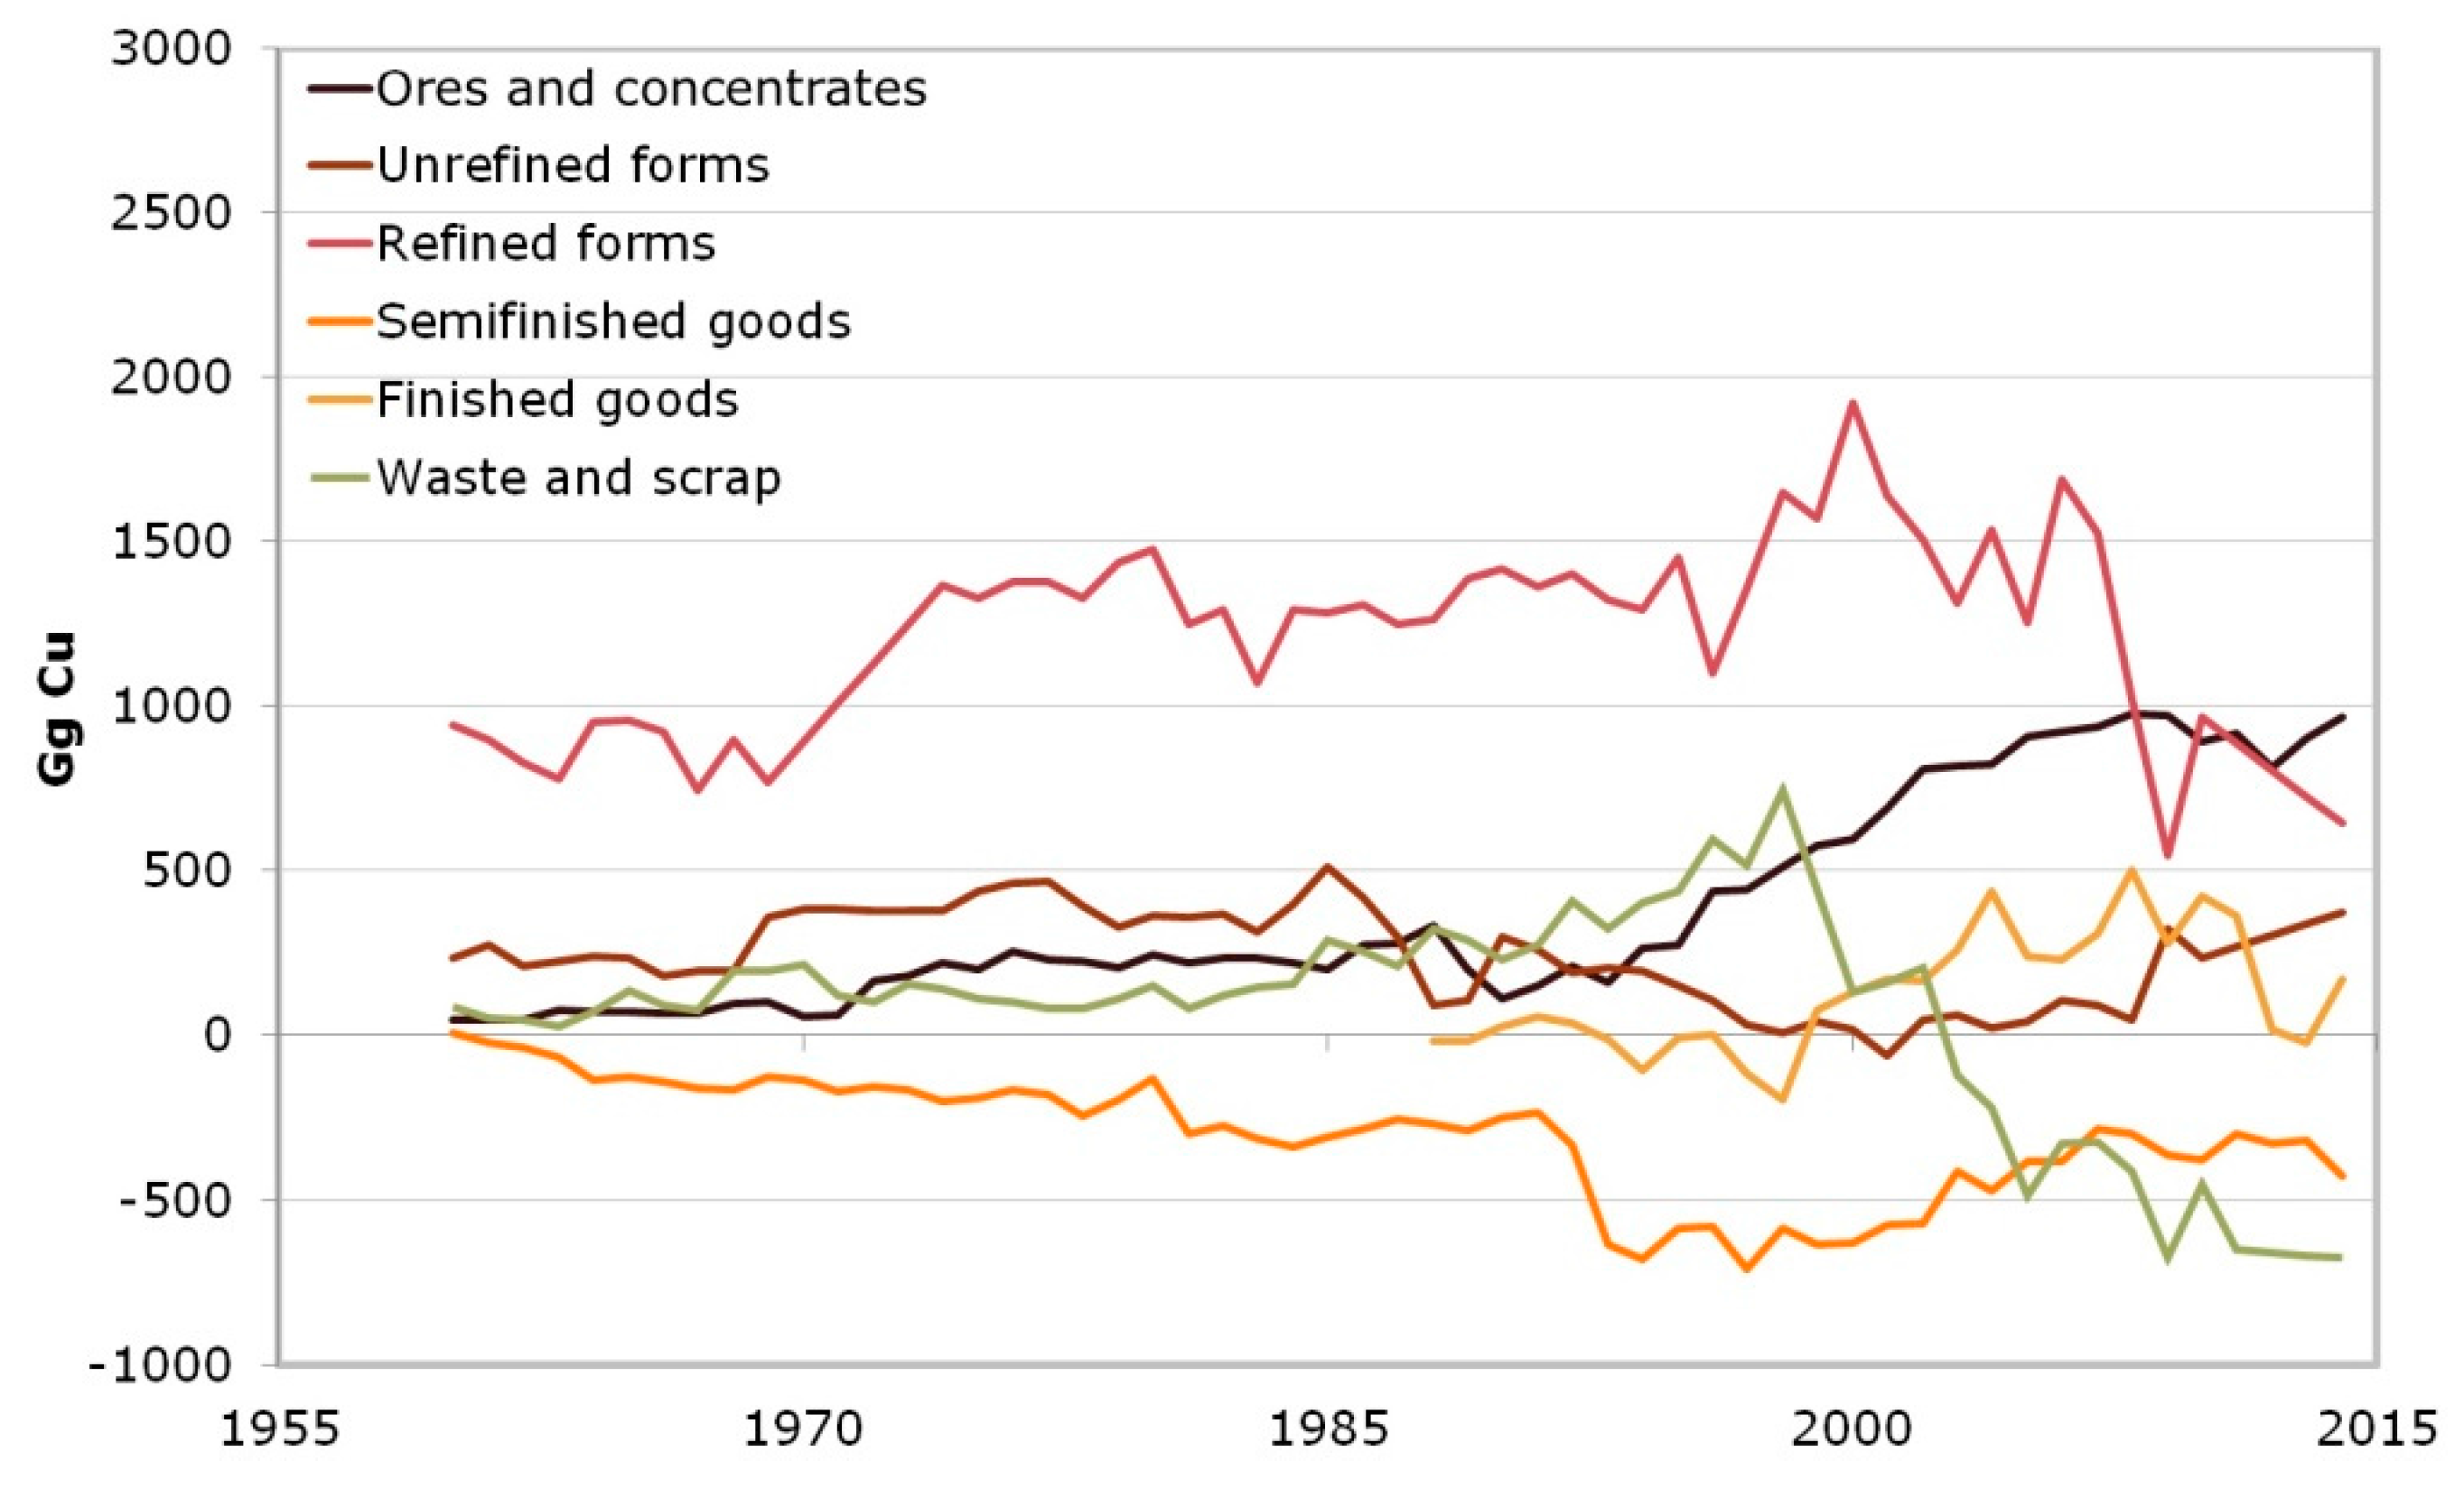
3.2. Historic Evolution of Trade Flows of Cu

Figure 3 shows the historic evolution of net-imports (i.e., imports−exports) of major Cu forms (concentrates, unrefined, refined, semifinished, finished goods, and scrap). Overall, from 1960 to the late 1980s, net-import trends remained relatively stable. Historically, the EU-28 is characterized by a large reliance on imports of Cu in concentrates, unrefined and refined forms, semifinished and finished goods to meet the domestic demand. The Net-Import Reliance (NIR) indicator for the region, computed as sum of net-imports of Cu forms from production through manufacturing divided by the total apparent Cu consumption, shows fairly stable median rates at 43% ± 6%. This indicator is commonly used as a metric to quantify the reliance of a country from world imports of a given commodity and, hence, contribute to the potential vulnerability of a system from supply constraints [43]; for the EU-28, about half of Cu demand relies on Cu supply produced outside the region.
At the beginning of the 1990s, significant changes in historic trends appeared: in particular, net-imports of Cu concentrates and finished goods began to increase. At the recent financial crisis peak (2007–2009), a fall in the net-imports of Cu cathodes, semifinished and finished goods occurred. Net-import trend of Cu scrap shows a different pattern: it remained relatively stable from 1960 to the second half of the 1980s, increased from the 1980s through the end of the 1990s, and from the 2000s has decreased at faster rates and resulted in net-exports of Cu scrap from Europe to third countries.

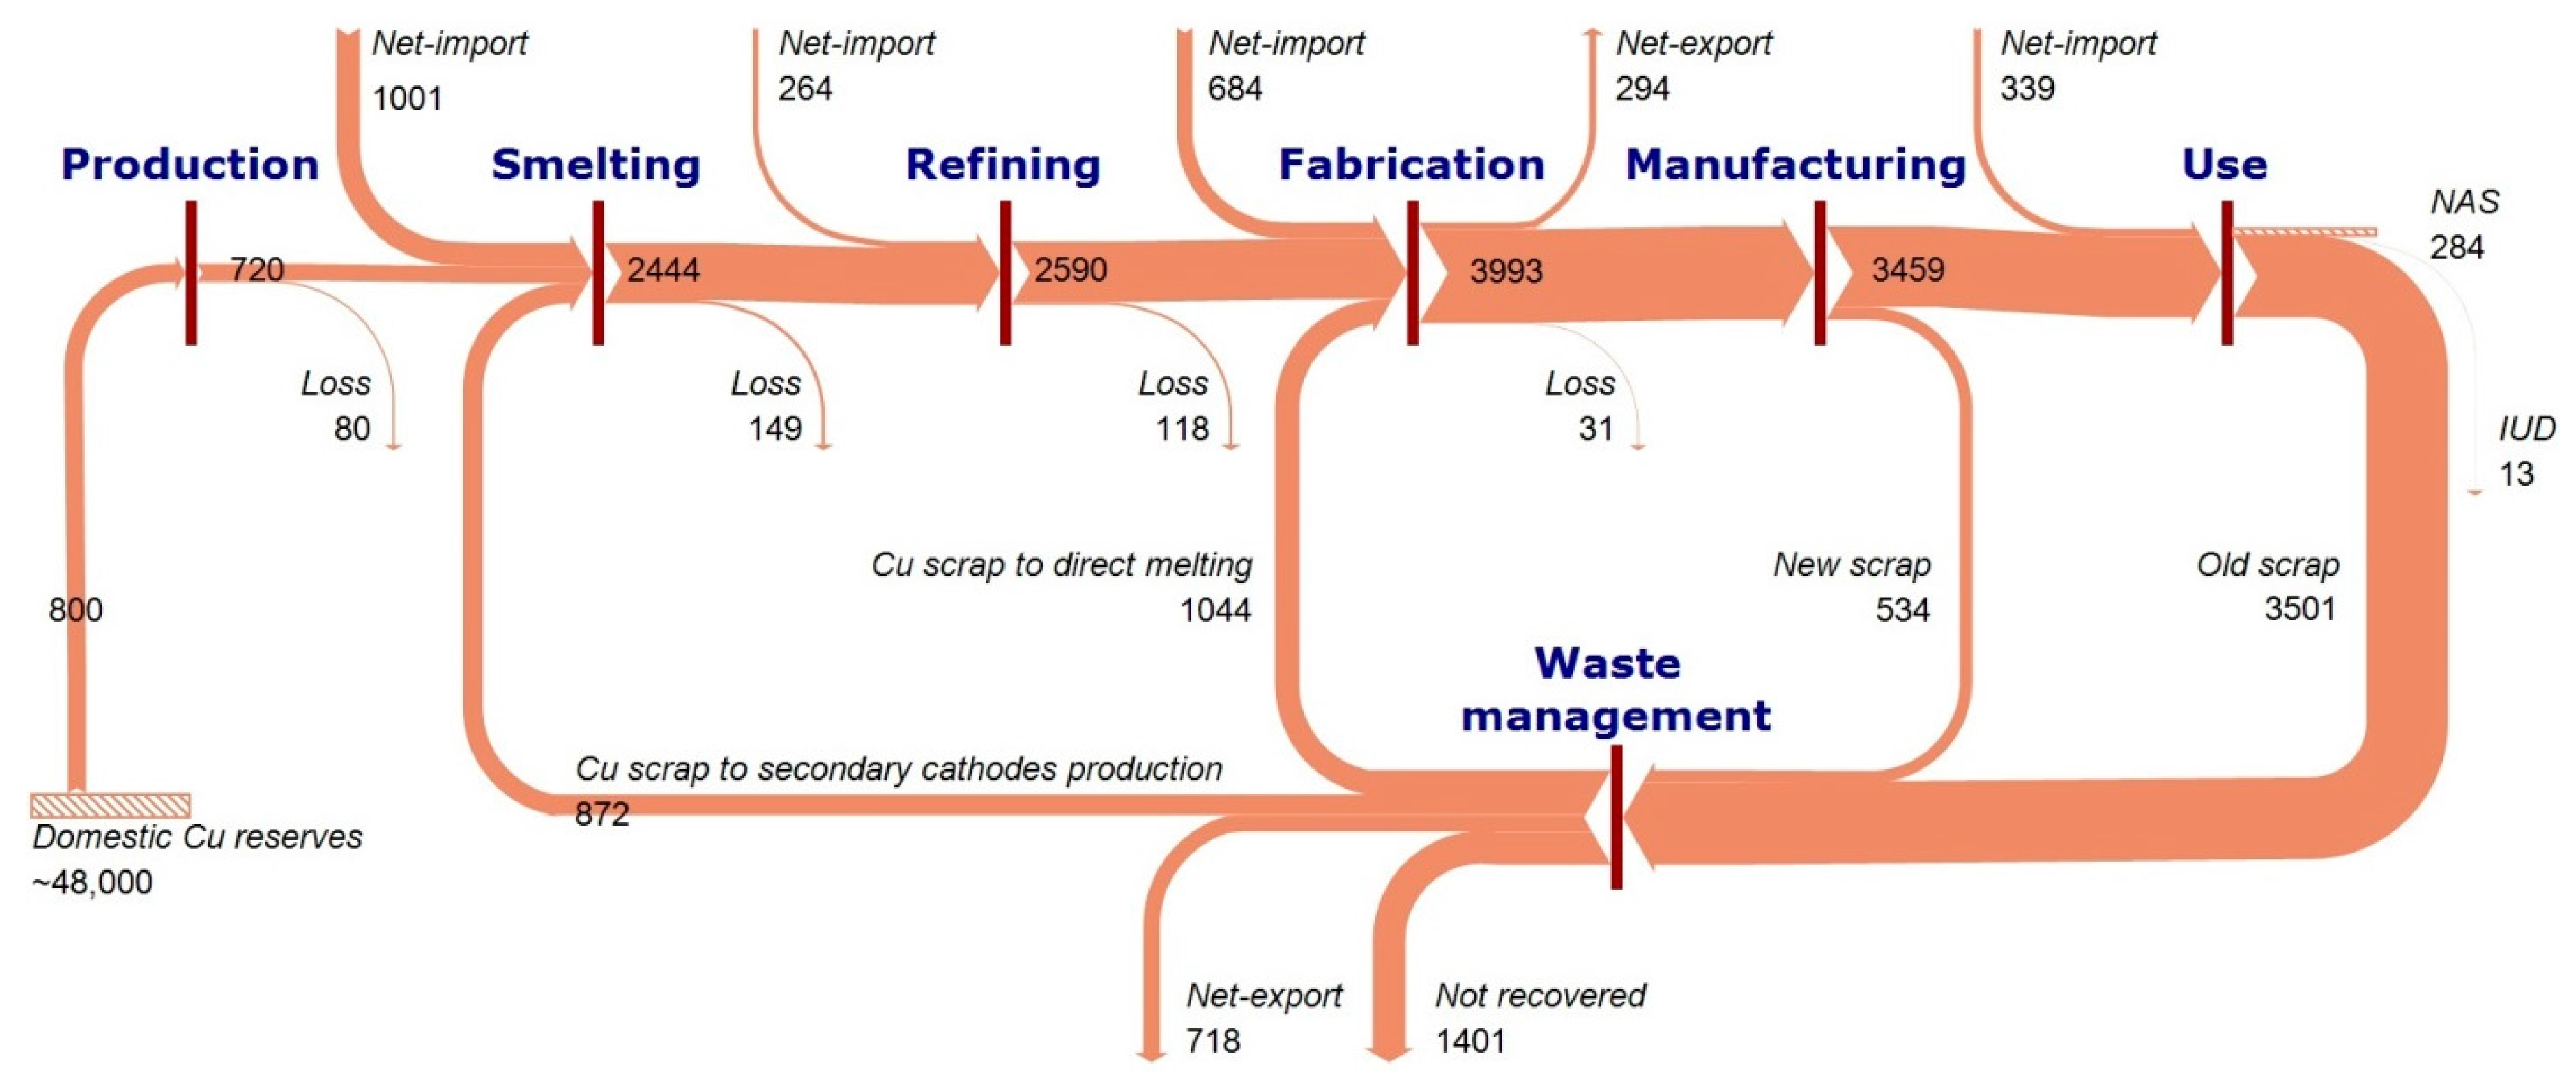
3.3. Accumulation of Cu in Regional Above-Ground Reserves

From 1960 to 2014, about 91 ± 11 Tg Cu were accumulated in the European IUS: this anthropogenic reserve is about two times the known remaining natural Cu reserve in the region (~48 Tg, [1]). The magnitude of this entity is aligned with global results [15] and comparable to the 1999 estimate (i.e., 80 Tg, [31]). If divided by the total European population (~507 million inhabitants in 2014), the regional Cu IUS corresponds to an average of 180 kg Cu/capita (160–200 kg Cu/capita), similar to the results for other developed economies [44,45,46]. Over the time span investigated, the accumulation of Cu in building and construction and electrical and electronic products has increased notably and today these two sectors cover more than 70% of the regional IUS. The remaining Cu fraction is mainly embedded in industrial applications, followed by transportation equipment and general goods.
The accumulation of Cu in IUS responds to the demand of products and services. The achievement of a stable saturation IUS level is among the hypothesis that could induce a potential reduction of the metal demand. In case of IUS saturation, the demand of a given material would be needed to maintain the level of per-capita IUS: in other words, the demand of new products would be required only to replace products that reach their end-of-life at 1:1 substitution. Several studies investigated clues of a potential IUS saturation, but most results demonstrated that for many materials a decoupling between economic activity and resource use is not evident yet [22,47]. A probable saturation of the per capita IUS of iron and steel seems to characterize the US, followed by major world economies as demonstrated in [48]. Applying the same approach to the anthropogenic Cu cycle in the EU-28, no evidence of saturation appears yet and, if any, the regional IUS saturation seems unlikely to occur in the short- or medium-term (see Figure S3 in the Supplementary Materials).

3.4. Cu Recycling Indicators

The European Cu demand has increased almost linearly since 1960. Most of supply derived from primary Cu sources. Refined production of secondary Cu peaked at about 1000 Gg/year at the end of the 1990s then decreased and remained stable around 800 Gg/year. The share of secondary Cu refined as a fraction of total Cu refined has historically fluctuated between 20% and 40% in the region, resulting in a median value of 30%. If the amount of secondary Cu directly melted by fabricators is included, the median value increases at 36% as percentage of the total fabrication input. Secondary Cu directly melted divides evenly between new scrap and old scrap. The share of old scrap of high quality that is melted directly by fabricators represents stably 15%–20% of total old scrap collected and processed for recycling.

4. Discussion

The results of this study show that a consolidated recycling industry has been reached in Europe. Cu recycling indicators for the EU-28 are aligned with global averages [15], although the regional situation shows a (slightly) better performance. However, such performance has remained fairly stable over years and a discussion of how to increase Cu recycling in Europe is under debate [49]. Major factors that have likely influenced this trend can help to draw some considerations for the possible evolution of the Cu recycling chain and potential implications in the global anthropogenic Cu cycle. Factors limiting a closure of Cu flows in the region include technological, societal, and economic challenges.
Among the recycling-related limitations, scrap availability and recycling inefficiency reduce the amount of secondary Cu that could replace primary metal input. As depicted in Figure 4, Cu shows the exemplary delay of scrap generation compared to annual flows into use: this delay is quantified at about 25–30 years. The employment of Cu in end-use sectors with relatively long lifetime such as building and construction extends that delay. On the other hand, the shortening of average lifetimes of certain product categories (e.g., household appliances and electronics), can reduce the delay of Cu scrap generation.
Figure 4 also shows that as long as Cu demand increases, Cu scrap supply cannot replace entirely primary Cu supply. In practice, such a gap is made even wider because inefficiency during waste collection and pre-processing prevents full recovery of Cu from old scrap. Attention to measures for improving waste collection and separation has been the focus of most recycling initiatives and European legislations as exemplified by the European Directive on ELV and WEEE [50,51]. These two waste categories have modest EOL-RR rates for most constituting materials with the exception of iron/steel and aluminum, which are generally recovered at higher rates. Thus, margins for improving Cu recovery from these products are substantial. Recent European interest has focused on WEEE recycling because this type of waste has increased in magnitude in the last decades and it is generated from a wider range of products as more electronics is used in everyday applications. As claimed by the EC, tighter controls on this waste would contrast illegal exports: a considerable fraction of WEEE moves from developed countries to developing countries under the false heading “reuse” or “donation” with little or no information on its real fate [49].
Enhancing Cu recycling from WEEE and ELV is crucial to increasing the amount of Cu available for recycling to the greatest level possible. However, as depicted in Figure 5, WEEE and ELV contribute less than C&D in terms of annual scrap generated. The estimate for the current IUS in building, construction, and infrastructure supports the hypothesis that this trend is likely to continue in the medium-term as more Cu embedded in buildings and infrastructure will be discarded. C&D waste has a relatively high quality of Cu scrap and an ease of separation that determine respectable EOL-RR rates >70%. Thus, a greater amount of Cu old scrap will be likely recovered in the future mainly because C&D waste is expected to increase although, interesting to note, current European recycling initiatives and legislations do not commonly cover this type of waste.
Even in the fairly optimistic scenario that the EU-28 had recovered greater amounts of Cu scrap from obsolete products and waste, the reduction of secondary Cu production capacity that has occurred in many European countries in the last decades would have likely limited the potential increase of domestic Cu recycling. Technological innovations in the Cu industry and the enforcement of environmental legislations resulted in the closure of several secondary Cu smelters based on obsolete technologies, but also the expansion of the Asian Cu recycling industry has increased competiveness in the scrap market and spurred the displacement of secondary Cu plants from Europe to countries like China. Notwithstanding that old scrap generated has increased in absolute terms in the region, greater amounts of Cu were unrecovered and exported after collection and pre-processing for recycling. As the demand of Cu is expected to increase in the coming years, the relative contribution of secondary sources to the regional Cu production may even decrease, putting Europe in a potential critical situation of future Cu supply should scarcity issues of primary metal forms be confirmed.
These considerations seem to contrast with the Circular Economy Strategy adopted by the EC to stimulate Europe’s transition towards a closure of product lifecycles through greater recycling and reuse. It has been debated that achieving a Circular Economy at a level other than the global one is impractical [52,53] because globalization and trades make it impossible to achieve a perfect material circularity within a country or a region; this would also imply that such a country or region achieved a full and self-sufficient capability from mine production through recycling [54]. However, turning waste into a valuable resource and ensuring secure supply of secondary raw materials to the European industry remain desirable and potentially achievable benefits of the Circular Economy Strategy in the community on condition that recycling is at the core of the European industrial policies. The discussion of long-term industrial policies is beyond the goal of this study but changes in the regional Cu recycling capacity might be explored and debated in the coming years.
Besides quality issues, thermodynamic limits, and technological constraints, the cost of Cu recovery from waste and products is another (often the ultimate) barrier to recycling [55] if price of primary Cu refined, prices of alloying elements, and little incentives leave no margins for profit. In particular, this occurs when low quality Cu scrap is involved, which constitutes the greatest input of Cu scrap to secondary smelting production. Because refined Cu price is, in turn, influenced by changes in the global Cu demand, the majority of Cu export interest is in old scrap. Instead, lower cost than primary Cu forms, lower price variability, and greater ease of treatment compared to low quality Cu scrap make high quality secondary Cu (from both new and old scrap) a valuable material for fabricators. High quality Cu scrap is employed to produce brass mill alloy rod, rolled products and roofing material in which Cu scrap use can constitute up to 70%–90% of Cu semis. Lower Cu scrap content is generally allowed for heating purposes, water supply applications, and industrial uses. Wire mill products utilized, for instance, for power cabling and magnet production in building and electronics allow only little input of Cu scrap, preferring pure primary Cu. Cu scrap directly melted has higher quality, less sensitivity to global Cu demand, and seem to be driven by scrap availability more than Cu prices [49].
Should the demand of fabricated goods follow a sustained growth in the future, increasing the quality of old scrap containing Cu would secure access to end-uses driving the demand of pure Cu forms such as electrical and electronics and, perhaps, enable a growing use in direct melting first and then for secondary cathodes production in replacement of primary Cu. Limitations here are related to the shift occurring in primary Cu country suppliers over time: the composition of Cu concentrates depends on geology, and import from producers located in different regions may have implications for the ability to feed Cu scrap into primary European Cu smelters. For instance, the EU-28 has historically imported Cu ores and concentrates mainly from South America (i.e., Chile, Peru, Argentina, and Brazil), but in the most recent years China has become a major supplier for Europe.
The achievement of increased quality of Cu scrap, however, requires us to improve the way materials and goods are produced today. Several strategies have been discussed in literature for metals [56], particularly for steel and aluminum because of their extensive presence in the modern society [57], and these approaches, aiming at increasing the resource efficiency, can be reasonably extended to Cu. The variety of alloys in number and composition hinders efficient sorting and separation and, ultimately, functional recycling. Reducing the number of alloying elements, on one side, and the development of scrap-sorting by alloy type techniques [58,59], on the other side, is expected to improve and facilitate material recovery and functional recycling. Reuse and maintenance have been pointed as ways to increase the useful lifespan of products; these strategies have gained positive results in local areas, but an exhaustive consideration of environmental-related implications (e.g., energy consumptions and/or harmful emissions during a product use) is needed to avoid undesired consequences as, in general, new products have better environmental performance than obsolete ones.
Potential for Cu substitution in its major end-uses seems to be very limited in today’s conditions [10], but promising materials such as graphene [60] could determine dramatic changes in given sectors including power distribution and infrastructure. Alternative materials would also likely require new manufacturing procedures as different materials have commonly different behaviors in the same system conditions [56]. The design and fabrication of new materials and goods is likely the area in which research and development initiatives should focus the most: design for recycling, design for disassembly, design for resource efficiency, and similar techniques demand a sharp change in current material processing, making material recycling the top priority.
These methods would further benefit from the adoption of recycled content requirements for new products. Recycling targets from obsolete products and waste have been set for several materials, but because these metrics are generally expressed as share of a product weight, major attentions were given to the heaviest materials such as iron and steel components, with ELV recycling targets being an example. On one hand, this has enabled achieving good recycling performances on a total mass basis, but has limited the recovery of elements in low concentrations and amounts on the other. Instead, the adoption of recycled content requirements for new products, expressed on a single material basis, would likely boost the employment of secondary material sources in new product manufacturing and support the development of a consolidated recycling industry.

5. Conclusions

This study has demonstrated that the European Cu lifecycle is far from having efficient circularity. However, the potential for reducing inputs of virgin ores and Europe’s vulnerability to potential shortages of primary resources is of great consideration in light of the size of the Cu in-use stock and margins for increasing scrap recovery rates at end-of-life. Increasing the circulation of secondary Cu into the economy is an essential lever to move towards an industrial ecology approach and a closure of material loops [61], but this transition requires that recycling be adequately addressed and supported by industry and policy actors to maximize access to valuable secondary Cu sources. Product quality requirements, harmonized rules, clearer identification of scrap grades [62], and the adoption of design strategies oriented to facilitate Cu recovery at end-of-life are key elements to boost recycling. Beyond this, quantitative evaluations of Cu flows and stocks such as those provided by MFA serve as a fundamental basis for system-wide management strategies including the analysis of key trading partners and the contrast to illegal trade of Cu-containing end-of-life products and waste. Periodic updates of Cu flow models could also enable identification of noticeable variations for selected time intervals. In a broader context, the more these approaches were accomplished internationally, the better the consolidated Cu recycling industry could be reached worldwide.
We anticipate that the results of this study will constitute a basis for evaluating future demand and scrap supply of Cu in the region under different scenarios and for assessing the recycling-related environmental implications.

Supplementary Materials

The following are available online at www.mdpi.com/2079-9276/6/1/6/s1, Figure S1: Mass balance for a generic process in the model created, Figure S2: Mass balance for the use phase in the model created, Figure S3: Intensity of Cu in-use stock per economic activity: per capita in-use stock of Cu versus per capita gross domestic product (at constant 1990 international $), Table S1: Historic statistics of Cu production in the EU-28 for selected years, Table S2: Historic statistics of import and export of unrefined, refined, waste and scrap of Cu in the EU-28 for selected years, Table S3: Commodity codes of Cu-containing goods considered in the analysis as recorded by the United Nations Commodity Trade Statistics database, Table S4: Loss rates for selected processes of the anthropogenic life cycle of Cu, Table S5: New scrap generation rates, Table S6: Major end-use application sectors of Cu and related market shares, Table S7: Lifetime distribution models and related parameters applied to the major end-use application sectors of Cu, Table S8: Transfer coefficients for Cu end-use applications to major waste categories, Table S9: End-of-life collection (for recovery) rates and pre-processing efficiency of the main Cu waste category, Table S10: Uncertainty ranges applied to Cu flows in this study.

Acknowledgments

We express gratitude to Carlos Risopatron, from the International Copper Study Group, for his courtesy in providing the final report of the ICSG Global Copper Scrap Research Project. We thank Mark Loveitt, from the International Wrought Copper Council, and Marcel Soulier, from the Fraunhofer Institute for Systems and Innovation Research, for their help with historical Cu market shares. We also thank the “P. Baffi” Library of the Bank of Italy for the World Metal Statistics Yearbooks on copper.
This project has received funding from the European Union’s Horizon 2020 research and innovation programme under the Marie Sklodowska-Curie grant agreement No. 704633. Disclaimer: Views expressed are those of the authors and the Research Executive Agency (REA) of the European Commission is not responsible for any use that may be made of the information it contains.

Author Contributions

L.C., F.P., and I.V. conceived and wrote the paper. L.C. performed the analysis and created figures.

Conflicts of Interest

The authors declare no conflict of interest.

Abbreviations

C&DConstruction and demolition waste
CuCopper
ECEuropean Commission
ELVEnd-of-life vehicle
EOL-RREnd-of-life recycling rate
EU-28European Union (28 Member States)
GgGigagram (1 Gg = 1 × 10⁹ grams (g) = 1 kilo metric tonnes (kt))
IUDIn-use dissipation
IUSIn-use stock
IWElectrical and non-electrical industrial waste
kgKilogram (1 kg = 1 × 10³ grams (g))
MSWMunicipal solid waste
NASNet-addition to in-use stock
NIRNet-Import Reliance
TgTeragram (1 Tg = 1 × 10¹² grams (g) = 1 million metric tonnes (Mt))
TSTemporary stock
UN COMTRADEUnited Nations Commodity Trade Statistics Database
WEEEWaste electrical and electronic equipment

References

  1. U.S. Geological Survey (USGS), Mineral Commodity Summaries—Copper. Available online: https://minerals.usgs.gov/minerals/pubs/commodity/copper/mcs-2016-coppe.pdf (accessed on 20 January 2017).
  2. Northey, S.; Mohr, S.; Mudd, G.M.; Weng, Z.; Giurco, D. Modelling future copper ore grade decline based on a detailed assessment of copper resources and mining. Resour. Conserv. Recycl. 2014, 83, 190–201. [Google Scholar] [CrossRef]
  3. European Commission, Critical Raw Materials for the EU. Report of the Ad-hoc Working Group on Defining Critical Raw Materials; European Commission: Bruxells, Belgium, 2010. [Google Scholar]
  4. European Commission, Critical Raw Materials for the EU. Report of the Ad-hoc Working Group on Defining Critical Raw Materials; European Commission: Bruxells, Belgium, 2014. [Google Scholar]
  5. Buijs, B.S.H. Critical Thinking about Critical Minerals: Assessing Risks Related to Resource Security; German Geological Survey: Hannover, Germany, 2011. [Google Scholar]
  6. U.S. National Research Council (NRC). Minerals, Critical Minerals, and the U.S. Economy; The National Academies Press: Washington, DC, USA, 2008. [Google Scholar]
  7. U.S. Department of Energy (DOE). Critical Materials Strategy; DOE: Washington, DC, USA, 2010.
  8. British Geological Survey. Risk List 2011; British Geological Survey: Nottingham, UK, 2011. [Google Scholar]
  9. British Geological Survey. Risk List 2015; British Geological Survey: Nottingham, UK, 2015. [Google Scholar]
  10. Nassar, N.T.; Barr, R.; Browning, M.; Diao, Z.; Friedlander, E.; Harper, E.M.; Henly, C.; Kavlak, G.; Kwatra, S.; Jun, C.; et al. Criticality of the Geological Copper Family. Environ. Sci. Technol. 2012, 46, 1071–1078. [Google Scholar] [CrossRef] [PubMed]
  11. Ciacci, L.; Nuss, P.; Reck, B.K.; Werner, T.T.; Graedel, T.E. Metal criticality determination for Australia, the US, and the planet—Comparing 2008 and 2012 results. Resources 2016, 5. [Google Scholar] [CrossRef]
  12. Meinert, L.D.; Robinson, G.R.; Nassar, N.T. Mineral Resources: Reserves, Peak Production and the Future. Resources 2016, 5. [Google Scholar] [CrossRef]
  13. Ciacci, L.; Harper, E.M.; Nassar, N.T.; Reck, B.K.; Graedel, T.E. Metal Dissipation and Inefficient Recycling Intensify Climate Forcing. Environ. Sci. Technol. 2016, 50, 11394–11402. [Google Scholar] [CrossRef] [PubMed]
  14. Graedel, T.E.; Allwood, J.; Birat, J.P.; Buchert, M.; Hagelüken, C.; Reck, B.K.; Sibley, S.F.; Sonnemann, G. What Do We Know About Metal Recycling Rates? J. Ind. Ecol. 2011, 15, 355–366. [Google Scholar] [CrossRef]
  15. Glöser, S.; Soulier, M.; Tercero Espinoza, L.A. Dynamic Analysis of Global Copper Flows. Global Stocks, Postconsumer Material Flows, Recycling Indicators, and Uncertainty Evaluation. Environ. Sci. Technol. 2013, 47, 6564–6572. [Google Scholar] [CrossRef] [PubMed]
  16. Elshkaki, A.; Graedel, T.E.; Ciacci, L.; Reck, B.K. Copper demand, supply, and associated energy use to 2050. Glob. Environ. Chang. 2016, 39, 305–315. [Google Scholar] [CrossRef]
  17. Baccini, P.; Brunner, P.H. Metabolism of the Anthroposphere; Springer: Heidelberg, Germany, 1991. [Google Scholar]
  18. Haas, W.; Krausmann, F.; Wiedenhofer, D.; Heinz, M. How Circular is the Global Economy?: An Assessment of Material Flows, Waste Production, and Recycling in the European Union and the World in 2005. J. Ind. Ecol. 2015, 19, 765–777. [Google Scholar] [CrossRef]
  19. Hashimoto, S.; Tanikawa, H.; Moriguchi, Y. Where will large amounts of materials accumulated within the economy go?—A material flow analysis of construction minerals for Japan. Waste Manag. 2007, 27, 1725–1738. [Google Scholar] [CrossRef] [PubMed]
  20. Bogucka, R.; Kosińska, I.; Brunner, P.H. Setting priorities in plastic waste management—Lessons learned from material flow analysis in Austria and Poland. Polimery-W 2008, 53, 55–59. [Google Scholar]
  21. Kuczenski, B.; Geyer, R. Material flow analysis of polyethylene terephthalate in the US, 1996–2007. Resour. Conserv. Recycl. 2010, 54, 1161–1169. [Google Scholar] [CrossRef]
  22. Ciacci, L.; Passarini, F.; Vassura, I. The European PVC cycle: In-use stock and flows. Resour. Conserv. Recycl. 2016, in press. [Google Scholar] [CrossRef]
  23. Graedel, T.E.; Cao, J. Metal spectra as indicators of development. Proc. Natl. Acad. Sci. USA 2010, 107, 20905–20910. [Google Scholar] [CrossRef] [PubMed]
  24. Ayres, R.U.; Ayres, L.W.; Råde, I. The Life Cycle of Copper, Its Co-Products and By-Products. Eco Effic. Ind. Sci. 2002, 13, 1–210. [Google Scholar]
  25. Graedel, T.E.; Van Beers, D.; Bertram, M.; Fuse, K.; Gordon, R.B.; Gritsinin, A.; Kapur, A.; Klee, R.J.; Lifset, R.J.; Memon, L. Multilevel Cycle of Anthropogenic Copper. Environ. Sci. Technol. 2004, 38, 1242–1252. [Google Scholar] [CrossRef] [PubMed]
  26. Gerst, M.D. Linking Material Flow Analysis and Resource Policy via Future Scenarios of In-Use Stock: An Example for Copper. Environ. Sci. Technol. 2009, 43, 6320–6325. [Google Scholar] [CrossRef] [PubMed]
  27. Bertram, M.; Graedel, T.E.; Rechberger, H.; Spatari, S. The contemporary European copper cycle: Waste management subsystem. Ecol. Econ. 2002, 42, 43–57. [Google Scholar] [CrossRef]
  28. Rechberger, H.; Graedel, T.E. The contemporary European copper cycle: Statistical entropy analysis. Ecol. Econ. 2002, 42, 59–72. [Google Scholar] [CrossRef]
  29. Graedel, T.E.; Bertram, M.; Fuse, K.; Gordon, R.B.; Lifset, R.; Rechberger, H.; Spatari, S. The contemporary European copper cycle: The characterization of technological copper cycles. Ecol. Econ. 2002, 42, 9–26. [Google Scholar] [CrossRef]
  30. Spatari, S.; Bertram, M.; Fuse, K.; Graedel, T.E.; Rechberger, H. The contemporary European copper cycle: 1 year stocks and flows. Ecol. Econ. 2002, 42, 27–42. [Google Scholar] [CrossRef]
  31. Ruhrberg, M. Assessing the recycling efficiency of copper from end-of-life products in Western Europe. Resour. Conserv. Recycl. 2006, 48, 141–165. [Google Scholar] [CrossRef]
  32. Cencic, O.; Rechberger, H. Material flow analysis with software STAN. J. Environ. Eng. Manag. 2008, 18, 3–7. [Google Scholar]
  33. World Bureau of Metal Statistics (WBMS). World Metal Statistics Yearbook; World Bureau of Metal Statistics: Ware, UK, 1984–2010. [Google Scholar]
  34. Soulier, M.; Fraunhofer Institute for Systems and Innovation Research, Karlsruhe, Germany. Personal communication, 2016.
  35. Thomson Reuters GFMS. Copper Survey; Thomson Reuters: London, UK, 2013–2016. [Google Scholar]
  36. U.S. Geological Survey (USGS). Copper End-Use Statistics; Matos, G.R., Edelstein, D.L., Eds.; U.S. Geological Survey: Reston, VA, USA, 2005. [Google Scholar]
  37. United Nations Commodity Trade Statistics Database (UN COMTRADE). Available online: comtrade.un.org (accessed on 20 January 2017).
  38. Lossin, A. Copper. In Ullmann’s Encyclopedia of Industrial Chemistry; Wiley-VCH Verlag GmbH & Co. KGaA: Weinheim, Germany, 2000. [Google Scholar]
  39. Isbell, C.A. Copper Alloys. In Ullmann’s Encyclopedia of Industrial Chemistry; Wiley-VCH Verlag GmbH & Co. KGaA: Weinheim, Germany, 2000. [Google Scholar]
  40. Rechberger, H.; Cencic, O.; Fruhwirth, R. Uncertainty in material flow analysis. J. Ind. Ecol. 2014, 18, 159–160. [Google Scholar] [CrossRef]
  41. Copper Development Association (CDA). Available online: http://copperalliance.org (accessed on 20 January 2017).
  42. Ciacci, L.; Reck, B.K.; Nassar, N.T.; Graedel, T.E. Lost by Design. Environ. Sci. Technol. 2015, 49, 9443–9451. [Google Scholar] [CrossRef] [PubMed]
  43. Graedel, T.E.; Barr, R.; Chandler, C.; Chase, T.; Choi, J.; Christoffersen, L.; Friedlander, E.; Henly, C.; Jun, C.; Nassar, N.T. Methodology of Metal Criticality Determination. Environ. Sci. Technol. 2011, 46, 1063–1070. [Google Scholar] [CrossRef]
  44. Van Beers, D.; Graedel, T.E. Spatial characterisation of multi-level in-use copper and zinc stocks in Australia. J. Clean Prod. 2007, 15, 849–861. [Google Scholar] [CrossRef]
  45. Kapur, A. The future of the red metal—Scenario analysis. Future 2005, 37, 1067–1094. [Google Scholar] [CrossRef]
  46. Spatari, S.; Bertram, M.; Gordon, R.B.; Henderson, K.; Graedel, T.E. Twentieth century copper stocks and flows in North America: A dynamic analysis. Ecol. Econ. 2005, 54, 37–51. [Google Scholar] [CrossRef]
  47. Liu, G.; Müller, D.B. Centennial Evolution of Aluminum In-Use Stocks on Our Aluminized Planet. Environ. Sci. Technol. 2013, 47, 4882–4888. [Google Scholar] [CrossRef] [PubMed]
  48. Müller, D.B.; Wang, T.; Duval, B. Patterns of Iron Use in Societal Evolution. Environ. Sci. Technol. 2010, 45, 182–188. [Google Scholar] [CrossRef] [PubMed]
  49. International Copper Study Group (ICSG). ICSG Global Copper Scrap Research Project. Final Report and Statistical Annex; International Copper Study Group (ICSG): Lisbon, Portugal, 2010. [Google Scholar]
  50. European Commission. Directive 2000/53/EC of the European Parliament and of the Council of 18 September 2000 on End-of-Life Vehicles; European Commission: Bruxells, Belgium, 2000; p. 34. [Google Scholar]
  51. European Commission. Directive 2012/19/EU of the European Parliament and of the Council of 4 July 2012 on Waste Electrical and Electronic Equipment (WEEE); European Commission: Bruxells, Belgium, 2012; p. 34. [Google Scholar]
  52. Corder, G.D.; Golev, A.; Giurco, D. “Wealth from metal waste”: Translating global knowledge on industrial ecology to metals recycling in Australia. Miner. Eng. 2015, 76, 2–9. [Google Scholar] [CrossRef]
  53. Gregson, N.; Crang, M.; Fuller, S.; Holmes, H. Interrogating the circular economy: The moral economy of resource recovery in the EU. Econ. Soc. 2015, 44, 218–243. [Google Scholar] [CrossRef] [Green Version]
  54. Graedel, T.E.; Ciacci, L.; Reck, B.K. On the spatial dimension of the circular economy. 2016; under review. [Google Scholar]
  55. Dahmus, J.B.; Gutowski, T.G. What Gets Recycled: An Information Theory Based Model for Product Recycling. Environ. Sci. Technol. 2007, 41, 7543–7550. [Google Scholar] [CrossRef] [PubMed]
  56. Gutowski, T.G.; Sahni, S.; Allwood, J.M.; Ashby, M.F.; Worrell, E. The energy required to produce materials: Constraints on energy-intensity improvements, parameters of demand. Philos. Trans R. Soc. A 2013, 371. [Google Scholar] [CrossRef] [PubMed]
  57. Cullen, J.M.; Allwood, J.M. Mapping the Global Flow of Aluminum: From Liquid Aluminum to End-Use Goods. Environ. Sci. Technol. 2013, 47, 3057–3064. [Google Scholar] [CrossRef] [PubMed]
  58. Reuter, M.A.; Van Schaik, A.; Ignatenko, O.; De Haan, G.J. Fundamental limits for the recycling of end-of-life vehicles. Miner. Eng. 2006, 19, 433–449. [Google Scholar] [CrossRef]
  59. Modaresi, R.; Müller, D.B. The Role of Automobiles for the Future of Aluminum Recycling. Environ. Sci. Technol. 2012, 46, 8587–8594. [Google Scholar] [CrossRef] [PubMed]
  60. Gibney, E. Graphene conducts electricity ten times better than expected. Available online: http://www.nature.com/news/graphene-conducts-electricity-ten-times-better-than-expected-1.14676 (accessed on 20 January 2017).
  61. Giurco, D.; Petrie, J.G. Strategies for reducing the carbon footprint of copper: New technologies, more recycling or demand management? Miner. Eng. 2007, 20, 842–853. [Google Scholar] [CrossRef]
  62. Muchova, L.; Eder, P.; Villanueva, A. End-of-Waste Criteria for Copper and Copper Ally Scrap: Technical Proposals; EUR 24786 EN; Joint Research Centre—Institute for Prospective Technological Studies; Publications Office of the European Union: Luxembourg, 2011. [Google Scholar]
Figure 1. The cumulative European Cu cycle (1960–2014). Values are in Tg (1 Tg = 1012 g = 1 Mt). TS: temporary stock of unwrought Cu forms; NAS: net-addition to in-use stock; IUD: in-use dissipation (according to definitions in [42]).
Resources 06 00006 g001
Figure 2. The contemporary European Cu cycle (best estimate for year 2014). Values are in Gg of Cu content. NAS: net-addition to in-use stock; IUD: in-use dissipation (according to definitions in [42]).
Resources 06 00006 g002
Figure 3. Net-import (i.e., imports − exports) of principal Cu forms from 1960 to 2014. Values are in Gg of Cu content.
Resources 06 00006 g003
Figure 4. Annual amount of Cu into use and the estimated old scrap generated. Values are in Gg of Cu content.
Resources 06 00006 g004
Figure 5. Annual scrap generation results by principal waste category as estimated from the material flow analysis (MFA) model applied in this study. Values are in Gg of Cu content.
Resources 06 00006 g005
Table 1. Principal end-use sectors of Cu and example of application included according to definitions in [35,41].
End-Use SectorExample of Application Included
Building and constructionBuilding wire; plumbing and heating; air conditioning and commercial refrigerator; builders hardware; architectural
Electrical and electronic productsPower utilities; telecommunications; business electronics; lighting and wiring devices
Industrial machinery and equipmentIn-plant equipment, industrial valves and fittings, non-electrical instruments, off-road vehicles, heat exchangers
Transportation equipmentAutomobile; truck and bus; railroad; marine, aircraft and aerospace
Consumer and general goodsAppliances, cord sets, military and commercial ordnance, consumer electronics, fasteners and closures, coinage, utensils and cutlery, miscellaneous

