
A Novel 12-Lead ECG T-Shirt with Active Electrodes


Abstract
:1. Introduction
2. Materials and Methods
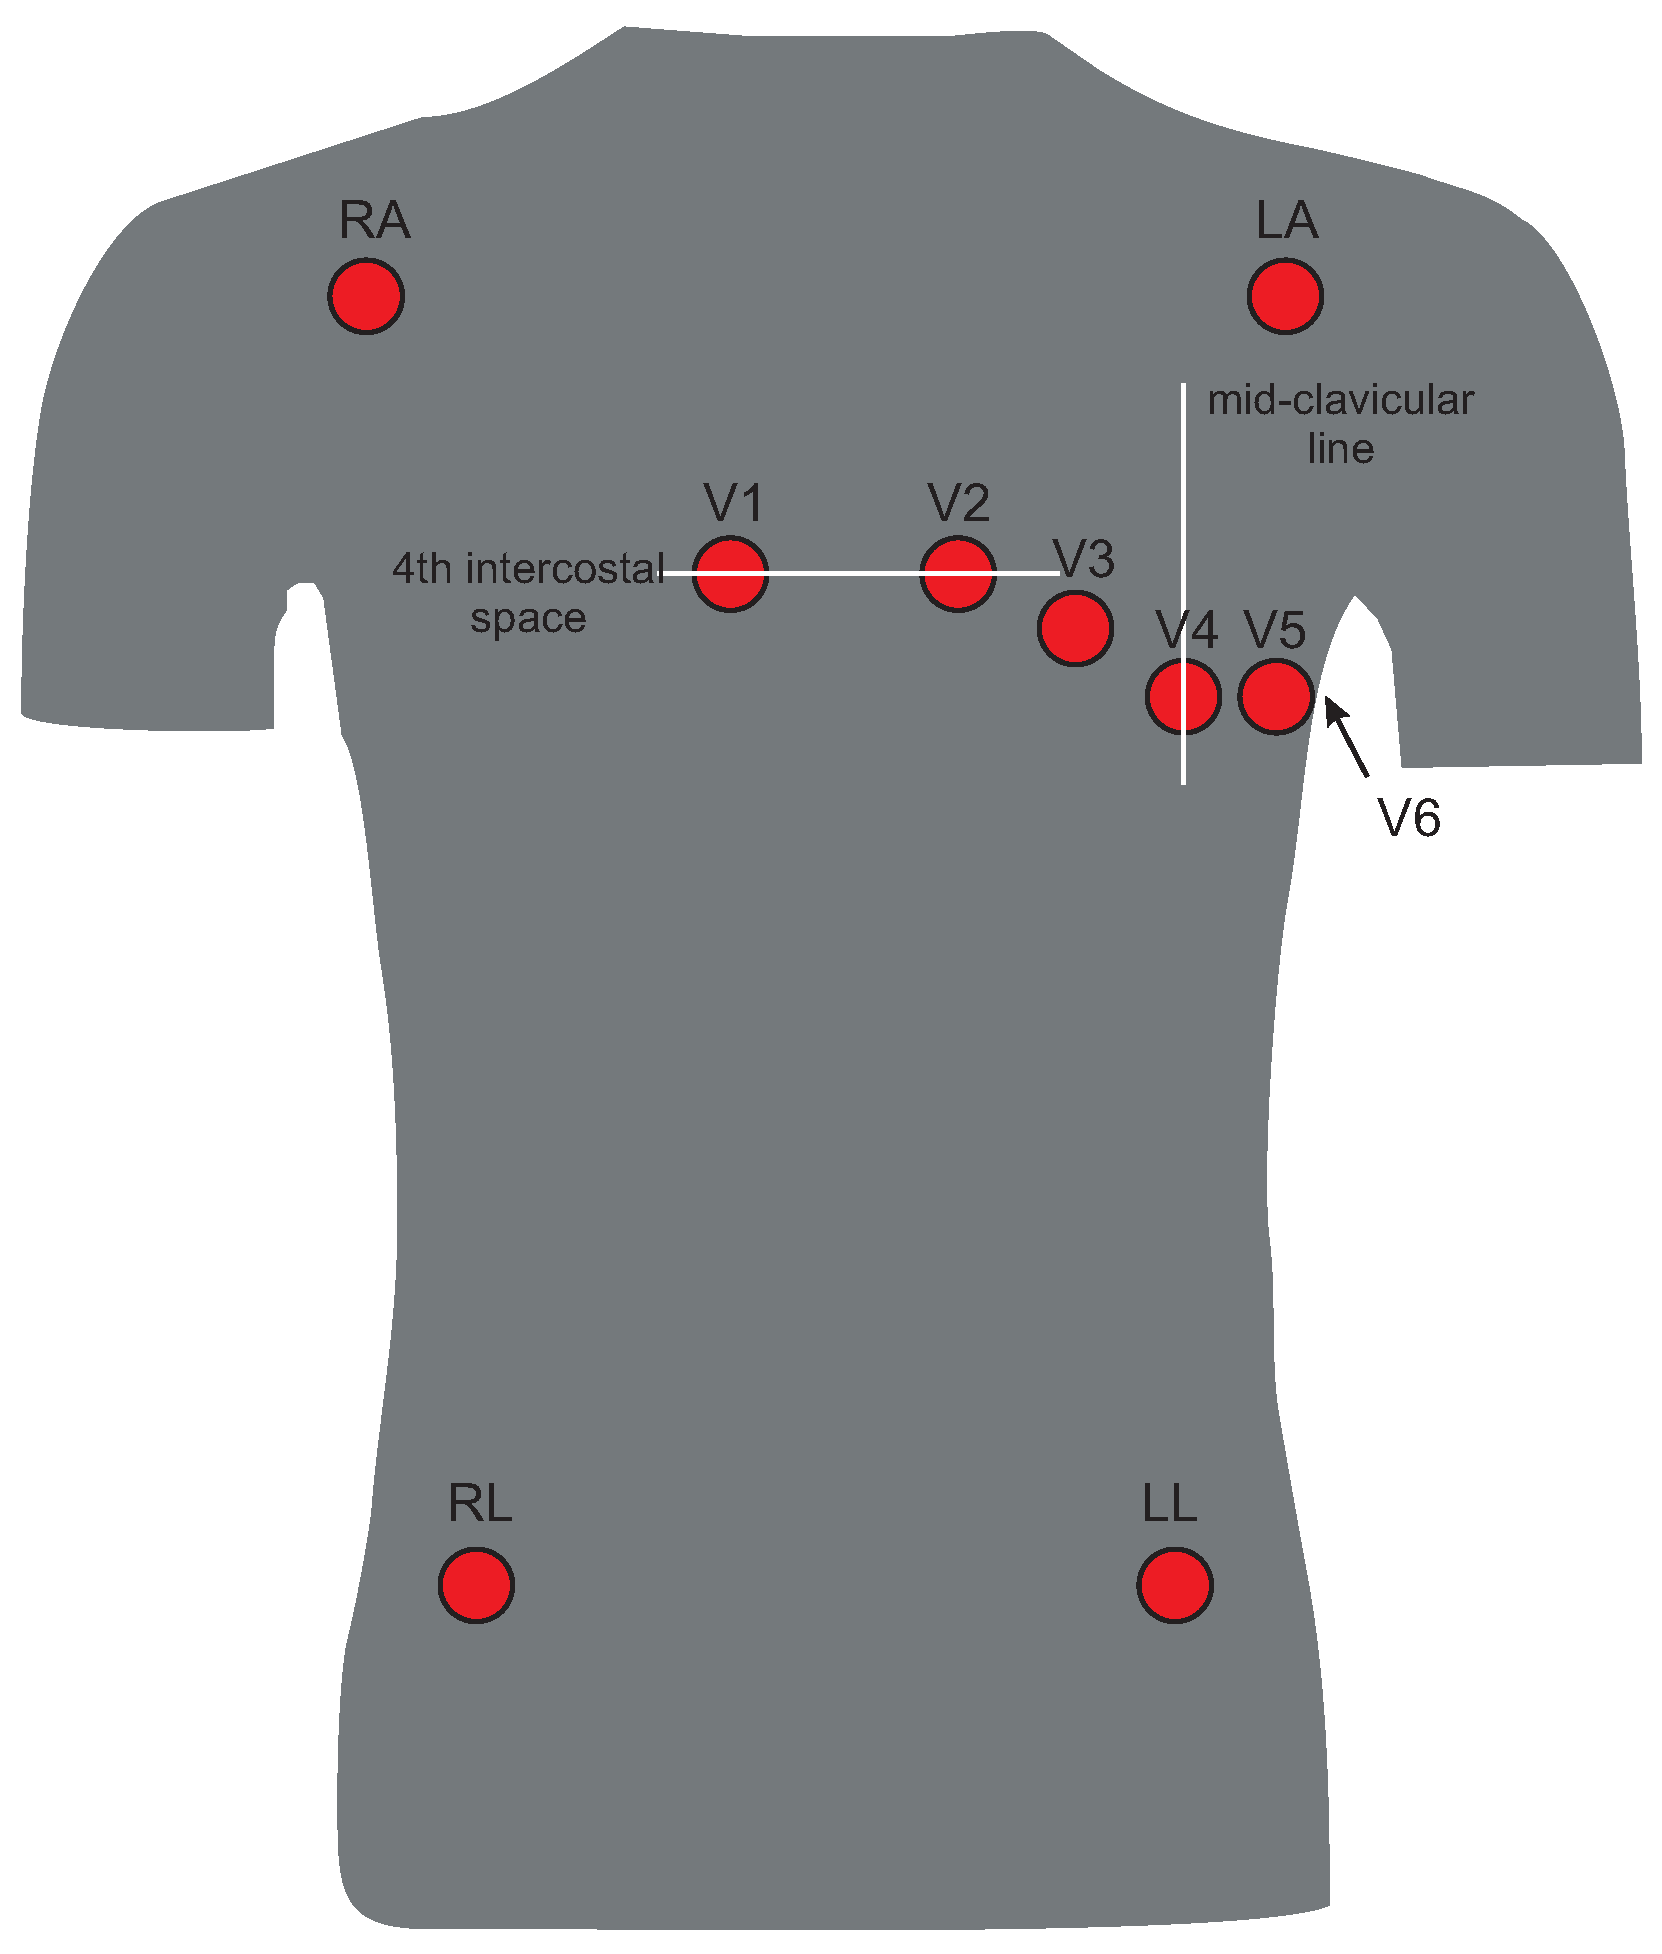
2.1. 12-Lead ECG
2.2. Measurement System
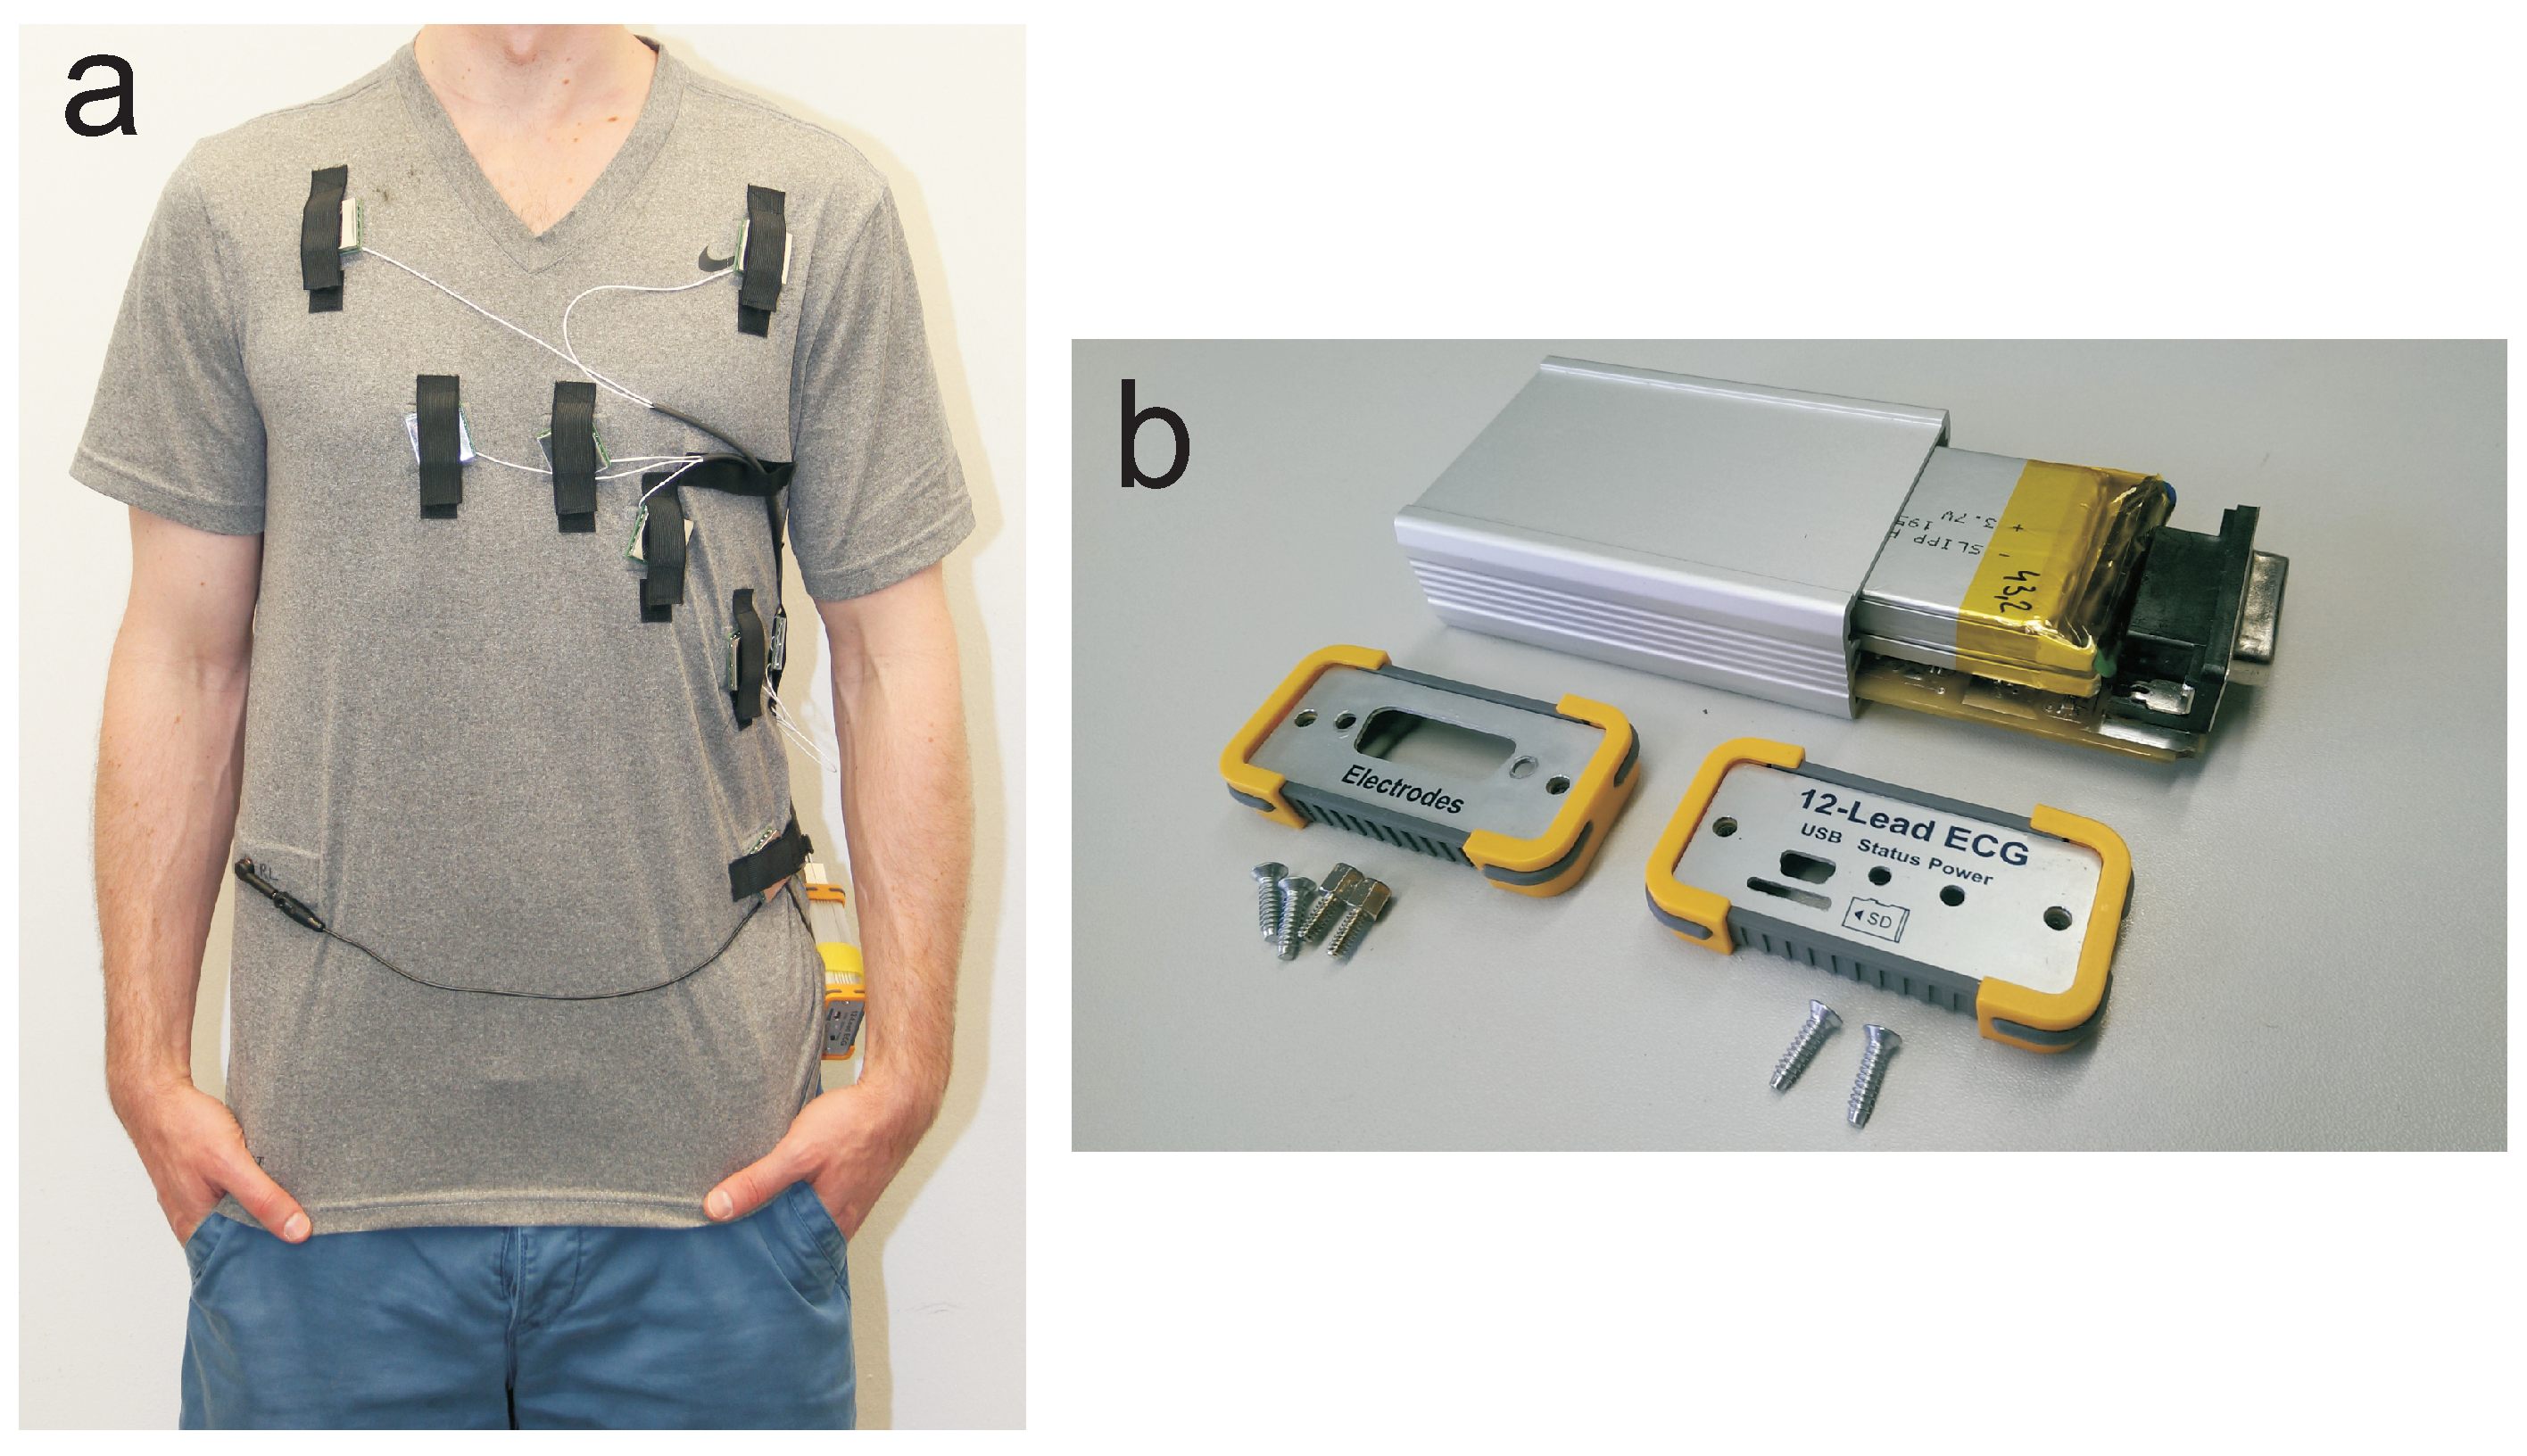
2.2.1. T-Shirt
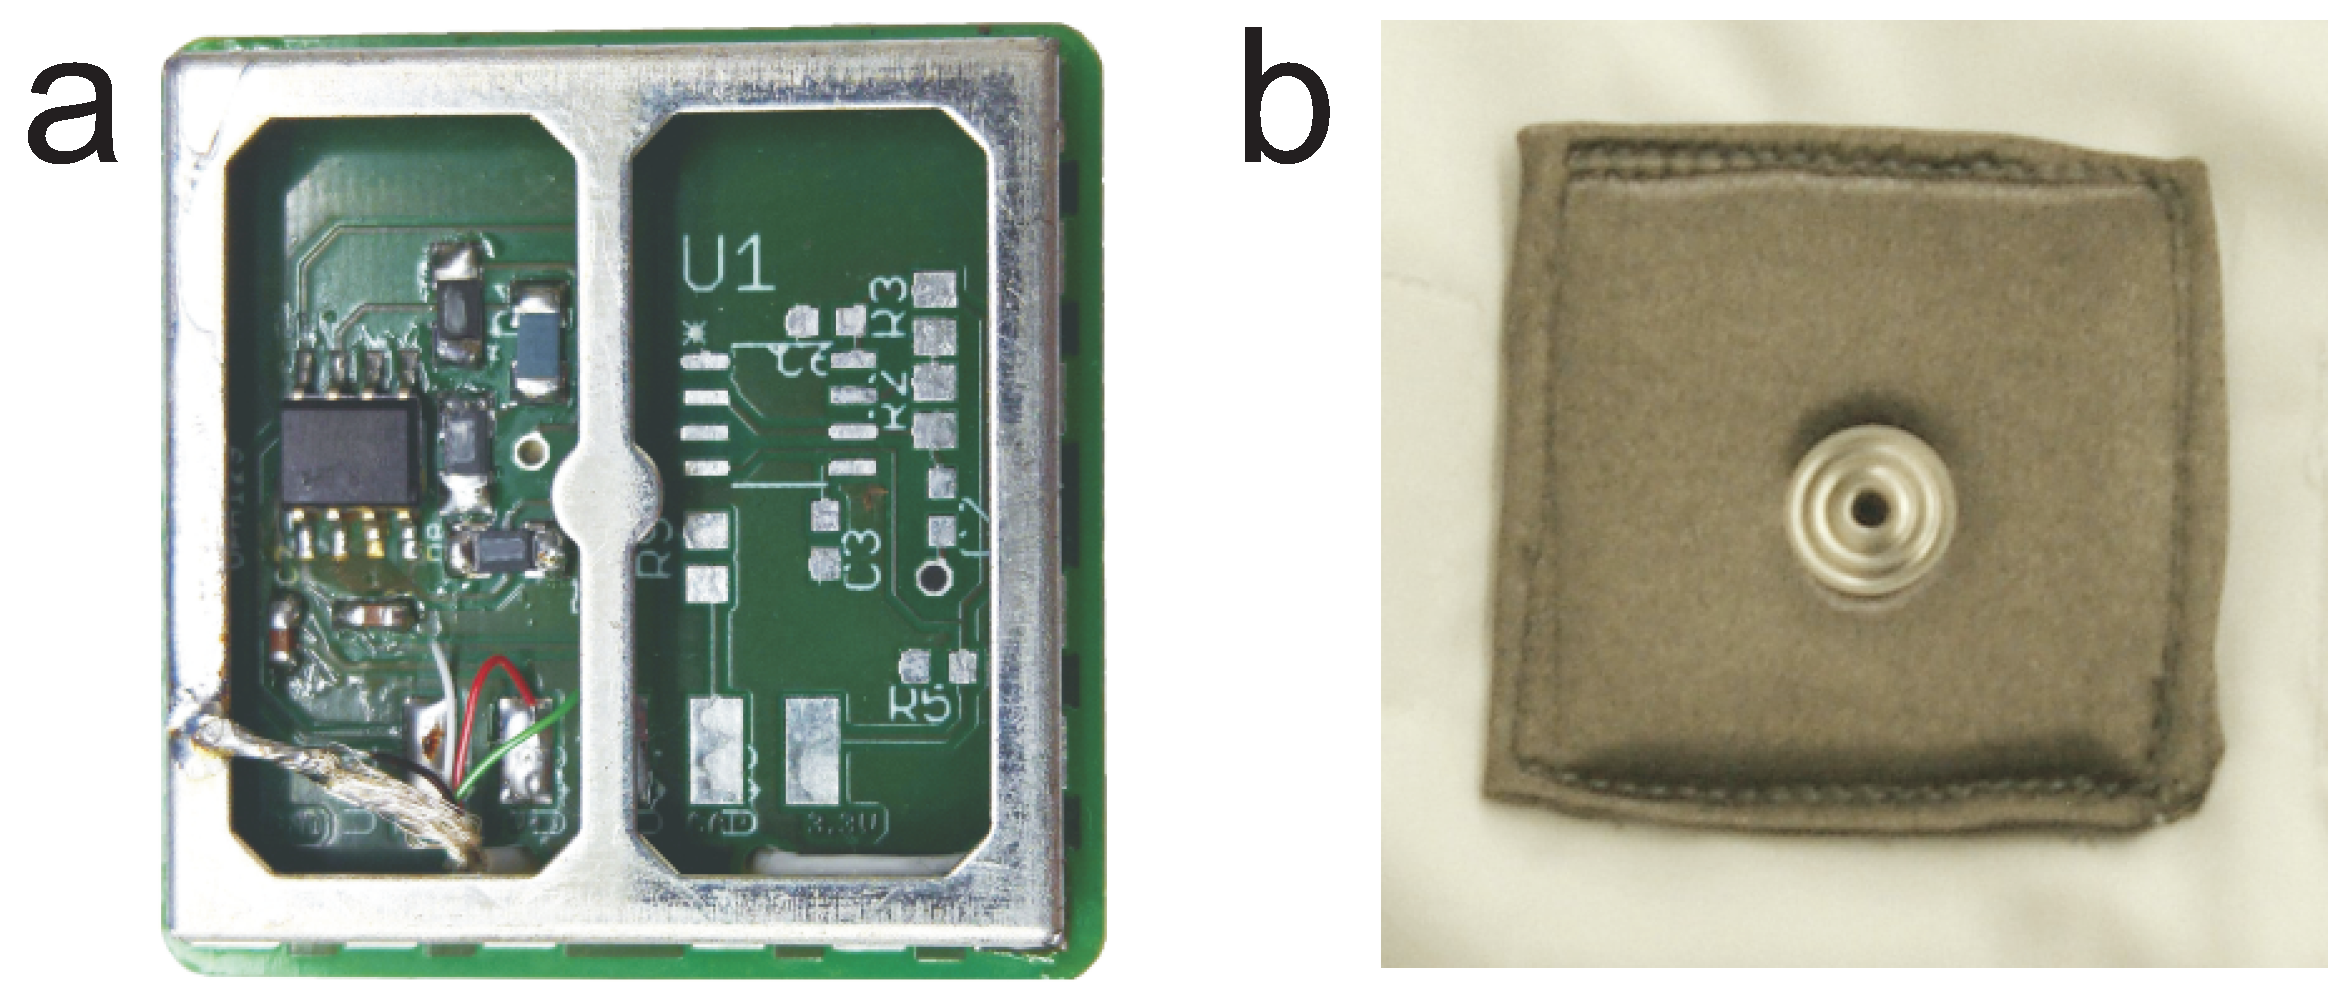
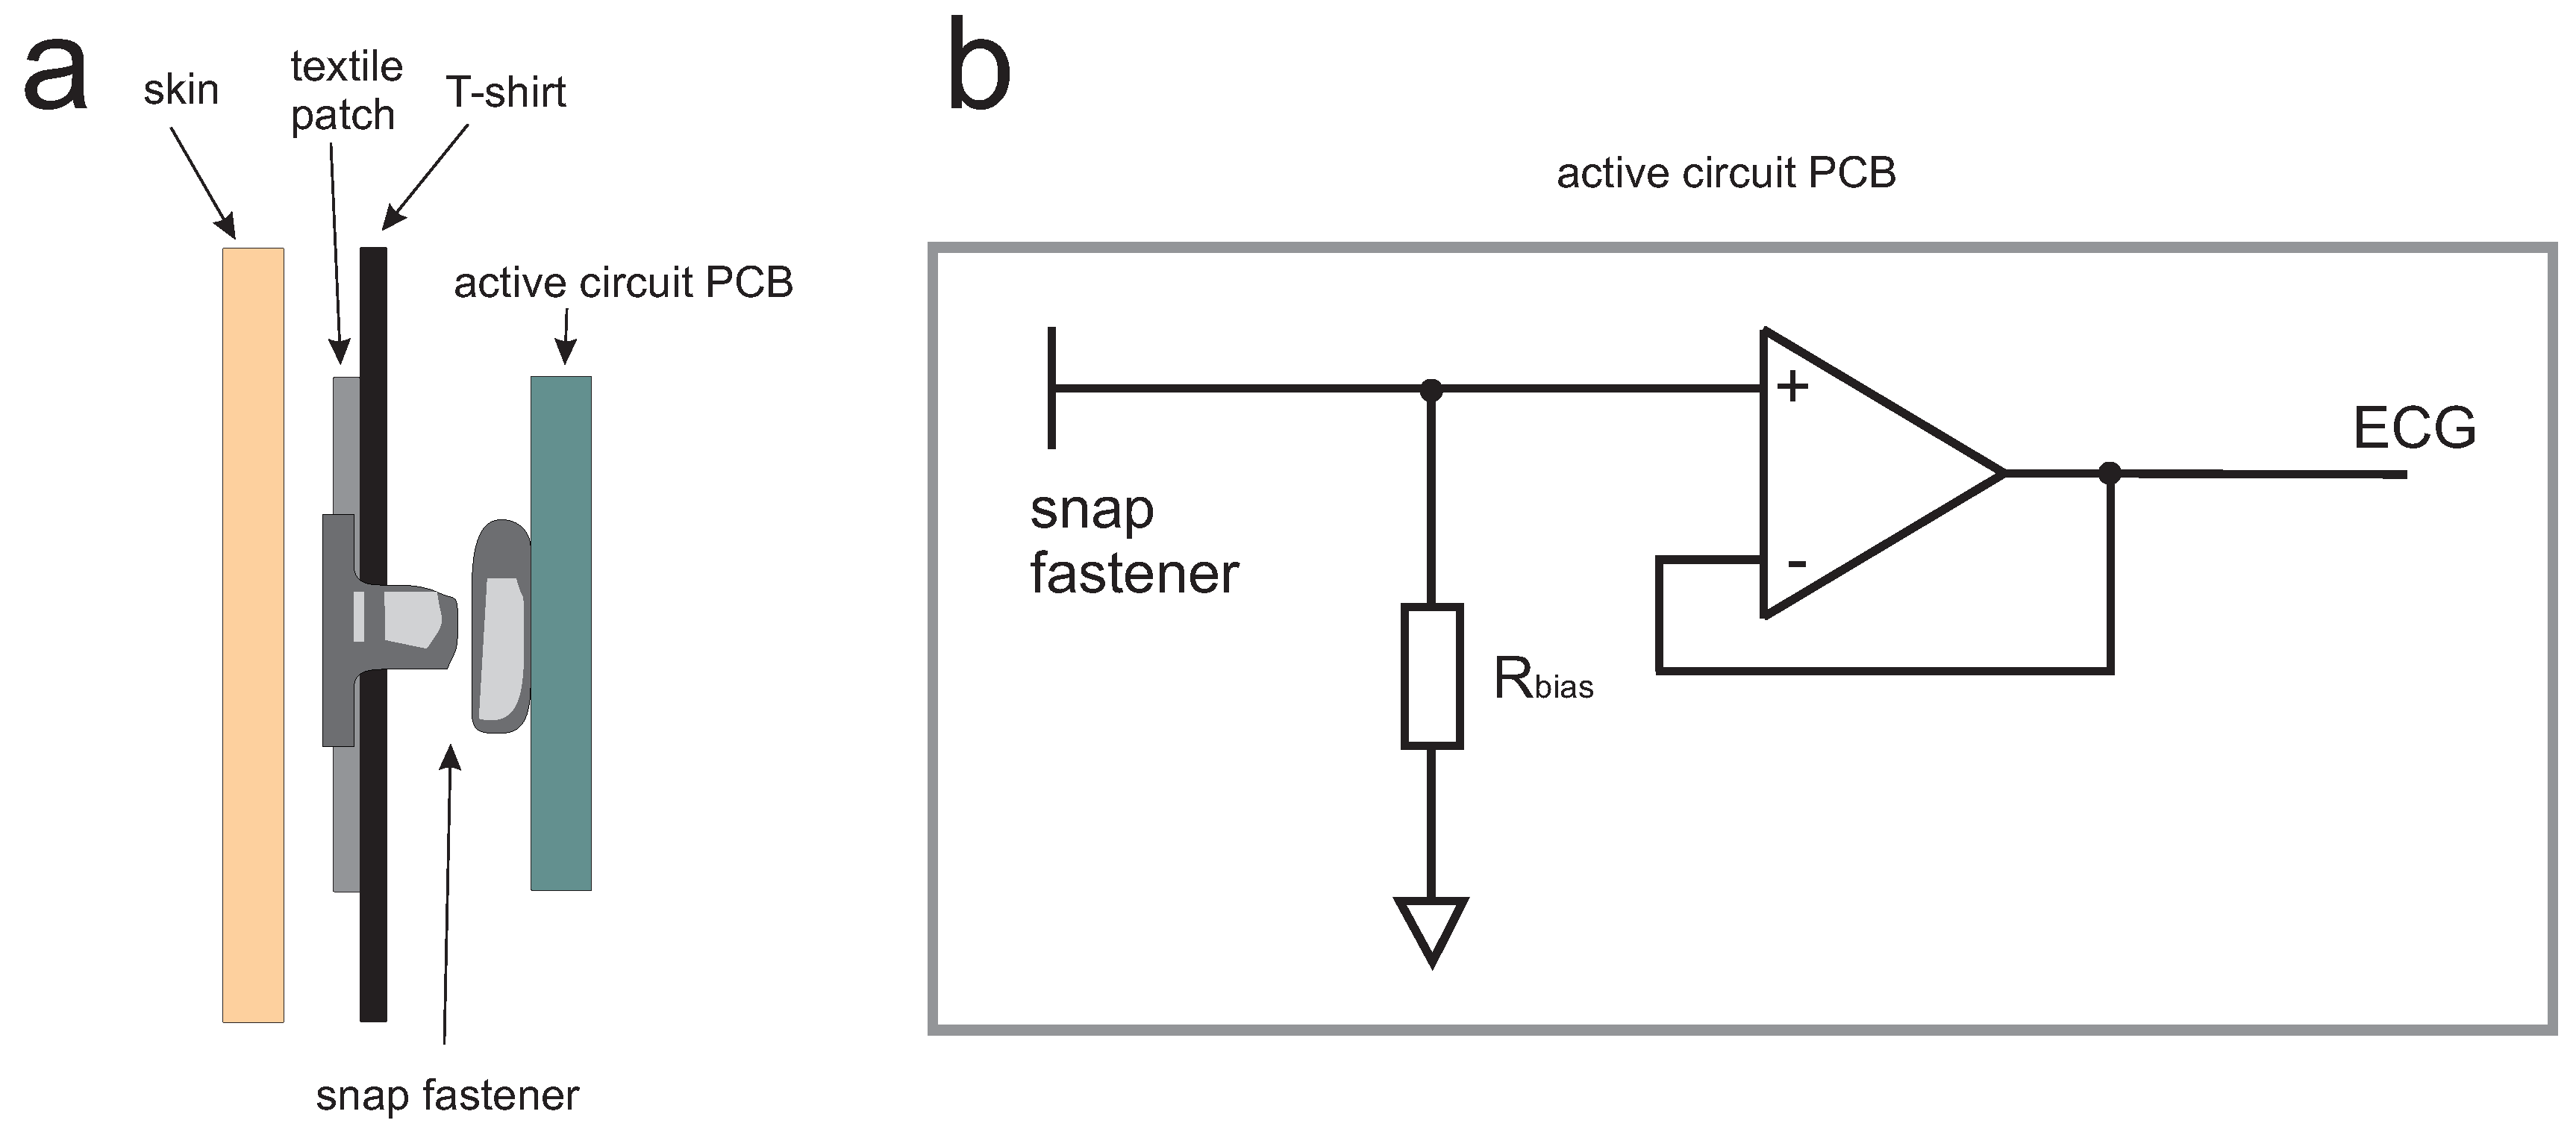
2.2.2. Electrodes
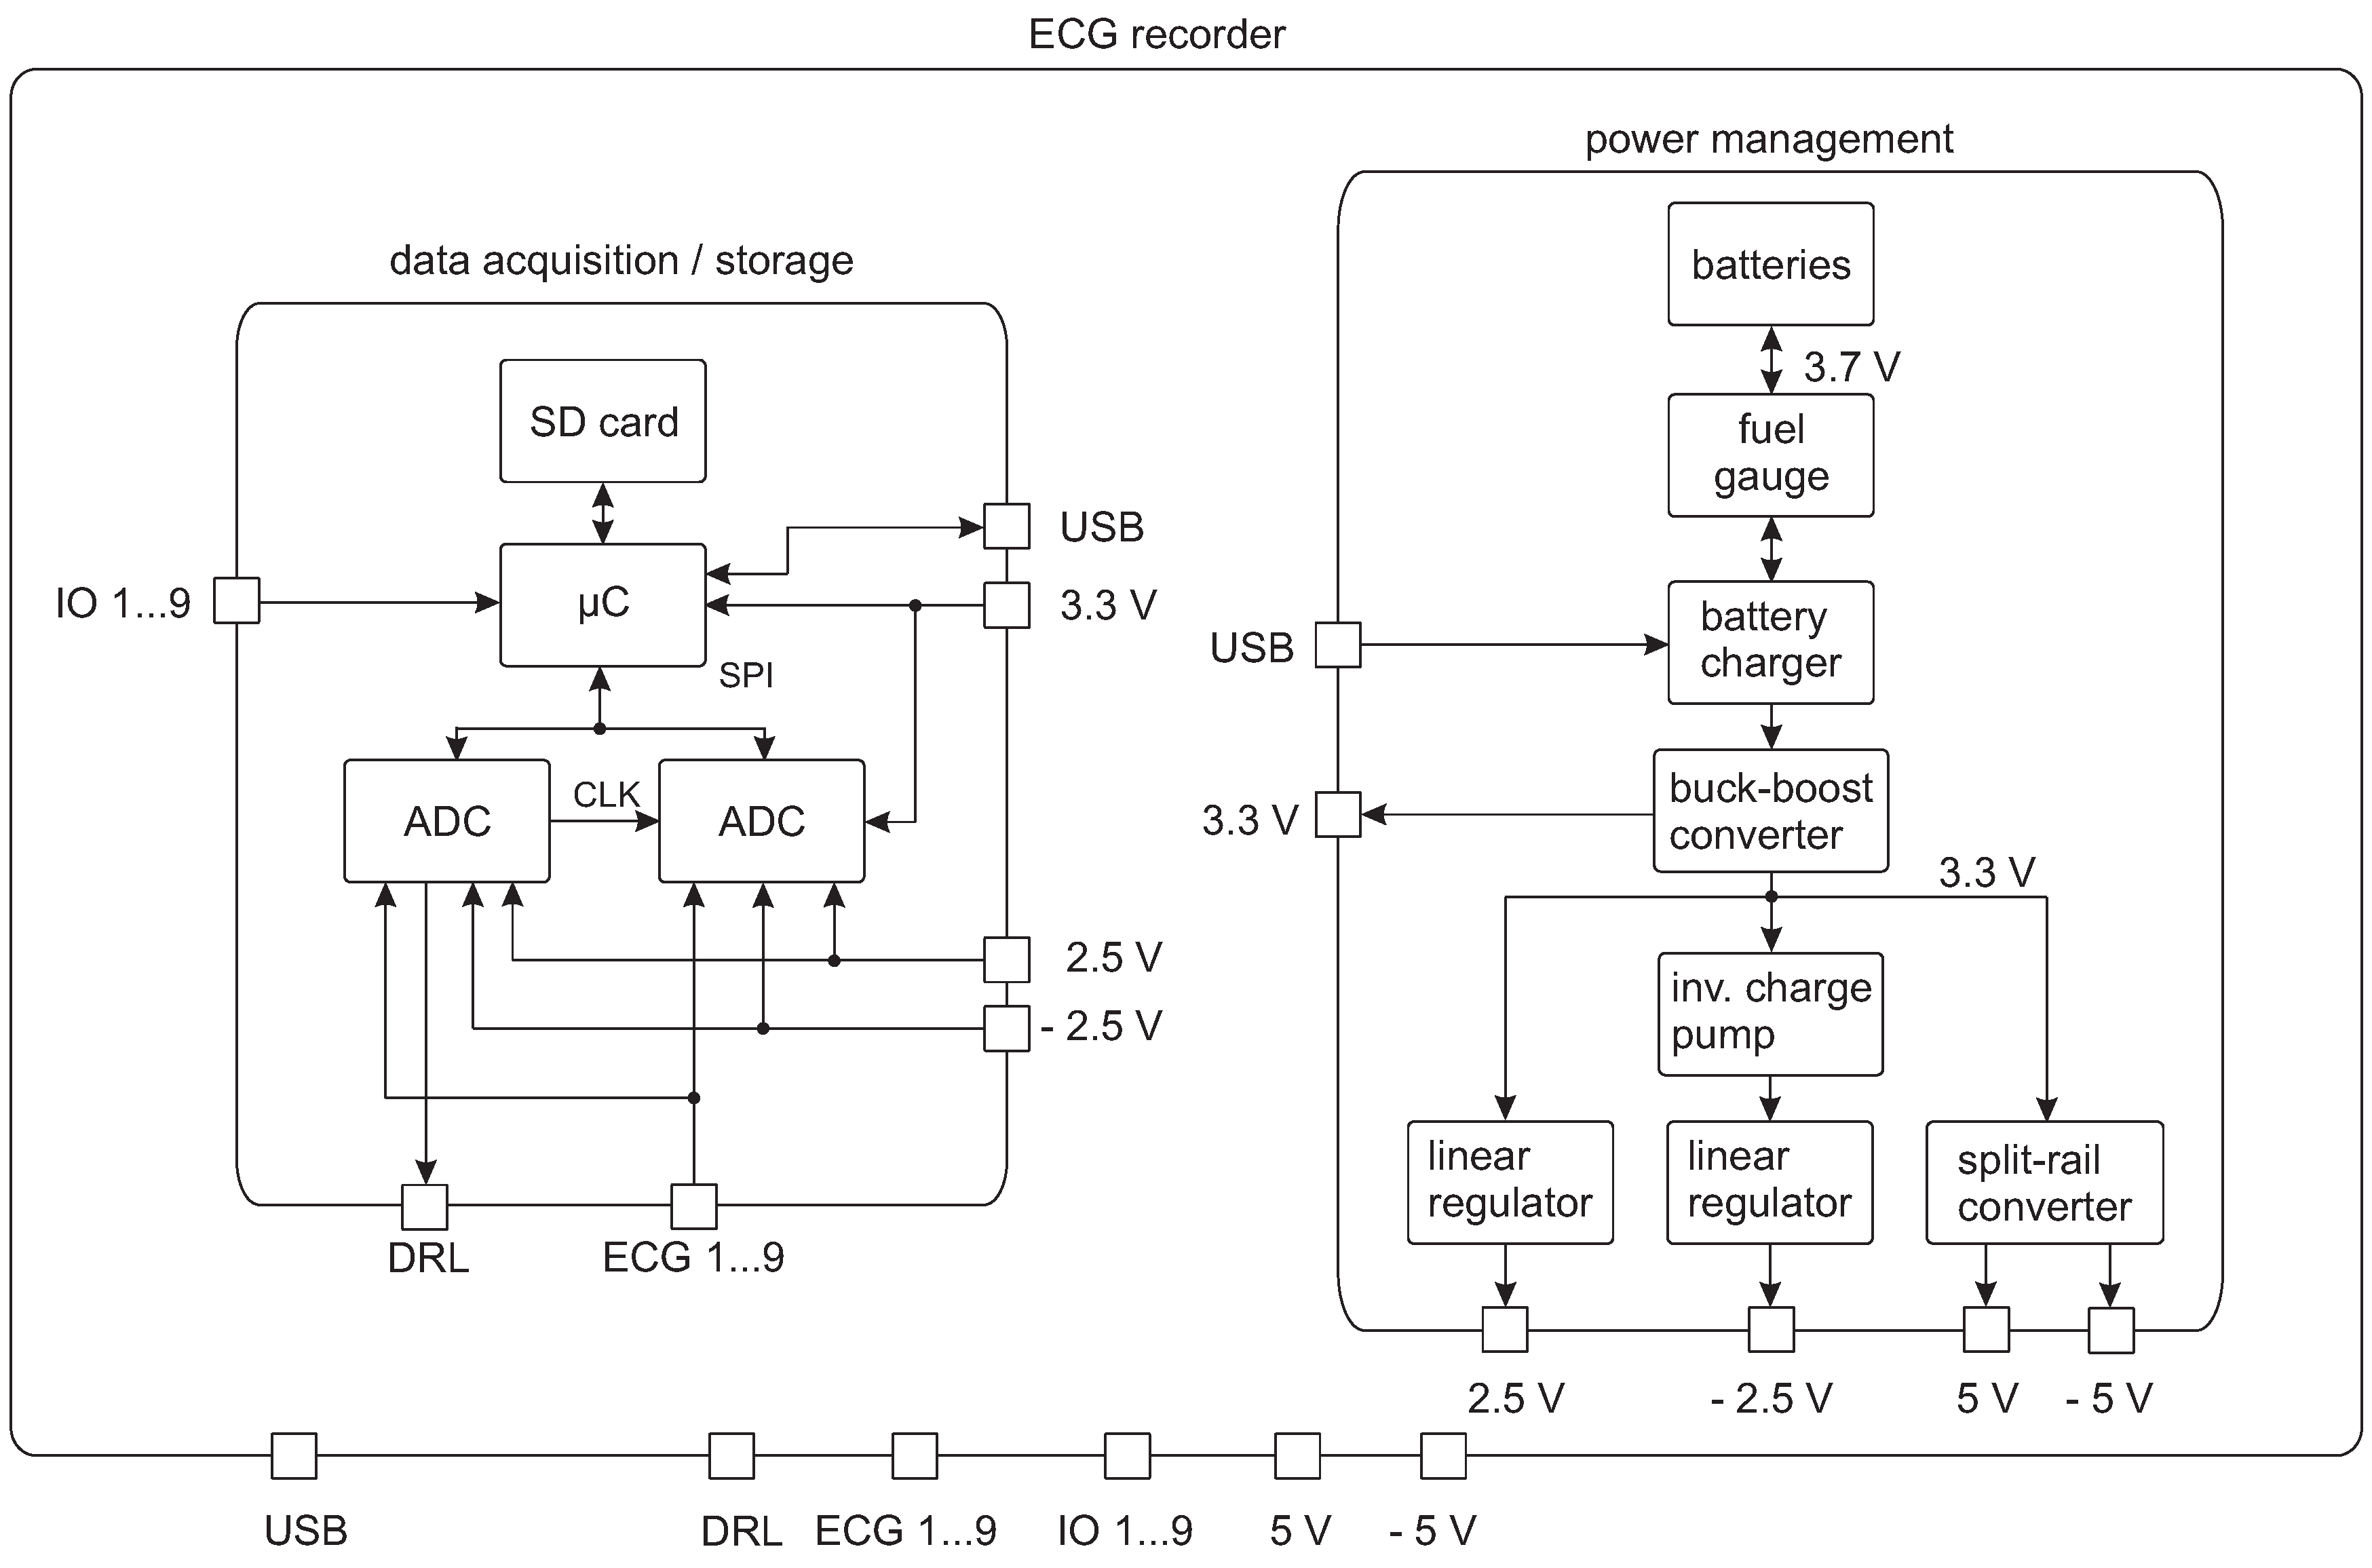
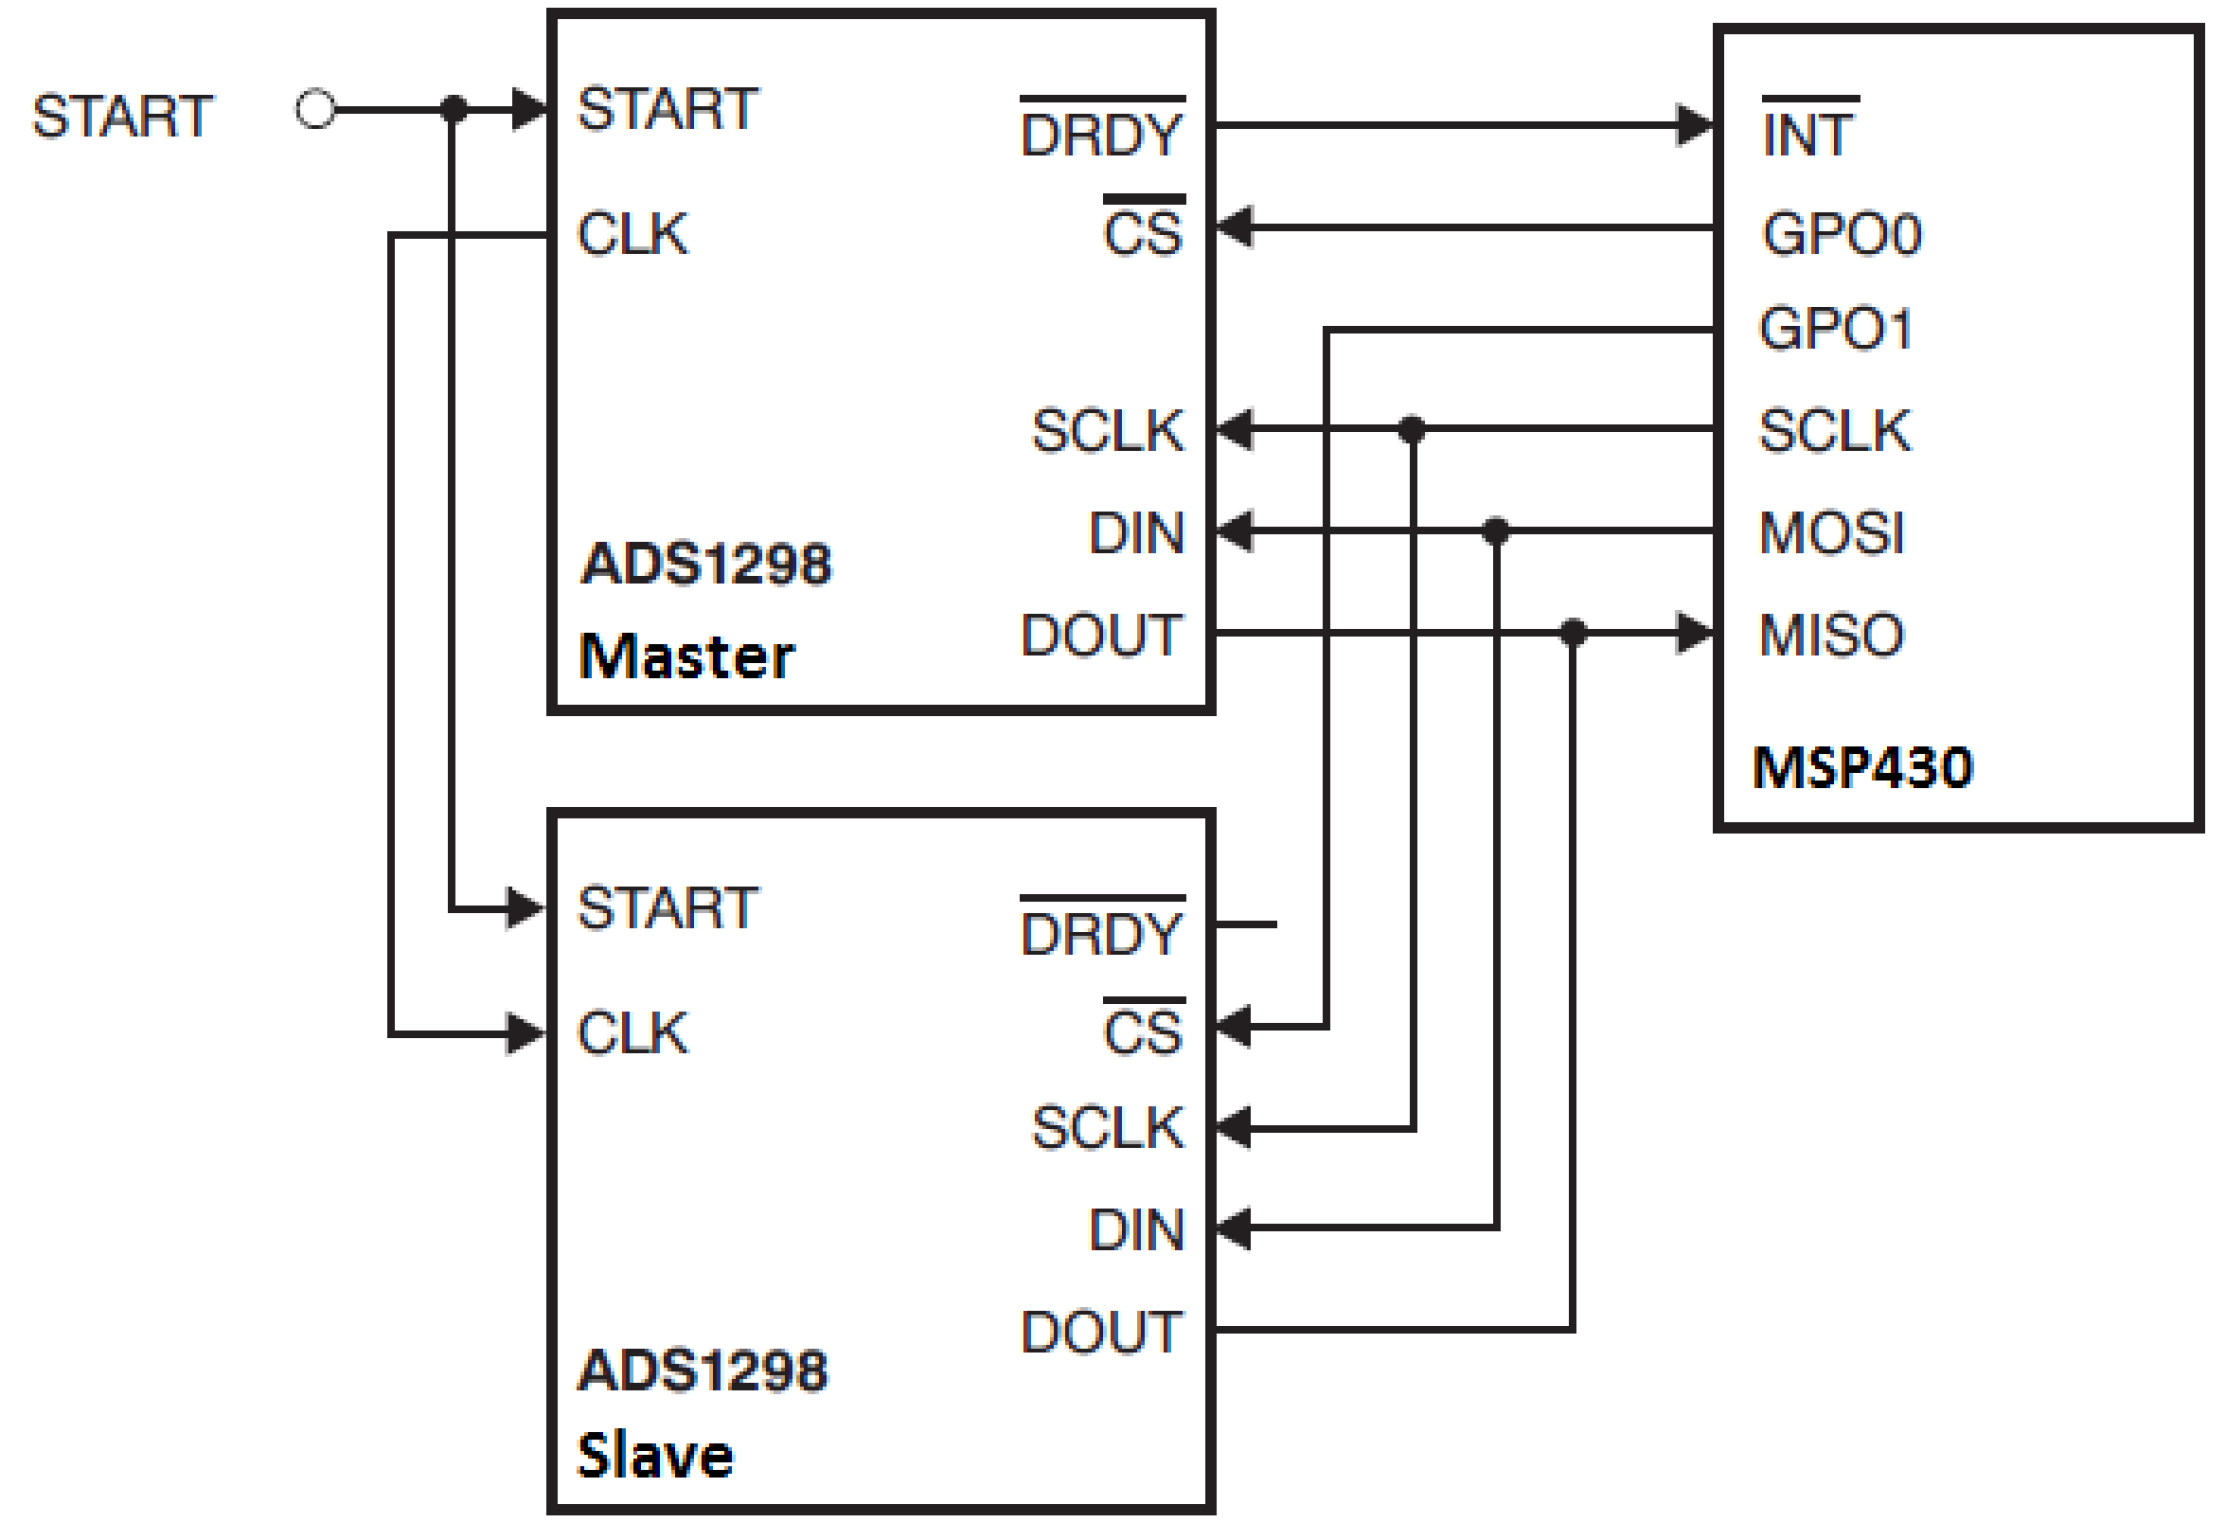
2.2.3. 12-Lead ECG Recorder
2.3. Measurement Setup
3. Results
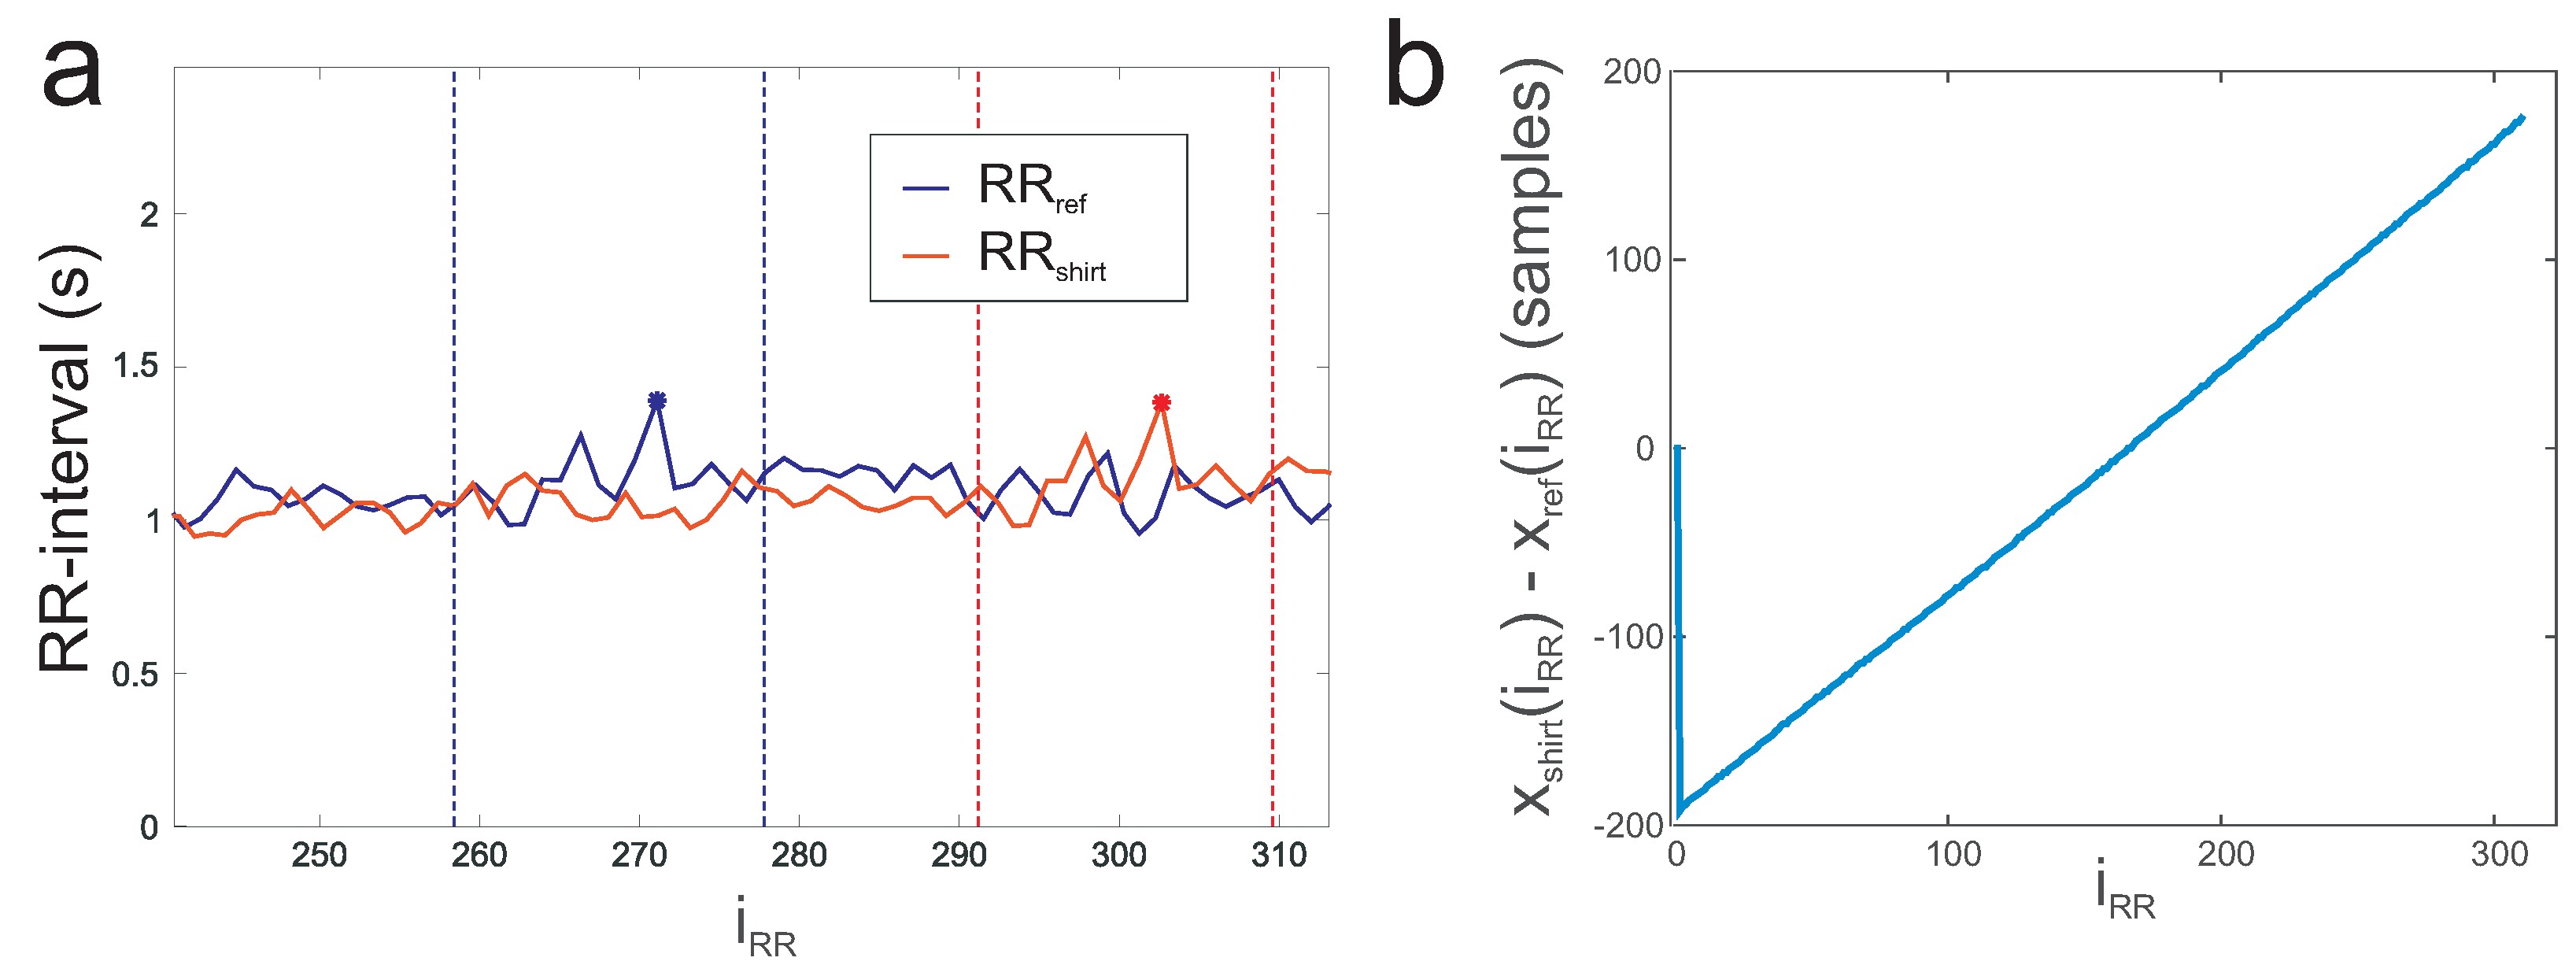
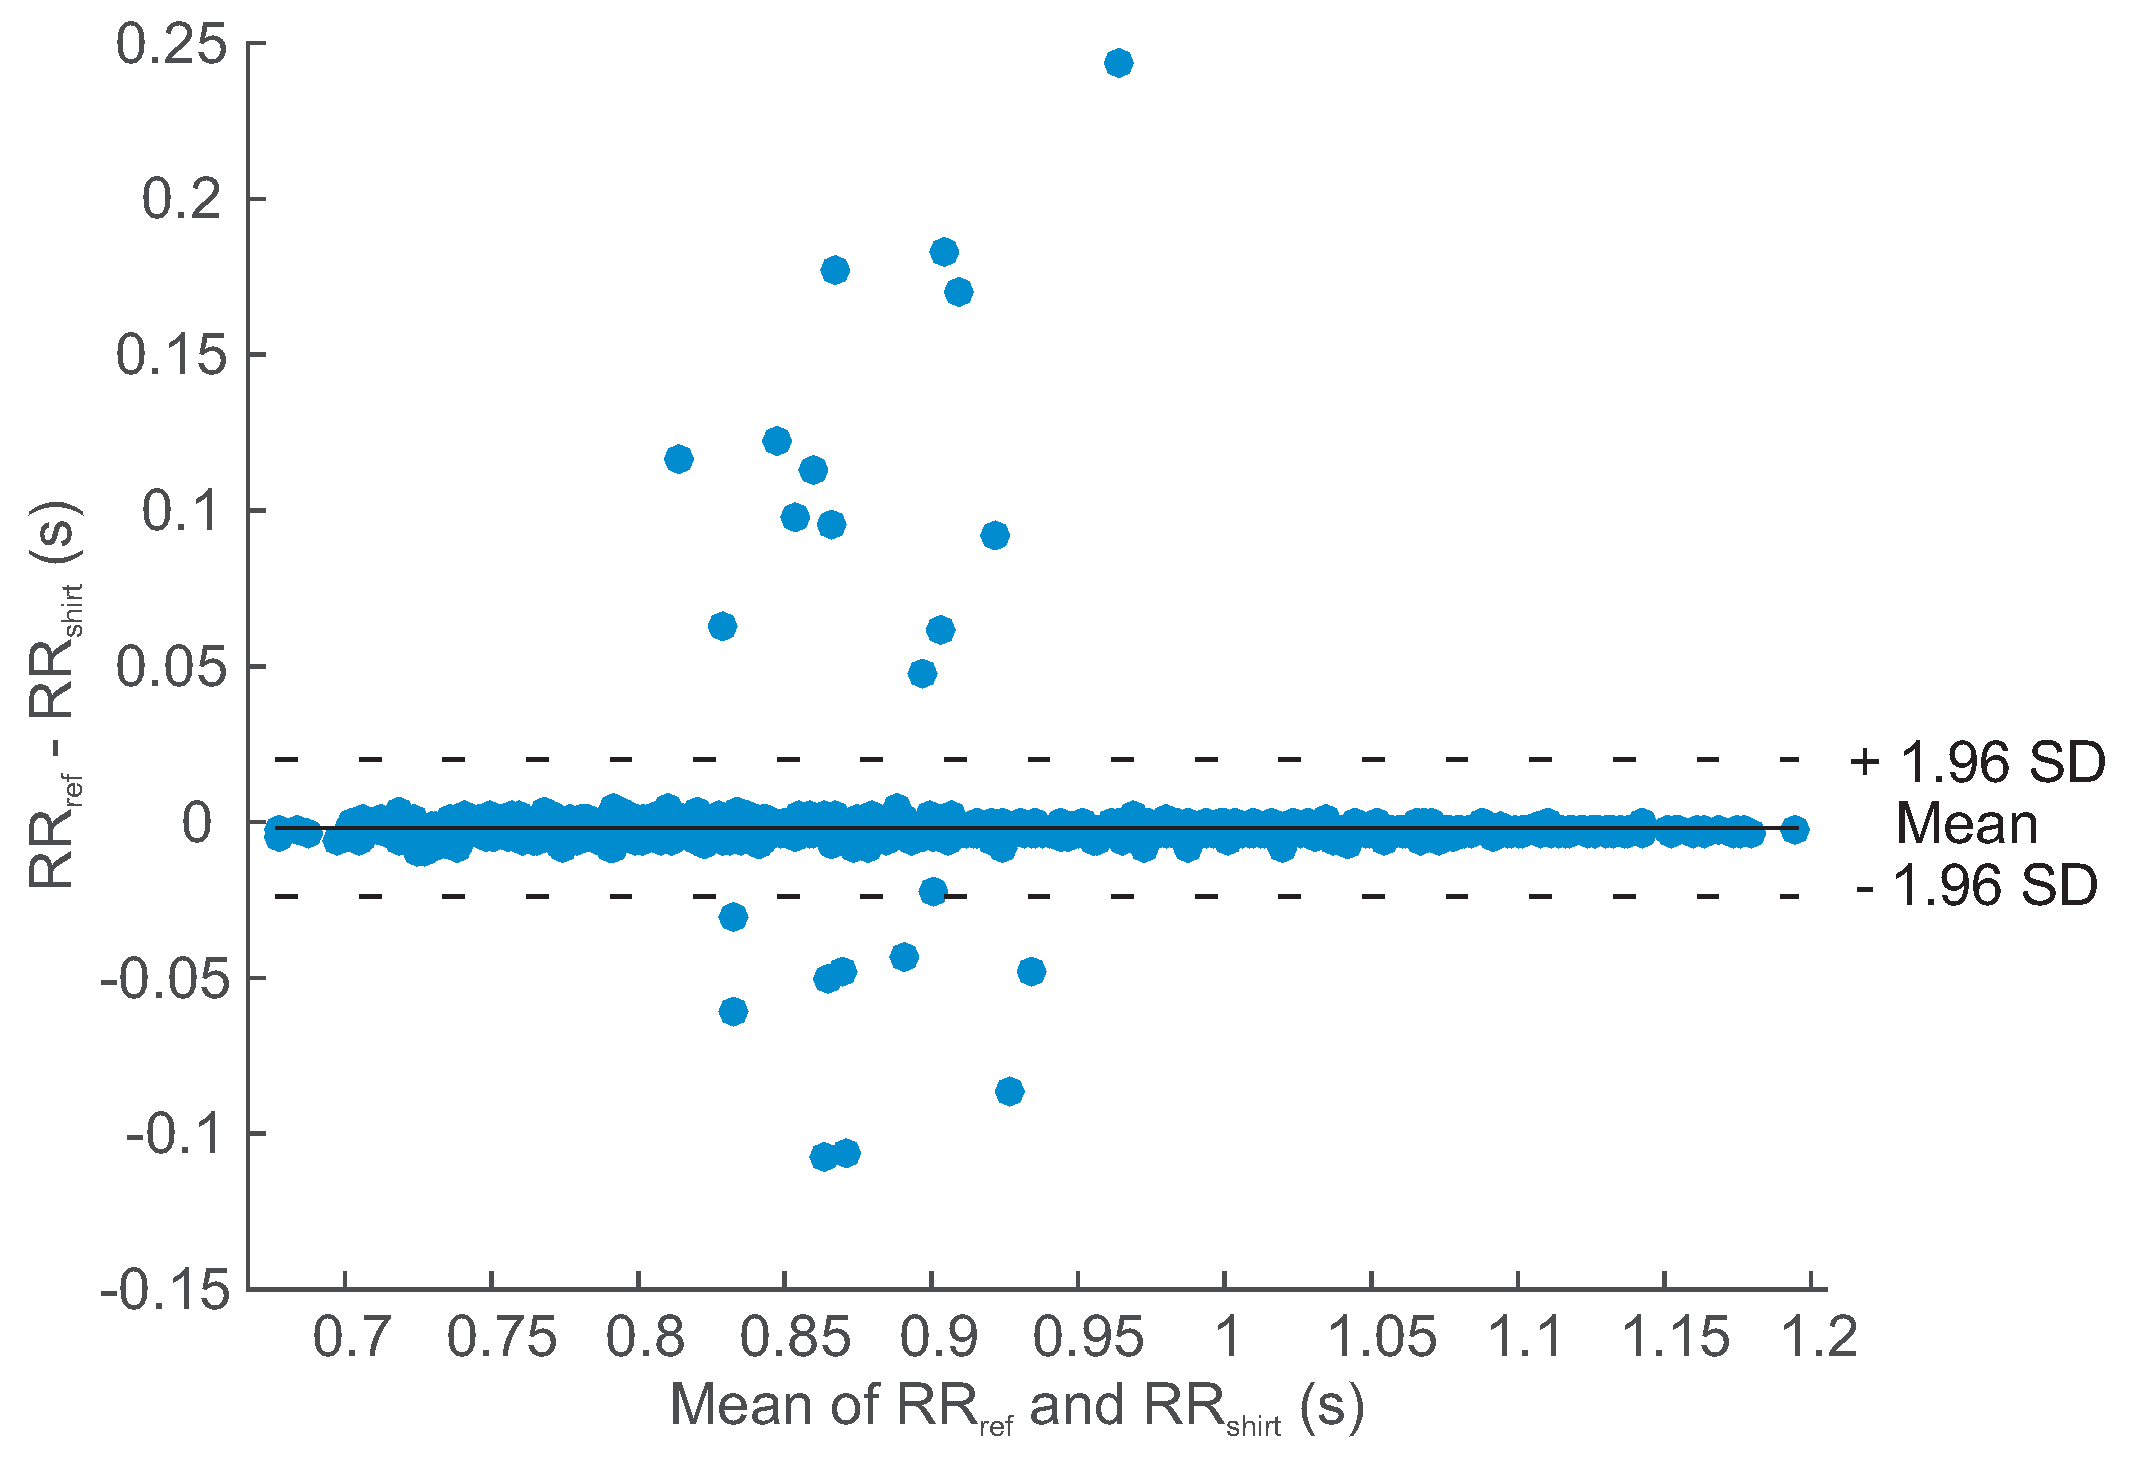
3.1. RR Interval Analysis
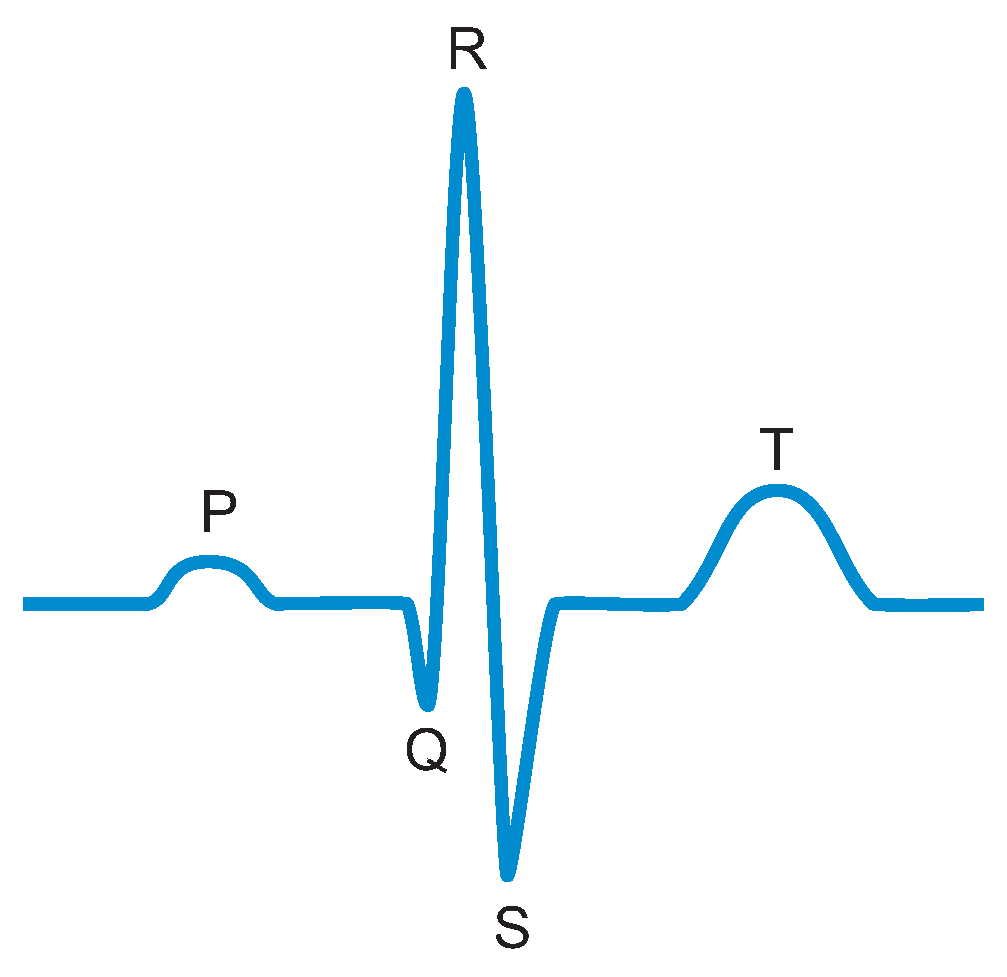
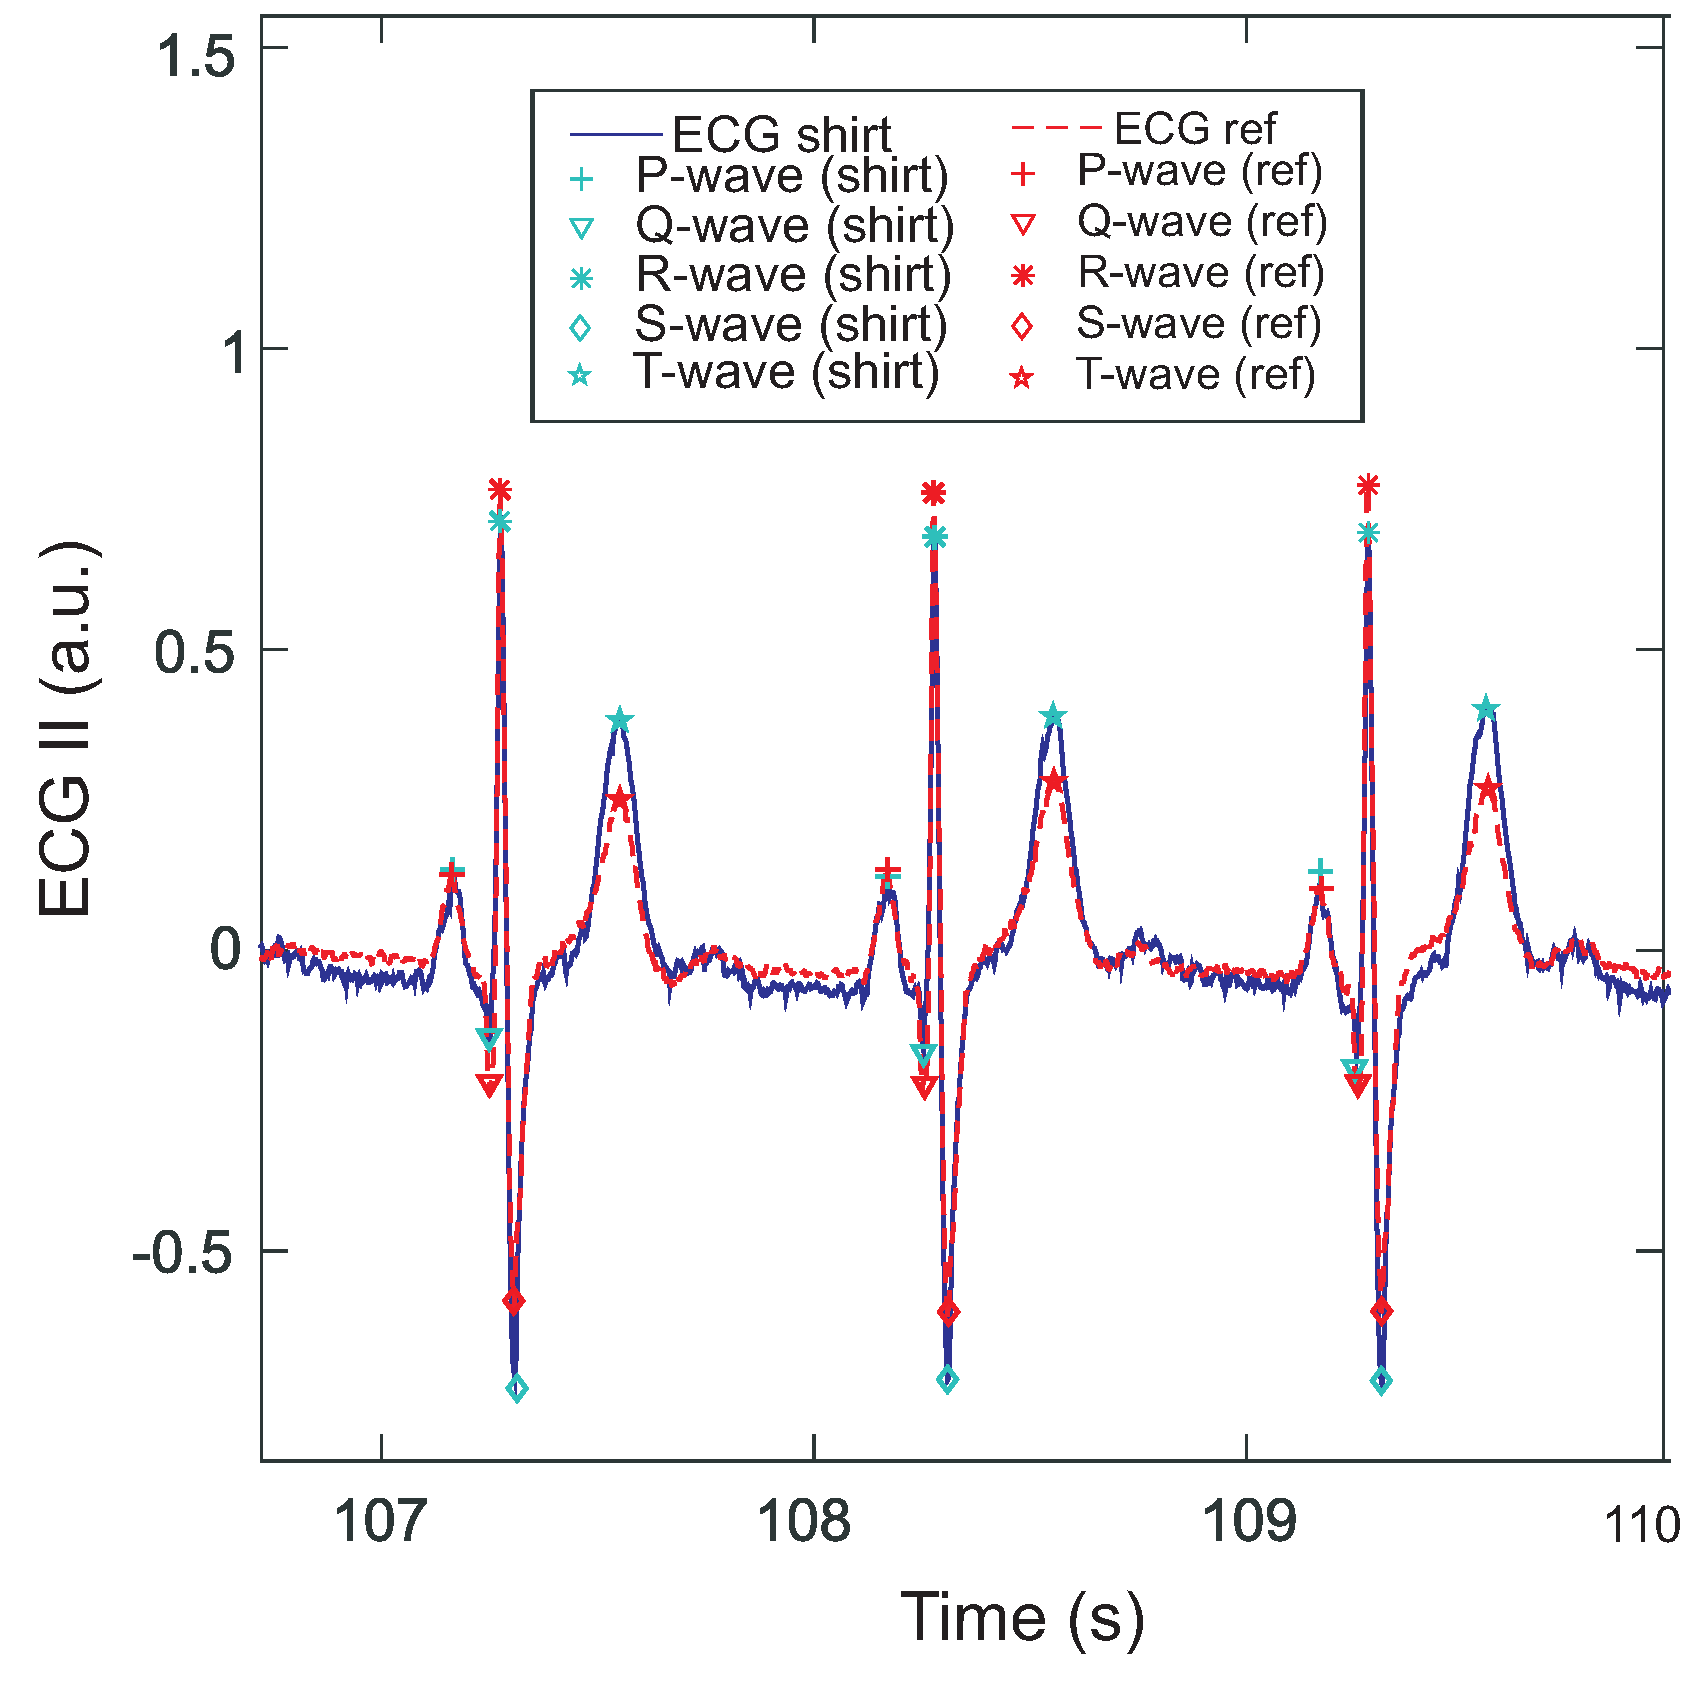
3.2. ECG Wave Analysis
4. Discussion
5. Conclusions
Acknowledgments
Author Contributions
Conflicts of Interest
Abbreviations
| ADC | analogue digital converter |
| aVF | Goldberger lead |
| aVL | Goldberger lead |
| aVR | Goldberger lead |
| CMRR | common mode rejection ratio |
| CS | chip select line |
| DRL | driven right leg |
| ECG | electrocardiography |
| I | Einthoven I lead |
| II | Einthoven II lead |
| III | Einthoven III lead |
| LA | left arm |
| LL | left leg |
| PCB | printed circuit board |
| RA | right arm |
| SPI | serial peripheral interface |
| SPS | samples per second |
| V1 - V6 | Wilson leads |
| WCT | Wilson central terminal |
References
- Kim, S.; Leonhardt, S.; Zimmermann, N.; Kranen, P.; Kensche, D.; Müller, E.; Quix, C. Influence of contact pressure and moisture on the signal quality of a newly developed textile ECG sensor shirt. In Proceedings of the IEEE 5th International Summer School and Symposium on Medical Devices and Biosensors (ISSS-MDBS 2008), Hong Kong, China, 1–3 June 2008; pp. 256–259.
- Linz, T.; Kallmayer, C.; Aschenbrenner, R.; Reichl, H. Fully integrated EKG shirt based on embroidered electrical interconnections with conductive yarn and miniaturized flexible electronics. In Proceedings of the BSN 2006: International Workshop on Wearable and Implantable Body Sensor Networks, Cambridge, MA, USA, 3–5 April 2006; pp. 23–26.
- Ottenbacher, J.; Romer, S.; Kunze, C.; Grosmann, U.; Stork, W. Integration of a Bluetooth Based ECG System into Clothing. In Proceedings of the Eighth International Symposium on Wearable Computers, Arlington, VA, USA, 31 October–3 November 2004; pp. 186–187.
- Karlsson, J.; Wiklund, U. Wireless Monitoring of Heart Rate and Electromyographic Signals using a Smart T-shirt. In Proceedings of the International Workshop on Wearable Micro and Nanosystems for Personalised Health, Valencia, Spain, 21–23 May 2008.
- Cardio Leaf. Available online: http://www.clearbridgevitalsigns.com/shirt.html (accessed on 19 May 2016).
- hWear. Available online: http://www.personal-healthwatch.com/ (accessed on 19 May 2016).
- Meziane, N.; Webster, J.G.; Attari, M.; Nimunkar, A.J. Dry electrodes for electrocardiography. Physiol. Meas. 2013, 34, 47–69. [Google Scholar] [CrossRef]
- Silva, M.; Catarino, A.; Carvalho, H.; Rocha, A.; Monteiro, J.; Montagna, G. Study of vital sign monitoring with textile sensors in swimming pool environment. In Proceedings of the Industrial Electronics Conference (IECON), Porto, Portugal, 3–5 November 2009; pp. 4426–4431.
- Chi, Y.M.; Jung, T.P.; Cauwenberghs, G. Dry-contact and noncontact biopotential electrodes: Methodological review. IEEE Rev. Biomed. Eng. 2010, 3, 106–119. [Google Scholar] [CrossRef] [PubMed]
- Puurtinen, M.M.; Komulainen, S.M.; Kauppinen, P.K.; Malmivuo, J.A.V.; Hyttinen, J.A.K. Measurement of noise and impedance of dry and wet textile electrodes, and textile electrodes with hydrogel. In Proceedings of the Annual International Conference of the IEEE Engineering in Medicine and Biology, New York, NY, USA, 31 August–3 September 2006; pp. 6012–6015.
- Cömert, A.; Hyttinen, J. Investigating the possible effect of electrode support structure on motion artifact in wearable bioelectric signal monitoring. Biomed. Eng. Online 2015, 14, 1–18. [Google Scholar] [CrossRef] [PubMed]
- Meziane, N.; Yang, S.; Shokoueinejad, M.; Webster, J.G.; Attari, M.; Eren, H. Simultaneous comparison of 1 gel with 4 dry electrode types for electrocardiography. Physiol. Meas. 2015, 36, 513–529. [Google Scholar] [CrossRef] [PubMed]
- Pani, D.; Dessì, A.; Saenz-Congolo, J.F.; Barabino, G.; Fraboni, B.; Bonfilgio, A. Fully Textile, PEDOT:PSS Based Electrodes for Wearable ECG Monitoring Systems. IEEE Trans. Biomed. Eng. 2016, 63, 540–549. [Google Scholar] [CrossRef] [PubMed]
- Sun, Y.; Yu, X. Capacitive Biopotential Measurement for Electrophysiological Signal Acquisition: A Review. IEEE Sens. J. 2016, 16, 2832–2853. [Google Scholar] [CrossRef]
- Lim, Y.G.; Kim, K.K.; Park, K.S. ECG measurement on a chair without conductive contact. IEEE Trans. Biomed. Eng. 2006, 53, 956–959. [Google Scholar] [PubMed]
- Leonhardt, S.; Aleksandrowicz, A. Non-contact ECG monitoring for automotive application. In Proceedings of the 5th International Workshop on Wearable and Implantable Body Sensor Networks, Hong Kong, China, 1–3 June 2008; pp. 183–185.
- Ishijima, M. Monitoring of Electrocardiograms in Bed Without Utilizing Body Surface Electrodes. IEEE Trans. Biomed. Eng. 1993, 40, 593–594. [Google Scholar] [CrossRef] [PubMed]
- Lim, Y.G.; Kim, K.K.; Park, K.S. ECG recording on a bed during sleep without direct skin-contact. IEEE Trans. Biomed. Eng. 2007, 54, 718–725. [Google Scholar] [CrossRef] [PubMed]
- Wu, K.F.; Zhang, Y.T. Contactless and continuous monitoring of heart electric activities through clothes on a sleeping bed. In Proceedings of the 2008 International Conference on Information Technology and Applications in Biomedicine, Shenzhen, China, 30–31 May 2008; pp. 282–285.
- Ueno, A.; Yama, Y. Unconstrained monitoring of ECG and respiratory variation in infants with underwear during sleep using a bed-sheet electrode unit. In Proceedings of the 30th Annual International Conference of the IEEE Engineering in Medicine and Biology Society, Vancouver, BC, Canada, 20–24 August 2008; pp. 2329–2332.
- Kim, K.K.; Lim, Y.K.; Park, K.S. The electrically non-contacting ECG measurement on the toilet seat using the capacitively-coupled insulated electrodes. In Proceedings of the Annual International Conference of the IEEE Engineering in Medicine and Biology Society, Buenos Aires, Argentina, 1–5 September 2004; pp. 2375–2378.
- Lim, Y.K.; Kim, K.K.; Park, K.S. The ECG measurement in the bathtub using the insulated electrodes. In Proceedings of the Annual International Conference of the IEEE Engineering in Medicine and Biology Society, Buenos Aires, Argentina, 1–5 September 2004.
- Malmivuo, J.; Plonsey, R. Bioelectromagnetism: Principles and Applications of Bioelectric and Biomagnetic Fields; Oxford University Press: Oxford, MI, USA, 2012; pp. 1–506. [Google Scholar]
- Sanchez, B.; Praveen, A.; Bartolome, E.; Soundarapandian, K.; Bragos, R. Minimal implementation of an AFE4300-based spectrometer for electrical impedance spectroscopy measurements. J. Phys. 2013, 434, 012014. [Google Scholar] [CrossRef]
- Cömert, A.; Hyttinen, J. Impedance spectroscopy of changes in skin–electrode impedance induced by motion. Biomed. Eng. Online 2014, 13, 149. [Google Scholar] [CrossRef] [PubMed]
- Tallgren, P.; Vanhatalo, S.; Kaila, K.; Voipio, J. Evaluation of commercially available electrodes and gels for recording of slow EEG potentials. Clin. Neurophysiol. 2005, 116, 799–806. [Google Scholar] [CrossRef] [PubMed]
- Bruser, C.; Kortelainen, J.M.; Winter, S.; Tenhunen, M.; Parkka, J.; Leonhardt, S. Improvement of Force-Sensor-Based Heart Rate Estimation Using Multichannel Data Fusion. IEEE J. Biomed. Health Inform. 2015, 19, 227–235. [Google Scholar] [CrossRef] [PubMed]
- Wartzek, T.; Lammersen, T.; Eilebrecht, B.; Walter, M.; Leonhardt, S. Triboelectricity in capacitive biopotential measurements. IEEE Trans. Biomed. Eng. 2011, 58, 1268–1277. [Google Scholar] [CrossRef] [PubMed]
- Eilebrecht, B.; Czaplik, M.; Wartzek, T.; Schauerte, P.; Leonhardt, S. Analysis of influences on capacitive ECG measurements based on a closed loop model. In Proceedings of the 6th Meeting of the European Study Group on Cardiovascular Oscillations (ESGCO 2010), Berlin, Germany, 12–14 April 2010; pp. 12–15.
- Reyes, B.A.; Posada-Quintero, H.F.; Bales, J.R.; Clement, A.L.; Pins, G.D.; Swiston, A.; Riistama, J.; Florian, J.P.; Shykoff, B.; Qin, M.; et al. Novel electrodes for underwater ECG monitoring. IEEE Trans. Biomed. Eng. 2014, 61, 1863–1876. [Google Scholar] [CrossRef] [PubMed]


| Subject | Scenario | Relative Error | Coverage | Duration (s) | Beats |
|---|---|---|---|---|---|
| S1 | lying | 0.0024 | 0.9942 | 314.75 | 305 |
| S1 | sitting | 0.0022 | 0.9939 | 296.31 | 344 |
| S1 | walking * | 0.755 | 0.4952 | 350.01 | 468 |
| S2 | lying | 0.0022 | 0.9775 | 295.90 | 284 |
| S2 | sitting | 0.0029 | 0.9898 | 297.54 | 323 |
| S2 | walking | 0.0031 | 0.9938 | 290.57 | 368 |
| S3 | lying | 0.0216 | 0.8881 | 300.82 | 295 |
| S3 | sitting | 0.0208 | 0.949 | 296.31 | 305 |
| S3 | walking | 0.0218 | 0.9449 | 296.31 | 365 |
| Mean | 0.0096 * | 0.9664 * | 304.28 | 340 |
| Lead | Correlation | Difference (ms) | ||||||||
|---|---|---|---|---|---|---|---|---|---|---|
| P | Q | R | S | T | P | Q | R | S | T | |
| I | 0.900 | 0.952 | 0.957 | 0.957 | 0.762 | 2 | 10 | 2 | −4 | −2 |
| II | 0.879 | 0.957 | 0.957 | 0.957 | 0.957 | 2 | 0 | 2 | 2 | −2 |
| III | 0.939 | 0.957 | 0.957 | 0.958 | 0.882 | 2 | 2 | 2 | 4 | 0 |
| aVR | 0.947 | 0.957 | 0.957 | 0.957 | 0.863 | 0 | -2 | 2 | 0 | 8 |
| aVL | 0.871 | 0.953 | 0.957 | 0.953 | 0.732 | 26 | 2 | 2 | 14 | −50 |
| aVF | 0.942 | 0.957 | 0.957 | 0.958 | 0.807 | 2 | 2 | 2 | 2 | 4 |
| V1 | 0.952 | 0.955 | 0.957 | 0.954 | 0.706 | 2 | 4 | 2 | −4 | 4 |
| V2 | 0.943 | 0.957 | 0.957 | 0.955 | 0.826 | 2 | 2 | 2 | 0 | 12 |
| V3 | 0.936 | 0.956 | 0.957 | 0.957 | 0.875 | −2 | 0 | 2 | −2 | 22 |
| V4 | 0.917 | 0.957 | 0.957 | 0.957 | 0.757 | 0 | 4 | 2 | 4 | 6 |
| V5 | 0.892 | 0.957 | 0.957 | 0.957 | 0.787 | 0 | 4 | 2 | 4 | 8 |
| V6 | 0.920 | 0.957 | 0.957 | 0.958 | 0.850 | 0 | 4 | 2 | 6 | 8 |
| Mean | 0.920 | 0.956 | 0.957 | 0.957 | 0.817 | 3 | 3 | 2 | 2 | 2 |
| Lead | Correlation | Difference (ms) | ||||||||
|---|---|---|---|---|---|---|---|---|---|---|
| P | Q | R | S | T | P | Q | R | S | T | |
| I | 0.941 | 0.975 | 0.978 | 0.976 | 0.739 | −4 | 4 | −4 | −6 | 130 |
| II | 0.909 | 0.977 | 0.978 | 0.977 | 0.928 | −4 | −6 | −4 | −4 | −22 |
| III | 0.914 | 0.978 | 0.978 | 0.977 | 0.685 | −4 | −2 | −4 | −2 | −22 |
| aVR | 0.944 | 0.977 | 0.978 | 0.977 | 0.633 | −4 | −10 | −4 | −6 | 156 |
| aVL | 0.874 | 0.975 | 0.978 | 0.968 | 0.808 | −8 | −2 | −4 | −2 | −22 |
| aVF | 0.931 | 0.978 | 0.978 | 0.977 | 0.648 | −4 | −2 | −4 | −2 | −2 |
| V1 | 0.946 | 0.973 | 0.978 | 0.970 | 0.641 | −6 | −13 | −4 | −8 | −6 |
| V2 | 0.934 | 0.977 | 0.978 | 0.977 | 0.742 | −4 | −4 | −4 | −14 | 8 |
| V3 | 0.928 | 0.974 | 0.978 | 0.976 | 0.827 | −8 | −6 | −4 | −4 | 24 |
| V4 | 0.884 | 0.977 | 0.978 | 0.978 | 0.624 | −4 | −2 | −4 | 0 | −6 |
| V5 | 0.872 | 0.976 | 0.978 | 0.977 | 0.632 | −4 | 0 | −4 | 0 | 4 |
| V6 | 0.903 | 0.977 | 0.978 | 0.977 | 0.608 | −8 | 0 | −4 | 2 | 2 |
| Mean | 0.915 | 0.976 | 0.978 | 0.976 | 0.710 | −5 | −4 | −4 | −4 | 20 |
| Lead | Correlation | Difference (ms) | ||||||||
|---|---|---|---|---|---|---|---|---|---|---|
| P | Q | R | S | T | P | Q | R | S | T | |
| I | 0.739 | 0.901 | 0.920 | 0.913 | 0.580 | 8 | 8 | 2 | −4 | 150 |
| II | 0.608 | 0.921 | 0.920 | 0.918 | 0.600 | 0 | 0 | 2 | 0 | −10 |
| III | 0.678 | 0.921 | 0.920 | 0.918 | 0.439 | 2 | 0 | 2 | 0 | 0 |
| aVR | 0.739 | 0.920 | 0.920 | 0.918 | 0.397 | 2 | −2 | 2 | 0 | 140 |
| aVL | 0.713 | 0.910 | 0.920 | 0.909 | 0.384 | −20 | 12 | 2 | 14 | −20 |
| aVF | 0.724 | 0.920 | 0.920 | 0.918 | 0.440 | −2 | 2 | 2 | 2 | 8 |
| V1 | 0.701 | 0.903 | 0.920 | 0.895 | 0.240 | −16 | 2 | 2 | -2 | 8 |
| V2 | 0.731 | 0.893 | 0.920 | 0.890 | 0.274 | −12 | −2 | 2 | 0 | 30 |
| V3 | 0.748 | 0.904 | 0.920 | 0.904 | 0.477 | 6 | 2 | 2 | 2 | 24 |
| V4 | 0.663 | 0.913 | 0.920 | 0.910 | 0.296 | −12 | 4 | 2 | 4 | 10 |
| V5 | 0.691 | 0.912 | 0.920 | 0.909 | 0.346 | −10 | 4 | 2 | 4 | 20 |
| V6 | 0.704 | 0.908 | 0.920 | 0.907 | 0.368 | −14 | 2 | 2 | 4 | 20 |
| Mean | 0.703 | 0.910 | 0.920 | 0.909 | 0.403 | −6 | 3 | 2 | 2 | 32 |
© 2016 by the authors; licensee MDPI, Basel, Switzerland. This article is an open access article distributed under the terms and conditions of the Creative Commons Attribution (CC-BY) license (http://creativecommons.org/licenses/by/4.0/).
Share and Cite
Boehm, A.; Yu, X.; Neu, W.; Leonhardt, S.; Teichmann, D. A Novel 12-Lead ECG T-Shirt with Active Electrodes. Electronics 2016, 5, 75. https://doi.org/10.3390/electronics5040075
Boehm A, Yu X, Neu W, Leonhardt S, Teichmann D. A Novel 12-Lead ECG T-Shirt with Active Electrodes. Electronics. 2016; 5(4):75. https://doi.org/10.3390/electronics5040075
Chicago/Turabian StyleBoehm, Anna, Xinchi Yu, Wilko Neu, Steffen Leonhardt, and Daniel Teichmann. 2016. "A Novel 12-Lead ECG T-Shirt with Active Electrodes" Electronics 5, no. 4: 75. https://doi.org/10.3390/electronics5040075