Article

A Numerical Estimation of a RFID Reader Field and SAR inside a Blood Bag at UHF

Department of Electrical and electronic Engineering (DIEE), University of Cagliari, Piazza d’Armi, 09123 Cagliari, Italy
*
Author to whom correspondence should be addressed.
Electronics 2016, 5(4), 77; https://doi.org/10.3390/electronics5040077
Submission received: 23 September 2016 / Revised: 31 October 2016 / Accepted: 4 November 2016 / Published: 8 November 2016
(This article belongs to the Special Issue RFID Systems and Applications)

Abstract

:
In this paper, the effects of UHF electromagnetic fields produced by a RFID reader on a blood bag are evaluated numerically in several configurations. The results of the simulation, field level and distribution, specific absorption rate (SAR), and heating time show that an exposure to a typical reader field leads to a temperature increase smaller than 0.1 C and to a SAR smaller than 1 W/kg. As a consequence, no adverse biological effects occur during a typical UHF RFID reading cycle on a blood bag. Therefore, the blood contained in a bag traced using UHF-RFID is as safe as those traced using barcodes. The proposed analysis supports the use of UHF RFID in the blood transfusion supply chain.

1. Introduction

Healthcare items are one of the most important applications of traceability, since those items must be handled often in emergency conditions and the effects of errors could even be fatal. Among those items, the traceability of blood bags has drawn the greatest amount of attention, since these bags are prepared, stored, and used in different locations, and sometimes in different buildings or even handled by different organizations. The present leading traceability technology is the barcode, but its limitations are well-known. Barcodes require physical contact between the codes and the reader, or at least a very small distance, and good alignment between the two. Moreover, each barcode most be scanned individually. Therefore, a considerable manipulation of the items, or the reader, by an operator is required, and this slows down significantly the operations for large stocks of items [1]. Furthermore, barcodes are subjected to mechanical stresses and external agents, so that they can be easily damaged. Moreover, blood bags must be complemented with a significant amount of extra information, such as the blood group or the harvest date, which cannot be handled by barcodes, because of the limited amount of information they can store. For these reasons, RFID technology [1] is becoming the leading alternative, as it offers a number of significant advantages [1,2,3,4,5]; however, to become fully effective, this technology needs a reorganization of the processes [6]. A significant reduction in the reading time can be obtained, e.g., using a portal reader. Nevertheless, its location must be chosen taking into account both the blood movement and the electromagnetic environment. Moreover, these advantages can effectively be exploited only as long as the electromagnetic (EM) field of the RFID reader does not cause any adverse effects on the blood. It is well-known that a strong EM field can heat the blood. A large heating may even denature the blood, but for smaller temperature increase, some adverse effects can appear, such as the hemolysis of red cells and the modification of blood pH [7], and render the blood useless. Therefore, every use of RFID in blood traceability must assure that no detectable heating occurs during the reading cycle. Despite its interest [3], no standard rules exist at the moment about the use of RFID in blood bag traceability. Only a set of guidelines have been issued by the International Society of Blood Transfusion (ISBT). These guidelines strongly support the use of RFID in the HF band (i.e., at 13.56 MHz) for blood bags [8]. The main reason leading ISBT toward this choice is the quasi-static nature of this field, which is not absorbed by the blood and therefore does not heat the blood itself Such claims are based on a Food and Drug Administration (FDA) evaluation of the effects of RF on blood cells [9,10,11], done in 2008. The result of this evaluation was that no heating and no red cell or platelet damages occur during typical HF-RFID reading cycles, nor are higher fields or longer reading times used. However, HF-RFID advantages come together with some significant and intrinsic technical limitations, namely a reduced reading range and a low channel capacity, which lead to a long reading time. Moreover, multiple tag reading is possible, but not effective enough for the need of large collecting centers. Therefore, a comparison between HF-RFID and UHF-RFID is in order.
The presence of the ISO 18000-3 [12] standard, which defines the specification of the RF interface, and the worldwide availability of the HF-RFID band can be important, but the other features of HF-RFID are quite easily matched by RFID in the UHF band. All the limitations of HF-RFID can be overcome by UHF-RFID [13]; hence, this trade-off would be clearly in favor of UHF-RFID, as long as it does not cause detectable heating of the blood during a reading cycle. No systematic study on the effect of UHF electromagnetic fields on the blood has been performed. Only a few experimental data have been collected [14] by exposing blood bags to the field of a portal reader for a time longer than a typical reading cycle. After all the exposures, no significant variation of the biological indexes (pH levels, platelet (PLT) count, and PLT aggregation rate) was found. The effect on the blood temperature has not been recorded. Therefore, the only data available have been obtained by a numerical simulation [15,16]. However, the setups chosen in [15], i.e., a few cylindrical tubes filled with blood plasma, exposed in a waveguide, or located in close proximity of a coil, are completely different from the actual reader field and bag shape, so the aim of this paper is to numerically evaluate the increase in temperature and the specific absorption rate (SAR) of a blood bag with a realistic shape, when exposed to a field very close to a typical UHF reader field, in order to assess, at least from this point of view, the use of UHF-RFID in blood bags traceability.

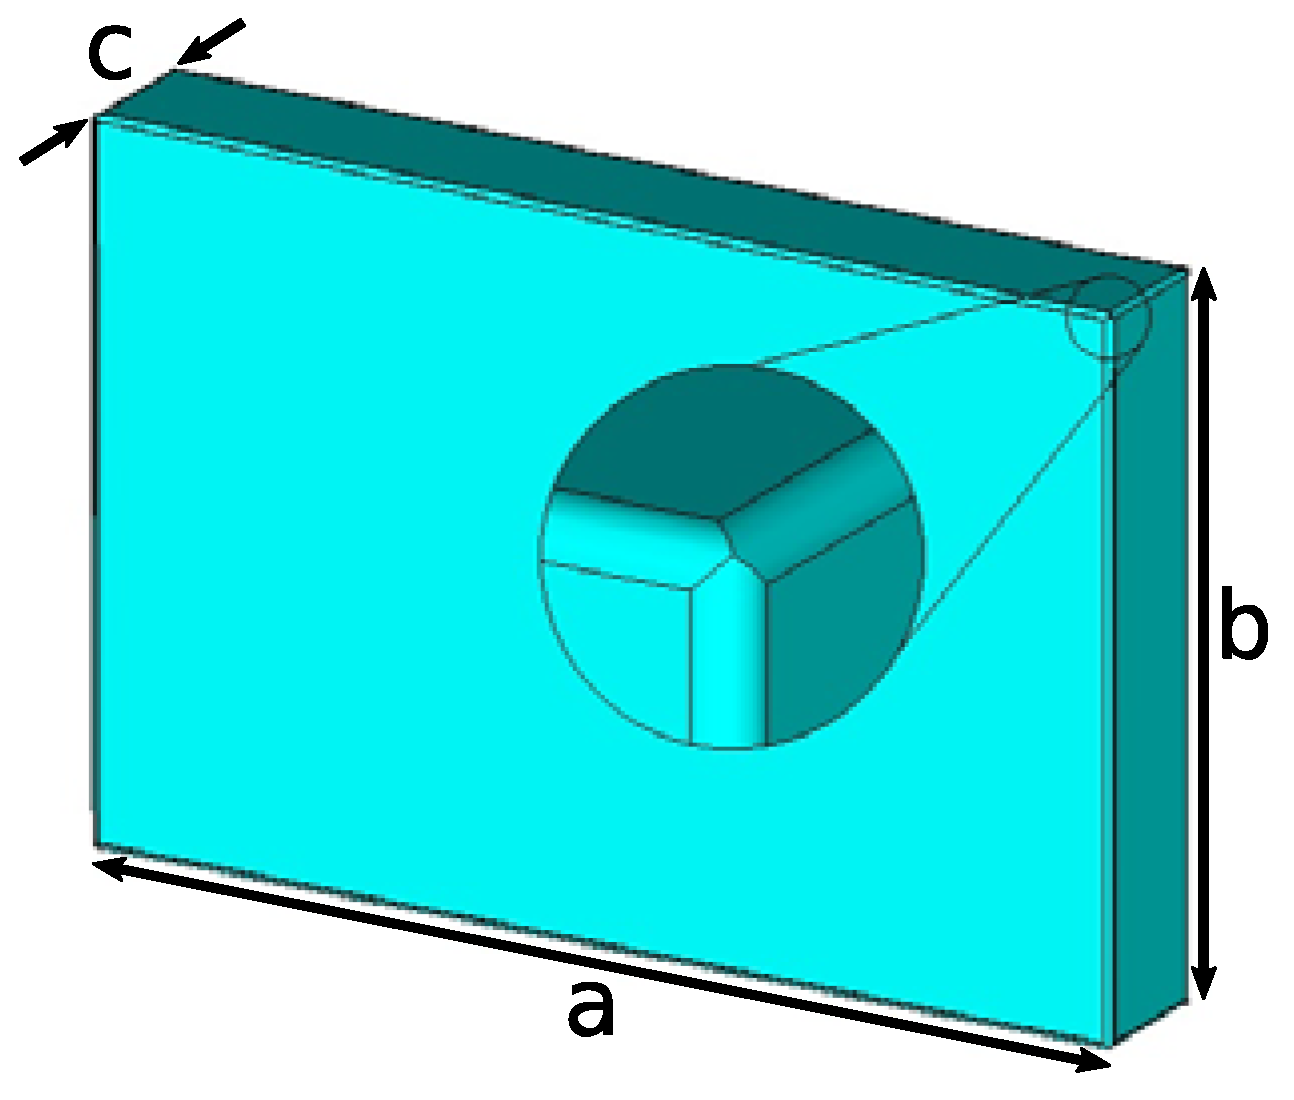
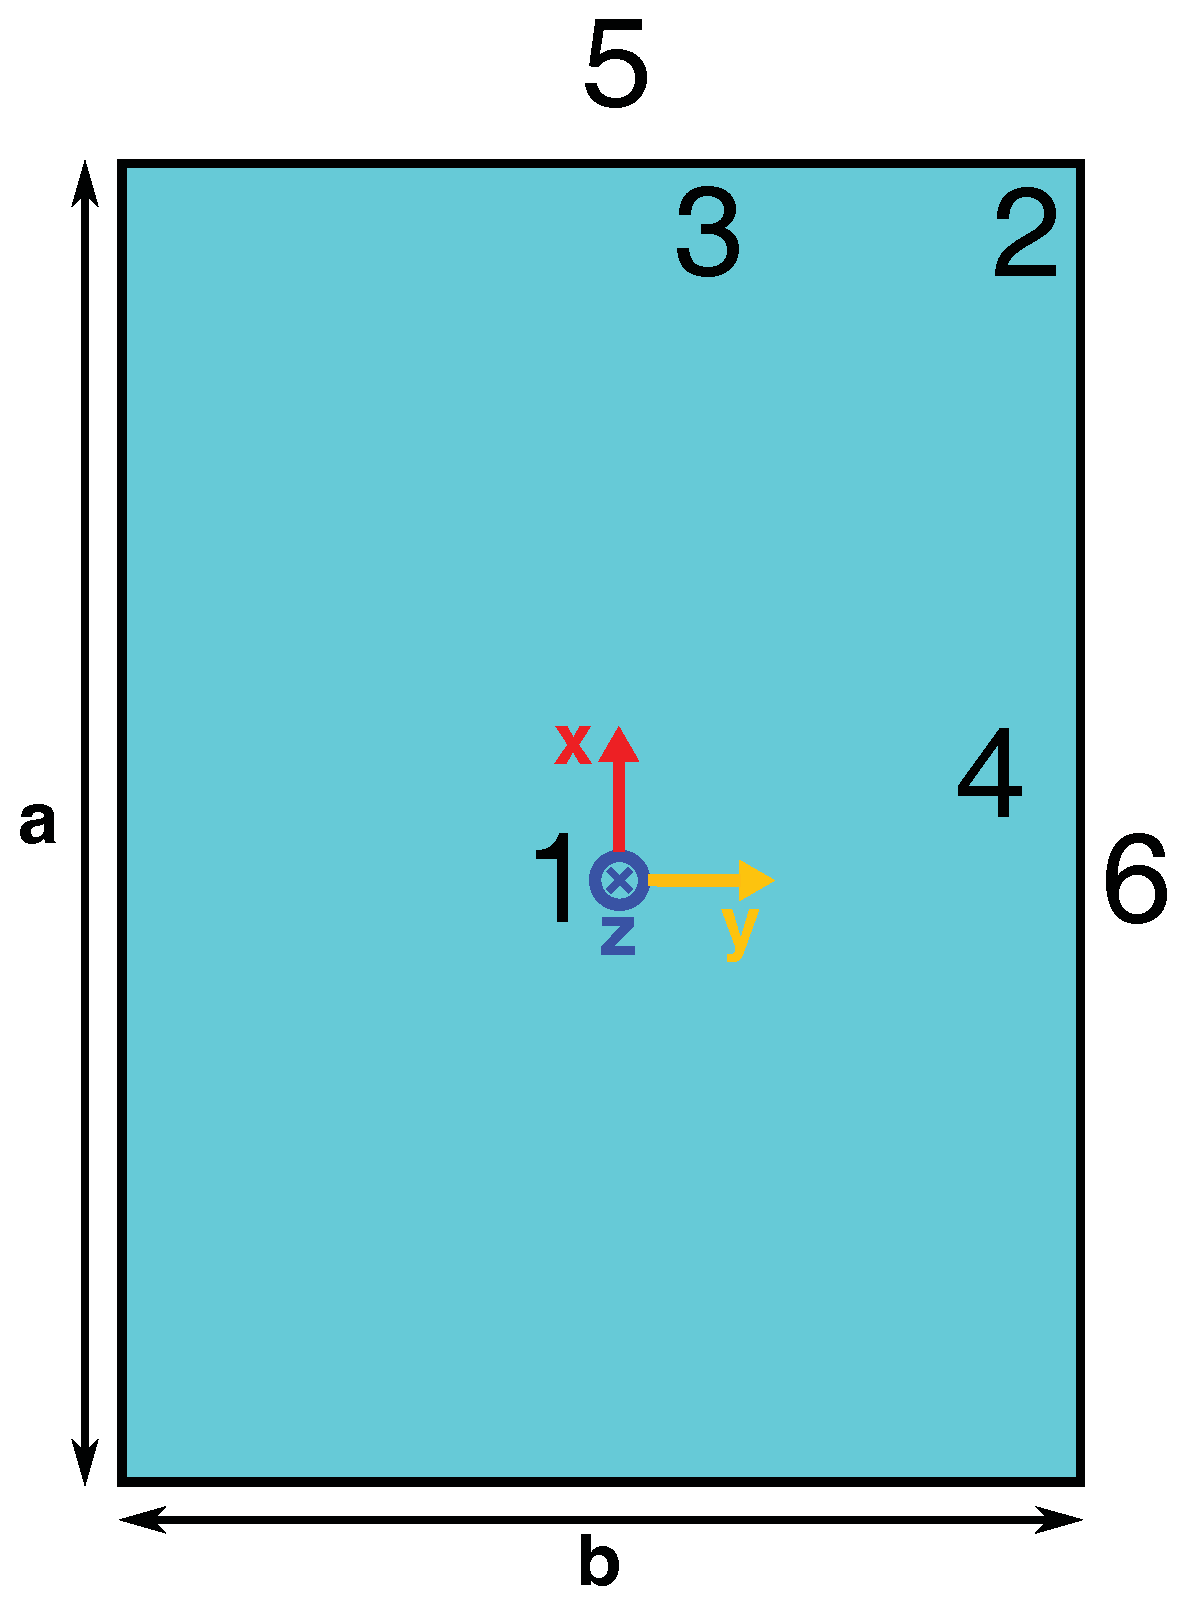
2. Materials and Methods

For the problem at hand, a discussion on the UHF-RFID readers is now in order. Broadly speaking, commercial readers can be grouped into two categories: hand-held readers and portal readers. Portal readers can accommodate reader antennas up to 1 m, which is an improvement compared with hand-help readers whose antennas size is around 10–15 cm. Portal readers also have a larger reading range and a relatively smaller reading area. For UHF-RFID, the wavelength λ = 34.6 cm; therefore, the antenna, whose size is a few wavelengths, has a directive gain large enough to reduce the risk of electromagnetic interferences, both active and passive [17].
For both kinds of readers, however, the bottleneck for the reading range is the reader power [2]. This power must fulfill national regulations limits on the so-called effective radiated power [18]:
E R P = G T P T ,
where G T is the product of the reader antenna’s gain, and P T is the reader power. In Europe, this limit is ERP ≤ 2 W [19]. Therefore, a large reader antenna allowed by a portal reader, which has a larger G T , calls for a smaller P T , with no benefit for the reading range (but, of course, with a smaller field outside the reading region).
The field distribution of the reader antenna in the reading region depends essentially on the distance between it and the reader [20]. Outside a sphere whose radius is around 4–5 λ (i.e., 1.4–1.8 m) for an hand-held reader antenna and around 10 λ (i.e., 3.5 m) for a portal reader antenna, there is the antenna far field and a field that behaves like a spherical wave, with a dependence on the distance source-field point r. Now, such a spherical wave can be well approximated by a plane wave in every region whose radial depth is less than r/10. Since the bag is quite small (less than λ/2), we can use the plane-wave approximation when the bag is in the antenna far-field. The amplitude of the plane-wave is equal to
E M A X = 7.75 G T P T r    [ V / m ] ,
where r is the (average) reader-bag distance, and E M A X is the maximum of the sinusoidal electric field.
When the bag is not in the reader far-field, the antenna field has a far stronger spatial variation, both with the radial distance (since the dominant term is now proportional to 1 / r 3 ) and with the angular position. The details of this variation are strongly dependent on the antenna, but all the actual main features of the field are shared by a simple half-wavelength dipole field, with the same ERP as the actual antenna.
The blood bag has been modeled to mimic an actual (filled) bag, namely as a thin rectangular envelope (with a thickness equal to 100 μm) of PVC, whose dimensions (see Figure 1) have the typical values of an actual filled bag: a = 17 cm, b = 11.3 cm, and c = 2.7 cm [21].
As apparent from Figure 1, the lateral wedges have been rounded, with a curvature radius of 1 mm to better conform to the actual bag shape.
Inside the bag, we put a dielectric material with the same (temperature-dependent) dielectric constant of the blood [22]. This bag was exposed with a plane-wave linearly polarized along the a–side of the bag, and traveling in a direction normal to the bag face, and to the field of a half-wavelength dipole, lying parallel to the a-side of the bag at the bag center. The dipole-bag distance was set to 5 cm, 10 cm, and 15 cm.
The numerical simulations were done using CST Studio Suite (CST Microwave Studio and CST Multiphysics Studio) [23]. This software is based on the finite integration technique (FIT) [24], a differential technique which, unlike other, equally popular, differential techniques, solves an exact set of equations between averaged fields and therefore is conceptually suited to our scope since all compliance regulations use averaged field values [25]. As a by-product, the FIT allows for the obtainment of the charge and energy conservation in an exact way at no cost. The main approximation required by the FIT is on the constitutive relations, which are local ones and must be approximated by relations between spatially averaged (i.e., integrated on small volumes) fields.
To perform all CST simulations, the bag was placed at the origin of the CST coordinate system and was surrounded by an air box, which extended 1 m from every side of the bag. On the box's faces, the “open (add space)” boundary conditions were set. This corresponds to the perfectly matched layer conditions [26]. Two types of CST sources were used. The first one is a plane wave, set to impinge orthogonally to the bag. The second one is a discrete port, set as S-parameter type, as a feed for the dipole.
The time-domain solver was used and set up with the adaptive mesh feature.
Since the FIT is a differential technique, it gives the field distribution (in fact, the distribution of a field spatially-averaged over cells smaller than λ/20) in the whole domain of interest. We present in the following section two types of data (for all considered cases):
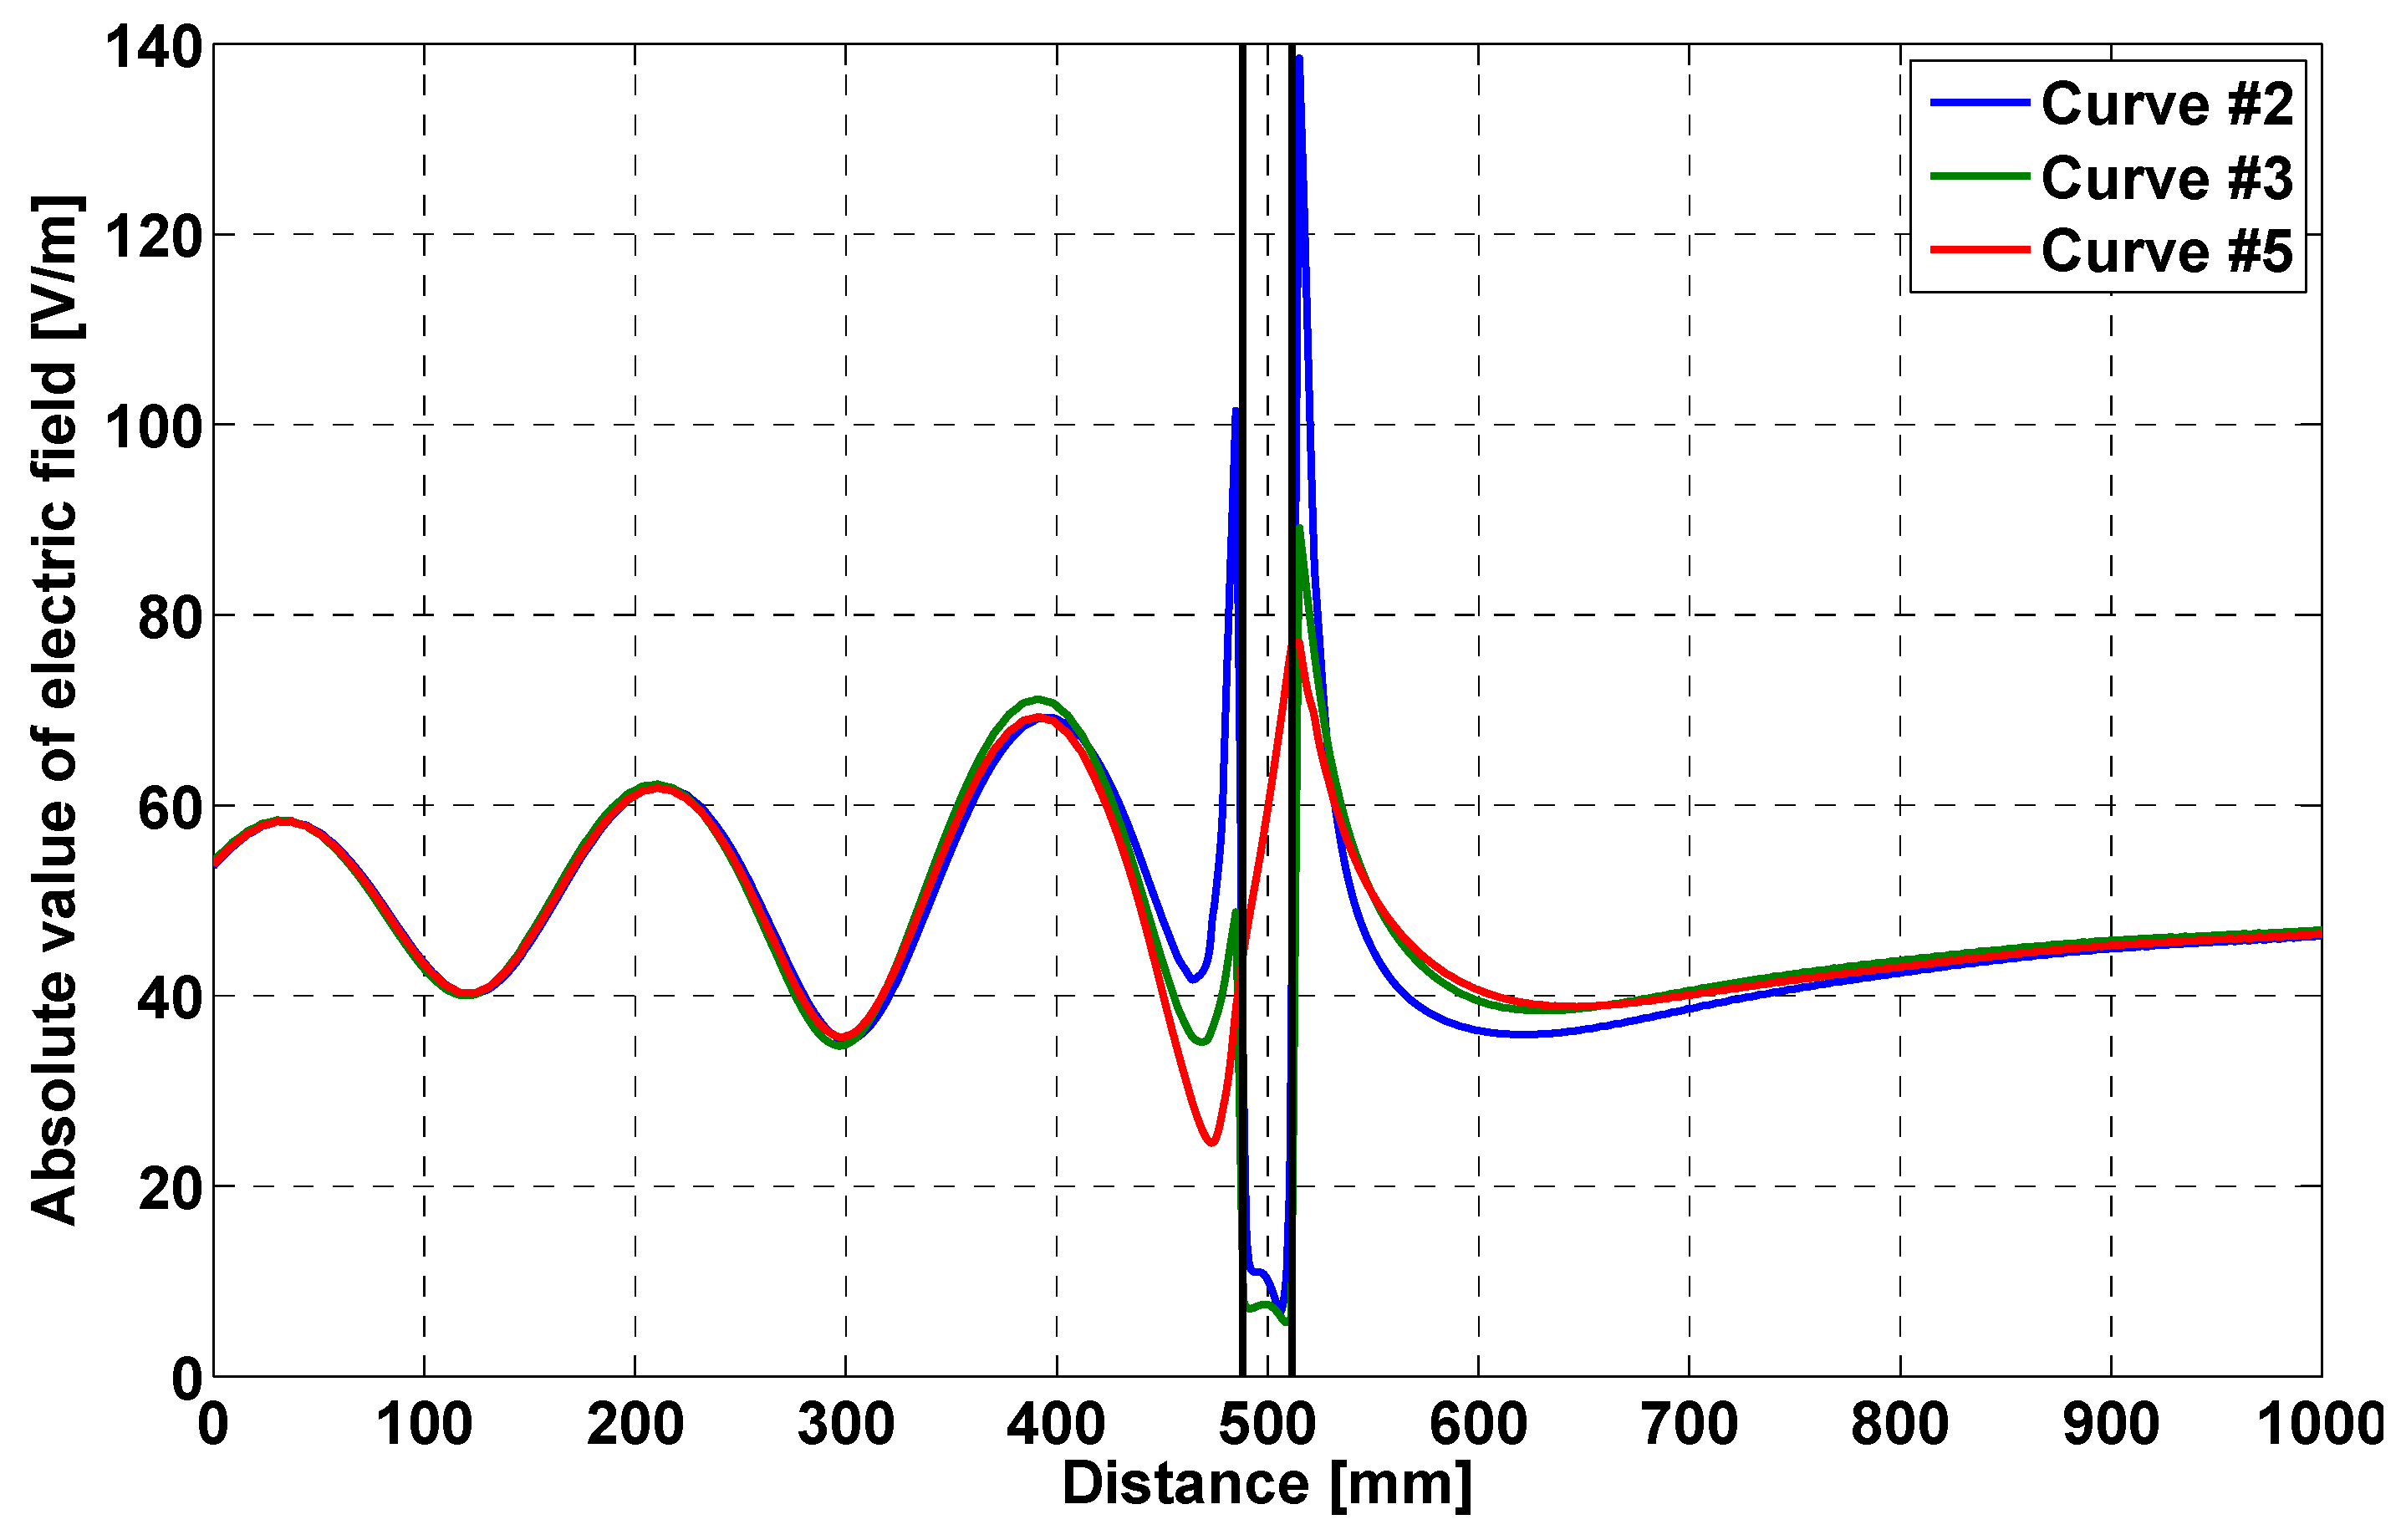
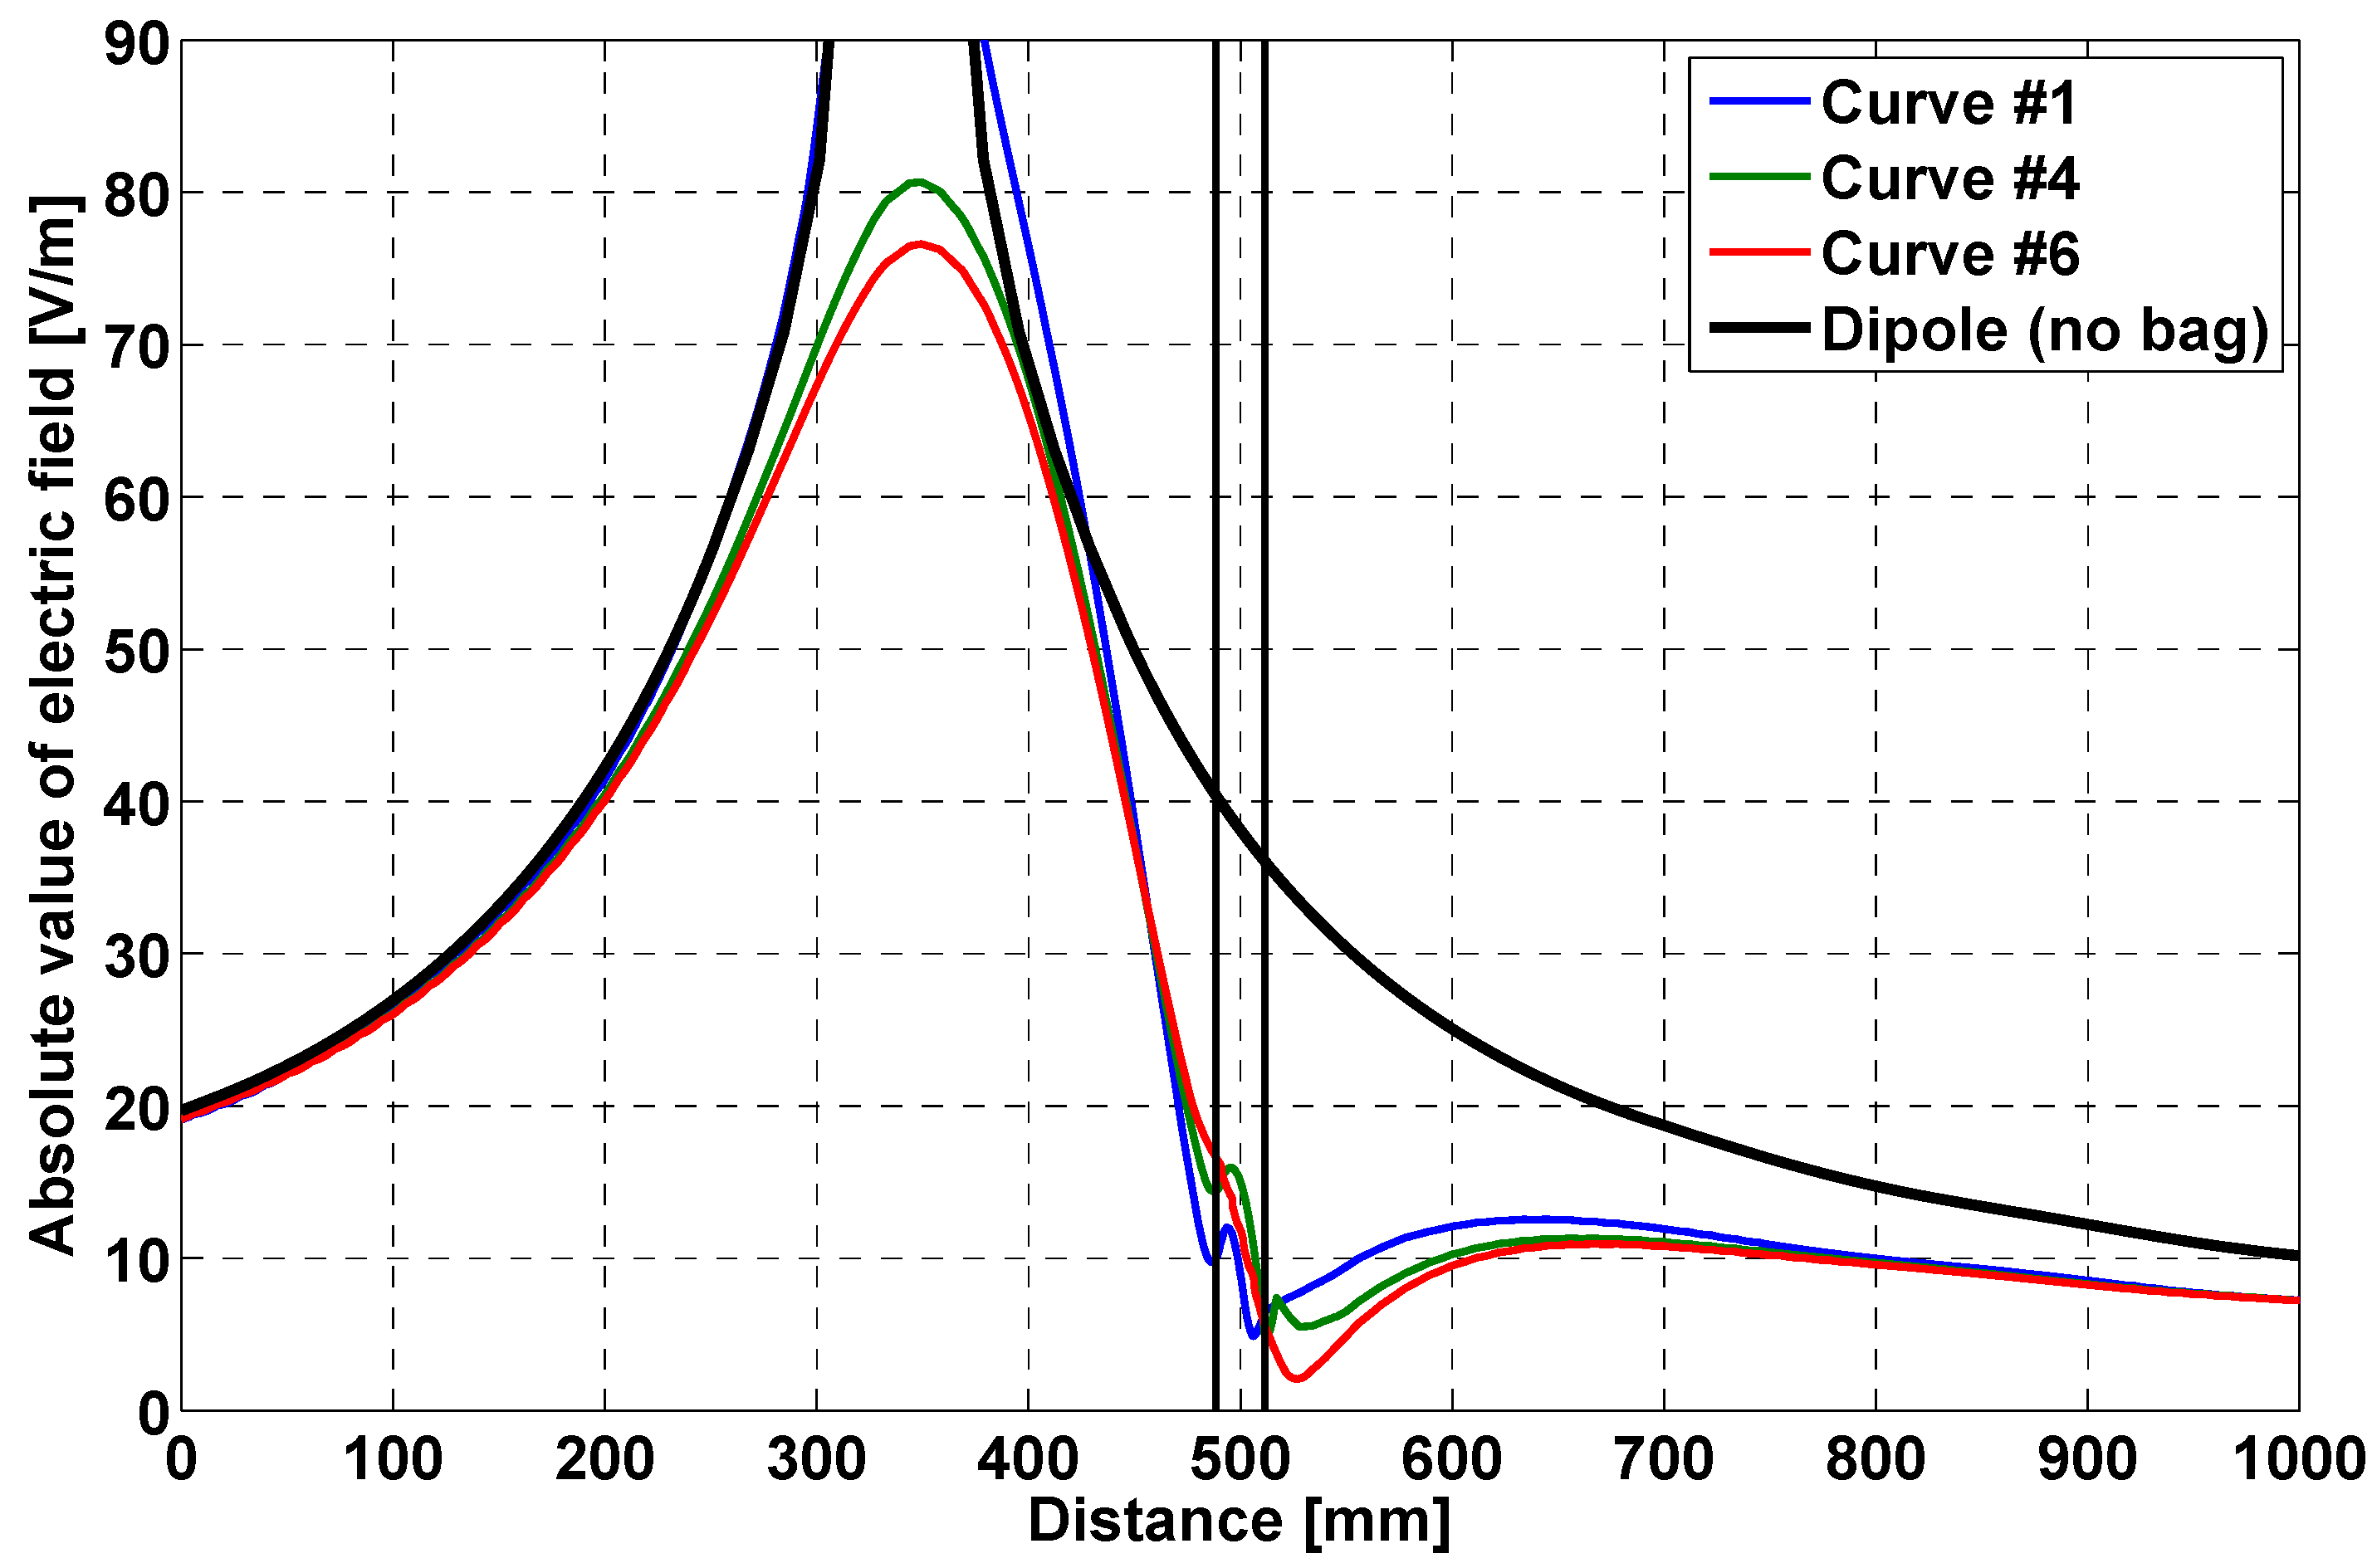
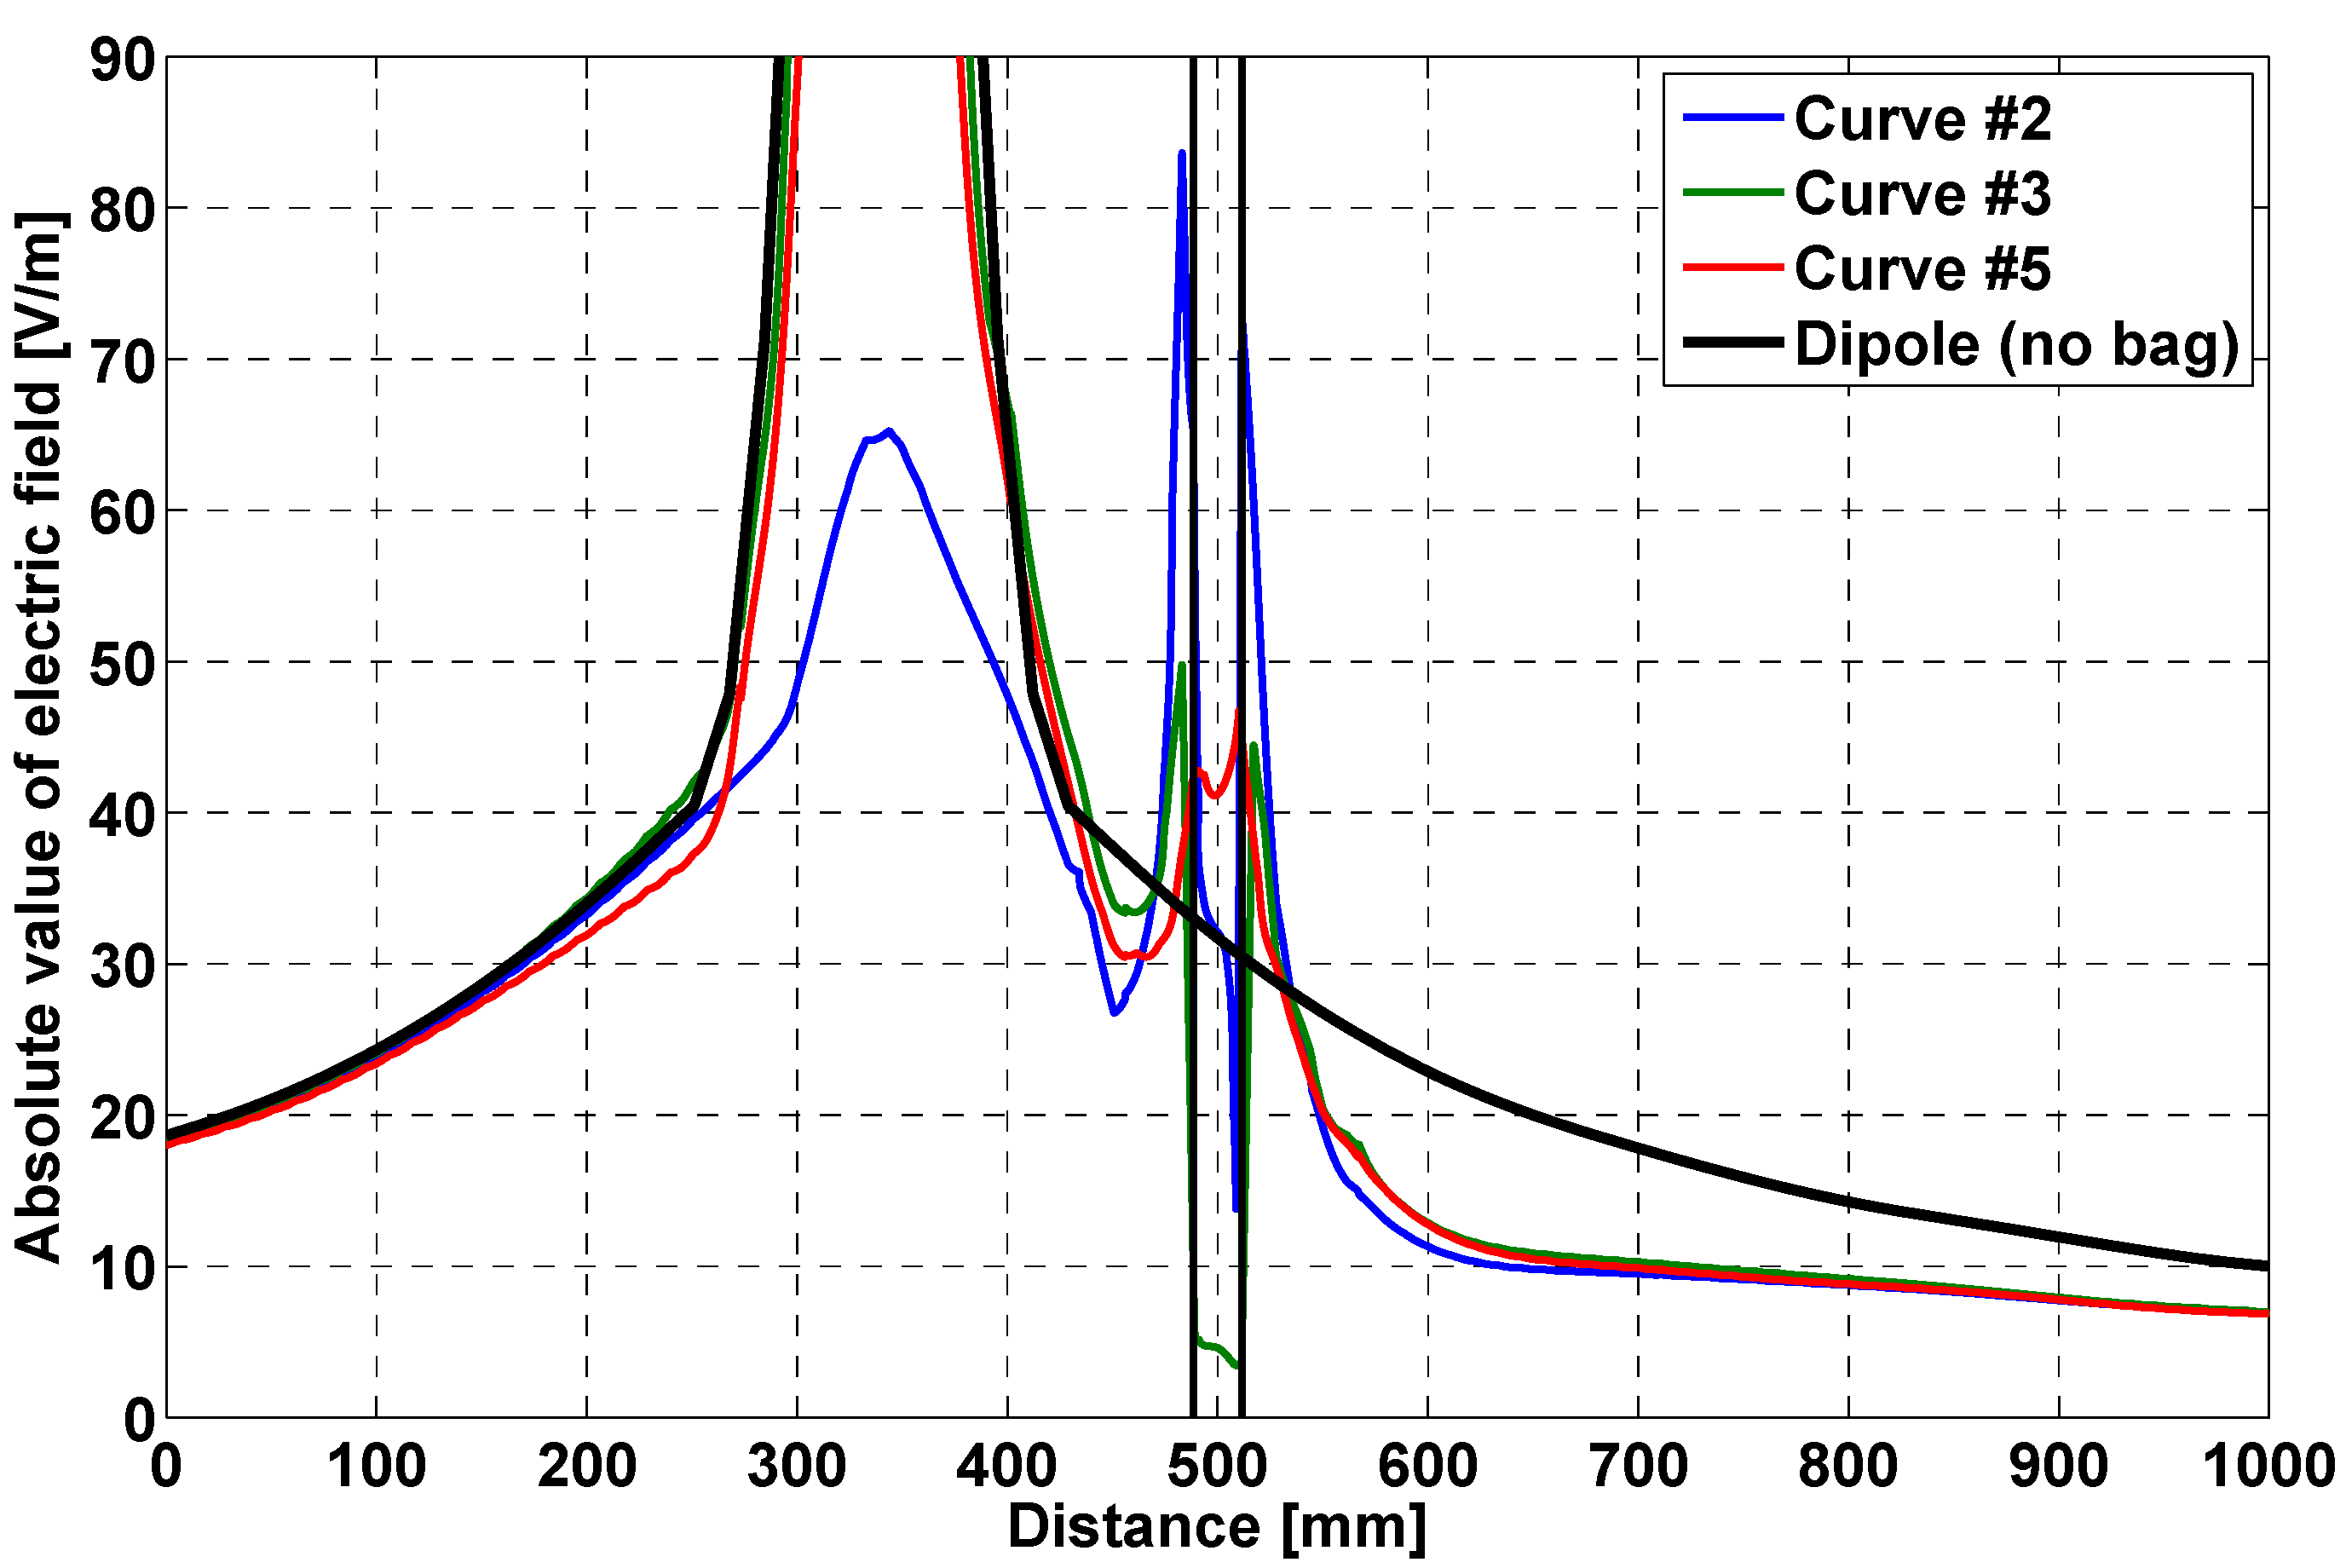
  • field distribution along a straight line, orthogonal to the bag face, crossing the bag;
  • the local SAR in the whole bag.
The latter data was then used to evaluate the time required to increase the bag temperature of 0.1 °C. Because of the convective motion inside the bag (and because the electric field varies slowly there), we computed the temperature increase using the maximum value of the SAR, which is clearly the worst case. It is worth noting that, as we will show later, this time is far larger than a typical reading cycle (which lasts a few tens of seconds).

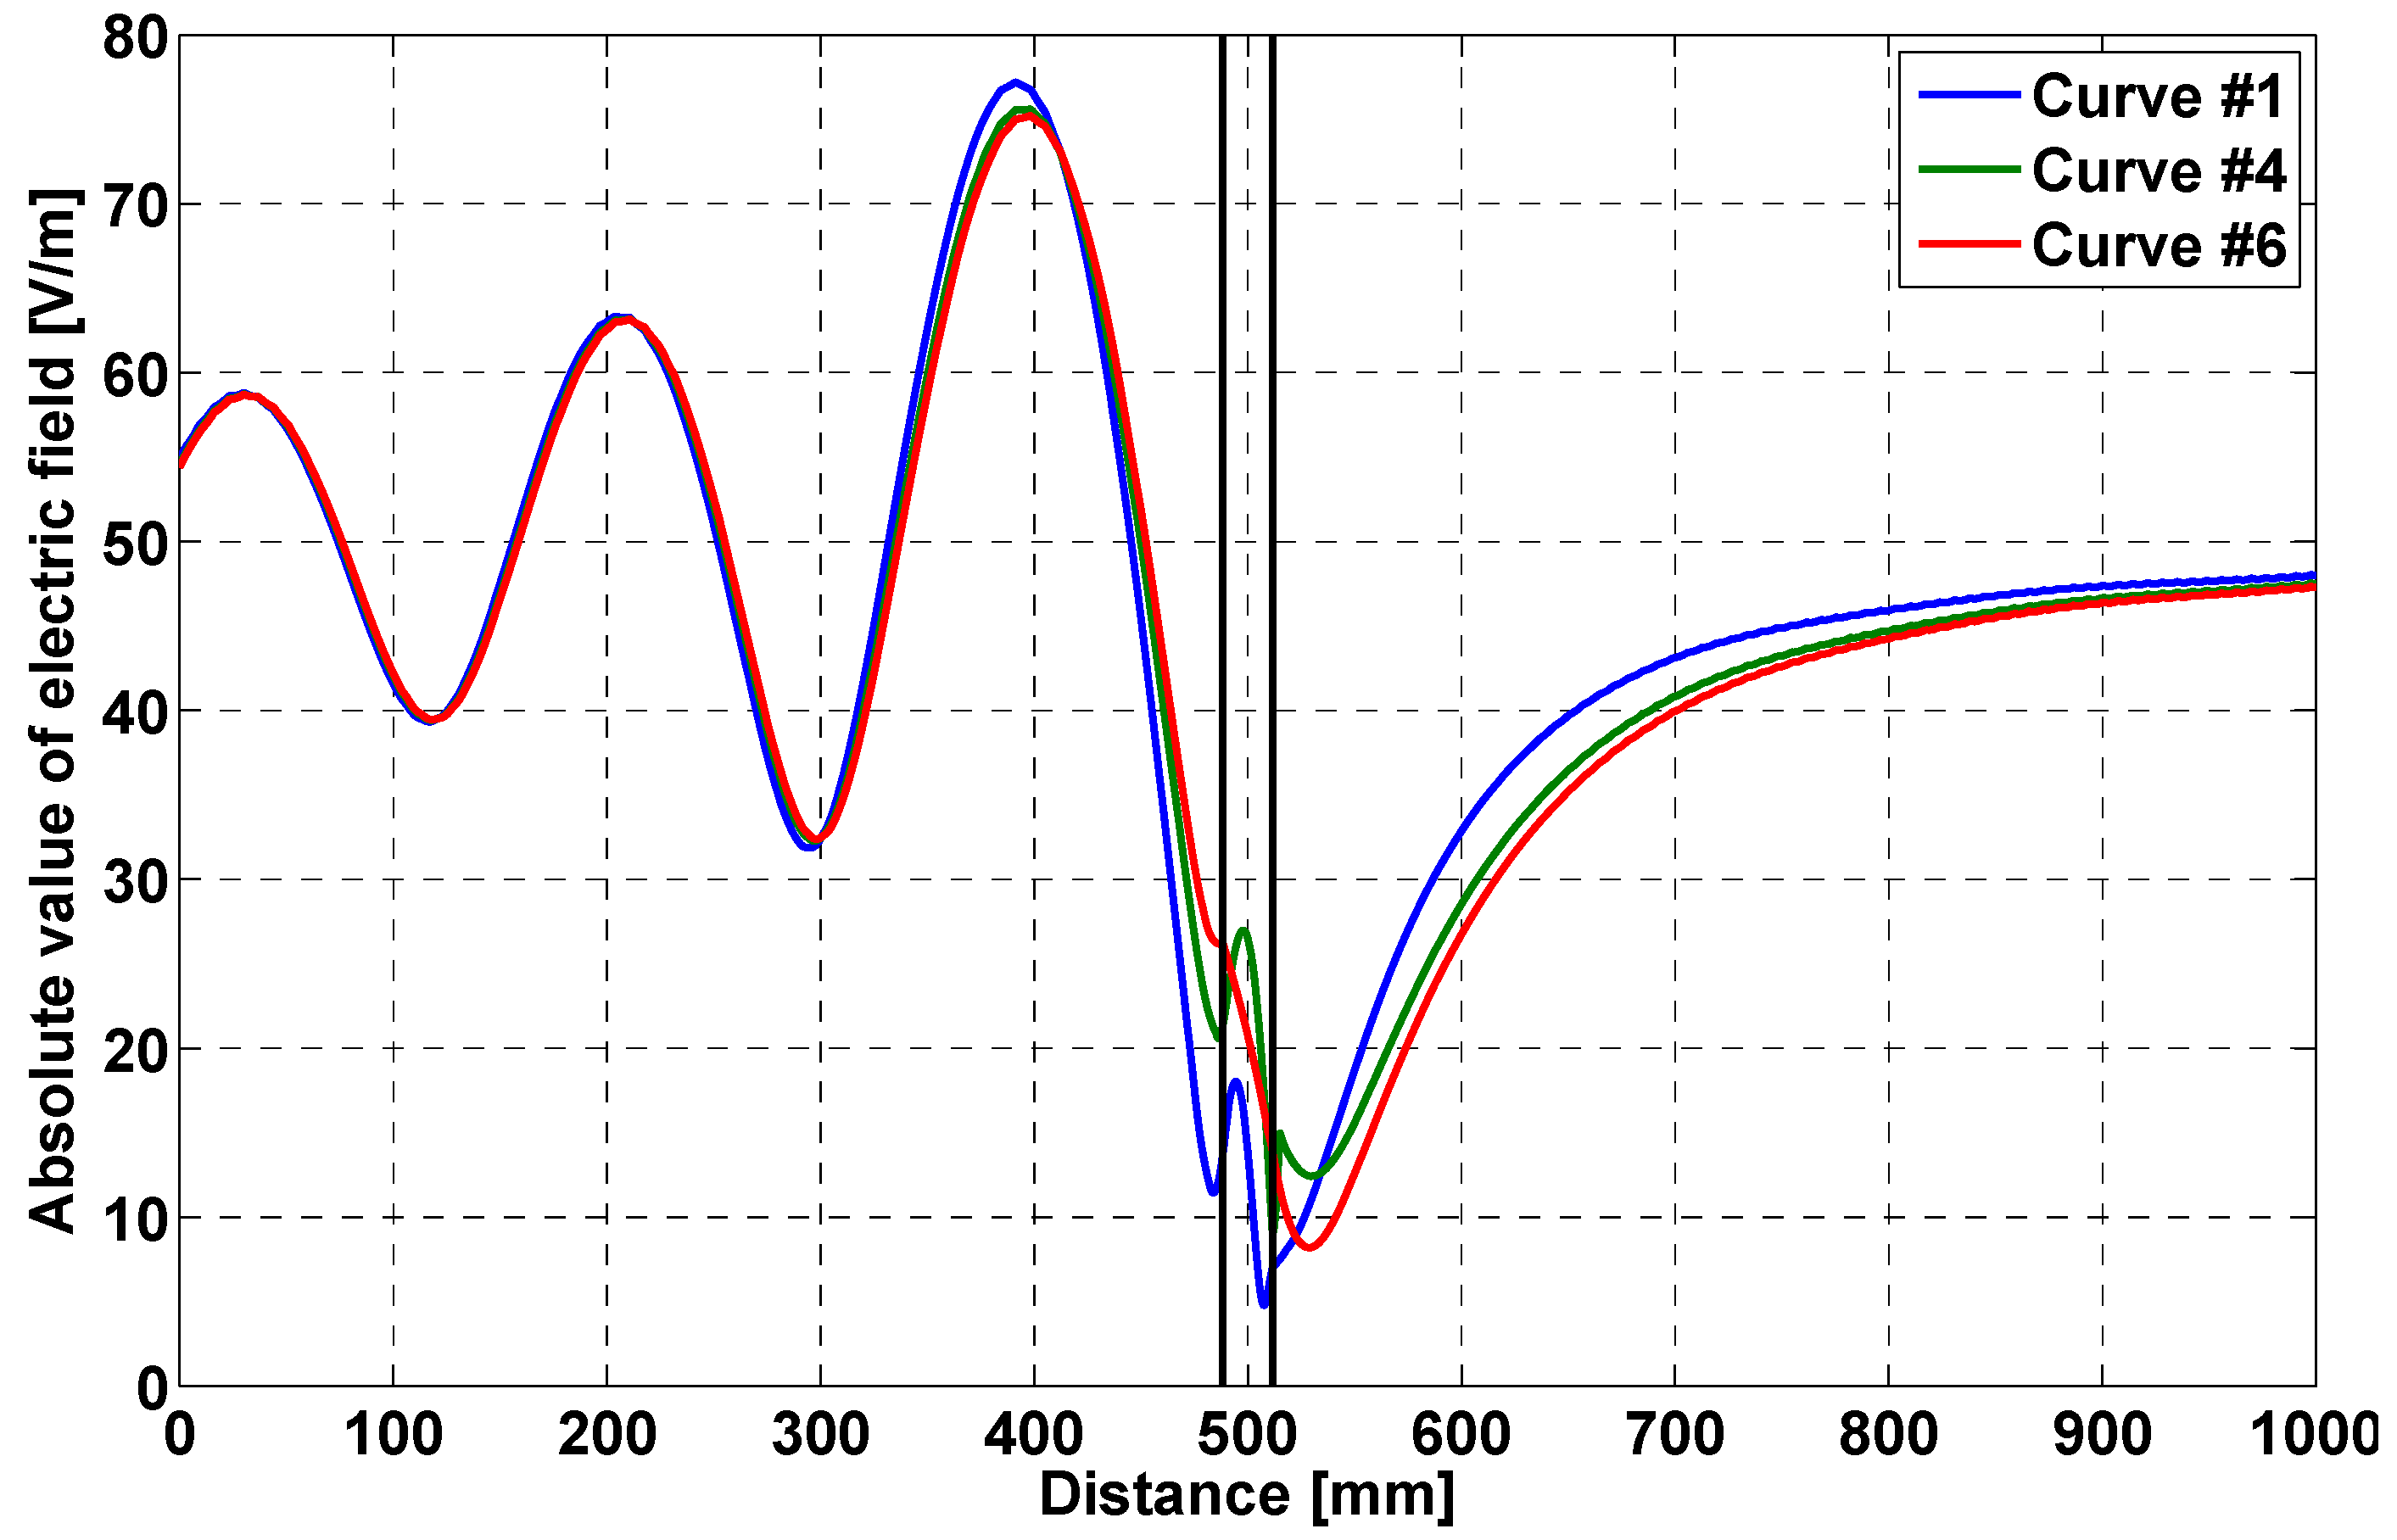
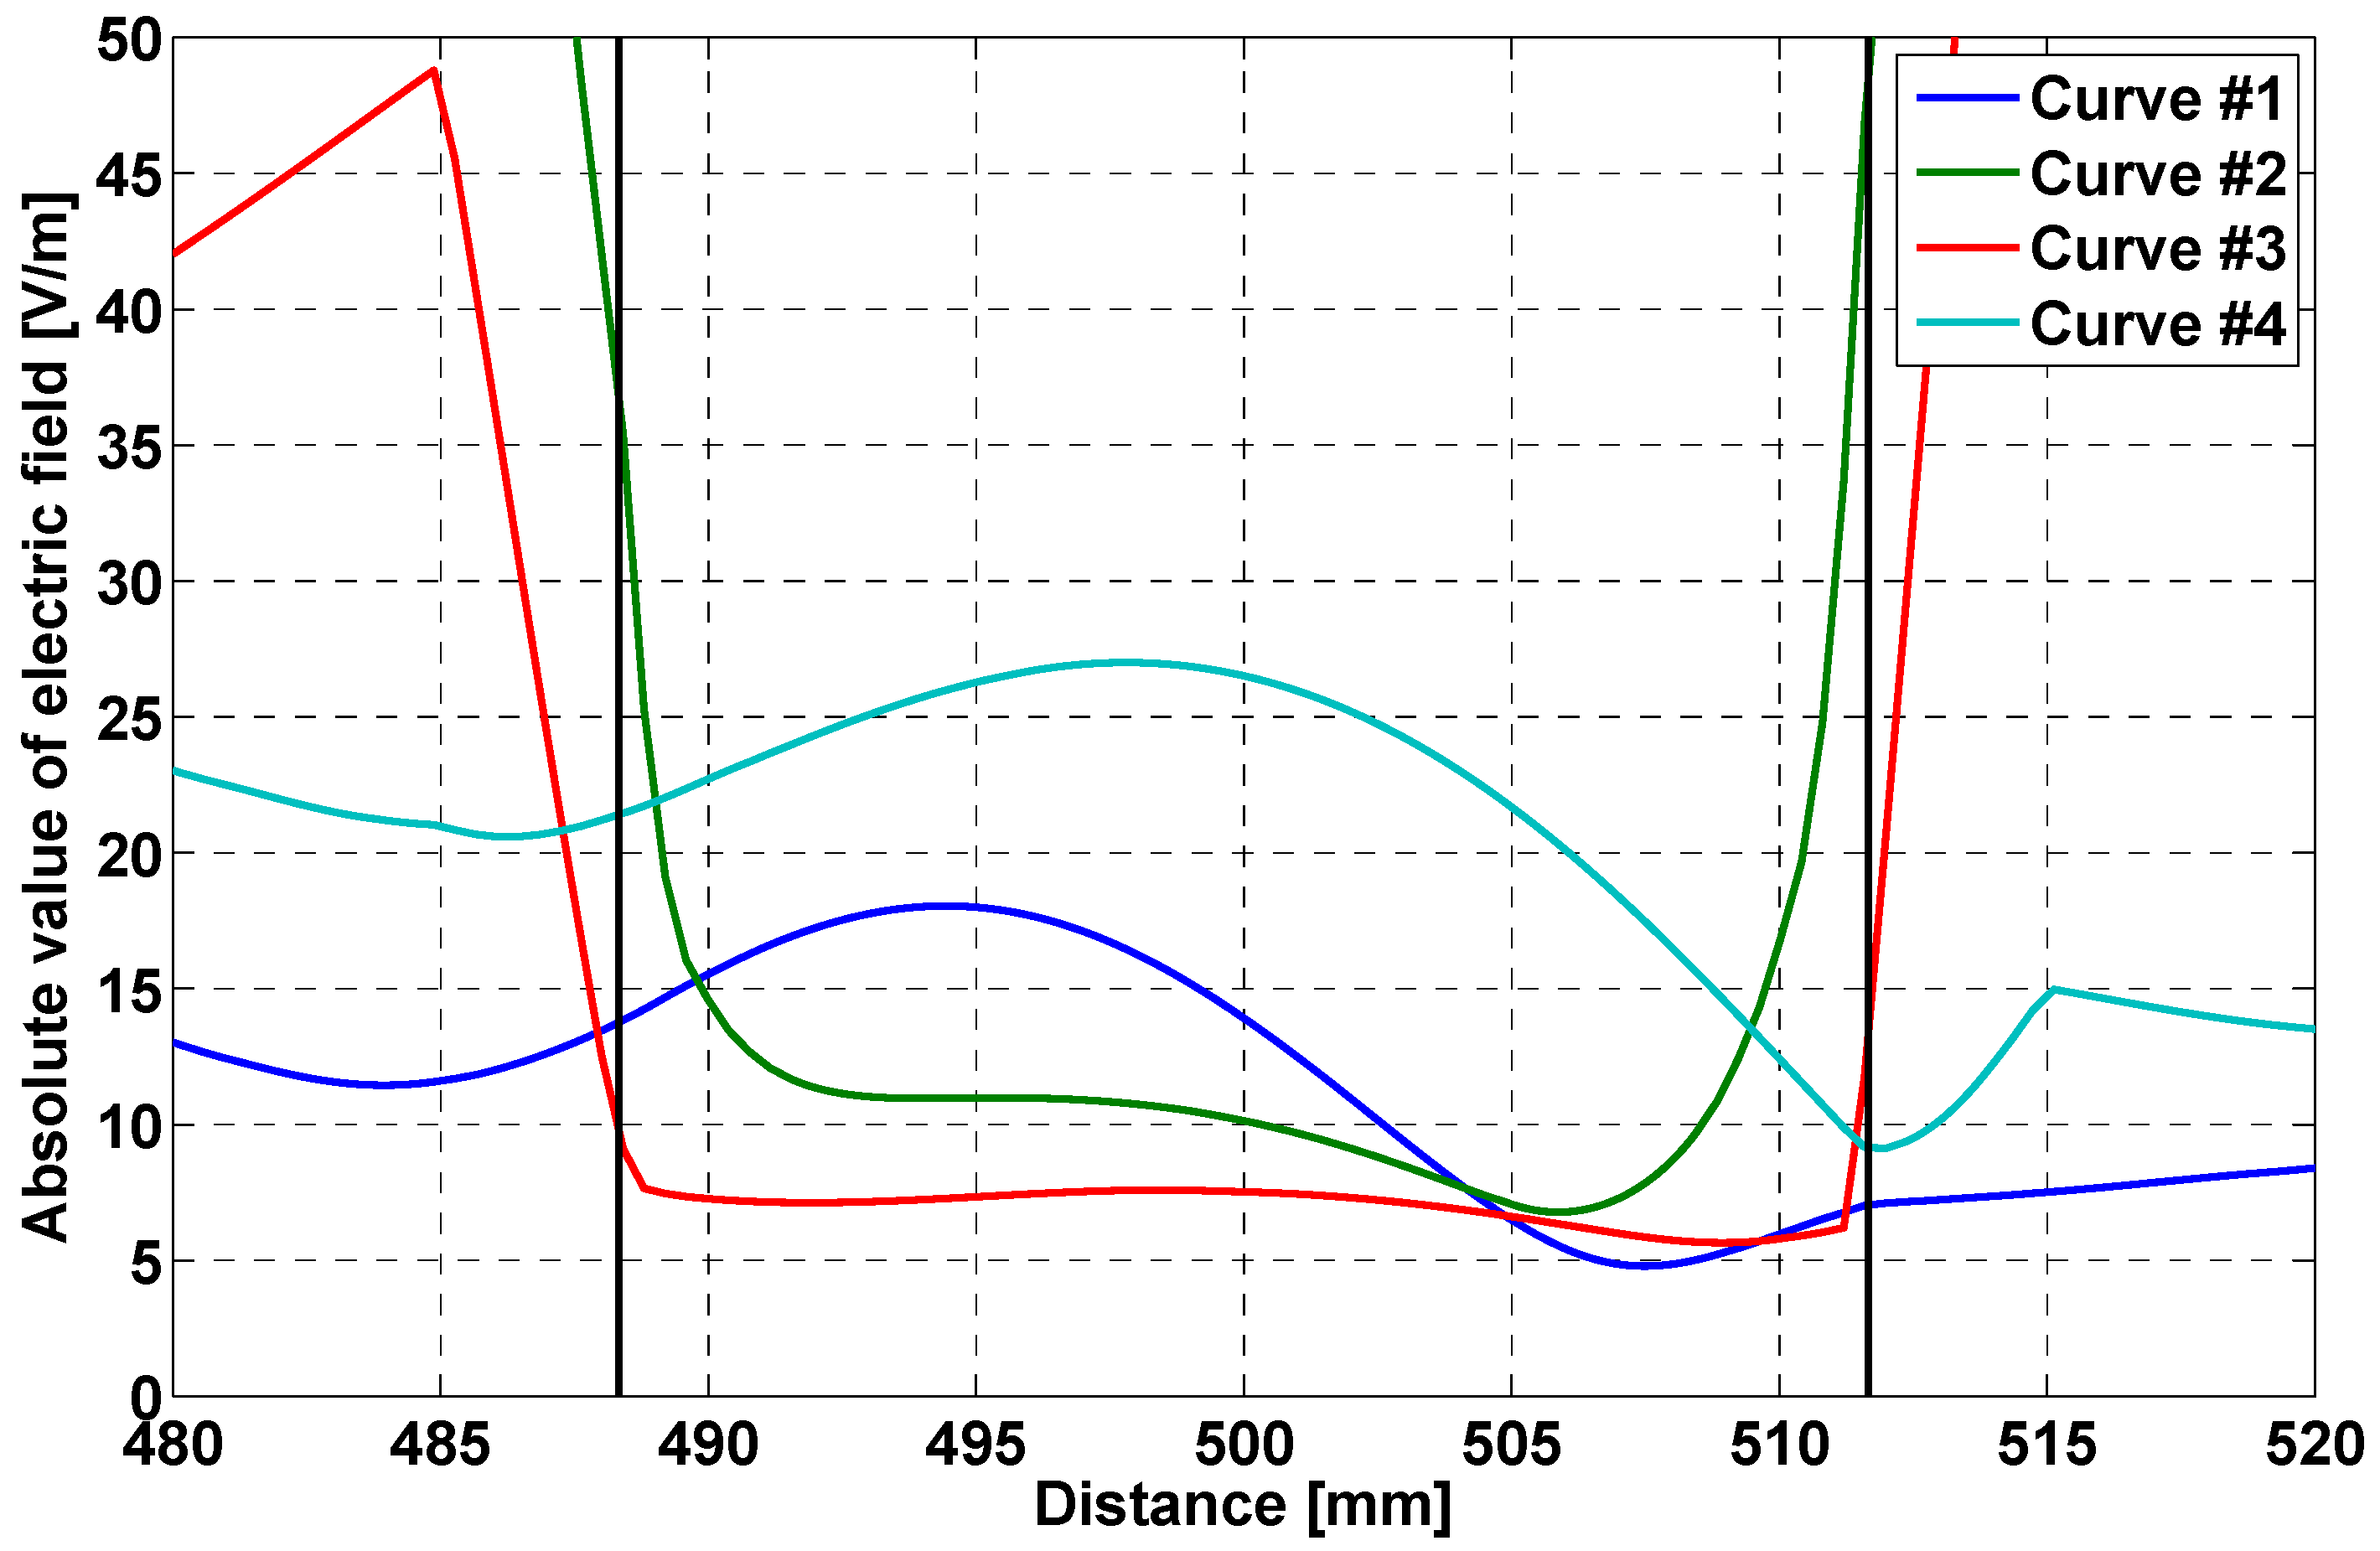
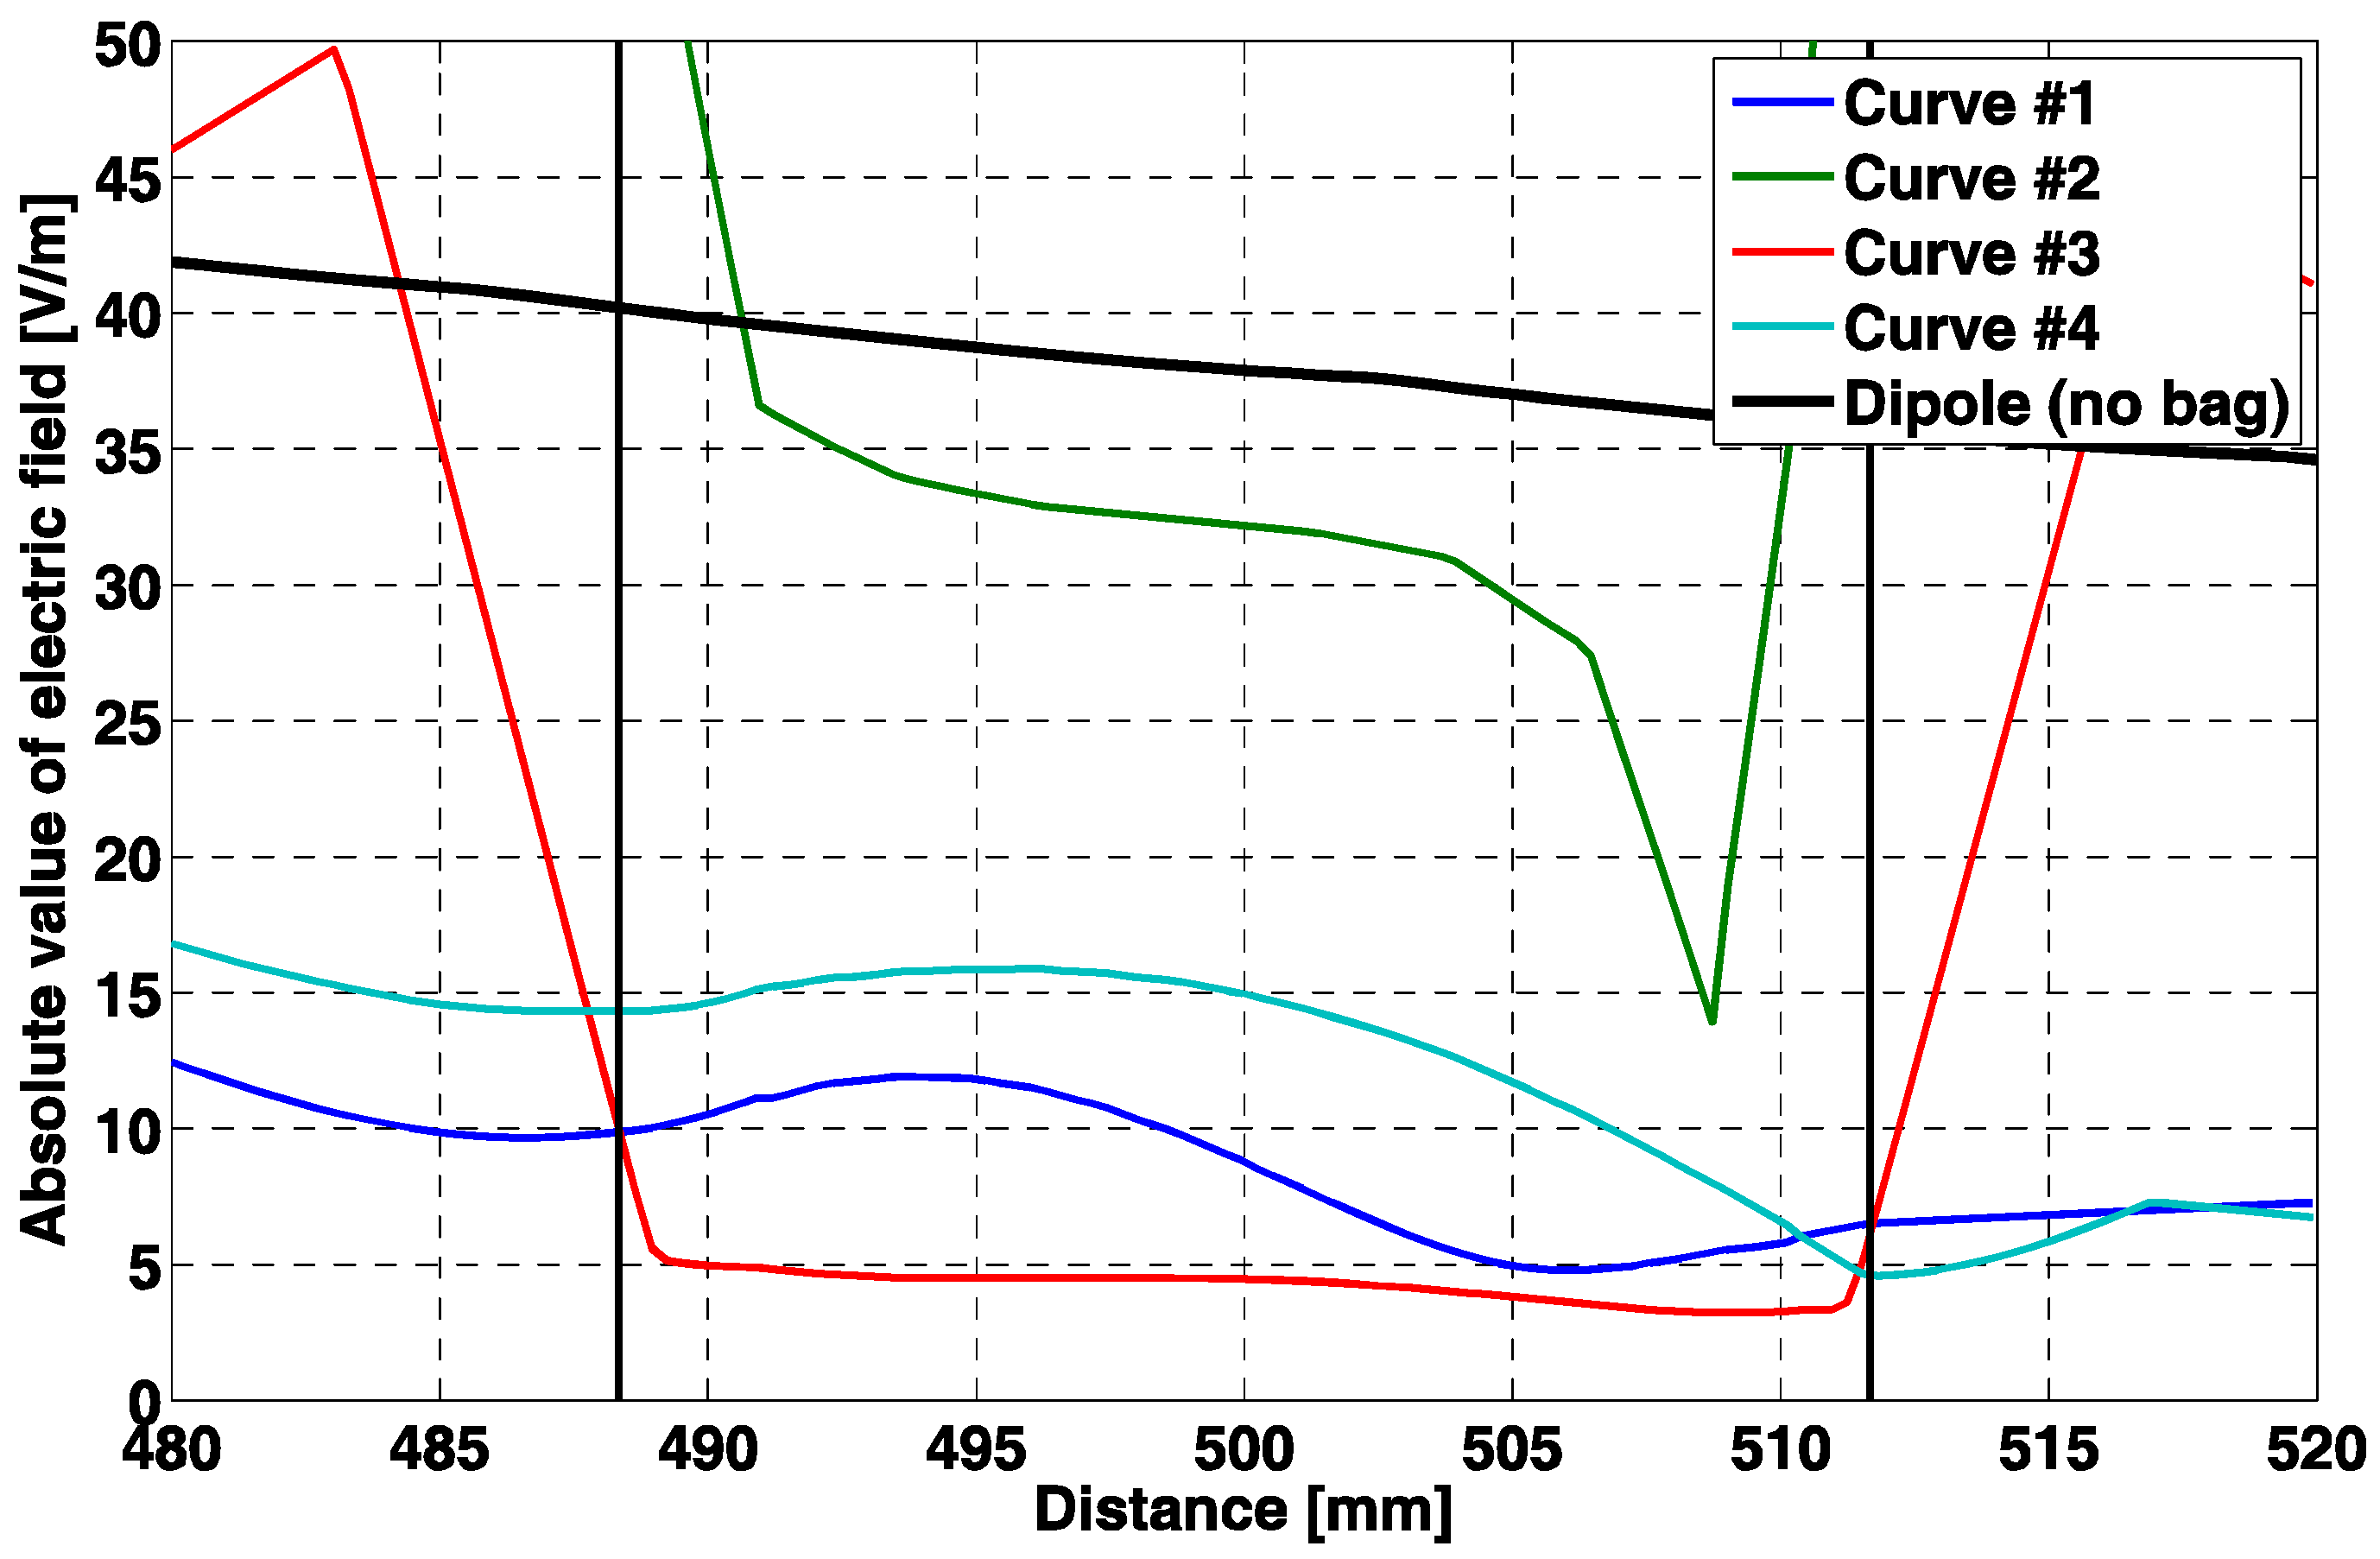
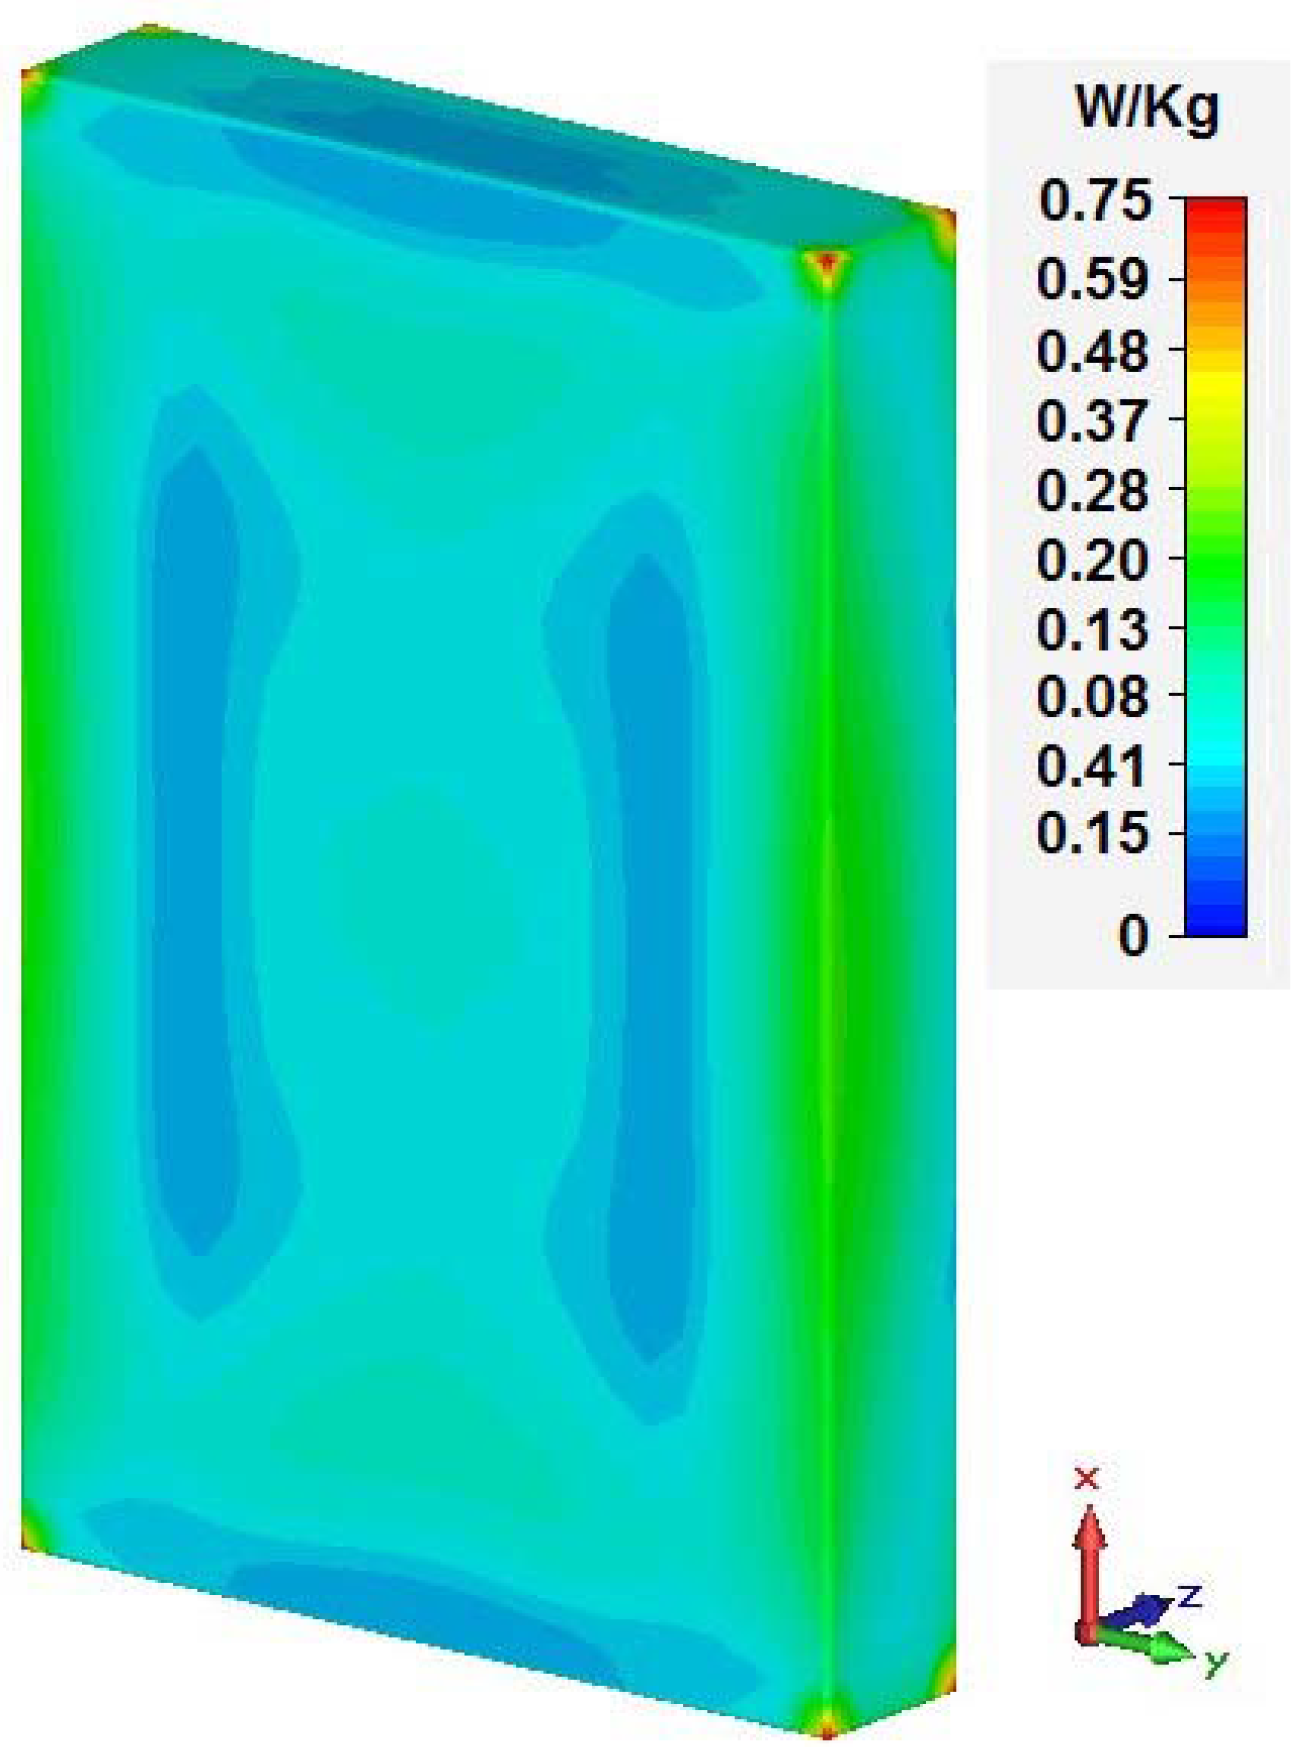
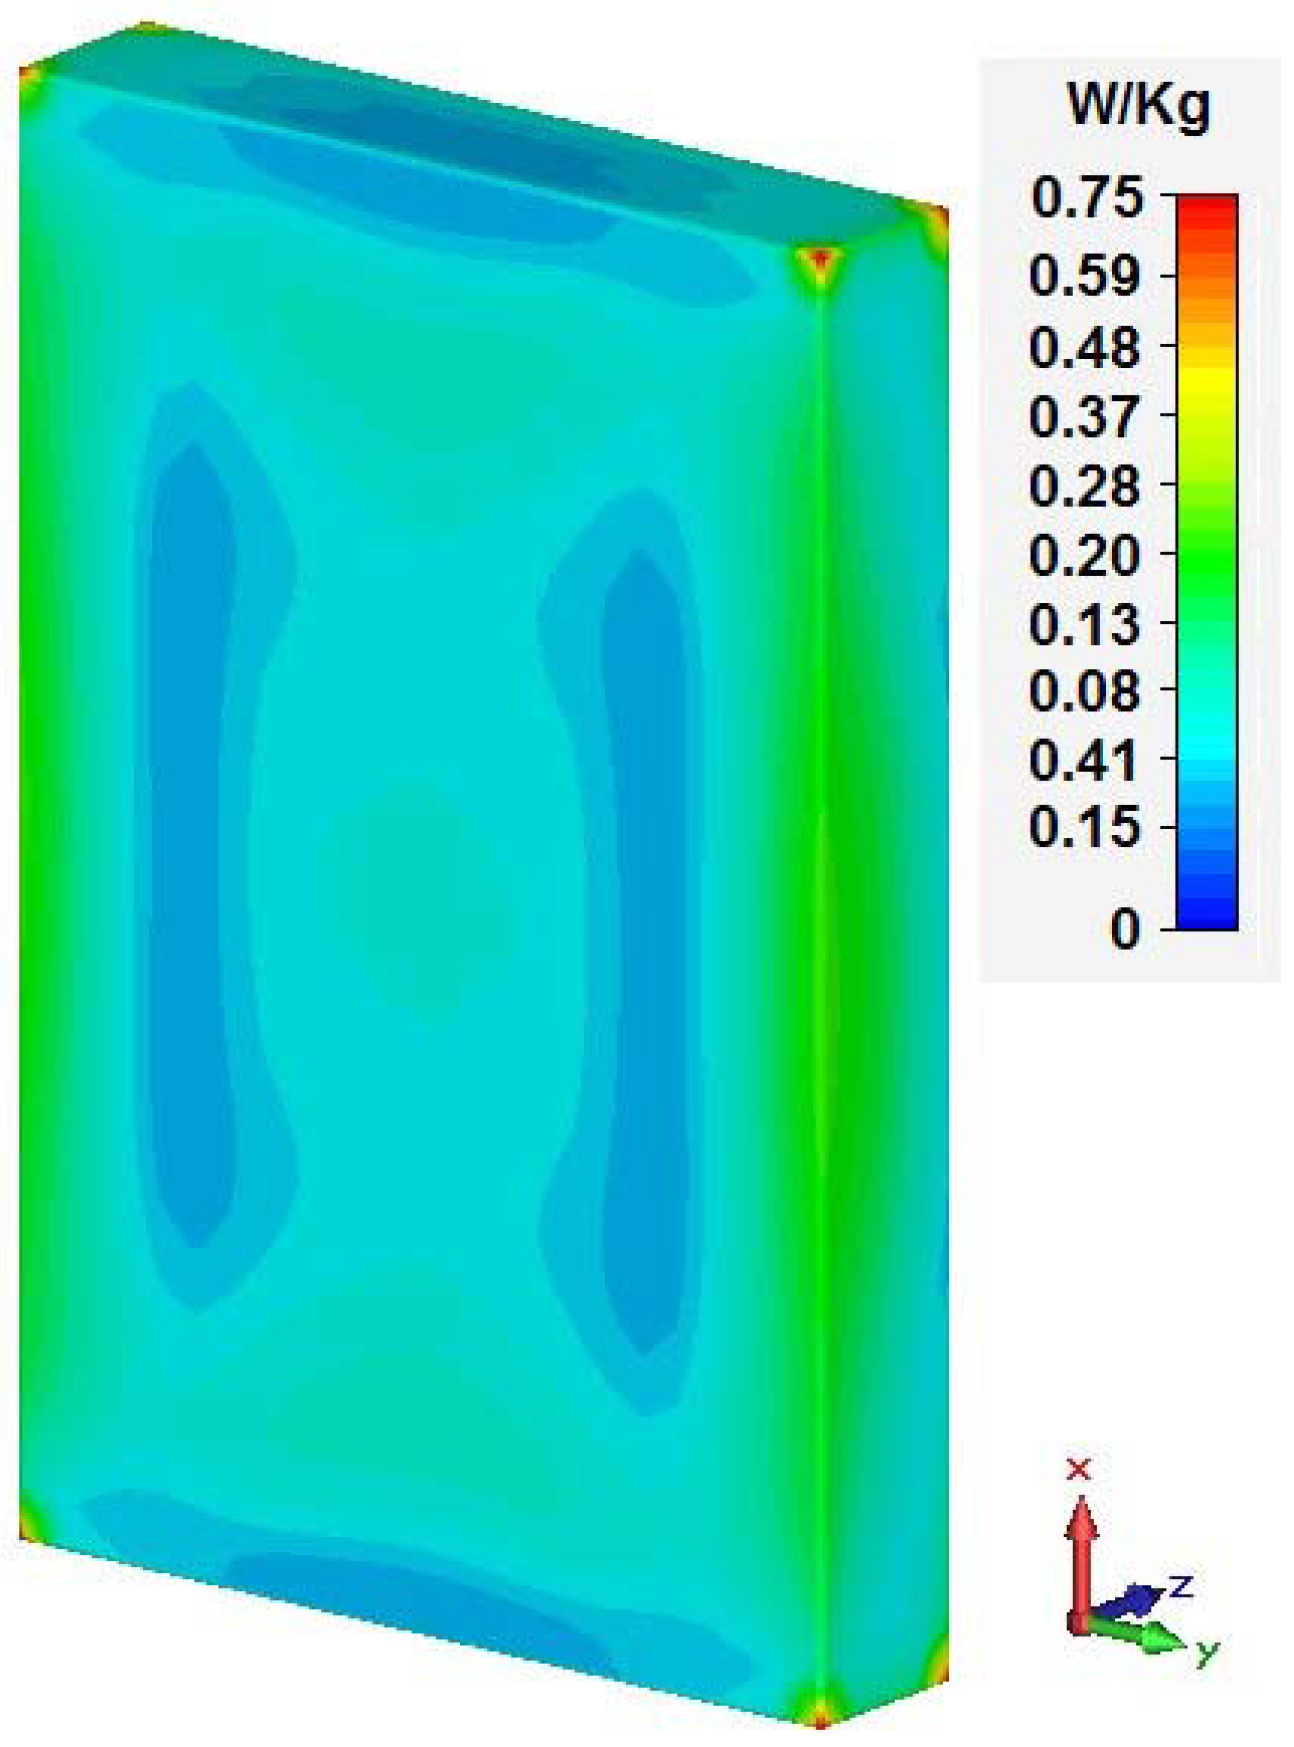
3. Results and Discussion

We report here the effect of a reader’s field on a blood bag, under various exposure conditions covering all the cases in the “production” environment.
Portal readers use moderate-gain antennas but the bag is located below the portal at several wavelengths from the reader (a wavelength λ = 34.6 cm at 867 MHz), so their field is a linearly polarized plane wave when evaluated on and around the bag. Therefore, we simulated this reader’s field as a plane wave traveling downward and then impinging normally on the side of a flat bag, with a maximum amplitude of 50 V/m (corresponding to a power density of 3.3 W/m2). Portable readers have a small gain antenna and usually works in near field. Their field has been simulated by a single half-wavelength dipole, radiating 1 W and located close to the bag. The bag has been simulated with a box whose size is 17 × 11.3 × 2.7 cm3, with rounded wedges and an enclosure of PVC of 100 μm. The box is filled with a lossy dielectric with ε r = 61 j 33 equal to the typical dielectric constant of actual blood [27]. The field was sampled on six segments (labeled from 1 to 6) crossing the bag normally and extending 50 cm on both sides. Their transverse position (and labeling) is shown in Figure 2 and Table 1. The field on these segments is shown in Figure 3, Figure 4, Figure 5, Figure 6, Figure 7 and Figure 8 for different expositions, where the zero of the x-axis is set to the starting point of the segment. In each figure, we report on the field computed on these segments, and the different graphs are labeled with the segment number.
The plane wave field clearly shows (Figure 3 and Figure 4), on each curve, the interference between the incident and reflected field before the bag, and a steady return to the incident (i.e., unperturbed) value beyond the bag. The main difference between the curves is the strong peak along the upper wedge. The incident field is polarized orthogonally to this wedge; therefore, from the Meixner’s condition [28], we should expect a singular field here just outside the blood bag. This is the reason for the strong field in the air (up to 3 times the incident one) in Figure 4, while no such effect is on Curves 5 and 7 of Figure 3, where the incident field is polarized along the wedge [28]. In every case, the field inside the bag is quite small (Figure 5), with an average value of around 30% of the incident value and a peak of 50 V/m (equal to the incident one) at the bag angle. This is easily explained, since the blood has a small wave impedance [20] and thus acts as a screen.
This effect is present also in the (vertical) dipole field, with a reduced field value both inside the blood and beyond the bag, when compared with the field without the bag. To save space, we show here (Figure 6 and Figure 7) only the field for a dipole located at 15 cm from the bag, but the plots are essentially the same (but for the maximum value) at different distances. The same behavior is shown also in Figure 8, together with the singular behavior just outside the horizontal wedges (which are orthogonal to the dipole fields), reaching 80 V/m.
The (relatively) small field value in the bag leads to a small SAR value . The SAR distribution in the two cases considered here is shown in Figure 9 (plane wave) and Figure 10 (close dipole field). From them, it follows that a plane wave with an incident power density of 3.3 W/m2 causes a SAR smaller than 0.75 W/kg, while the SAR produced by a 1 W dipole located at 15 cm is no larger than 1 W/kg. However, a closer look at the SAR distribution in Figure 9 and Figure 10 reveals that the SAR distribution has narrow peaks at the bag boundary, while the SAR value in the bulk of the bag is significantly lower, around 20%–40% of the peak.
The order of magnitude of these SAR values can be compared with the ICNIRP guidelines [25] for the exposures of the general population. They state that we are protected against known adverse health effects as long as the localized SAR is smaller than 2 W/Kg. Such a value is larger than the SAR developed in our bag under test, so we can reliably assume that no adverse effects are caused in the blood by the field we have considered here.
As a final test, we also evaluated the time ΔT needed to raise the blood temperature by 0.1 °C, which is shown in Table 2 for a dipole at different distances. ΔT is of the order of 10–60 min (depending on the distance dipole-bag). Therefore, after a reading sequence lasting less than one minute, no temperature increase can be registered.

4. Conclusions

From the data collected here, using accurate, numerical simulations, it follows that the field produced by a UHF RFID reader (under different “production” conditions) has a negligible effect on the blood contained in a blood bag. Both the peak field level and the SAR are very low (in absolute terms, as well as when compared with the available guidelines) and no temperature increase happens in a typical RFID reading cycle. Furthermore, the temperature increase is negligible, even for continuous exposures lasting up to several minutes.

Acknowledgments

Work supported by Regione Autonoma della Sardegna, under contract “Ottimizzazione della logistica in ambito sanitario attraverso l'utilizzo di sistemi RFid”, number F71J12000820002.

Author Contributions

All authors have contributed to the design of the activity, and to the explanation of the results. A.F. and S.C. done the CST simulations and A.F. and G.M. have written the paper.

Conflicts of Interest

The authors declare no conflict of interest.

References

  1. Finkenzeller, K. RFID Handbook: Fundamentals and Applications in Contactless Smart Cards and Identification, 2nd ed.; John Wiley & Sons, Inc.: Hoboken, NJ, USA, 2003. [Google Scholar]
  2. Dobkin, D.M. The RF in RFID: UHF RFID in Practice, 2nd ed.; Newnes: Waltham, MA, USA, 2012. [Google Scholar]
  3. Chiao, J.-C.; Kissinger, D. Medical Applications of RF and Microwaves—Applications and Events. IEEE Microw. Mag. 2015, 16, 14–18. [Google Scholar] [CrossRef]
  4. Bocan, K.N.; Ervin Sejdić, E. Adaptive Transcutaneous Power Transfer to Implantable Devices: A State of the Art Review. Sensors 2016, 16, 393. [Google Scholar] [CrossRef] [PubMed]
  5. Borelli, G.; Caredda, F.V.; Fanti, A.; Gatto, G.; Mazzarella, G.; Orrù, P.F.; Zedda, F. Preliminary study of RFID technologies for healthcare applications. In Proceedings of the 23rd Congress of the International Federation of Hospital Engineering (IFHE), Buenos Aires, Argentina, 13–16 October 2014.
  6. Borelli, G.; Caredda, F.V.; Fanti, A.; Gatto, G.; Mazzarella, G.; Montanari, R.; Orrù, P.F.; Volpi, A.; Zedda, F. Healthcare Supply Chain optimization: A comparison between two RFID-based reengineered processes. In Proceedings of the Summer School Francesco Turco, Senigallia, Italy, 9–12 September 2014; pp. 7–12.
  7. Davis, R.; Gottschall, J.; Gutierrez, A.; Hohberger, C.; Veeramani, D.; Holcombe, J. Absence of acute adverse in vitro effects on AS-1 RBCs and whole blood–derived platelets following prolonged exposure to 13.56 MHz radio energy. Transfusion 2010, 50, 1596–1603. [Google Scholar] [CrossRef] [PubMed]
  8. Knels, R.; Ashford, P.; Bidet, F.; Böcker, W.; Briggs, L.; Bruce, P.; Csöre, M.; Distler, P.; Gutierrez, A.; Henderson, I.; et al. Guidelines for the use of RFID technology in transfusion medicine. Int. J. Blood Transf. Med. 2010, 98 (Suppl. 2), 1–24. [Google Scholar]
  9. Davis, R.; Gottschall, J.; Gutierrez, A. Cellular and Protein Impact of RF Energy on Red Cells and Platelets; Report to the FDA; Food and Drug Administration: Silver Spring, MD, USA, 2008.
  10. Davis, R.; Gottschall, J.; Gutierrez, A. Temperature Impact of High RF Energy on Blood Products; Report to the FDA; Food and Drug Administration: Silver Spring, MD, USA, 2008.
  11. Hohberger, C.; Gottschall, J. Joule Heating of Blood Products by Intense RF Magnetic Fields; Report to the FDA; Food and Drug Administration: Silver Spring, MD, USA, 2008.
  12. International Organization for Standardization. ISO/IEC 18000-3:2010, Information Technology—Radio Frequency Identification for Item Management—Part 3: Parameters for Air Interface Communications at 13,56 MHz; ISO: Geneva, Switzerland, 2010. [Google Scholar]
  13. Fanti, A.; Secci, R.; Boi, G.; Casu, S.; Casula, G.A.; Mazzarella, G.; Montisci, G. A polycarbonate RFID tag for blood chain tracking. In Proceedings of the 2015 IEEE International Symposium on Antennas and Propagation & USNC/URSI National Radio Science Meeting, Vancouver, BC, Canada, 19–24 July 2015.
  14. Wang, Q.-L.; Wang, X.-W.; Zhuo, H.-L.; Shao, C.-Y.; Wang, J.; Wang, H.-P. Impact on storage quality of red blood cells and platelets by ultrahigh-frequency radiofrequency identification tags. Transfusion 2011, 53, 868–871. [Google Scholar] [CrossRef] [PubMed]
  15. Otin, R. Numerical study of the thermal effects induced by a RFID antenna in vials of blood plasma. Prog. Electromagn. Res. Lett. 2011, 22, 129–138. [Google Scholar]
  16. Casu, S.; Fanti, A.; Floris, V.; Gatto, G.; Mazzarella, G.; Migliore, M.D.; Spano, I.L. Evaluation of the effects of UHF electromagnetic fields on a blood bag. In Proceedings of the Antennas & Propagation Conference (LAPC), Loughborough, UK, 2–3 November 2015.
  17. Paul, C.R. Introduction to Electromagnetic Compatibility; Wiley-Interscience: Hoboken, NJ, USA, 1992. [Google Scholar]
  18. IEEE Antennas and Propagation Society. IEEE Standard Definitions of Terms for Antennas 145-2013; IEEE: New York, NY, USA, 2013; pp. 1–50. [Google Scholar]
  19. European Telecommunications Standards Institute. ETSI 302 208-1 ERM, RFID Operating in the Band 865 MHz to 868 MHz with Power Levels up to 2 W, Part 1: Technical Requirements and Methods of Measurement; ver. 1.4.1; ETSI: Sophia Antipolis, France, 2011. [Google Scholar]
  20. Balanis, C.A. Modern Antenna Handbook; John Wiley & Sons, Inc.: Hoboken, NJ, USA, 2008. [Google Scholar]
  21. Promedical s.r.l. Available online: http://www.promedical.it/ (accessed on 6 November 2016).
  22. Ray, P.S. Broadband complex refractive indices of ice and water. Appl. Opt. 1972, 11, 1836–1844. [Google Scholar] [CrossRef] [PubMed]
  23. CST GmbH, CST Microwave Studio Help, CST Studio Suite version 2011.14.01. Available online: https://www.cst.com/products/csts2 (accessed on 6 November 2016).
  24. Weiland, M.; Clemens, T. Discrete electromagnetism with the finite integration technique. Prog. Electromagn. Res. Lett. 2001, 32, 65–87. [Google Scholar]
  25. International Commission on Non-Ionizing Radiation Protection (ICNIRP), ICNIRP statement on the ‘Guidelines for limiting exposure to time-varying electric, magnetic, and electromagnetic fields (up to 300 GHz)’. Health Phys. 2009, 97, 257–258.
  26. Berenger, J.-P. A perfectly matched layer for the absorption of electromagnetic waves. J. Comput. Phys. 1994, 114, 185–200. [Google Scholar] [CrossRef]
  27. IFAC—Dielectric Properties of Body Tissues. Available online: http://niremf.ifac.cnr.it/tissprop/ (accessed on 6 November 2016).
  28. Van Bladel, J. Field singularities at metal-dielectric wedges. IEEE Trans. Antennas Propag. 1985, 33, 450–455. [Google Scholar] [CrossRef]
Figure 1. Blood bag parallelepiped rounded wedges.
Electronics 05 00077 g001
Figure 2. Position of the test lines into the bag. Exact positions are reported in Table 1.
Electronics 05 00077 g002
Figure 3. Plane wave field inside and around the bag. The curve number refers to the segments in Figure 2.
Electronics 05 00077 g003
Figure 4. Plane wave field inside and around the bag. The curve number refers to the segments in Figure 2.
Electronics 05 00077 g004
Figure 5. Expanded view of the field inside the bag, for plane wave incidence. The curve number refers to the segments in Figure 2.
Electronics 05 00077 g005
Figure 6. Field due to a dipole located at 15 cm from the bag side. The curve number refers to the segments in Figure 2. The curve labeled “Dipole (no bag)” shows, for comparison, the free-space dipole field comparison.
Electronics 05 00077 g006
Figure 7. Field due to a dipole located at 15 cm from the bag side. The curve number refers to the segments in Figure 2. The curve labeled “Dipole (no bag)” shows, for comparison, the free-space dipole field comparison.
Electronics 05 00077 g007
Figure 8. Expanded view of the field inside the bag, due to a dipole located at 15 cm from the bag side. The curve number refers to the segments in Figure 2. The curve labeled “Dipole (no bag)” shows, for comparison, the free-space dipole field comparison.
Electronics 05 00077 g008
Figure 9. SAR distribution for plane wave at the frequency of 867 MHz on blood bag parallelepiped rounded wedges.
Electronics 05 00077 g009
Figure 10. SAR distribution for close dipole at the frequency of 867 MHz on blood bag parallelepiped rounded wedges.
Electronics 05 00077 g010
Table 1. Segment positions.
#X (mm)Y (mm)
100
284.1155.51
38010
41050
5950
6060
Table 2. Time ΔT needed to raise the temperature of the blood in the bag by 0.1 °C.
Distance between Blood Bag and Dipole (cm)SAR (W/kg)ΔT (min) for Increases the Temperature of the Blood around 0.1 °C
50.4416
150.1162
25<0.01-

