
Inspection of Metal and Concrete Specimens Using Imaging System with Laser Displacement Sensor †


Centre for Infrastructure Engineering, School of Computing, Engineering and Mathematics, Western Sydney University, Penrith 2751, Australia
*
Author to whom correspondence should be addressed.
†
This paper is an extended version of paper published in the 2016 SPIE conference, Sensors and Smart Structures Technologies for Civil, Mechanical and Aerospace Systems, held in Las Vegas, NV, USA, 20–24 March 2016.
Electronics 2017, 6(2), 36; https://doi.org/10.3390/electronics6020036
Submission received: 26 December 2016
/
Revised: 1 May 2017
/
Accepted: 3 May 2017
/
Published: 7 May 2017
Abstract
:Flaws such as cracks and impact damages initially occur on the surface of the infrastructure materials and propagate internally causing further degradation. These infrastructure materials have different physical and chemical composition and have different geometric shapes, which can mask the indication of minute surface flaws. There is a need to develop systems that can detect these surface flaws irrespective of their properties and shapes. We propose an imaging system capable of interrogating plain and non-plain structures for the purpose of detection and evaluation of surface flaws such as cracks and impact damages using a laser displacement sensor (LDS). The developed system consists of LDS mounted on the scanner, which is capable of raster scanning over the material under test. The reading of displacement from the sensor head to the laser spot on the surface of the test material is then used to generate two-dimensional (2-D) images in real time, which can be used to detect minute surface flaws. This paper presents the results of inspection of metal and concrete test specimens. 2-D images through the cut of the metal profile are also generated to demonstrate the ability of a system to image interior structure.
1. Introduction
Civil infrastructures include buildings, bridges, roads, tunnels, power plants, wind turbines, dams and heritage structures [1]. Early detection of damage and subsequent repair and retrofitting will help to prevent failures of these infrastructures, as their failure can lead to significant public safety and economic effects. These early preventive measures ensure that these infrastructures operate safely and efficiently over their intended life span and also save expenditures on maintenance and replacement [2]. These infrastructures are geometrically complex with various elements and joints, and composed of different materials including concrete, metal, wood and composite materials [3].
Among these different materials, concrete is abundantly used in civil infrastructures because of its durability. However, several factors such as externally applied and environmental loads, error in design and poor construction practices may lead to its deterioration, effecting flaws such as cracks and blowholes [4]. These flaws not only affect the appearance of the structure but also lead to loss of durability [5] and their assessment is crucial for safety as well as for cost-effective maintenance [6,7]. Flaws might be present in the surface of both plain (such as plain walls, rectangular columns or slabs) and non-plain (such as cylindrical beams and columns) concrete structures. These structures can have different geometric shapes and sizes, and detecting flaws at an early stage of concrete infrastructure is still a challenge. Presence of the structural features often masks indication of minute flaws especially when using optical detection or imaging techniques. In these techniques, complex signal processing is required such as relaxation and adaptive thresholding probabilistic method to extract indication of flaws and remove unwanted indications [8]. Therefore, there is a need to develop a simple and practical system that can detect minute surface flaws in plain and non-plain structures irrespective of the infrastructure material being used.
Several studies related to the detection of surface flaws in civil infrastructures using different imaging techniques have been reported [9,10,11,12,13,14,15,16,17,18,19]. Microwave and millimeter wave imaging techniques have been used to detect fatigue cracks in metal [9,10] and concrete [11,12]. Although the techniques are applicable for flaw detection in different materials, the imaging systems are complex and may require different antennas and operating frequency or frequency band for different materials. Ultrasonic imaging techniques have been used extensively for surface crack detection in metals [13]. Nevertheless, this technique is mainly useful for conducting materials but not for dielectric materials such as concrete. Different parameters of Rayleigh wave sensed by accelerometers, which were attached to the surface of the reinforced concrete block under impact, were analyzed to detect an artificial crack on the surface of the reinforced concrete [14]. However, this method needed direct surface contact of sensor and also needed external impact, which are not always practical. Laser technique has also been used for flaw detection in civil infrastructures. Laser Doppler Vibrometer (LDV) was used to detect artificial surface flaws in concrete [15]. However, this method needed external impact from shock tubes. LDV was also used to monitor deflection and vibration of bridge and the results were compared with contact sensors [16]. Nevertheless, this technique needed reflective tape to be attached to the bridge during monitoring, which is not practical. Also, this technique was not able to detect minute flaws such as cracks. Terrestrial laser scanning methods have been used to detect larger flaws on bigger surface areas using multiple laser sources and high-speed cameras [17,18]. These methods need complex signal processing and are mainly applicable in large areas but are not suitable to detect minute surface flaws. Laefer et al. [19] tried to address this problem by presenting fundamental mathematics to determine minimum crack width in unit-based masonry using terrestrial laser scanners. The absolute errors of crack widths were still 1.37 mm, which is useful for investigating large areas, but is not useful to detect minute crack widths. From this, it is clear that terrestrial laser scanning methods are mainly applicable in large-scale survey and monitoring and they require bulky instrumentation systems and complex data processing [20]. The laser displacement sensor (LDS) system is based on a different principle and it mainly focuses on local inspection for the purpose of detection of smaller flaws. LDS techniques have been applied to monitor defects in wind turbine blades by regularly monitoring the displacement between the blade and tower during the operation [21]. Recently, the authors have applied LDS technique to detect minute cracks in plain and cylindrical concrete surface by generating their one-dimensional (1-D) characteristic displacement responses [22]. For this purpose, a simple non-contact imaging system with LDS for surface flaw detection of civil infrastructure materials has been developed [23]. The developed system was able to provide 1-D profile of structure surface as well as its two-dimensional (2-D) images. The authors have presented the preliminary results of the application of the developed system for 2-D imaging, which provided profiling of dielectric and metal specimens, and the detection of surface cracks in plain concrete-based specimen [24]. This paper expands on the reported work and focuses on 2-D images of plain and non-plain metal and concrete specimens. For this purpose, novel software and algorithms have been developed and incorporated in the multifunctional computerized scanning mechanism with relatively smooth and fast motion. The performance of the proposed system was tested and verified by its application for imaging of metal and concrete specimens. Firstly, the imaging through the cut of the metal profile is performed to demonstrate the ability of the system to test its interior structure with different surface roughness and tilt. Secondly, 2-D images of the surface of plain and cylindrical concrete specimens are generated and analyzed for the purpose of detection of minute cracks.
2. Measurement Approach and Materials
2.1. Equipment and Materials
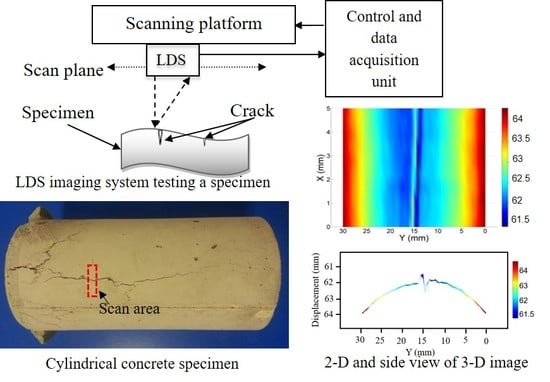
The measurement system mainly consists of LDS mounted on the scanning platform and control and data acquisition unit as shown in Figure 1. LDS works on the principle of triangulation measurement. It generates laser beam at a wavelength of 670 nm and outputs a displacement reading for every measurement point. The displacement ranges of the LDS used in this investigation are from 60 mm to 260 mm, while its range resolution is 0.1 mm. Diameter of the laser beam is 2.2 mm. The receiver inside LDS images the diffuse element of the reflection of the light spot and averages the measured values to give accurate output displacement value. The LDS has a micron accuracy range and is able to detect minute change in displacement reading at different ambient temperatures. However, warm-up time of 20 min is required to achieve uniform temperature distribution in the sensor for micron range measurement at fluctuating temperature [25].
In this investigation, two groups of specimens were used. One group was based on a metal profile with a through cut and another group included concrete-based specimens with surface flaws. Concrete blocks were used for the detection of the flaws such as cracks and blowholes on the plain surface. A cylindrical concrete specimen was also used to demonstrate feasibility of the proposed system for the detection of surface flaws on the non-plain surface of concrete.
2.2. Experimental Setup
The scanning platform and LDS were connected to the control and data acquisition unit as shown in Figure 1. This unit controlled the movement of the scanning platform and acquired data from the LDS for further processing. The scanning platform performed a raster scan over the specimen. The LabVIEW™-based [26] software program was developed for the control and data acquisition unit to receive the displacement reading from the LDS. Figure 2 shows the block diagram of the system including four modules. A hardware control module was used to give commands to the scanner and LDS for initialization, motion and measurement providing scan area and step sizes to the scanner, and the sampling rate to the LDS. A synchronization and data acquisition module sent a trigger signal to LDS for data acquisition after each movement of the scanner, and LDS acquired displacement data. In a data processing and visualization module, series of data at each alternate axis were flipped to compensate for the raster scan. The new set of data was then mapped based on the coordinate of the scan area. The real-time preview of 2-D image could be seen in LabVIEW graphic user interface. The data was then saved for further processing in MATLAB® R2014a [27]. A post-processing module provided generation of images and their processing using smoothing by giving proper color representation and the image enhancement by performing the interpolation. Each color in the 2-D image represented the distance of the LDS from each scan point at the surface of the specimen. Then, peak-to-peak value of each data set was determined by taking the 3 × 3 sliding window spatial mean filters along the highest and lowest displacement area [28]. This removed unwanted noise in the signal and gave accurate measure of highest and lowest distance. Thus, 2-D and 3-D images were generated where the reading was represented by color and both by color and displacement, respectively.
3. Results and Discussion
3.1. Imaging of Metal Profile with Through Cut
Figure 3a,b shows the top view and side view of the metal profile with a through cut in the 2 mm thick top plate, respectively. A 2 mm thick bottom plate of the metal profile was movable. The cut had a width of 1 mm (Figure 3a) and the distance between the top and the bottom plates of the profile was 42 mm (Figure 3b). The size of the scanned area was 5 mm × 5 mm (Figure 3a) and the step size was set to be 0.5 mm. Figure 3c,d shows the 2-D image and side view of 3-D image of the scanned area, respectively. The indication of the cut is clearly seen in 2-D image and a few observations can be made from Figure 3c,d. The width of the cut obtained from the image is wider than its actual (real) width measured using Vernier caliper. This is due to the large size of laser beam (2.2 mm) from LDS compared to the width of the cut (~1 mm). The color bar and displacement reading show that the laser radiation (i.e., part of its beam) penetrates through the cut and the radiation reflected from the bottom plate and sides of the cut is picked up by LDS. The distance between two plates determined using 3 × 3 mean filters is 41.82 mm, which is equal to the real distance measured using Vernier caliper (i.e., 42 mm). The results show that the proposed technique is able to detect flaws in the surface of the profile and to sense its inner structure through the cut. To confirm this and to investigate feasibility of this technique with a through cut for other applications, this specimen was further used to investigate the effect of changes of distances between the plates as well as changes of tilt angle and surface roughness of the bottom plate. The metal surface of the bottom plate was exposed or covered with paper sheet to investigate the influence of surface roughness/smoothness on the reading.
Firstly, the distance between top and bottom plates d1 was changed by moving the bottom plate parallel to the original position as shown in Figure 4a and, secondly, tilt angle was changed by changing the distance between through cut and the bottom plate (referred to as d2) as shown in Figure 4b. The tilt angle ranging from 7.2° to 15° corresponding to d2 = 32 mm and d2 = 21.5 mm, respectively, was used for preliminary investigation. These two configurations were used with both the exposed and covered bottom plate.
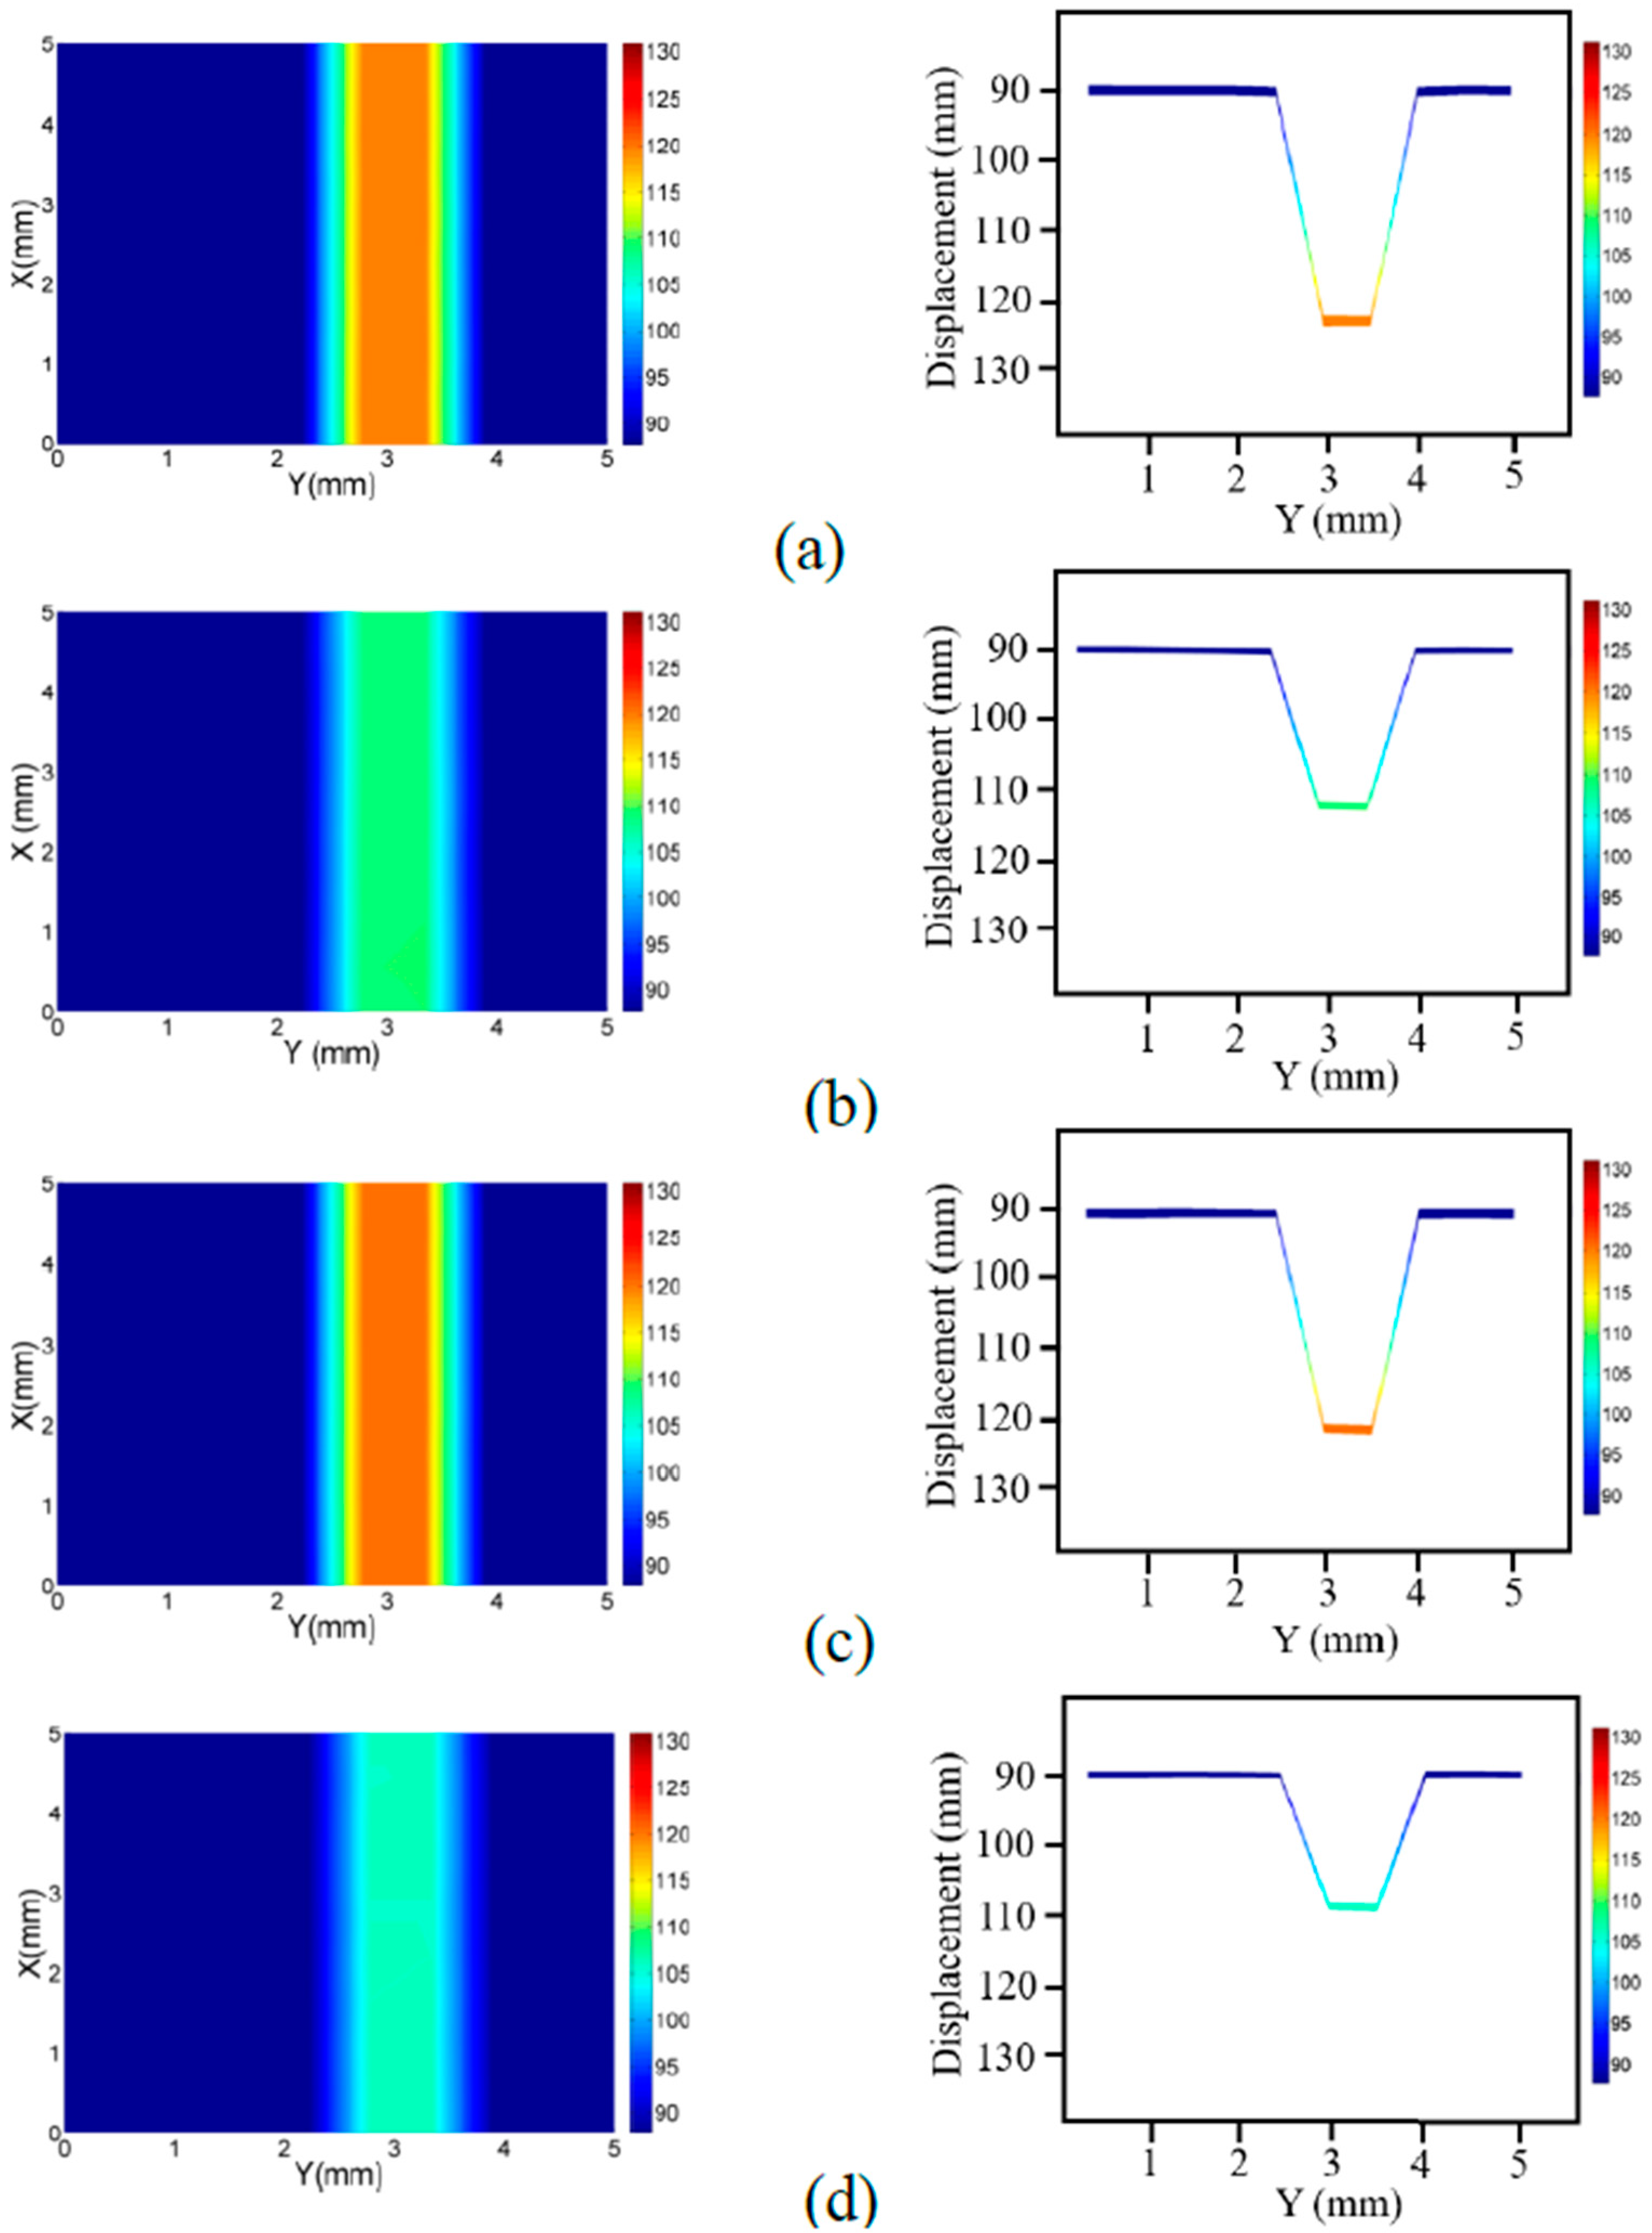
Figure 5a,b shows the 2-D and side view of 3-D images of the profile through the cut with an exposed bottom plate at distances d1 of 32 mm and 21.5 mm, respectively. Similarly, Figure 5c,d shows the 2-D and side view of 3-D images of the cut with a covered bottom plate at distances d1 of 32 mm and 21.5 mm, respectively. Both sets of the images show clear indication of the cut and the inner profile through the cut. The images at d1 of 32 mm are identical (cf. Figure 5a,c) while there is a slight difference between images of the exposed and covered bottom plate at d1 of 21.5 mm, which can be attributed to scattering of light from the paper sheet. These results show that the smoothness/roughness of the profile can affect indication of the bottom plates at small distances between the cut and the bottom plate.
Figure 6a,b shows the 2-D and side view of 3-D images of the profile through the cut with an exposed tilted bottom plate at distances d2 of 32 mm and 21.5 mm, respectively, to obtain different tilt angle, whereas Figure 6c,d shows the similar images with the covered bottom plate. As expected, the images with both the exposed and covered plate at 32 mm are identical (Figure 6a,c). However, when the distance d2 was decreased to 21.5 mm in the exposed surface, LDS could not obtain displacement reading at some points from the bottom plate. Due to the increase in tilt angle, the light reflected off the smooth exposed bottom plate did not reach the LDS, but were scattered. This resulted in loss of displacement reading which can be clearly seen in the images. However, for the same increase in tilt, the light reflected off the rougher surface of paper reached LDS.
The results of this investigation show that further decreasing the d2, and thereby increasing the tilt angle, decreases the quality of images. For example, at d2 of 18 mm, when the tilt angle was increased to 17.5°, there is no displacement reading from the bottom plate in the exposed surface. The range of the color scale of the image was reduced to visualize a small change in displacement, which indicated lower value of change in displacement reading mainly because of the reflection of the fraction of the laser radiation from the edges of the cut as shown in Figure 7a. However, there was still a good indication of the cut as well as the inner profile for the covered bottom plate as shown in Figure 7b. The results of this investigation show that the main contribution in the indication of cut came from the reflection off the edges of the cut.
The real distances between the top and bottom plate were compared with the distances obtained from the side view of 3-D images. This was performed for both the exposed and covered bottom plate using a statistical tool called cross-correlation technique. The cross-correlation technique applied to the newly fetched data and the reference data gives a coefficient value known as correlation coefficient, providing information about the similarity of the data with the reference data. The coefficient value ranking from 0 to 1 quantify the linear correlation between two data sets, and the lower coefficient value can be an indicator of a deviation of measured distance from the real distance. The correlation coefficient (r) is given by the equation [29]:
where n is the number of data, x is the reference distance and y is the measured distance.
The results show that the correlation coefficient between the real distances and obtained distances for the exposed bottom plate was 0.9999, while for the covered bottom plate, it was determined to be 0.9995 for a non-tilted bottom plate. These values indicate that the obtained distances in both exposed and covered cases match the real distances. For the tilted bottom plate, the correlation coefficient between the real distances and obtained distances for the exposed bottom plate was 0.9987 and for the covered bottom plate was 0.9993. Although both coefficients are high, which indicates that the measured distance matches the real distances, the measured distances with the covered bottom plate were more accurate compared to the exposed bottom plate.
In addition, the mean absolute errors between real distance and obtained distance between the top and bottom plate were also determined. The mean absolute error for the non-tilted and exposed bottom plate was determined to be 0.05 mm while for covered bottom plate, it was determined to be 0.24 mm. Similarly, the mean absolute error for the tilted and exposed bottom plate was 1.23 mm, while for the covered bottom plate; it was 0.68 mm. The absolute error values also prove that the error for the exposed bottom plate is higher than in the covered bottom plate in tilted case.
3.2. Surface Flaw Detection in Cement-Based Specimens
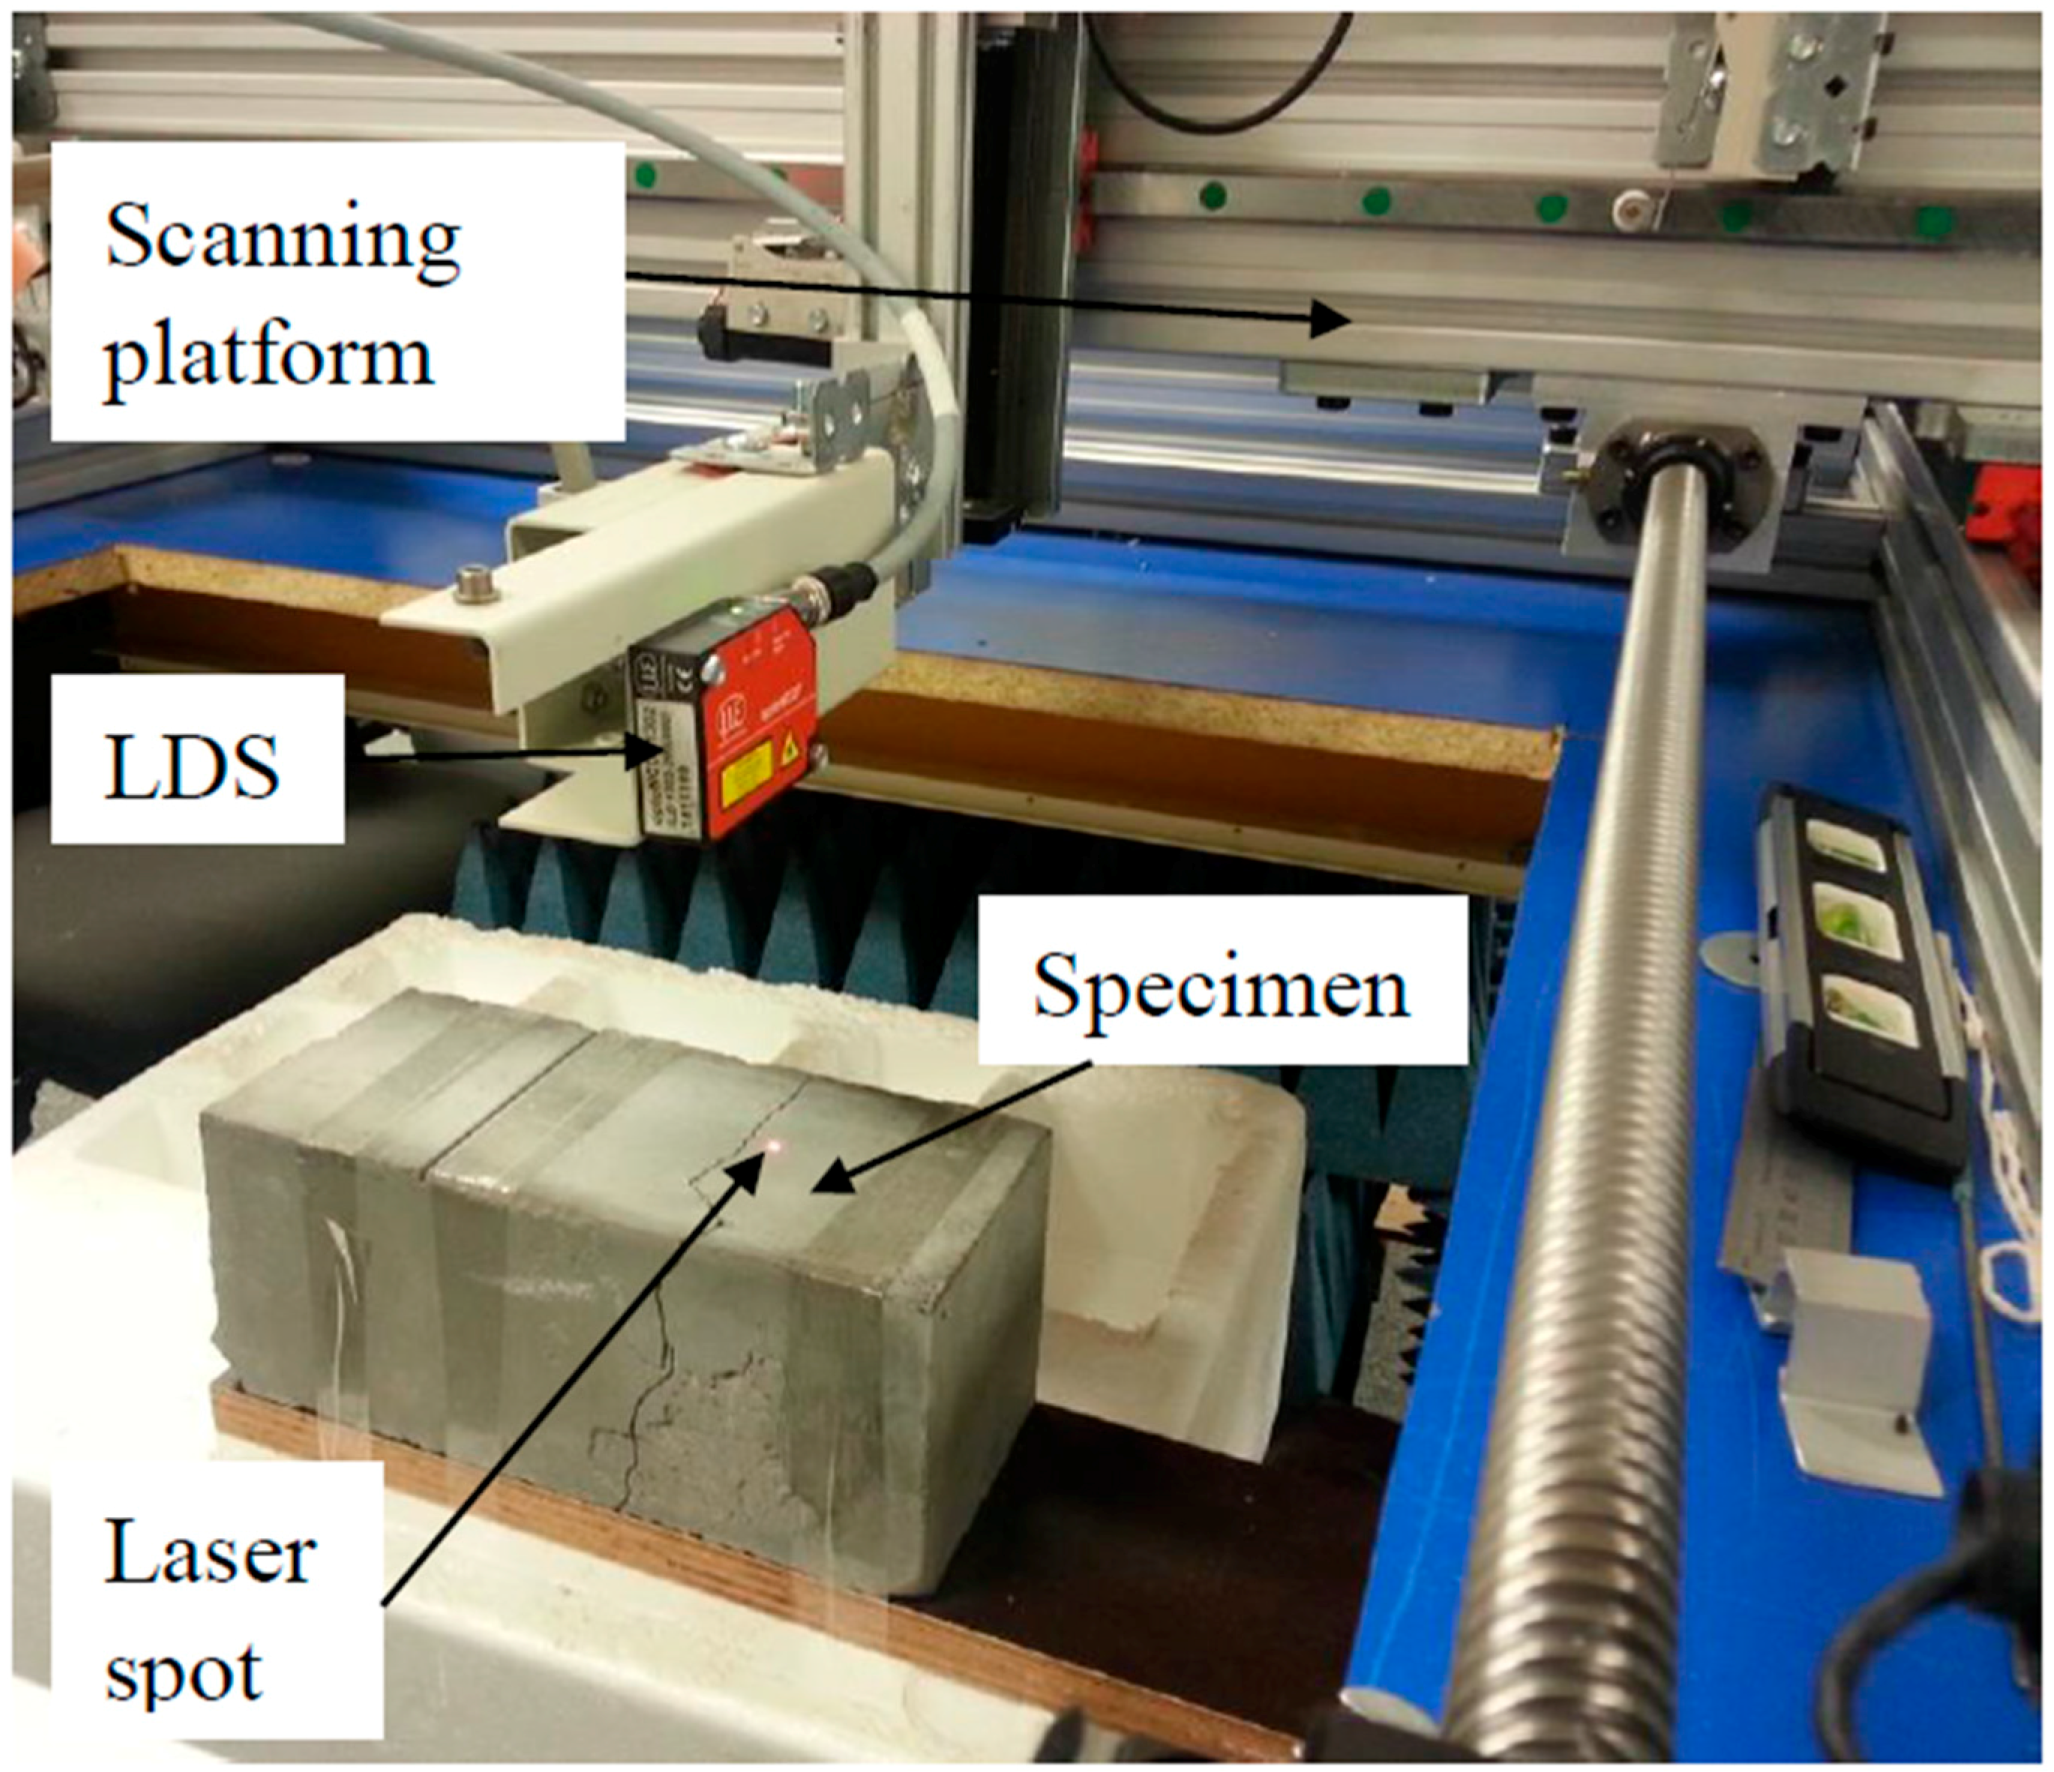
The 2-D images were generated for the detection of minute flaws such as cracks and blowholes in the concrete-based specimens. Firstly, a mortar block with cracks was tested with a measurement system as shown in Figure 8.
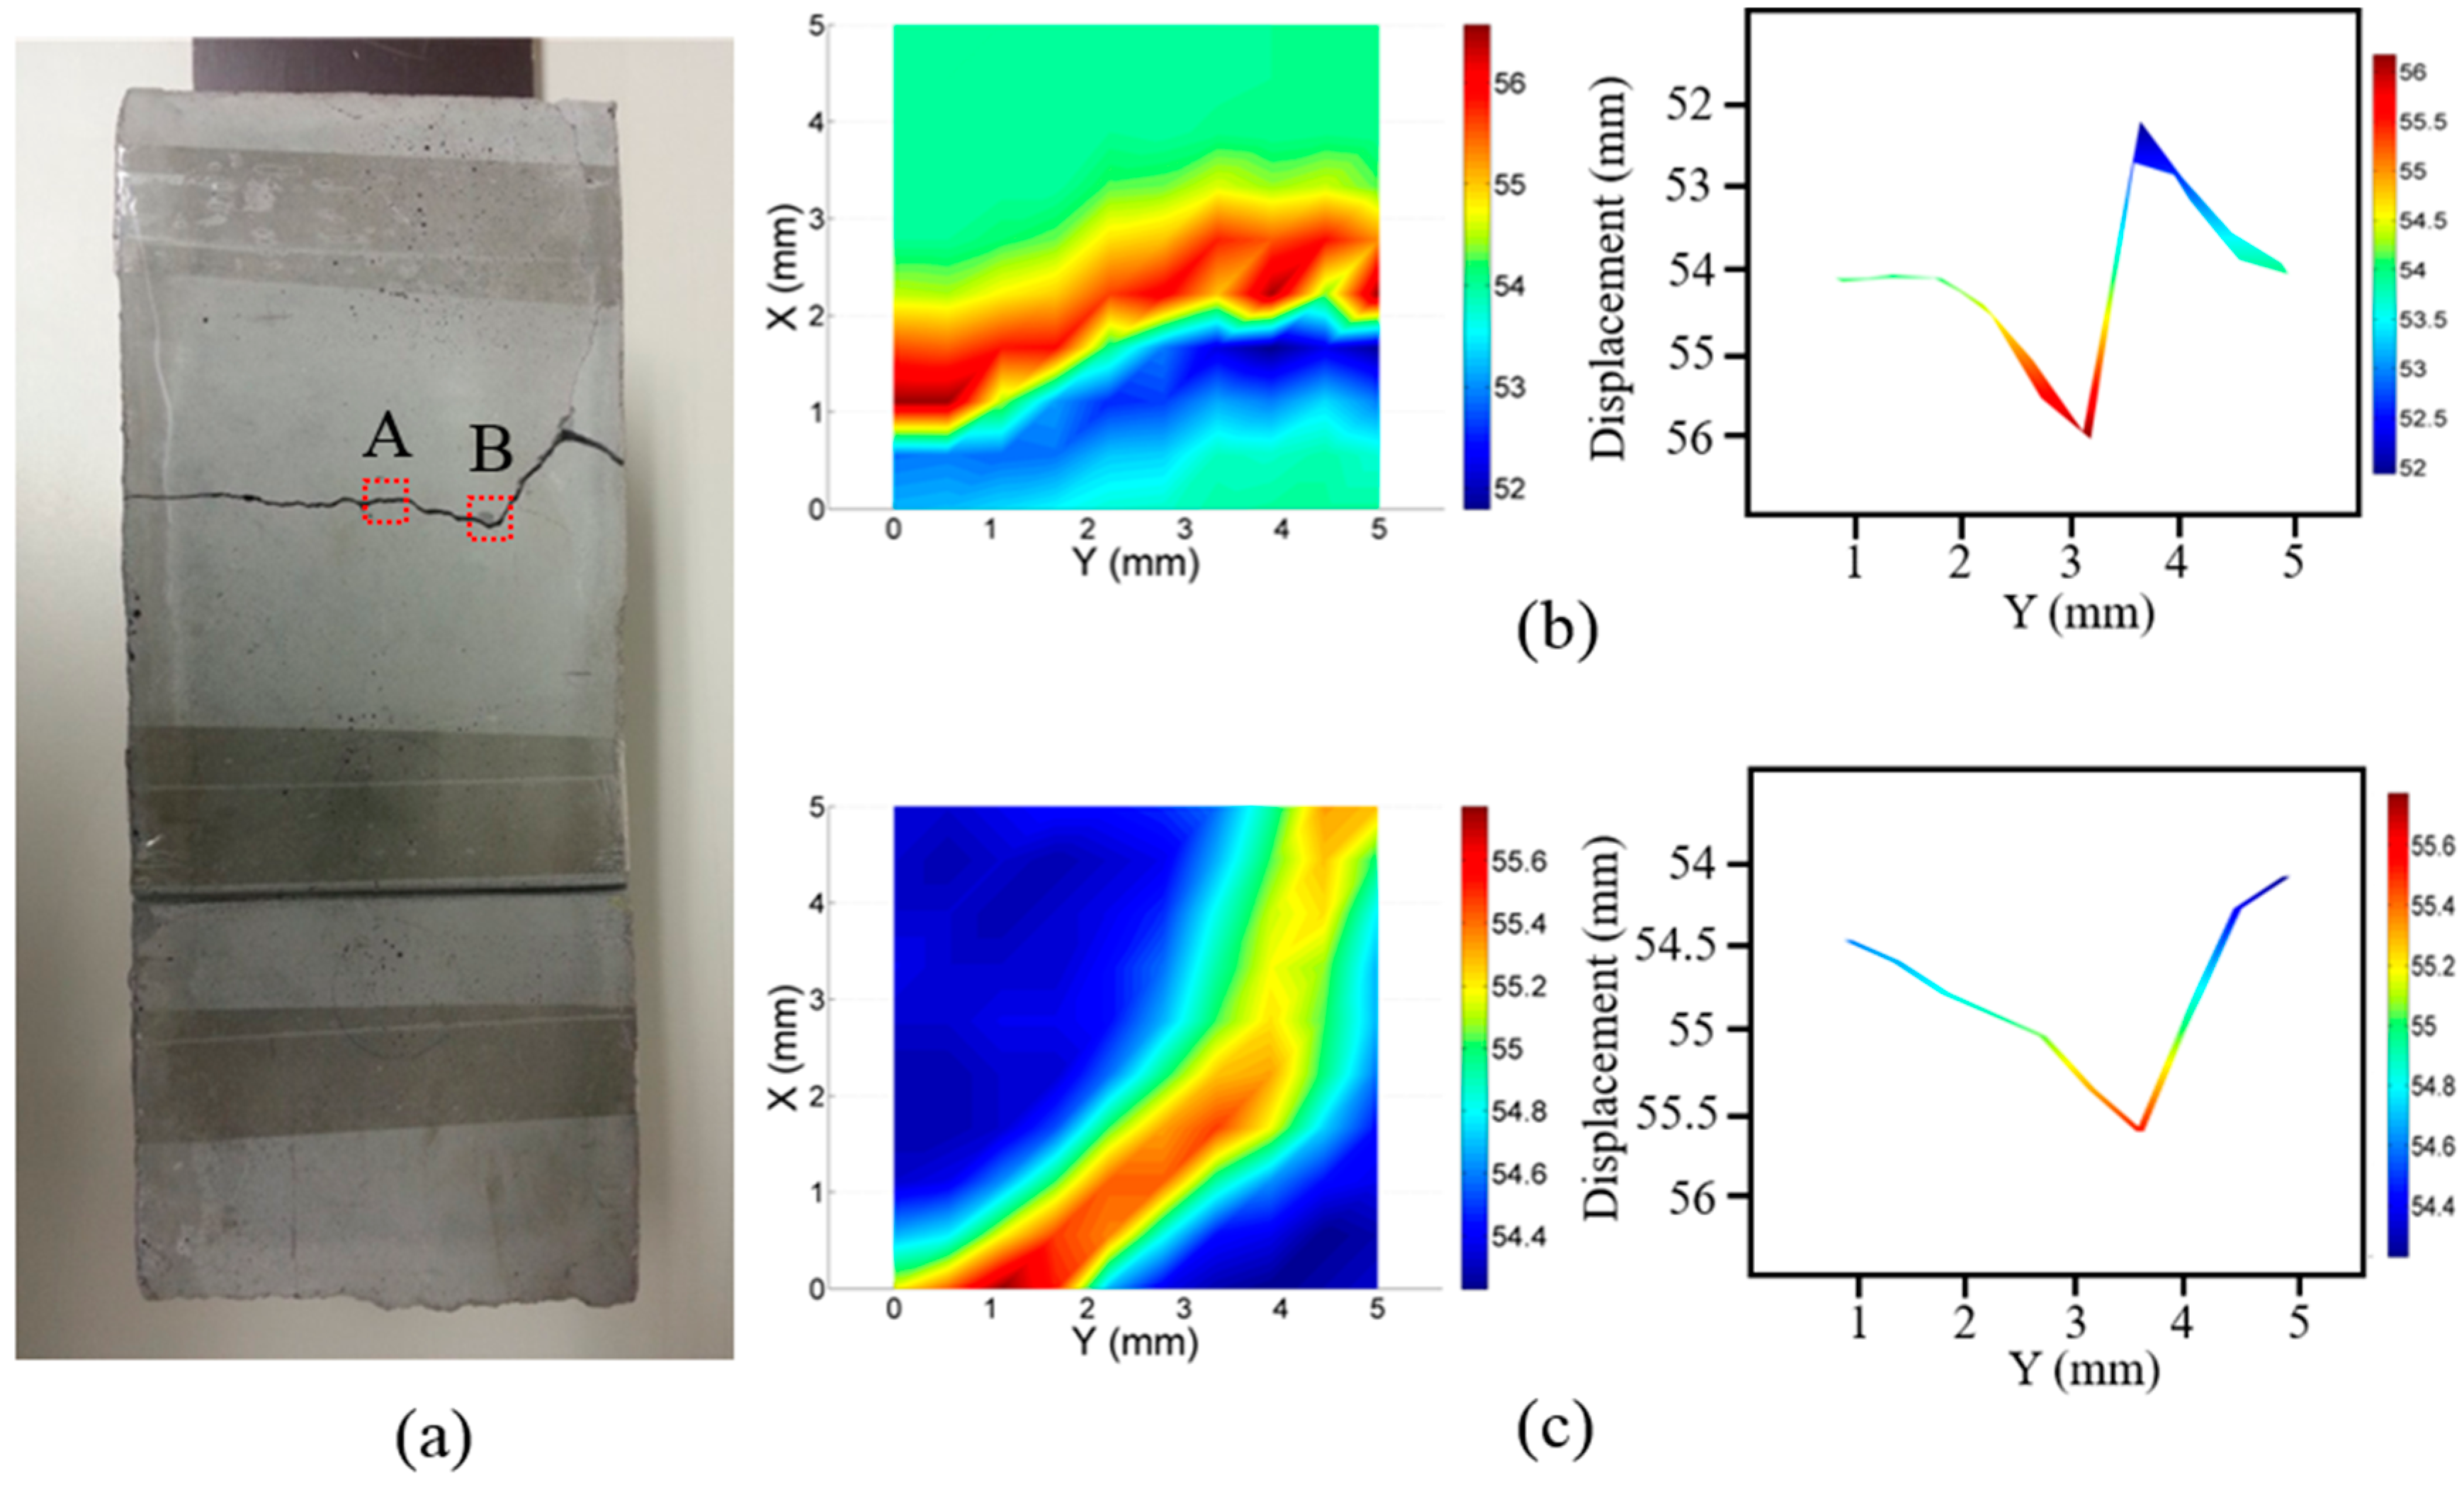
The mortar block had a dimension of 235 mm by 100 mm by 100 mm and a 1 mm width through the crack as shown in Figure 9a. Two locations along the crack designated as A and B with different directions of crack were imaged at the scan area of 5 mm × 5 mm and the step size of 0.5 mm. Figure 9b,c shows the 2-D images of the scanned area at location A and B, respectively. The 2-D images and side views of 3-D images clearly indicate the presence of the crack at different orientations. Contrary to the metal profile, the majority of the laser beam hitting the base of the crack was reflected back, which was indicated by higher value of change in displacement (~4 mm in crack A and ~1.2 mm in crack B). These values correspond to the actual crack depths.
Next, a concrete block with three flaws on the surface was investigated. The concrete block had a dimension of 350 mm by 100 mm by 100 mm as shown in Figure 10a. The size of the scanned area around each flaw was chosen to be 10 mm x 10 mm. The first flaw was a 1 mm width natural crack. Figure 10b (upper) shows the 2-D image of the scanned area over the crack. The crack was clearly visible in the 2-D image. The second flaw was a ~3 mm diameter blowhole (referred to as hole 1). The depth of this blowhole was ~3 mm. Third flaw was a ~1.5 mm diameter blowhole (referred to as hole 2). The depth of hole 2 was ~2 mm. The upper rows of Figure 10c,d show the 2-D image where indication of both blowholes can be clearly seen. The side view of the 3-D image of the scan path indicated the presence of flaws represented by colors and displacement value as shown in the lower rows of Figure 10b–d. These images showed that the crack and blowholes can be detected clearly. From Figure 10c,d (lower), the depth of blowholes can be estimated. Similar to the previous case, the value of change in displacement is higher in crack due to the reflection of the laser beam from the base of the crack. In case of blowhole, the reflection of the laser beam was from the combination of edges and the base of the hole.
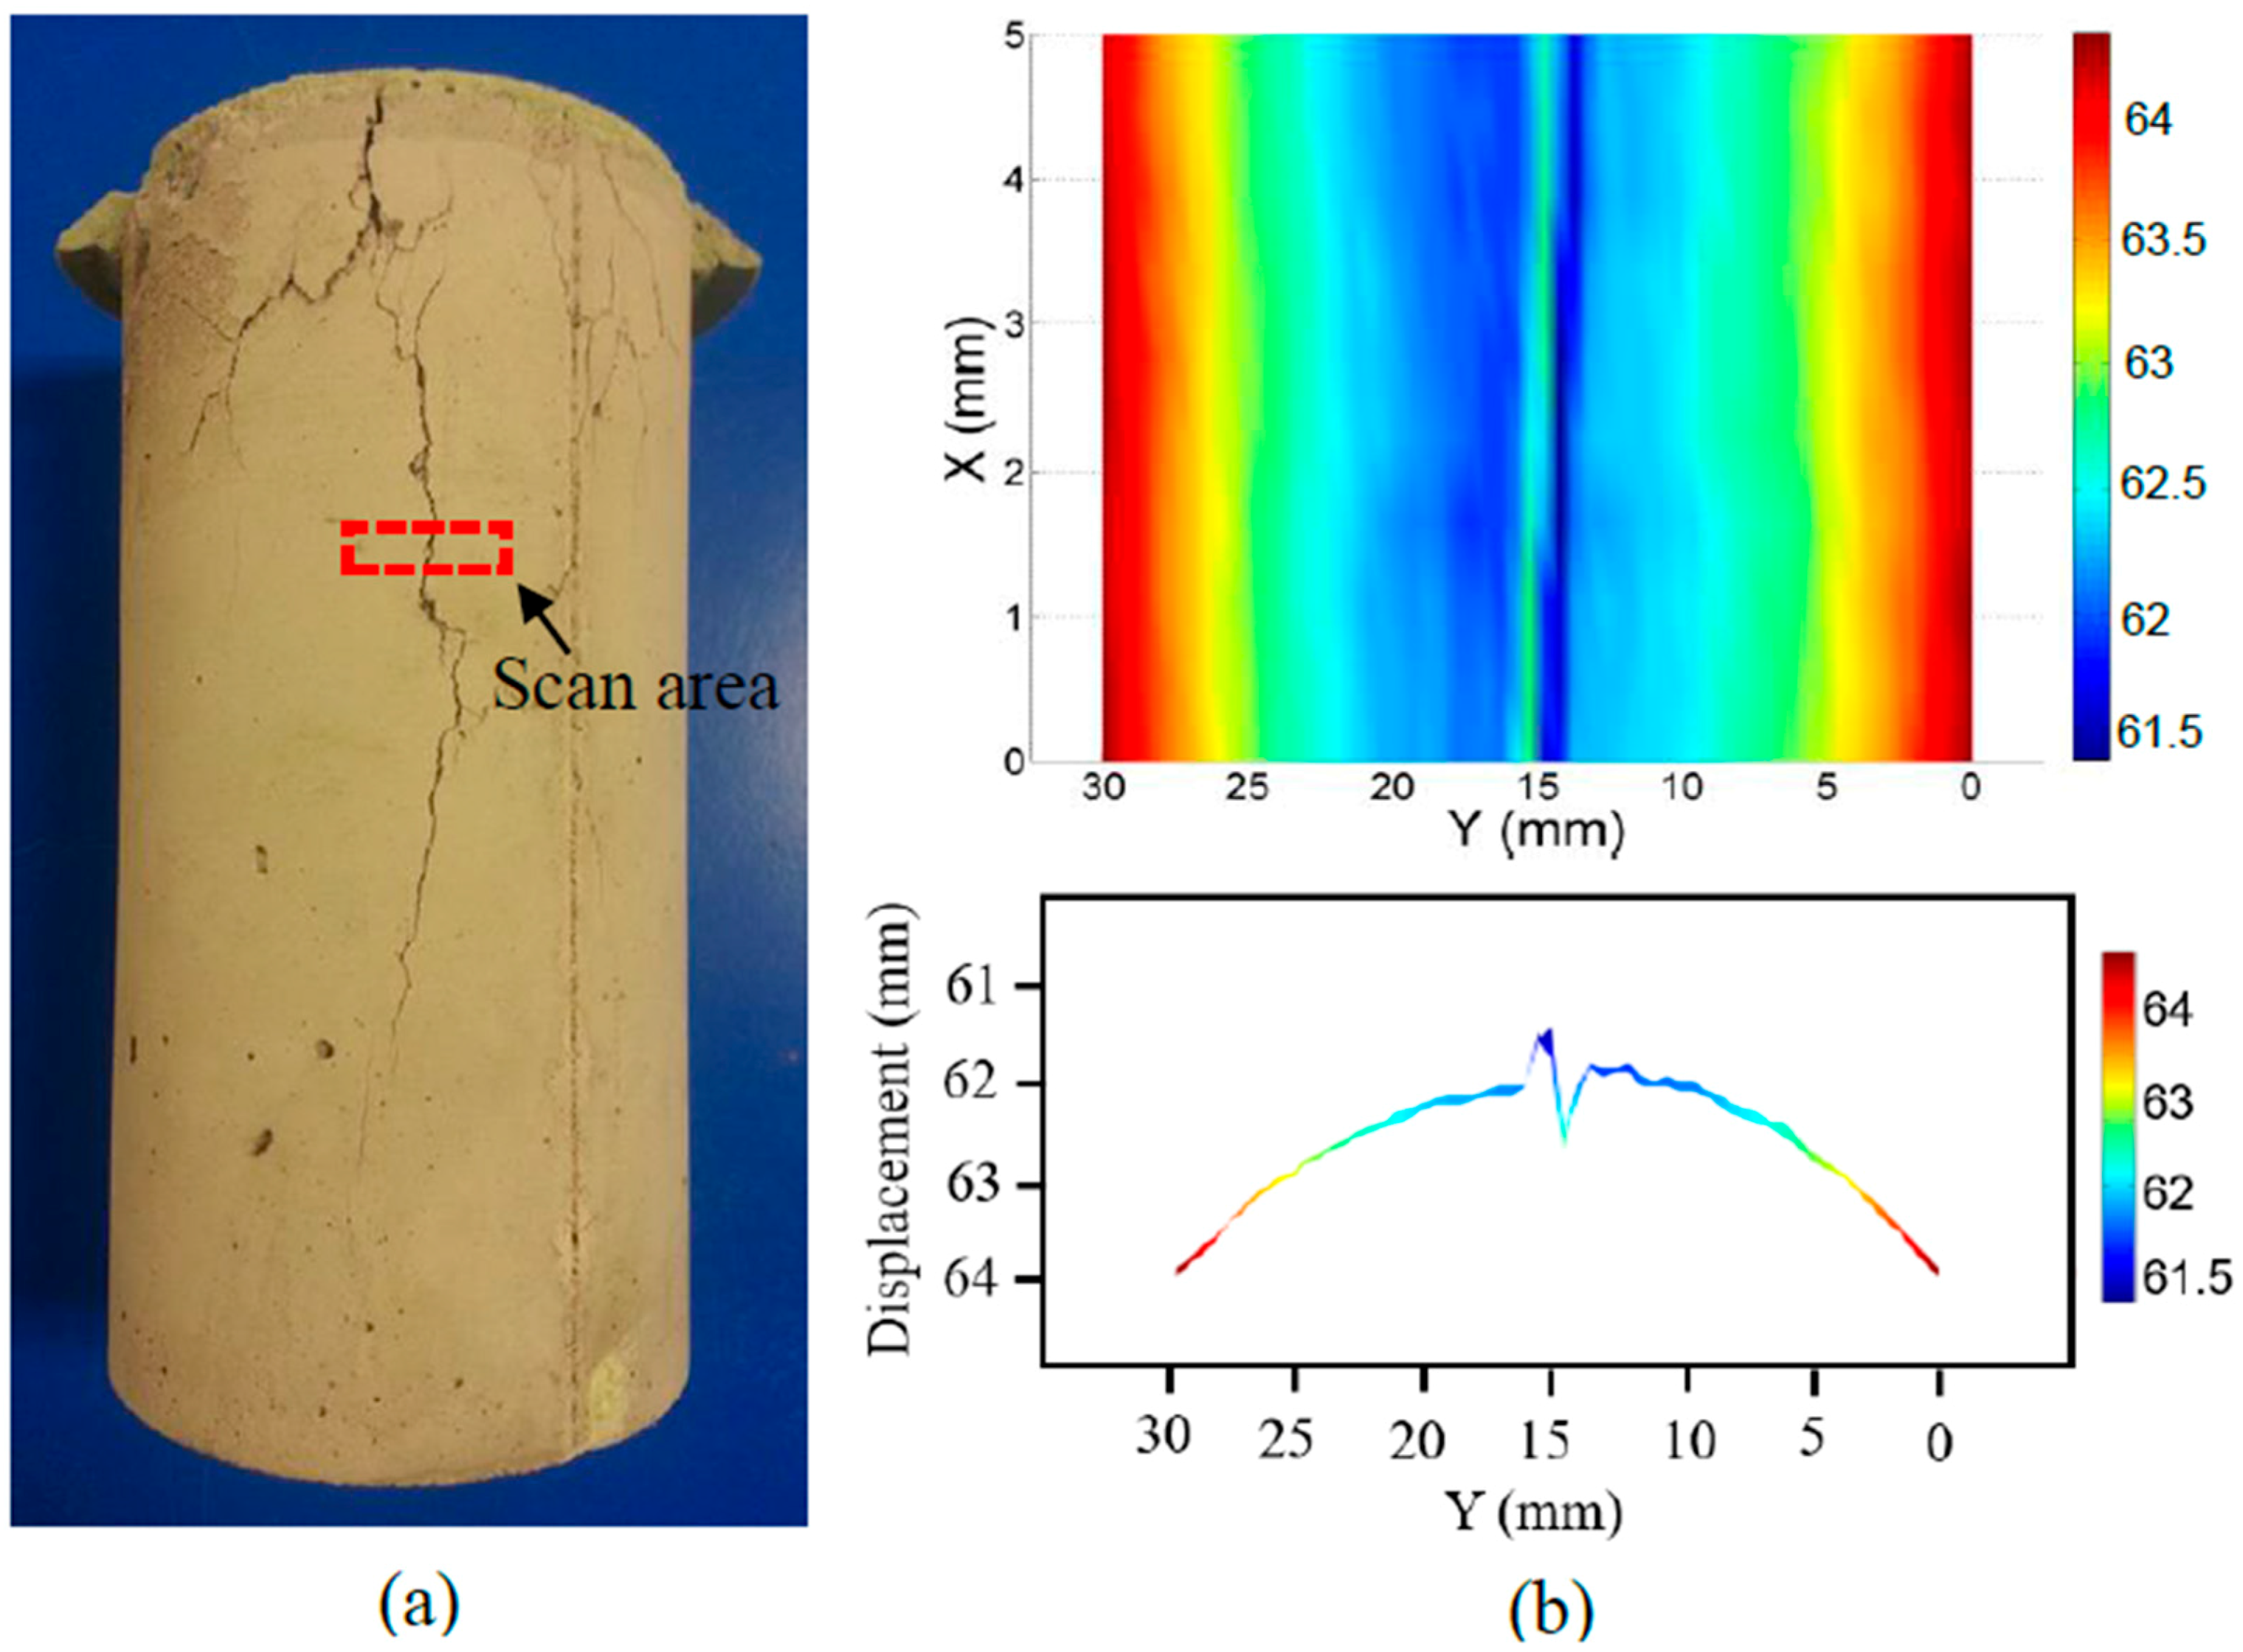
Finally, to check the applicability of the proposed system for flaw detection in non-plain surface, a cylindrical concrete specimen with a diameter of ~104 mm was used which contained several natural cracks as shown in Figure 11a. These cracks of different widths and lengths occurred when the specimen was loaded in compression using a testing machine. The scan area (30 mm × 5 mm) included both the cylindrical profile and a 1 mm crack. It was expected that these flaws could be masked by the profile change. However, 2-D image of the scan area clearly indicates the crack running through the middle of the scan area and the change in profile of the specimen was also visible as shown in Figure 11b. The side view of the 3-D image of the scan area also showed both the profile and clear indication of crack. The characteristic curve of crack is similar to the curve for the crack obtained in previous cases.
The results demonstrated the feasibility of the proposed imaging system for the detection of surface flaws such as cracks and holes in a variety of construction materials. The effect of tilt and surface roughness on the detection of surface cut and sensing of inner structure of metal through the cut was investigated. The results showed that flaw detection can be achieved on both smooth and rough surface, but at high tilt angle, rougher surface is needed for accurate profiling of inner surface through the cut. The main contribution of the indication of flaw came from the reflection off the edges of the flaw. The major fraction of the laser beam is reflected back in the case of a rougher surface like concrete leading to more accurate depth approximation compared to a smooth surface like metal. In cement-based specimen, the generated images showed the surface flaws such as cracks and blowholes in both plain and non-plain specimens. The developed system is capable of generating surface profiles at high speed with a capability of scanning an area of 50 mm × 50 mm within a minute and a real-time defect detection feature. Relatively narrow cracks with width of 1 mm were clearly observed; moreover, the developed system works as a foundation for the detection of even smaller width cracks, blowholes and impact damages on the surface of infrastructure materials using higher resolution LDS.
4. Conclusions
The developed LDS imaging system was applied for 2-D imaging of metal and concrete specimens. It was shown that the system could provide the inspection of interior structure of metal profile using 2-D imaging through a cut in its plate. In this case, surface roughness and tilt of the interior structure components play a critical role and may compensate the influence of each other. For example, the increase of tilt of the surface may destroy its images through the cut but the increase of the surface roughness may recover the images at some ranges of the tilt and roughness level. The applicability of the system for non-contact inspection of plain and cylindrical concrete specimens for the purpose of detection of surface flaws such as cracks and blowholes has also been demonstrated. The developed system can be used for profiling and non-contact inspection of structures made of construction materials such as metal, plastic and concrete. Future work includes incorporation of this system into microwave imaging system to provide effective inspection of the surface as well as interior structure of engineered materials.
Author Contributions
Paritosh Giri and Sergey Kharkovsky designed and conceived the system; Sergey Kharkovsky supervised the work at all its stages; Paritosh Giri developed the software and algorithm, and performed the experiments and statistical analysis, Bijan Samali developed the requirements for the system performance and specimens, and contributed sensor/material tools; Paritosh Giri, Sergey Kharkovsky and Bijan Samali analyzed the data and wrote the paper.
Conflicts of Interest
The authors declare no conflict of interest.
References
- Brownjohn, J.M. Structural health monitoring of civil infrastructure. Philos. Trans. R. Soc. London Ser. A 2007, 365, 589–622. [Google Scholar] [CrossRef] [PubMed]
- Chang, P.C.; Flatau, A.; Liu, S.C. Review paper: Health monitoring of civil infrastructure. Struct. Health Monit. 2003, 2, 257–267. [Google Scholar] [CrossRef]
- Karbhari, V.M.; Zhao, L. Use of composites for 21st century civil infrastructure. Comput. Methods Appl. Mech. Eng. 2000, 185, 433–454. [Google Scholar] [CrossRef]
- Gambhir, M.L. Concrete Technology: Theory and Practice, 5th ed.; Tata McGraw-Hill Education: New Delhi, India, 2013. [Google Scholar]
- Thompson, M. Blowholes in concrete surfaces. Concrete (London) 1969, 3, 64–66. [Google Scholar]
- Yamaguchi, T.; Hashimoto, S. Fast crack detection method for large-size concrete surface images using percolation-based image processing. Mach. Vision Appl. 2010, 21, 797–809. [Google Scholar] [CrossRef]
- Park, S.; Ahmad, S.; Yun, C.-B.; Roh, Y. Multiple crack detection of concrete structures using impedance-based structural health monitoring techniques. Exp. Mech. 2006, 46, 609–618. [Google Scholar] [CrossRef]
- Fujita, Y.; Hamamoto, Y. A robust method for automatically detecting cracks on noisy concrete surfaces. In Next-Generation Applied Intelligence; Springer: Berlin, Germany, 2009; pp. 76–85. [Google Scholar]
- Kharkovsky, S.; Ghasr, M.T.; Zoughi, R. Near-field millimeter-wave imaging of exposed and covered fatigue cracks. IEEE Trans. Instrum. Meas. 2009, 58, 2367–2370. [Google Scholar] [CrossRef]
- Zoughi, R.; Kharkovsky, S. Microwave and millimetre wave sensors for crack detection. Fatigue Fract. Eng. Mater. Struct. 2008, 31, 695–713. [Google Scholar] [CrossRef]
- Kharkovsky, S.; Zoughi, R. Microwave and millimeter wave nondestructive testing and evaluation-Overview and recent advances. IEEE Instrum. Meas. Mag. 2007, 10, 26–38. [Google Scholar] [CrossRef]
- Nadakuduti, J.; Chen, G.; Zoughi, R. Semiempirical electromagnetic modeling of crack detection and sizing in cement-based materials using near-field microwave methods. IEEE Trans. Instrum. Meas. 2006, 55, 588–597. [Google Scholar] [CrossRef]
- Dhital, D.; Lee, J. A fully non-contact ultrasonic propagation imaging system for closed surface crack evaluation. Exp. Mech. 2012, 52, 1111–1122. [Google Scholar] [CrossRef]
- Lee, F.W.; Chai, H.K.; Lim, K.S. Assessment of reinforced concrete surface breaking crack using rayleigh wave measurement. Sensors 2016, 16, 337. [Google Scholar] [CrossRef] [PubMed]
- Mori, K.; Spagnoli, A.; Murakami, Y.; Kondo, G.; Torigoe, I. A new non-contacting non-destructive testing method for defect detection in concrete. NDT E Int. 2002, 35, 399–406. [Google Scholar] [CrossRef]
- Nassif, H.H.; Gindy, M.; Davis, J. Comparison of laser Doppler vibrometer with contact sensors for monitoring bridge deflection and vibration. NDT E Int. 2005, 38, 213–218. [Google Scholar] [CrossRef]
- Olsen, M.J.; Kuester, F.; Chang, B.J.; Hutchinson, T.C. Terrestrial laser scanning-based structural damage assessment. J. Comput. Civ. Eng. 2009, 24, 264–272. [Google Scholar] [CrossRef]
- Cheng, Y.-J.; Qiu, W.; Lei, J. Automatic extraction of tunnel lining cross-sections from terrestrial laser scanning point clouds. Sensors 2016, 16, 1648. [Google Scholar] [CrossRef] [PubMed]
- Laefer, D.F.; Truong-Hong, L.; Carr, H.; Singh, M. Crack detection limits in unit based masonry with terrestrial laser scanning. NDT E Int. 2014, 62, 66–76. [Google Scholar] [CrossRef]
- Riveiro, B.; Morer, P.; Arias, P.; De Arteaga, I. Terrestrial laser scanning and limit analysis of masonry arch bridges. Constr. Build. Mater. 2011, 25, 1726–1735. [Google Scholar] [CrossRef]
- Giri, P.; Lee, J.-R. Development of wireless laser blade deflection monitoring system for mobile wind turbine management host. J. Intell. Mater. Syst. Struct. 2013, 25, 1384–1397. [Google Scholar] [CrossRef]
- Giri, P.; Kharkovsky, S. Detection of surface crack in concrete using measurement technique with laser displacement sensor. IEEE Trans. Instrum. Meas. 2016, 65, 1951–1953. [Google Scholar] [CrossRef]
- Kharkovsky, S.; Giri, P.; Samali, B. Non-contact inspection of construction materials using 3-axis multifunctional imaging system with microwave and laser sensing techniques. IEEE Instrum. Meas. Mag. 2016, 19, 6–12. [Google Scholar] [CrossRef]
- Giri, P.; Kharkovsky, S. Detection of flaws on surface of civil infrastructures and their profiling using imaging system with laser displacement sensor. In Proceedings of the SPIE 9803, Sensors and Smart Structures Technologies for Civil, Mechanical, and Aerospace Systems 2016, Las Vegas, NV, USA, 20 March 2016; p. 98034R. [Google Scholar]
- MICRO-EPSILON Instruction Manual OptoNCDT 1302. Available online: http://www.micro-epsilon.com/download/manuals/man--optoNCDT-1302--en.pdf (accessed on 21 December 2016).
- LabVIEW™ 2015 [Computer Software], National Instruments Australia, Macquarie Park, NSW, Australia. Available online: http://www.ni.com/labview/ (accessed on 14 November 2016).
- MATLAB® R2014a [Computer Software], the MathWorks Australia Pty. Ltd, Chatswood, NSW, Australia. Available online: https://au.mathworks.com/products/matlab.html (accessed on 12 December 2016).
- Lukac, R.; Smolka, B.; Martin, K.; Plataniotis, K.N.; Venetsanopoulos, A.N. Vector filtering for color imaging. IEEE Signal Process. Mag. 2005, 22, 74–86. [Google Scholar] [CrossRef]
- Su, Z.; Wang, X.; Chen, Z.; Ye, L.; Wang, D. A built-in active sensor network for health monitoring of composite structures. Smart Mater. Struct. 2006, 15, 1939. [Google Scholar] [CrossRef]
Figure 1.
Schematic representation of laser displacement sensor (LDS) imaging system testing non-plain surface of the specimen under test with cracks.
Figure 1.
Schematic representation of laser displacement sensor (LDS) imaging system testing non-plain surface of the specimen under test with cracks.
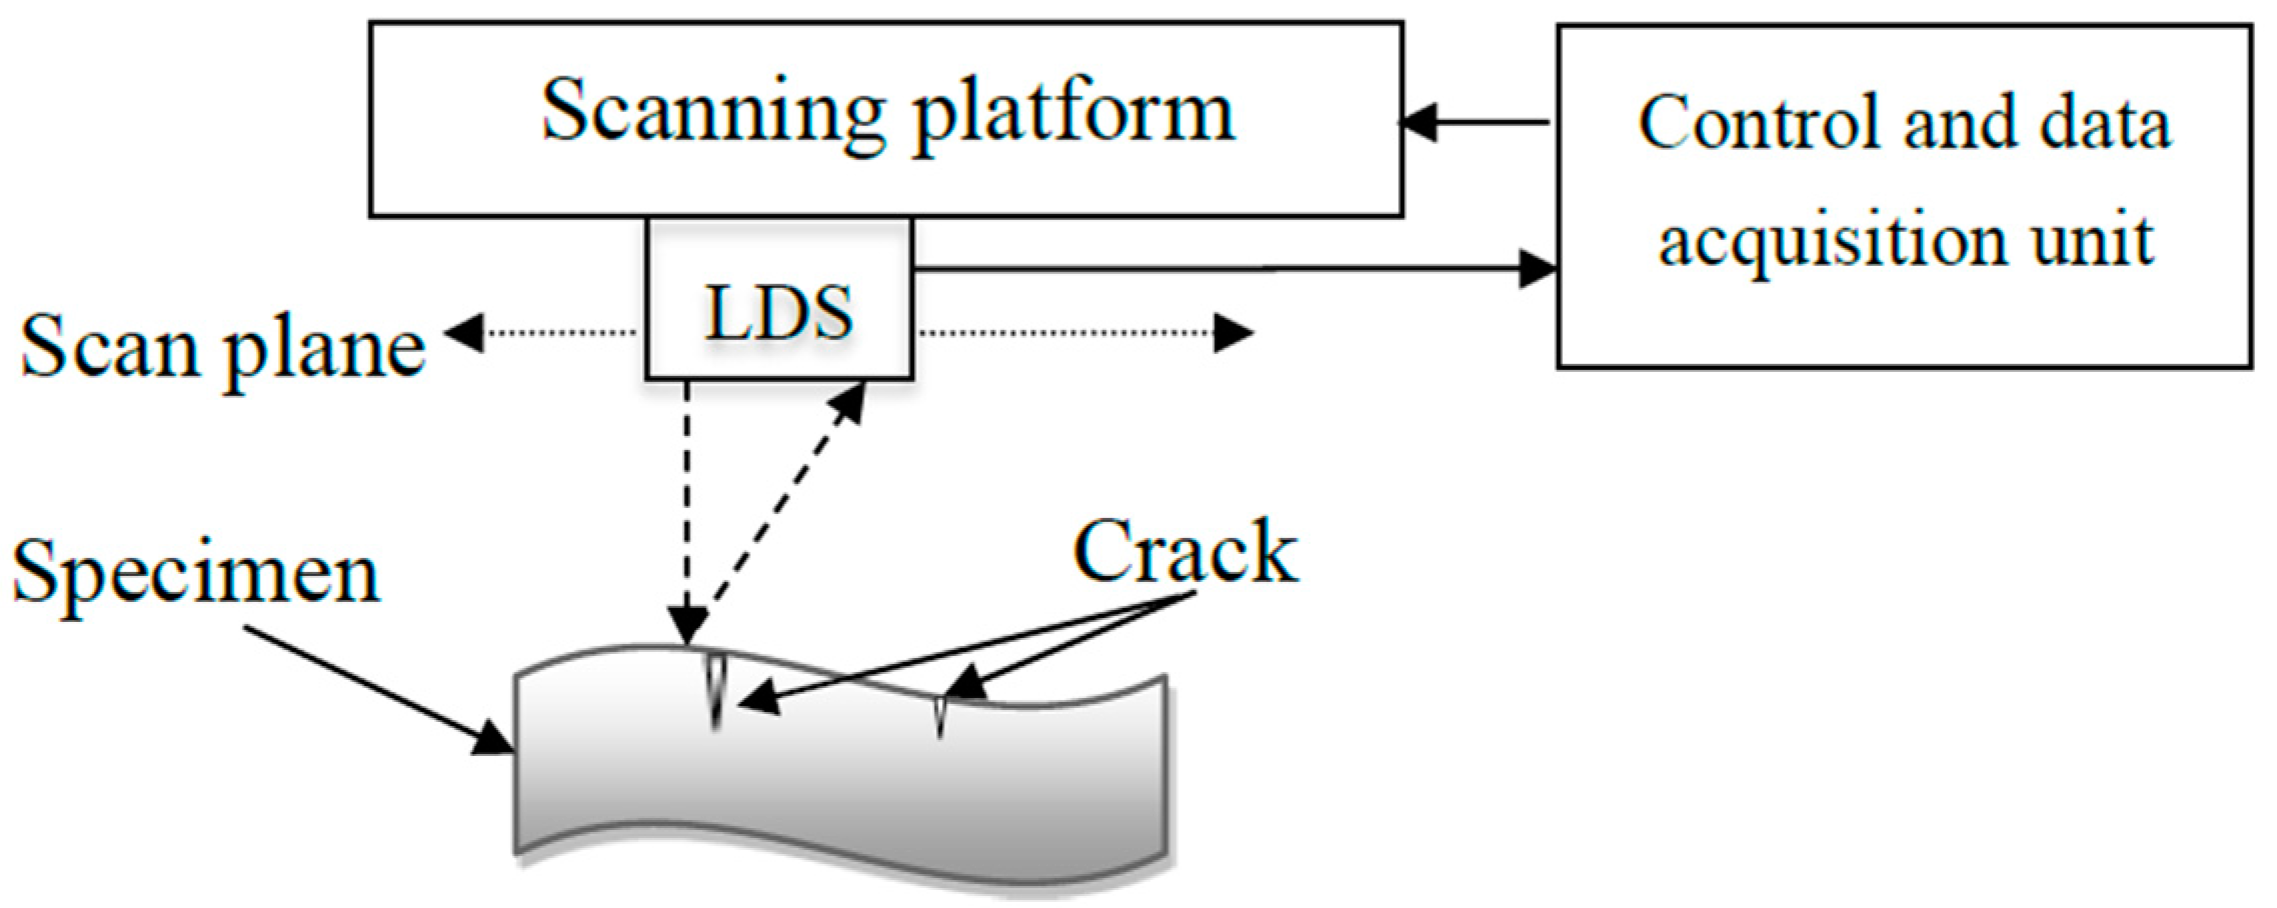
Figure 2.
Block diagram of LDS imaging system.
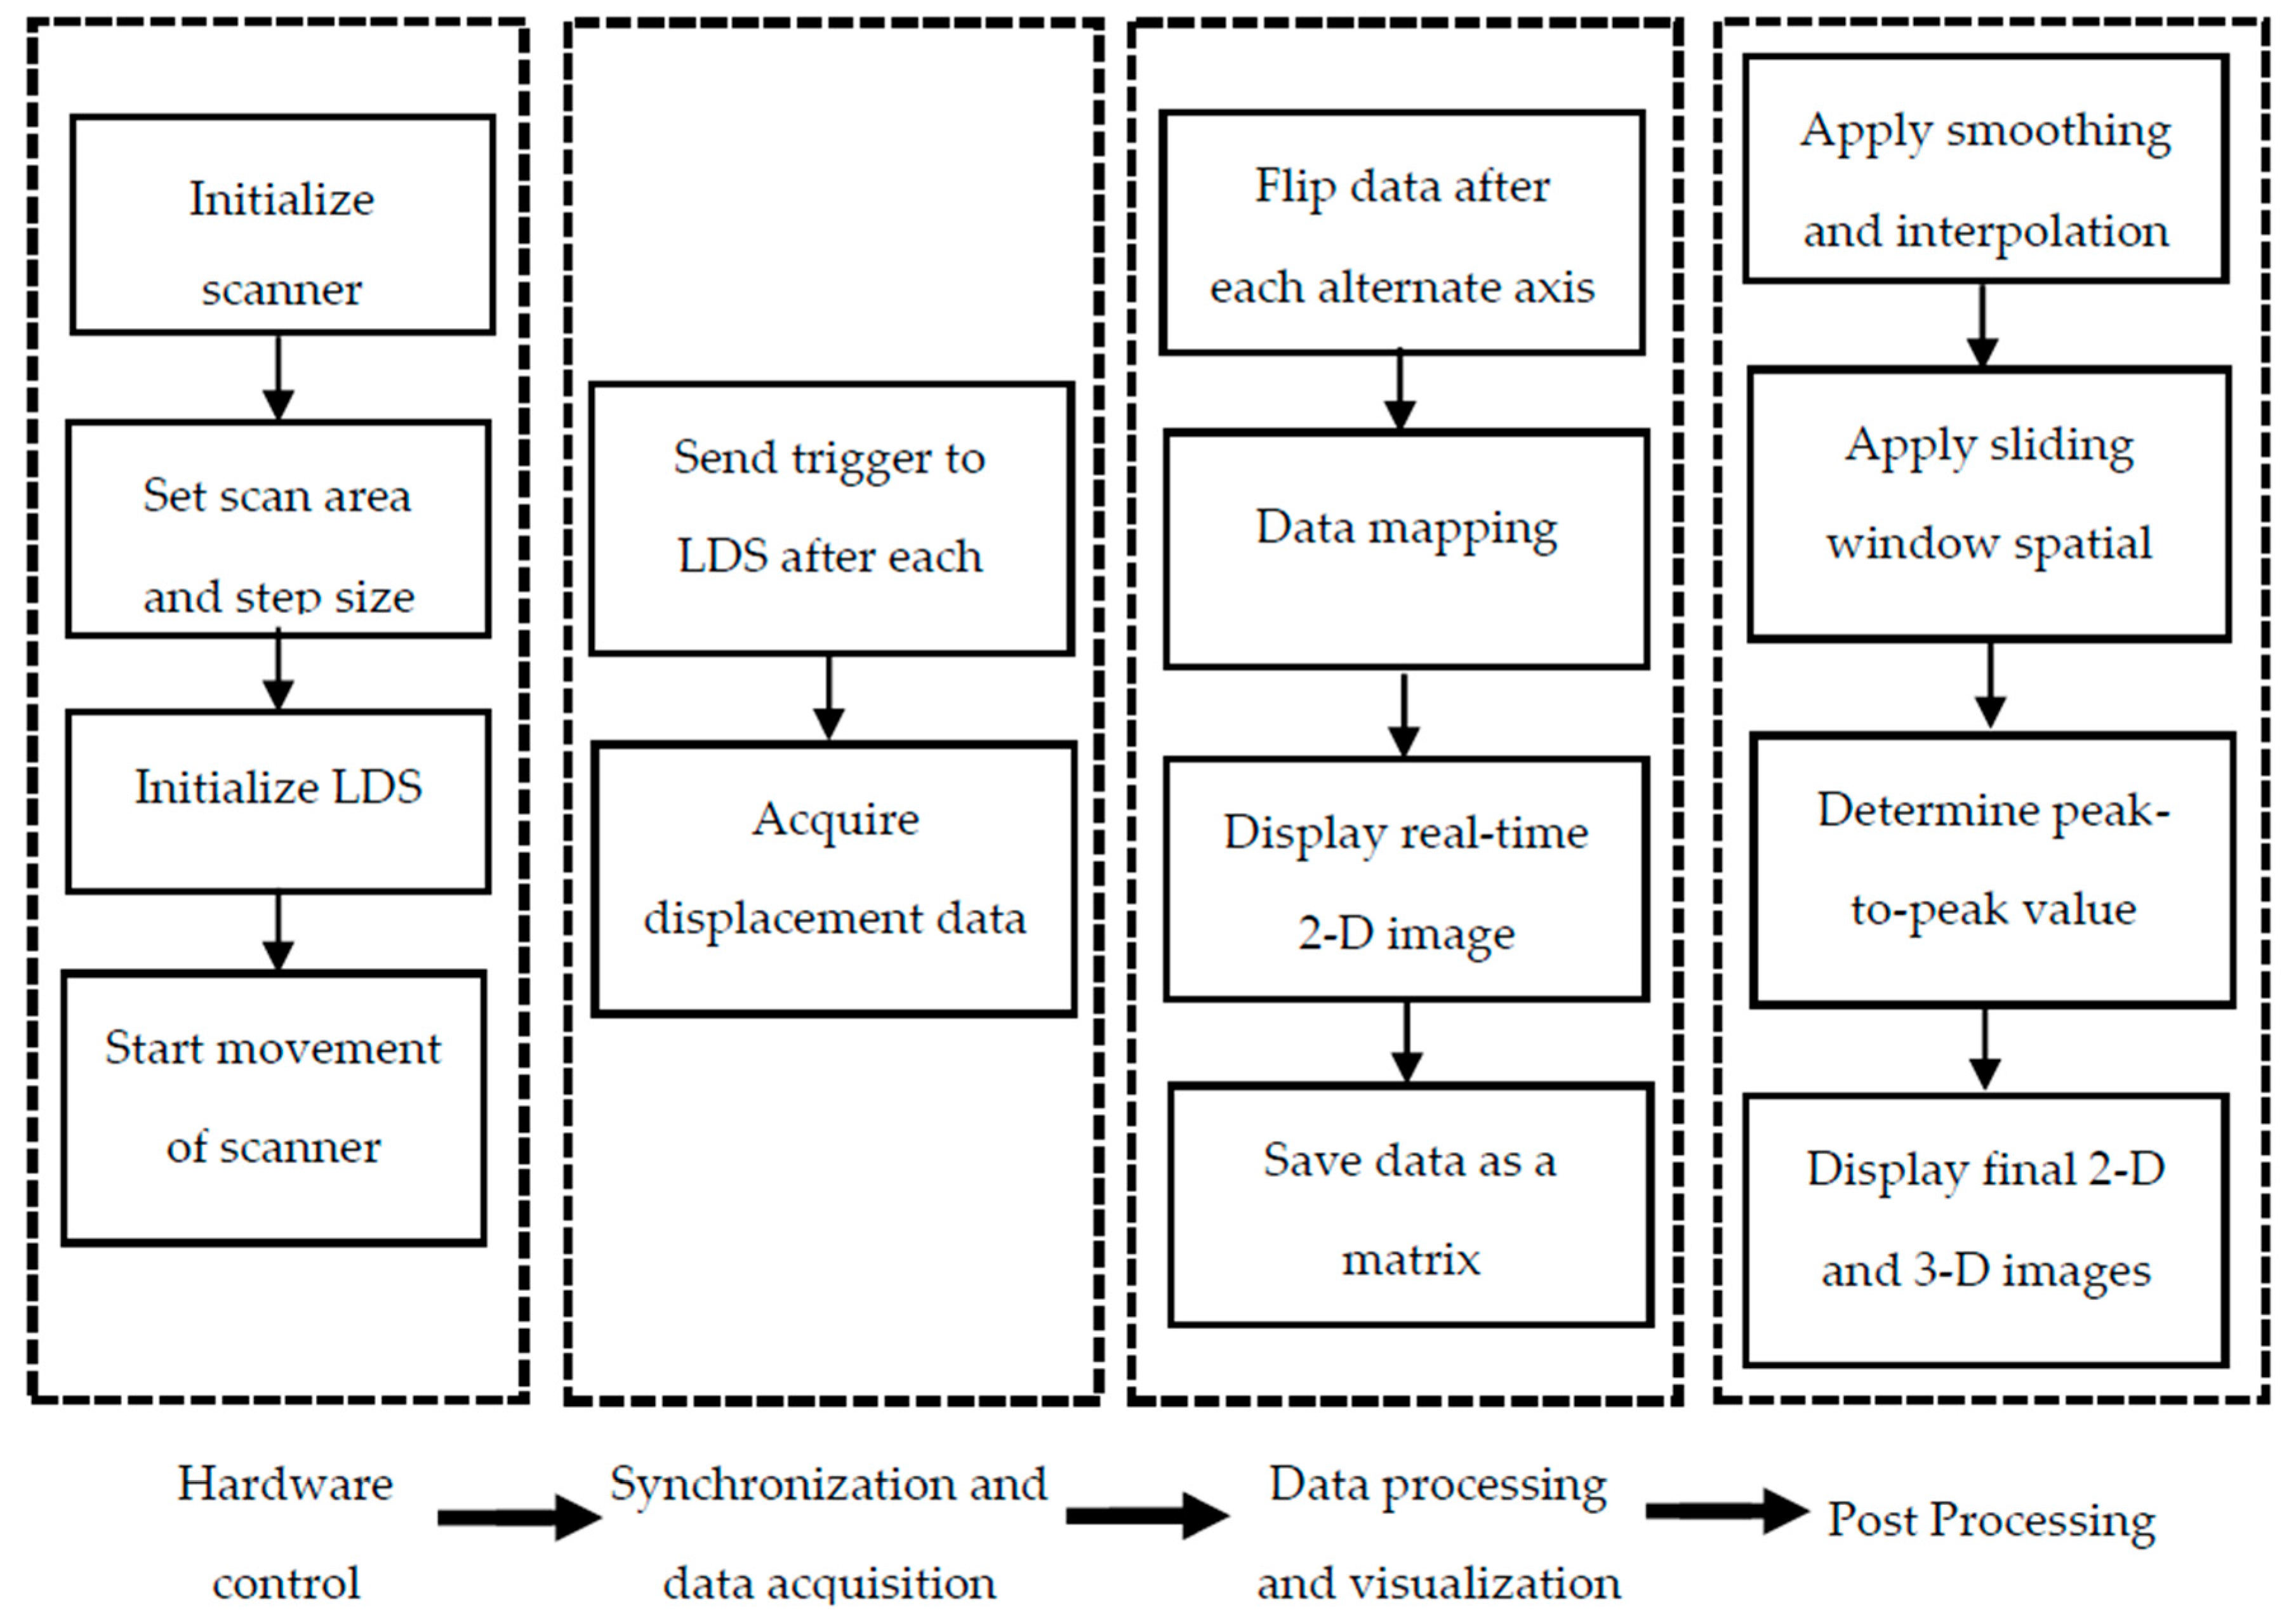
Figure 3.
Picture of metal profile with through cut and its images: (a) top view and (b) side view of the profile; (c) 2-D image and (d) side view of 3-D image.
Figure 3.
Picture of metal profile with through cut and its images: (a) top view and (b) side view of the profile; (c) 2-D image and (d) side view of 3-D image.
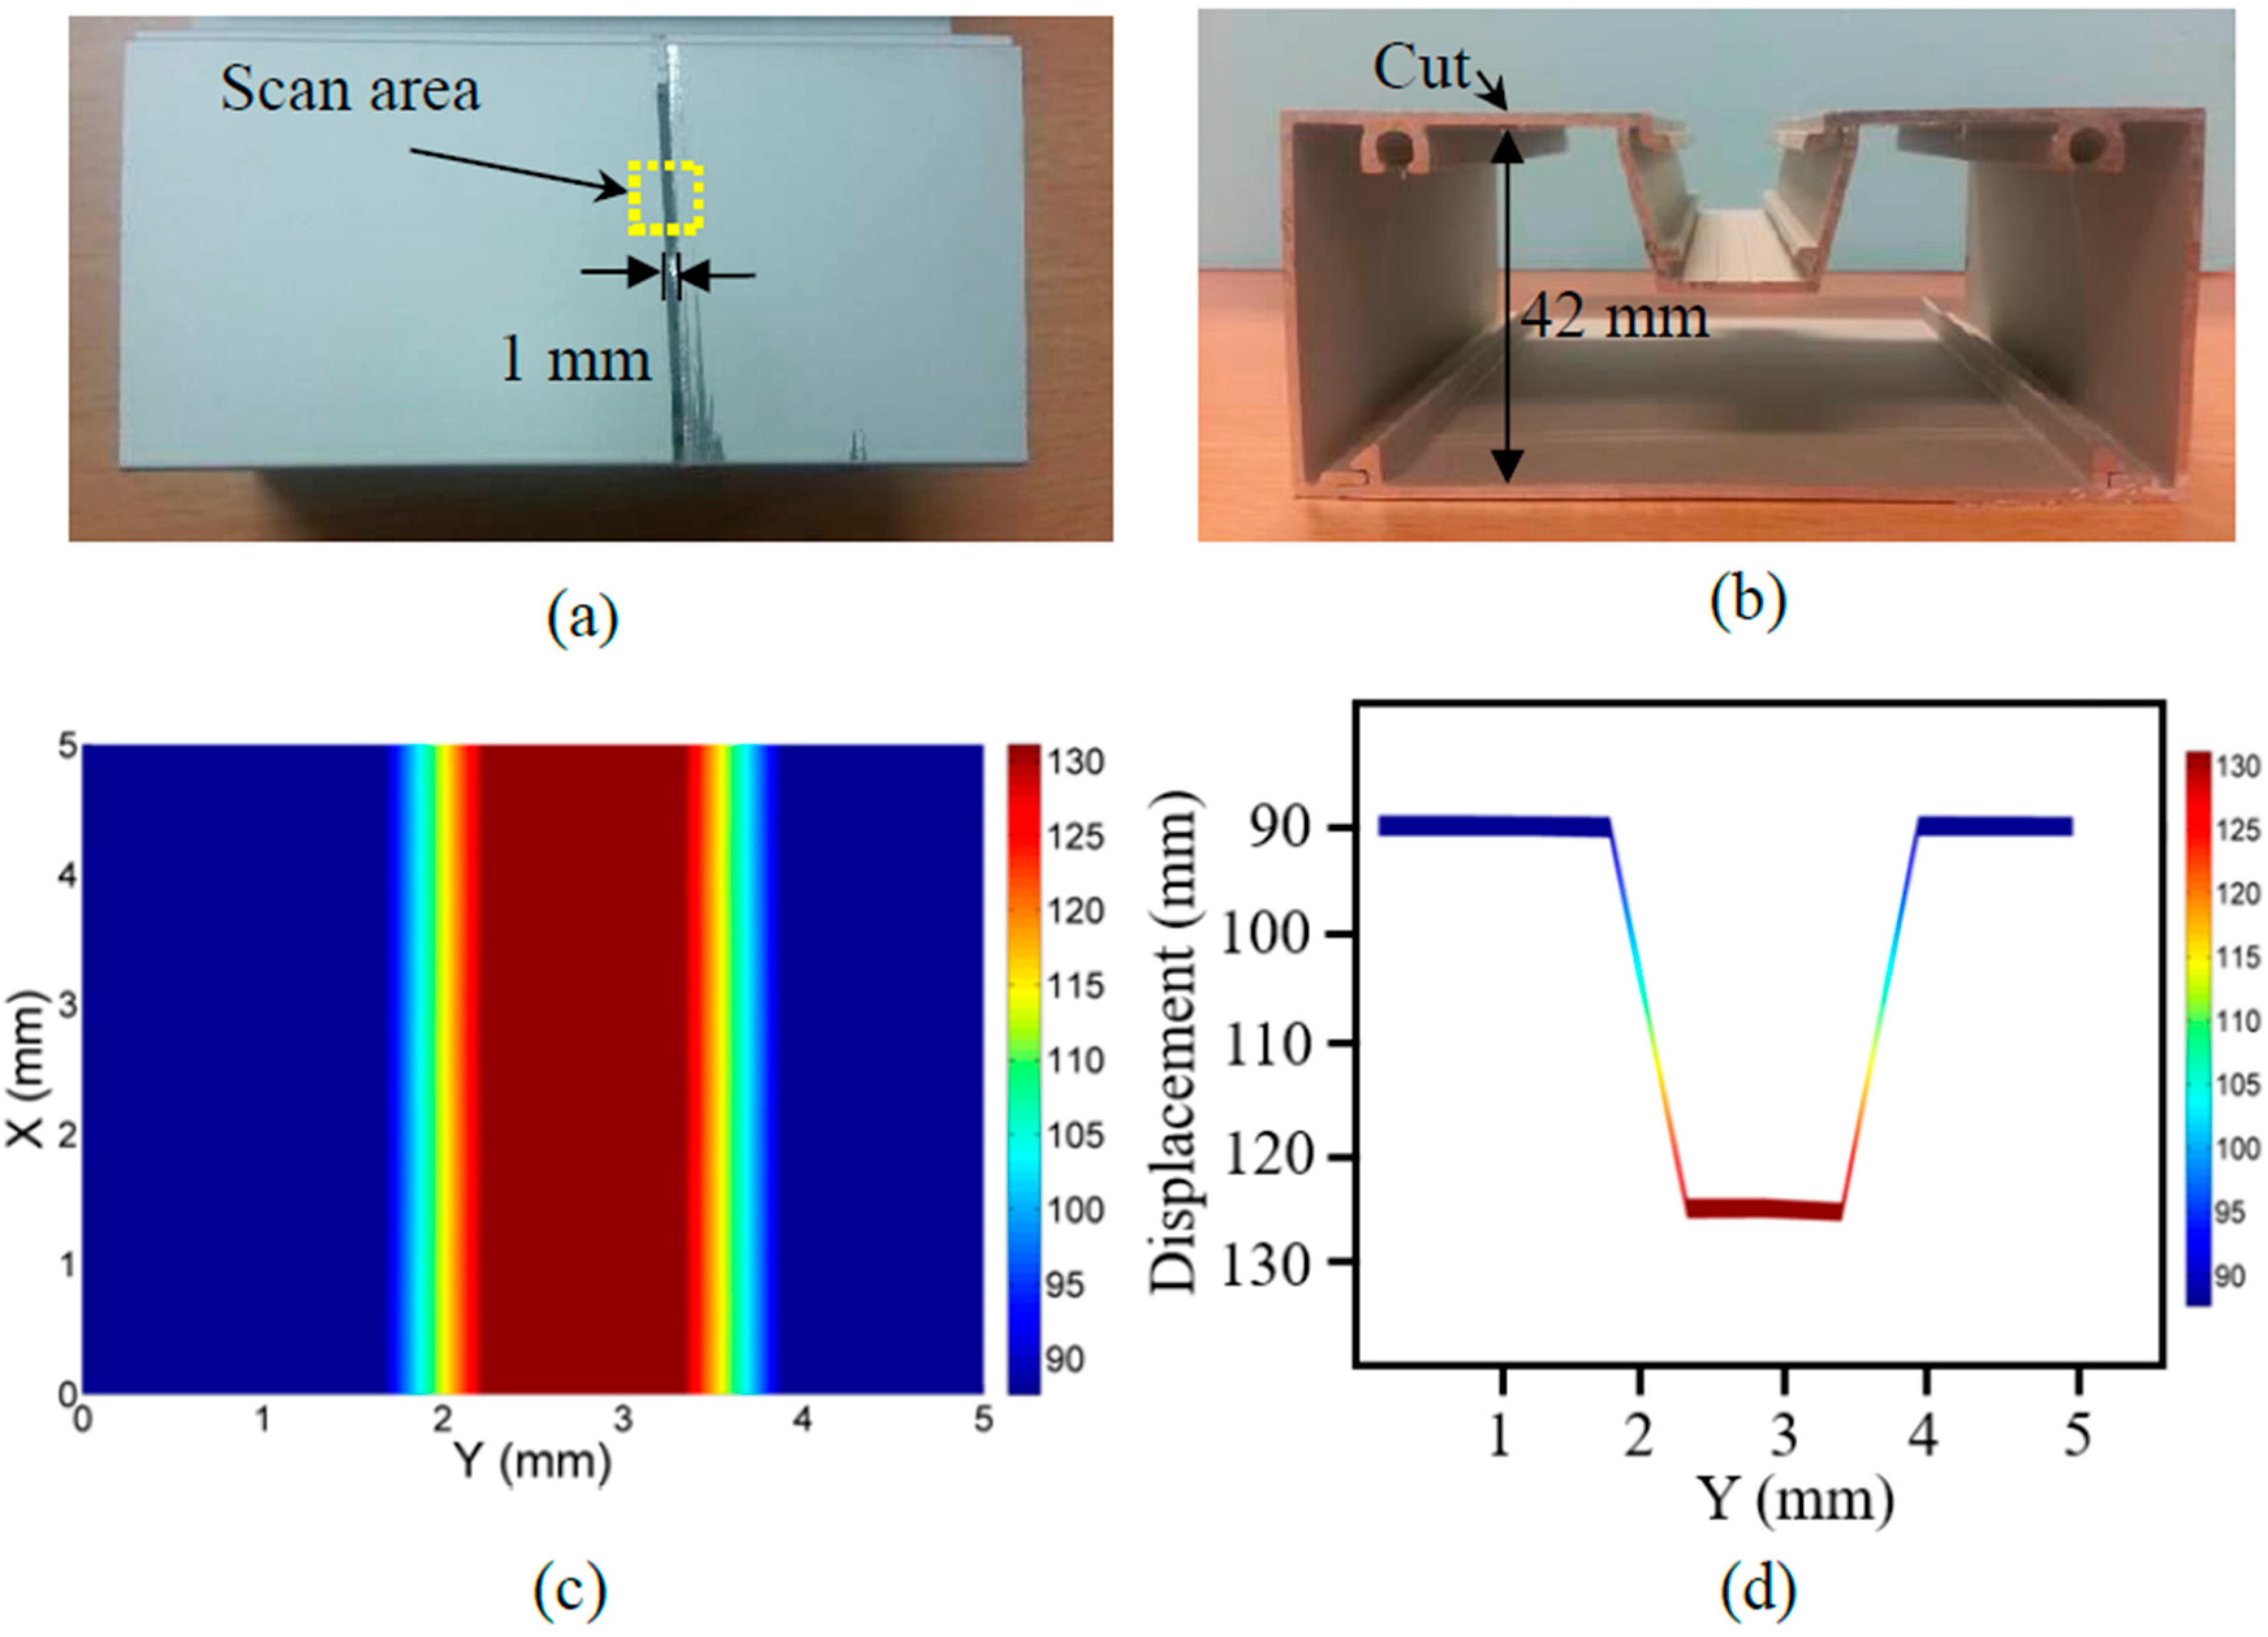
Figure 4.
Picture of the profile with the bottom plate covered by paper sheet and moved to be: (a) parallel and (b) tilted to its initial position.
Figure 4.
Picture of the profile with the bottom plate covered by paper sheet and moved to be: (a) parallel and (b) tilted to its initial position.
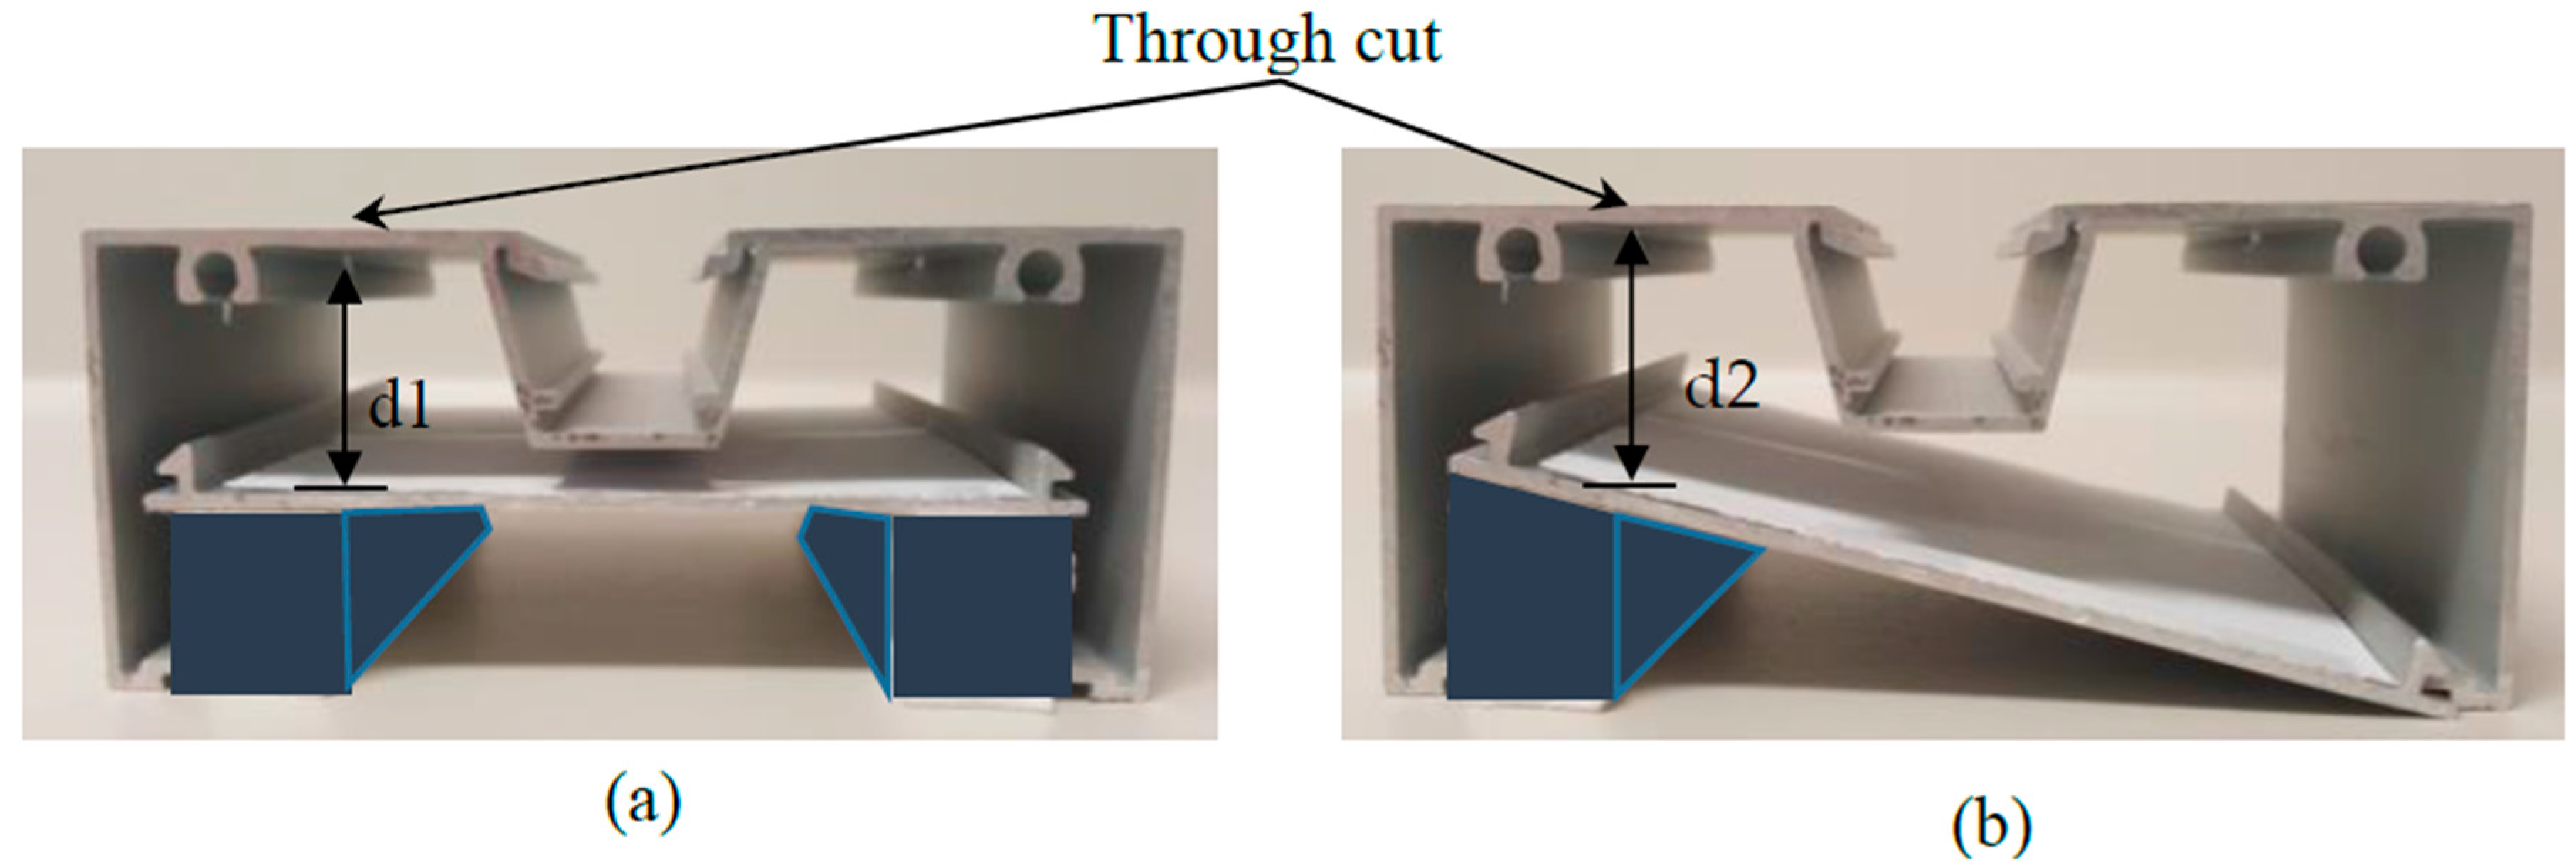
Figure 5.
2-D images (left) and side view of 3-D images (right) of the profile obtained through the cut for the exposed and covered bottom plate at two distances d1: (a) exposed and 32 mm; (b) exposed and 21.5 mm; (c) covered by the paper sheet and 32 mm; and (d) covered by the paper sheet and 21.5 mm.

Figure 6.
2-D images (left) and side view of 3-D images (right) of the profile through the cut for the exposed and covered bottom plate at two distances d2: (a) exposed and 32 mm; (b) exposed and 21.5 mm; (c) covered by the paper sheet and 32 mm; and (d) covered by the paper sheet and 21.5 mm.
Figure 6.
2-D images (left) and side view of 3-D images (right) of the profile through the cut for the exposed and covered bottom plate at two distances d2: (a) exposed and 32 mm; (b) exposed and 21.5 mm; (c) covered by the paper sheet and 32 mm; and (d) covered by the paper sheet and 21.5 mm.
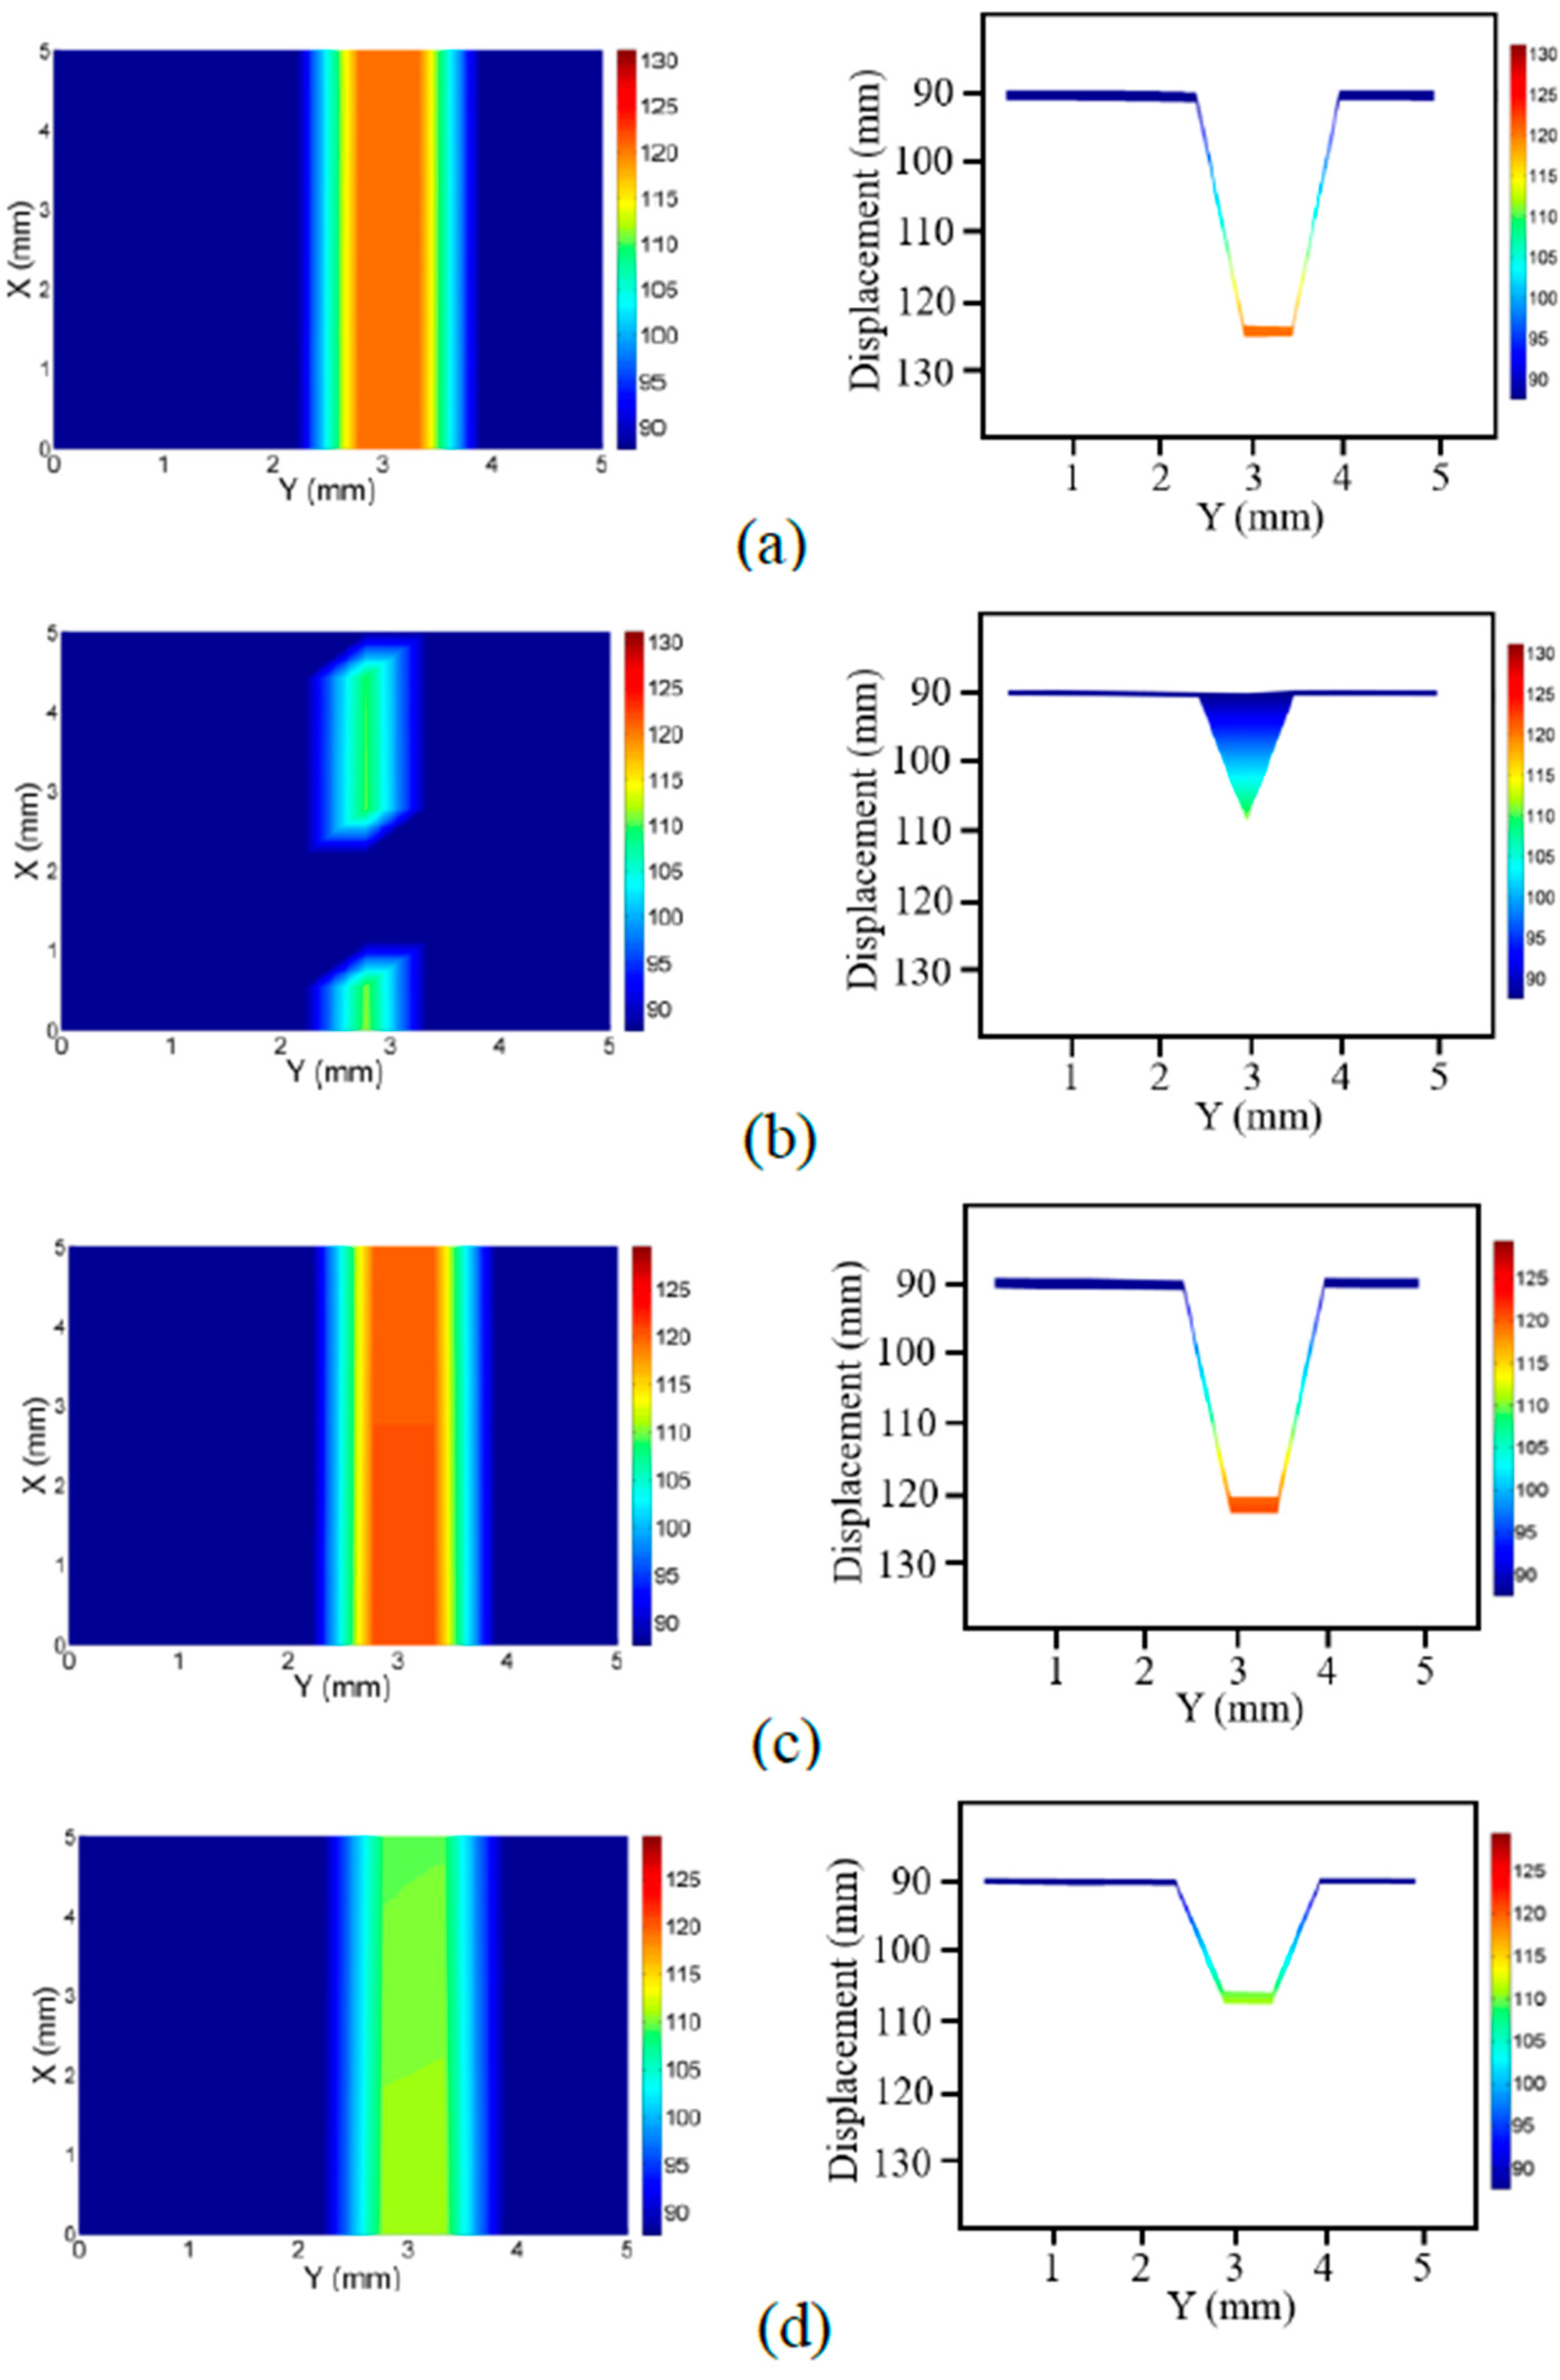
Figure 7.
2-D images (left) and side view of 3-D images (right) of the profile through the cut, and the (a) exposed and (b) covered bottom plate at d2 = 18 mm.
Figure 7.
2-D images (left) and side view of 3-D images (right) of the profile through the cut, and the (a) exposed and (b) covered bottom plate at d2 = 18 mm.
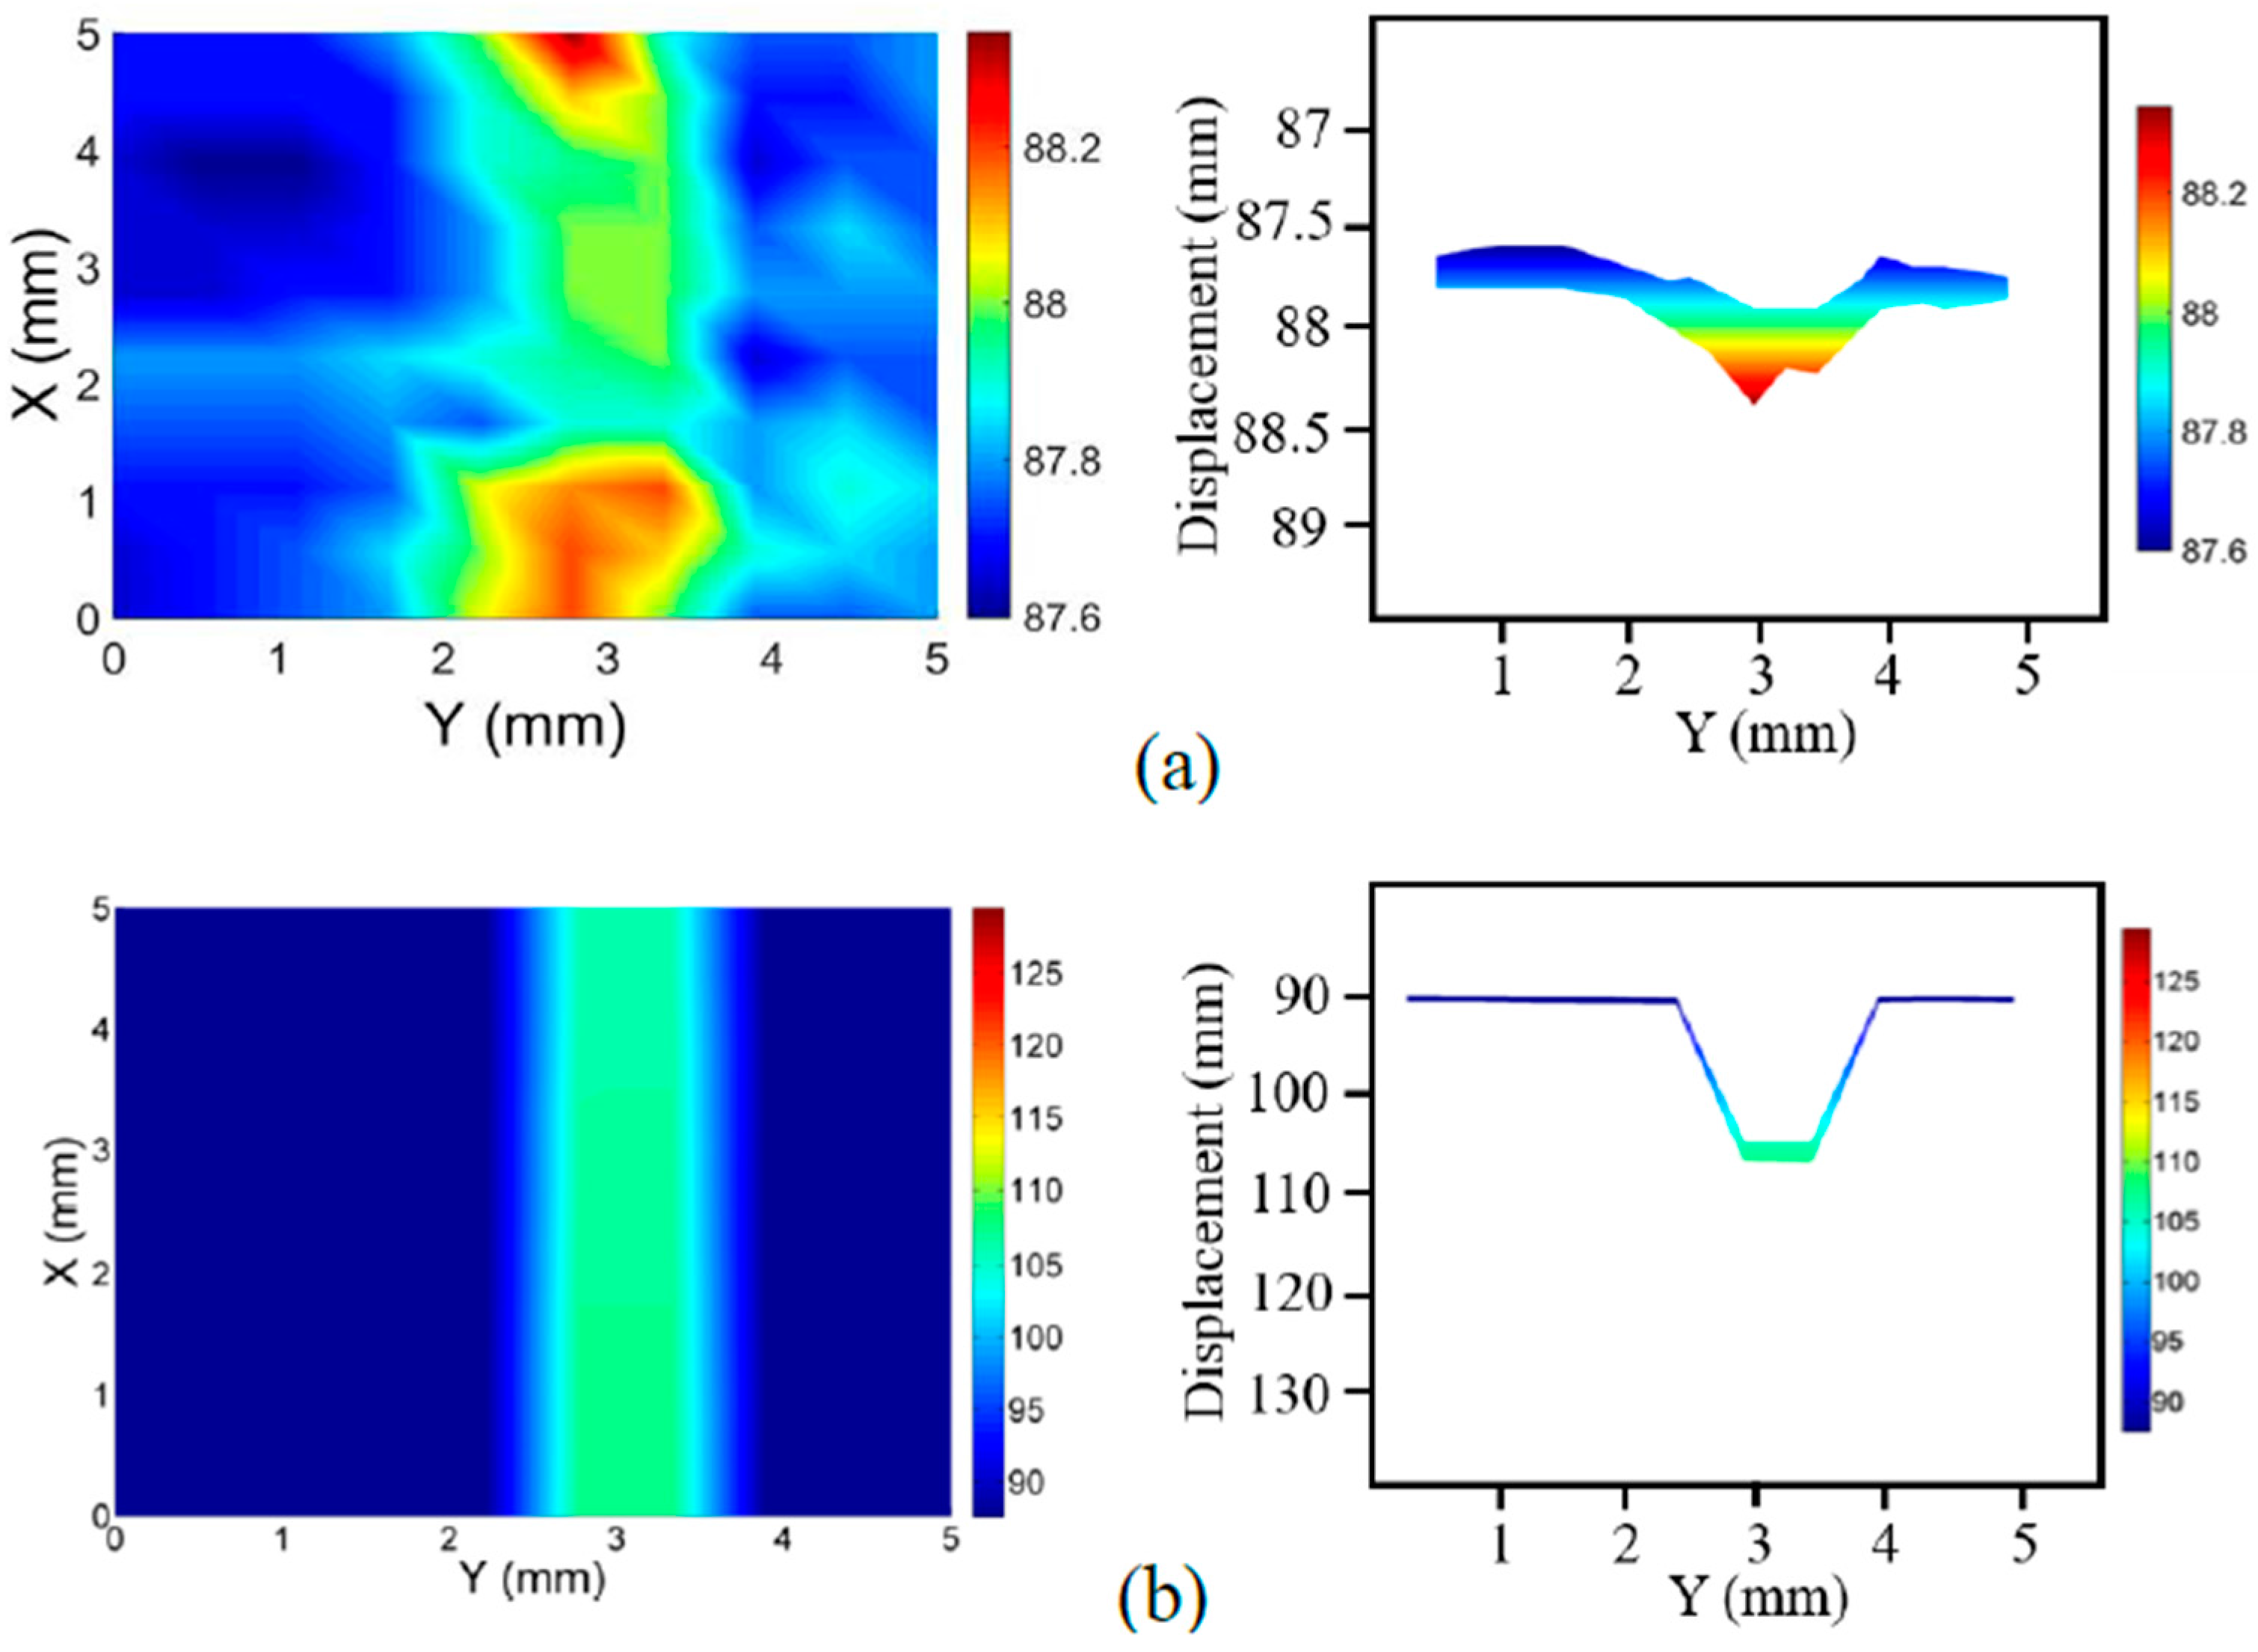
Figure 8.
Picture of measurement system testing a mortar block [24].
Figure 8.
Picture of measurement system testing a mortar block [24].

Figure 9.
Mortar block: (a) picture showing scanned area at locations A and B along 1 mm width crack; 2-D (left) and side view of 3-D images (right) where cracks are represented by colors and displacement values at location (b) A and (c) B [24].
Figure 9.
Mortar block: (a) picture showing scanned area at locations A and B along 1 mm width crack; 2-D (left) and side view of 3-D images (right) where cracks are represented by colors and displacement values at location (b) A and (c) B [24].

Figure 10.
Concrete specimen: (a) picture showing scanned areas over crack and blowholes; 2-D (upper) and side view of 3-D images (lower) where flaws are represented by colors and displacement values for (b) crack; (c) hole 1 and (d) hole 2 [24].
Figure 10.
Concrete specimen: (a) picture showing scanned areas over crack and blowholes; 2-D (upper) and side view of 3-D images (lower) where flaws are represented by colors and displacement values for (b) crack; (c) hole 1 and (d) hole 2 [24].
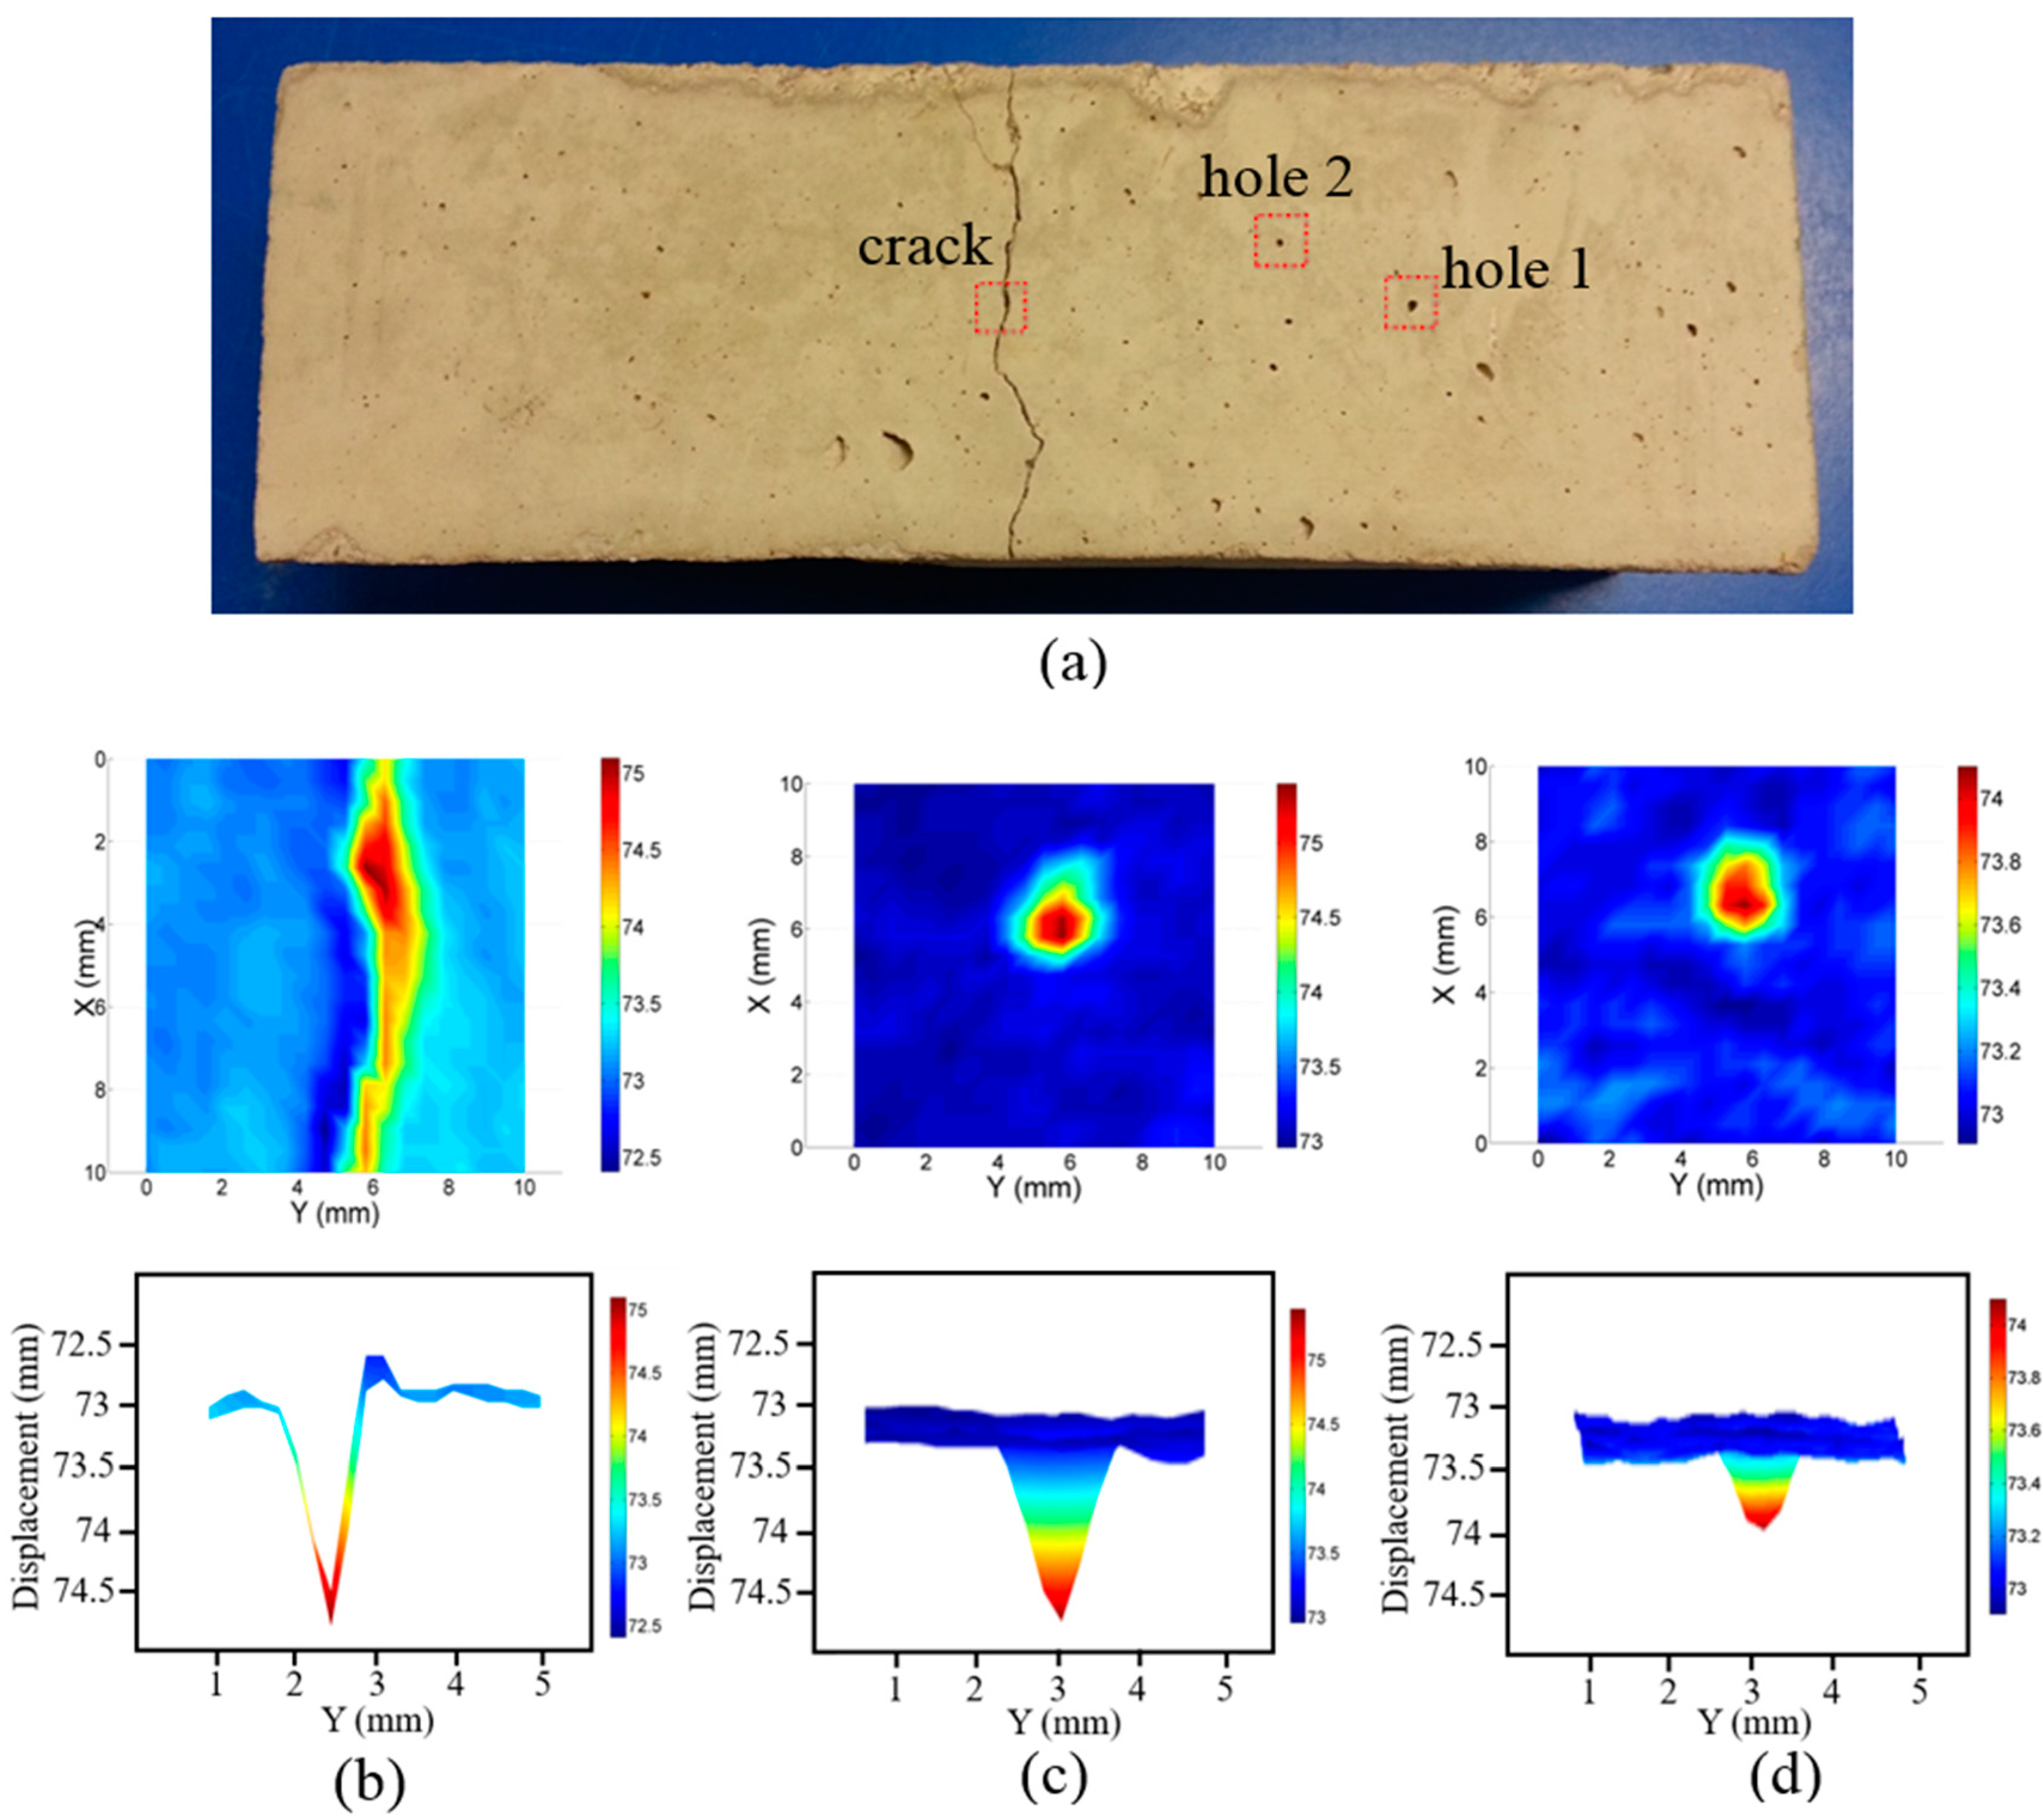
Figure 11.
Cylindrical concrete specimen: (a) picture showing scanned area; (b) 2-D (upper) and side view of 3-D image (lower) where profile and crack are represented by colors and displacement values.
Figure 11.
Cylindrical concrete specimen: (a) picture showing scanned area; (b) 2-D (upper) and side view of 3-D image (lower) where profile and crack are represented by colors and displacement values.
© 2017 by the authors. Licensee MDPI, Basel, Switzerland. This article is an open access article distributed under the terms and conditions of the Creative Commons Attribution (CC BY) license (http://creativecommons.org/licenses/by/4.0/).
Share and Cite
MDPI and ACS Style
Giri, P.; Kharkovsky, S.; Samali, B. Inspection of Metal and Concrete Specimens Using Imaging System with Laser Displacement Sensor. Electronics 2017, 6, 36. https://doi.org/10.3390/electronics6020036
AMA Style
Giri P, Kharkovsky S, Samali B. Inspection of Metal and Concrete Specimens Using Imaging System with Laser Displacement Sensor. Electronics. 2017; 6(2):36. https://doi.org/10.3390/electronics6020036
Chicago/Turabian StyleGiri, Paritosh, Sergey Kharkovsky, and Bijan Samali. 2017. "Inspection of Metal and Concrete Specimens Using Imaging System with Laser Displacement Sensor" Electronics 6, no. 2: 36. https://doi.org/10.3390/electronics6020036
Note that from the first issue of 2016, this journal uses article numbers instead of page numbers. See further details here.