Fractional Calculus Based FDTD Modeling of Layered Biological Media Exposure to Wideband Electromagnetic Pulses
by
 ,
,
Luciano Mescia
1,*,† ,
,
Pietro Bia
2,†,
Michele Alessandro Chiapperino
1,† and
Diego Caratelli
3,4,† 1
Department of Electrical and Information Engineering, Politecnico di Bari, via E. Orabona, 4-70125 Bari, Italy
2
EmTeSys srl, via Beata Elia di S.Clemente, 223-70122 Bari, Italy
3
The Antenna Company, High Tech Campus 41, 5656 AE Eindhoven, The Netherlands
4
Institute of Cybernetics, Tomsk Polytechnic University, 84/3 Sovetskaya Street, 634050 Tomsk, Russia
*
Author to whom correspondence should be addressed.
†
These authors contributed equally to this work.
Electronics 2017, 6(4), 106; https://doi.org/10.3390/electronics6040106
Submission received: 12 October 2017
/
Revised: 17 November 2017
/
Accepted: 22 November 2017
/
Published: 29 November 2017
Abstract
:Electromagnetic fields are involved in several therapeutic and diagnostic applications such as hyperthermia and electroporation. For these applications, pulsed electric fields (PEFs) and transient phenomena are playing a key role for understanding the biological response due to the exposure to non-ionizing wideband pulses. To this end, the PEF propagation in the six-layered planar structure modeling the human head has been studied. The electromagnetic field and the specific absorption rate (SAR) have been calculated through an accurate finite-difference time-domain (FDTD) dispersive modeling based on the fractional derivative operator. The temperature rise inside the tissues due to the electromagnetic field exposure has been evaluated using both the non-thermoregulated and thermoregulated Gagge’s two-node models. Moreover, additional parametric studies have been carried out with the aim to investigate the thermal response by changing the amplitude and duration of the electric pulses.
1. Introduction
The modeling of electromagnetic field propagation through dispersive materials is a subject of increasing research activities since these dielectric media are found in a growing number of applications [1,2,3,4,5,6,7]. In particular, biological tissues are an important class of dispersive media especially taking into account that their interaction with the electromagnetic fields has a great influence on the behavior of living systems. In fact, the increasing number of power and telecommunication systems leads to human exposure to non-ionizing radiation, causing an increased public concern about the potential health hazards [8,9,10]. On the other hand, biological tissues are involved in a variety of therapeutic and diagnostic applications of electromagnetic fields such as hyperthermia, electroporation and the treatment of specific diseases [11,12,13,14,15].
Pulsed electric fields and transient phenomena are playing a key role in understanding the biological response to electromagnetic field exposure. As a result, the development of theoretical models and computational techniques describing the interaction between pulsed electric field (PEF) and dispersive materials is an invaluable research activity to increase the knowledge of the electromagnetic field distribution inside biological tissues, as well as to impose the development of specific therapeutic approaches. In fact, the efficiency of PEF therapies and treatments strongly depends on the electric field strength, the duration of the applied field, the shape of the electric pulse, the polarity and the number of intervals between pulses [12,13,16,17,18].
Generally, accurate modeling of the nanosecond PEF propagation inside biological tissues needs to account for the effects of dielectric relaxation. As revealed by a number of experiments, the dielectric response of a broad variety of biological media cannot be described by a simple exponential expression with a single relaxation time [19]. Therefore, exponential laws based on Debye-type dispersion or the combination of such dispersions cannot fully model the relaxation processes in such materials. As a consequence, a number of empirical dispersion functions (Cole–Cole, Cole–Davidson, Havriliak–Negami, Raicu) have been proposed to fit such types of dielectric spectra.
The finite-difference time-domain (FDTD) method has been widely used in electromagnetic modeling due to its straightforward implementation and its ability to manage a broad range of exposure conditions [20,21]. Since Cole–Cole, Cole–Davidson, Havriliak–Negami and Raicu dispersion functions include fractional powers of angular frequency , mathematical models adequately representing this kind of response have to be incorporated into FDTD simulators. Recently, the authors have proposed a novel FDTD formulation based on the Riemann–Liouville theory of fractional differentiation where the fractional operator is directly approximated using finite differences [22,23,24,25,26]. The reflectance, transmittance, absorbance and penetration depth were computed and compared with the corresponding analytical solution in a wideband frequency range.
Considering that common protocols for therapeutic applications of PEF involve the delivering of multiple pulses and taking into account that a high potential drop occurs across the skin, where the electric field is the largest, deleterious thermal damage due to Joule heating can occur. To this aim, the proposed FDTD scheme has been extended to incorporate further physics for evaluating the temperature distribution inside a layered heterogeneous biological system. In particular, a multiphysics model based on the fractional calculus-based FDTD algorithm, bioheat equation and thermoregulated Gagge’s two-node model [27] has been developed. As a test case, a six-layered planar structure modeling the human head and consisting of air, skin, fat, bone, dura, cerebro-spinal fluid (CSF) and brain was taken into account [28]. The computation of the electromagnetic field, power density and specific absorption rate (SAR), as well as the temperature rise inside the tissues when exposed to an incident plane wave was performed. Moreover, the temperature profiles with and without thermoregulation phenomenon have been calculated and compared. In particular, they have been evaluated by changing electric parameters such as the amplitude and duration of the electric pulses.
2. Mathematical Formulation
2.1. Complex Permittivity
The dielectric properties of biological tissues result from the interaction of electromagnetic energy with the tissue constituents at the cellular and molecular level. As a result, the dielectric permittivity and conductivity values vary from tissue to tissue and depend on frequency. In order to model realistic electromagnetic wave propagation over a broad frequency range, an exhaustive and reliable analytic model of dielectrics is needed. To this aim, the relative permittivity, , of the biological tissues exhibiting an N-th order relaxation process has been modeled by using the general Havriliak-Negami (HN) relationship [29,30]:
where and are the relaxation time and the amplitude change of the i-th relaxation process, respectively, N is the number of dielectric relaxation processes, is the relative permittivity at , is the static ionic conductivity, are heuristically-derived fitting parameters, , and is the free space permittivity.
To test the developed numerical code, a planar layered system is considered. It consists of skin, fat, bone, dura, CSF and brain, and a schematic diagram is shown in Figure 1. This structure well describes the human head locally and does not require extensive computational efforts. In fact, considering the occurrence of tissues having small thickness, the existing anatomical computer models can provide reliable results if huge computational resources are available. Despite its simplicity, it was proven that this simple planar model produces SAR values very close to those obtained by using more complex ones [31]. Moreover, it has been demonstrated that the developed fractional derivative-based FDTD scheme allows an accurate space-time evaluation of electromagnetic field profiles in a broad frequency range [22,23,24,25,26].
The reflection and transmission of a electromagnetic wave at the tissue interface depends on the frequency, permittivity and conductivity of the involved biological materials. Tissues are very inhomogeneous materials, and the fluid content of the material generates large differences in their electric properties. Dielectric data of several bulk tissues in a wide frequency range have been reported in the literature [32,33]. Therefore, to estimate the dielectric properties in a desired frequency range, these experimental results have been fitted using (1) and minimizing the error function, , by means of a dedicated numerical procedure based on the enhanced weighted quantum particle swarm optimization (EWQPSO) [34]:
In Equation (2), is the maximum tolerable error, is the measured permittivity and represents the general HN dielectric response.
2.2. Electromagnetic Analysis
In order to evaluate the electromagnetic field propagation inside the layered structure involving HN dielectric materials, the FDTD scheme proposed in [22,23,24,25,26] has been used. In particular, it implements a more general series representation of the Riemann–Liouville fractional derivative operator, and it takes into account multiple relaxation times, as well as ohmic losses occurring in common biological media displaying different dispersion mechanisms. Dedicated uniaxial perfectly matched layer boundary conditions have been also derived and implemented in combination with the basic time-marching scheme. Moreover, the conventional total field/scattered field approach and the Courant stability criterion are considered. Thus, applying a second order accurate finite-difference scheme and the procedure detailed in [22,23,24,25,26] for the finite-difference discretization, the FDTD update equations for the electric field, E, the magnetic field H and the auxiliary displacement current density, , can be calculated within the HN media and UPML regions. In particular, by considering the standard Cartesian Yee cell grid for the FDTD scheme and applying the central difference discretization, a second order truncation error is achieved.
2.3. Bioheat Equation with Thermoregulation
It is well known that the interaction of an electromagnetic field with living biological tissues generates an increase of the local temperature [31]. For this reason, it is important to know the amplitude of the electromagnetic wave propagating inside the considered biological structure to evaluate the temperature rise. The electromagnetic power transferred inside the biological tissue is related to the SAR, and it is defined as follows:
where and are the m-th tissue conductivity and density, respectively, and E is the electric field at the generic z coordinate.
The temperature distribution inside each tissue exposed to radio frequency (RF) power can be evaluated solving the Pennes bioheat equation. It is based on the classical Fourier law of heat conduction, and it incorporates the effects of metabolism and blood perfusion on the energy balance within tissue in terms of distributed heat sinks or sources. The generalized 1D Pennes equation for the m-th tissue can be written as [35]:
where T is the tissue temperature, is the time-dependent temperature of the arterial blood, is the blood density, is the blood specific heat, is the blood perfusion rate, is the metabolic heat generation rate, and are the thermal conductivity and the specific heat of the m-th tissue, respectively.
The Pennes model does not take into account the thermoregulation mechanisms of the human body such as shivering, regulatory sweating and vasomotion affecting the thermal response of the human body. In order to overcome this drawback and to calculate a more accurate temperature field, a thermoregulated bioheat model combining Pennes’ equation and Gagge’s two-node model has been coupled to the fractional calculus-based FDTD code. In this approach, the layered structure, called the outer layer, is sandwiched between the inner layer, called the core, and the surrounding air (see Figure 1).
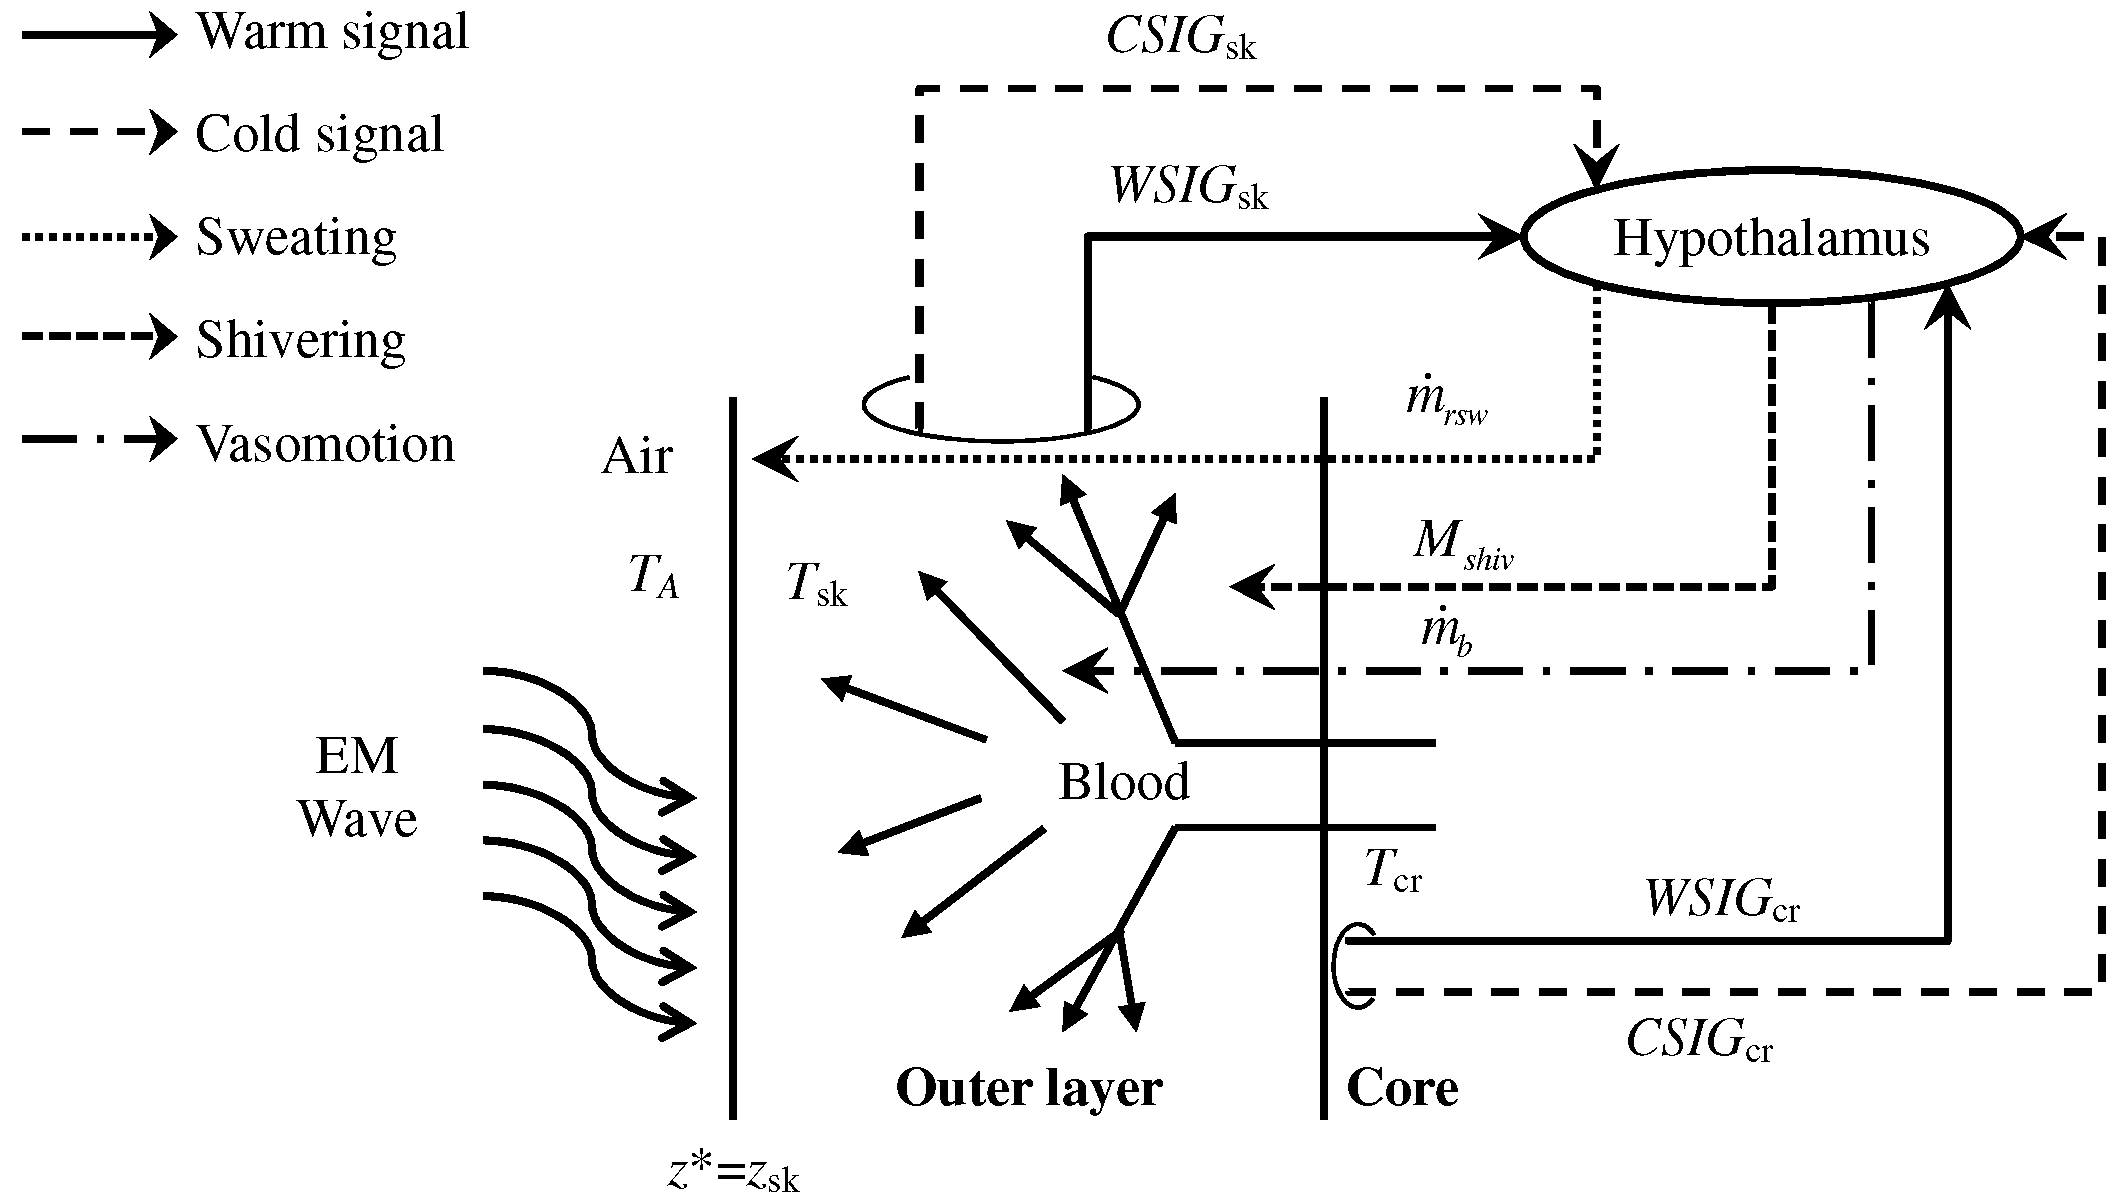
A part of the heat produced in the core by metabolic and perfusion rates (when it is treated as the source) is lost via conduction and mass transfer to the outer layer. A portion of this energy may be expended as external work done by the muscles and as dispersion at the skin/air interface. The rest of the core energy is stored, and it causes temperature to rise. All these phenomena are controlled by hypothalamus via a complex thermoregulation mechanism. In particular, the warm and cold receptors located in the core and outer layers send signals to the hypothalamus which, depending on the integration of such stimuli, suitably activates the vasomotion, shivering and regulatory sweating (see Figure 2). By using this concept, Gagge’s two-node mathematical model is based on the energy balance equation involving the outer and inner layers. In particular, the energy balance equation for the core is [27]:
where is the fraction of the body mass concentrated in the skin, is the body density, is the specific heat of the body [36], is the core temperature, is the remaining metabolic coefficient, is the effective conductance between the core and outer layer, is the rate of blood flow due to the vasomotion of the blood vessels caused by the cold/warm thermal conditions and is the characteristic length of the body where is the volume of the human body and is the nude body surface area given by the DuBois formula [37]:
where m and l are the body mass and height, respectively. Moreover, taking into account that the external mechanical efficiency is insignificant in many human thermal response applications, the remaining metabolic coefficient can be defined as [38]:
where is the air temperature and is the water vapor pressure in the air given by [39]:
Finally, the parameter can be defined as [40]:
Discretizing (5) gives:
which is used as thermal boundary condition for the core in Pennes’ equation.
The thermal boundary condition at the outer layer surface , being the z coordinate of the skin/air interface, is:
where is the thermal conductivity of the skin, is the convective heat transfer coefficient at the air temperature, is the skin emissivity, is the Stefan–Boltzmann constant and is the total skin wettedness. Moreover, considering that only a part of the total skin surface, , is irradiated by the electromagnetic field, the skin temperature is computed using the equation:
where is the temperature evaluated when the electromagnetic field source is applied () and is the temperature for the part of the body not irradiated by the electromagnetic field ().
In Equations (10) and (11), some physiological parameters such as , , , depend on the thermoregulation mechanisms. The metabolic heat production mainly depends on the physical activity of the human body (), as well as it can be increased by shivering against cold () as follows [38]:
where:
In (14), and are the cold signals of the human body for the outer layer and core compartments, respectively, given by [38]:
and:
where and are the neutral outer layer and core temperature, respectively.
Vasomotion of the blood vessels changes both parameters and . In particular, can be calculated using the equation [40]:
where is the warm signal for the core compartments, and it is given by:
The regulatory sweating increases the skin wettedness. In particular, the total skin wettedness is due to both diffusion through the skin () and regulatory sweating () [27]:
where:
and:
In Equation (21), is the heat of water vaporization, is the rate of the sweat production per unit of skin area and is the maximum evaporative potential. The parameter can be estimated by using the equation [40]:
where is the water vapor pressure in the saturated air at the skin temperature given by:
and is the total evaporative resistance between the body and the air. The parameter can be estimated by the following equation [40]:
where:
is the warm signal for the outer layer compartments. In (24), is the warm signal of the body given by:
Moreover, the body temperature, , and the neutral body temperature, , are given by:
3. Numerical Results
In order to validate the fractional calculus-based FDTD model, the electromagnetic field propagation in the six-layered dielectric slab shown in Figure 1 and over a frequency band spanning from to has been simulated. In the simulation, the geometrical and dielectric parameters listed in Table 1 have been considered. The system is irradiated by a plane wave propagating along the z-direction with the electric field linearly polarized along the x-axis. In particular, the excitation signal is a sinusoidally time-modulated Gaussian pulse having the same parameters reported in [22]. The chosen time and spatial steps are and , respectively. Moreover, the time and spatial computational domain are and , respectively. The stability of the proposed FDTD numerical scheme has been tested by following von Neumann’s spectral approach and assuming the harmonic time dependence of the electromagnetic field quantities. At any time step, the instantaneous distributions of the E, H and fields can be Fourier transformed with respect to the space variable z to provide the spectrum of monochromatic plane-wave modes propagating along the computational lattice. In this way, it has been checked that the resulting characteristic polynomial equation has zeros inside the stability circle [20,24].
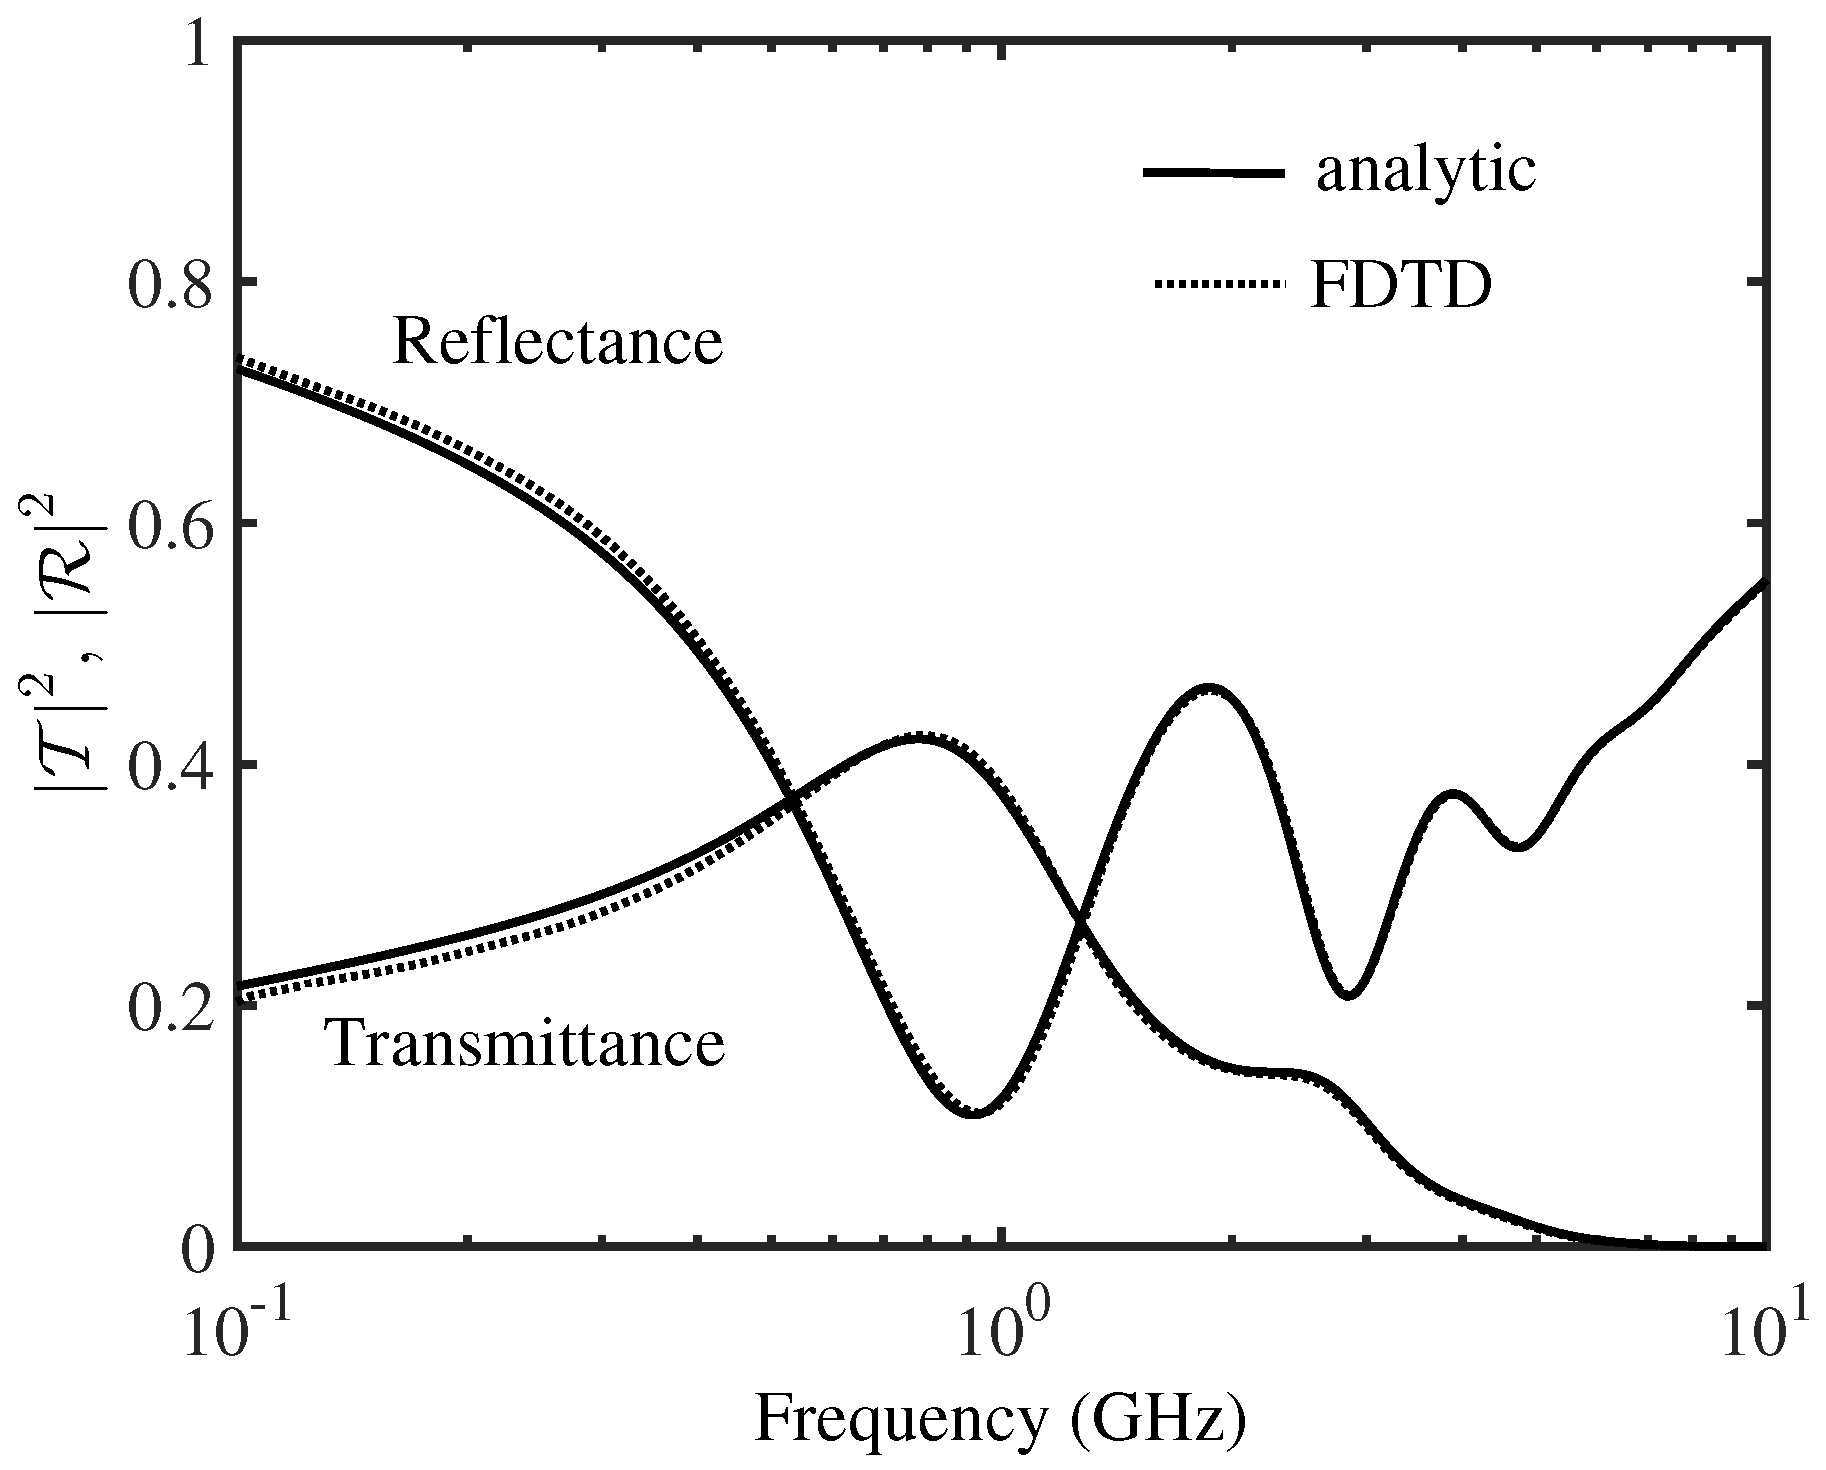
The numerical results given by the FDTD scheme are compared with an analytical frequency-domain technique. In particular, the reflectance and transmittance have been calculated. The transmission coefficient is evaluated as the ratio of the Fourier transform of the electric field computed in two different points, and , across the biological structure,
where E is the amplitude of the electric field.
The frequency-domain behavior of reflectance and transmittance calculated using the developed FDTD and a rigorous fully-analytical technique based on the transfer matrix approach for layered lossy media [41] is illustrated in Figure 3. The excellent agreement with the analytical technique validates the proposed methodology.
The bioheat Equation (4) and the boundary conditions (5) and (11) were discretized using the standard finite difference method in both the spatial and temporal domain. Considering that the temporal evolution of the heat is slower than the electromagnetic field one, the time step used to determine the SAR is not suitable for the heat transfer simulation. To this aim, a new time step has been assigned to solve the bioheat equation. More specifically, to fulfill the constrains due to the numerical stability and accuracy requirements, it has been chosen according to the von Neumann’s condition:
where is the specific heat, is the medium density and is the thermal conductivity. In particular, the spatial and temporal step size considered in the bioheat simulations are and , respectively, as well as the blood temperature is assumed to be . Moreover, the thermal properties of the involved biological tissues are listed in in Table 2 [31]. The temperature rise, , due to the PEF interaction with the biological tissues is calculated as:
where is the steady-state temperature distribution calculated solving the bioheat equation with SAR = 0 and assuming that the core and skin temperatures are and , respectively, and is the temperature calculated with and using the model including the thermoregulation mechanisms. Moreover, in order to quantify the thermoregulation effect, the temperature rise has been calculated as:
where is the temperature evaluated neglecting the thermoregulation mechanisms. The SAR distribution inside the stratified system has been evaluated using (3), where the electric field is computed solving the Maxwell equations.
The proposed model has been validated by comparison with the literature results [42]. In particular, in Table 3 is reported the maximum temperature rise inside the whole head calculated by considering an electromagnetic source with the power equal to at and at . The good agreement between the two models highlights the numerical algorithm’s ability to model the biological media exposure to electromagnetic pulses well.
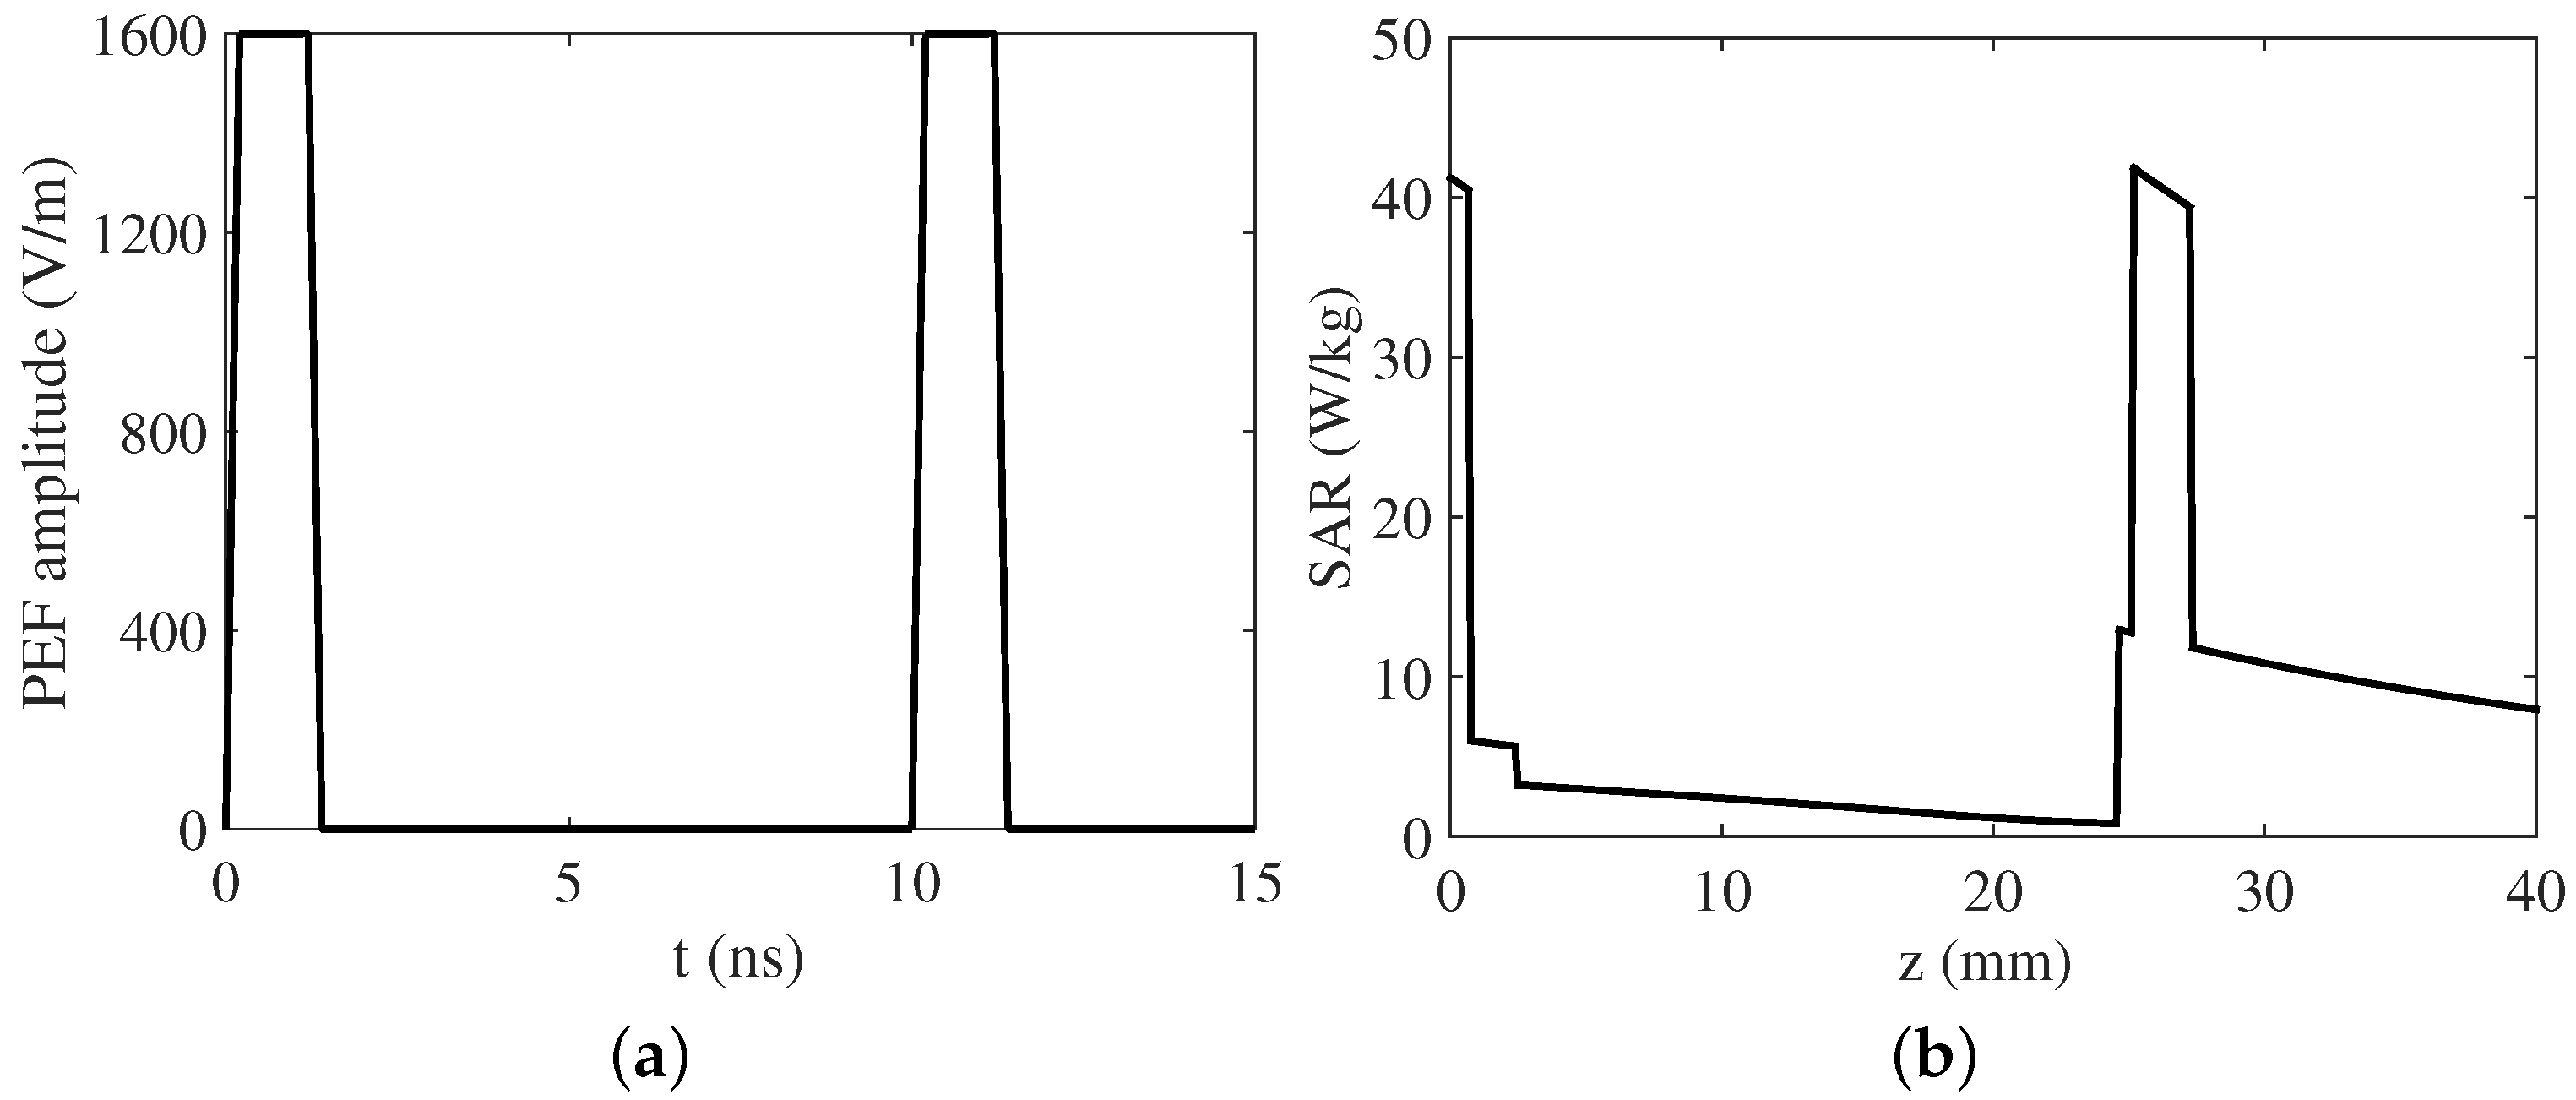
In the following investigations, a PEF burst characterized by a hold time , rise time , repetition time and maximum amplitude has been considered as the source. Figure 4a shows the time evolution of the PEF source by fixing , and Figure 4b illustrates the corresponding spatial distribution of the SAR. The different dielectric losses characterizing the biological tissues result in a non-homogeneous SAR profile. In particular, an higher value of SAR can be noticed inside the biological tissues exhibiting higher losses.
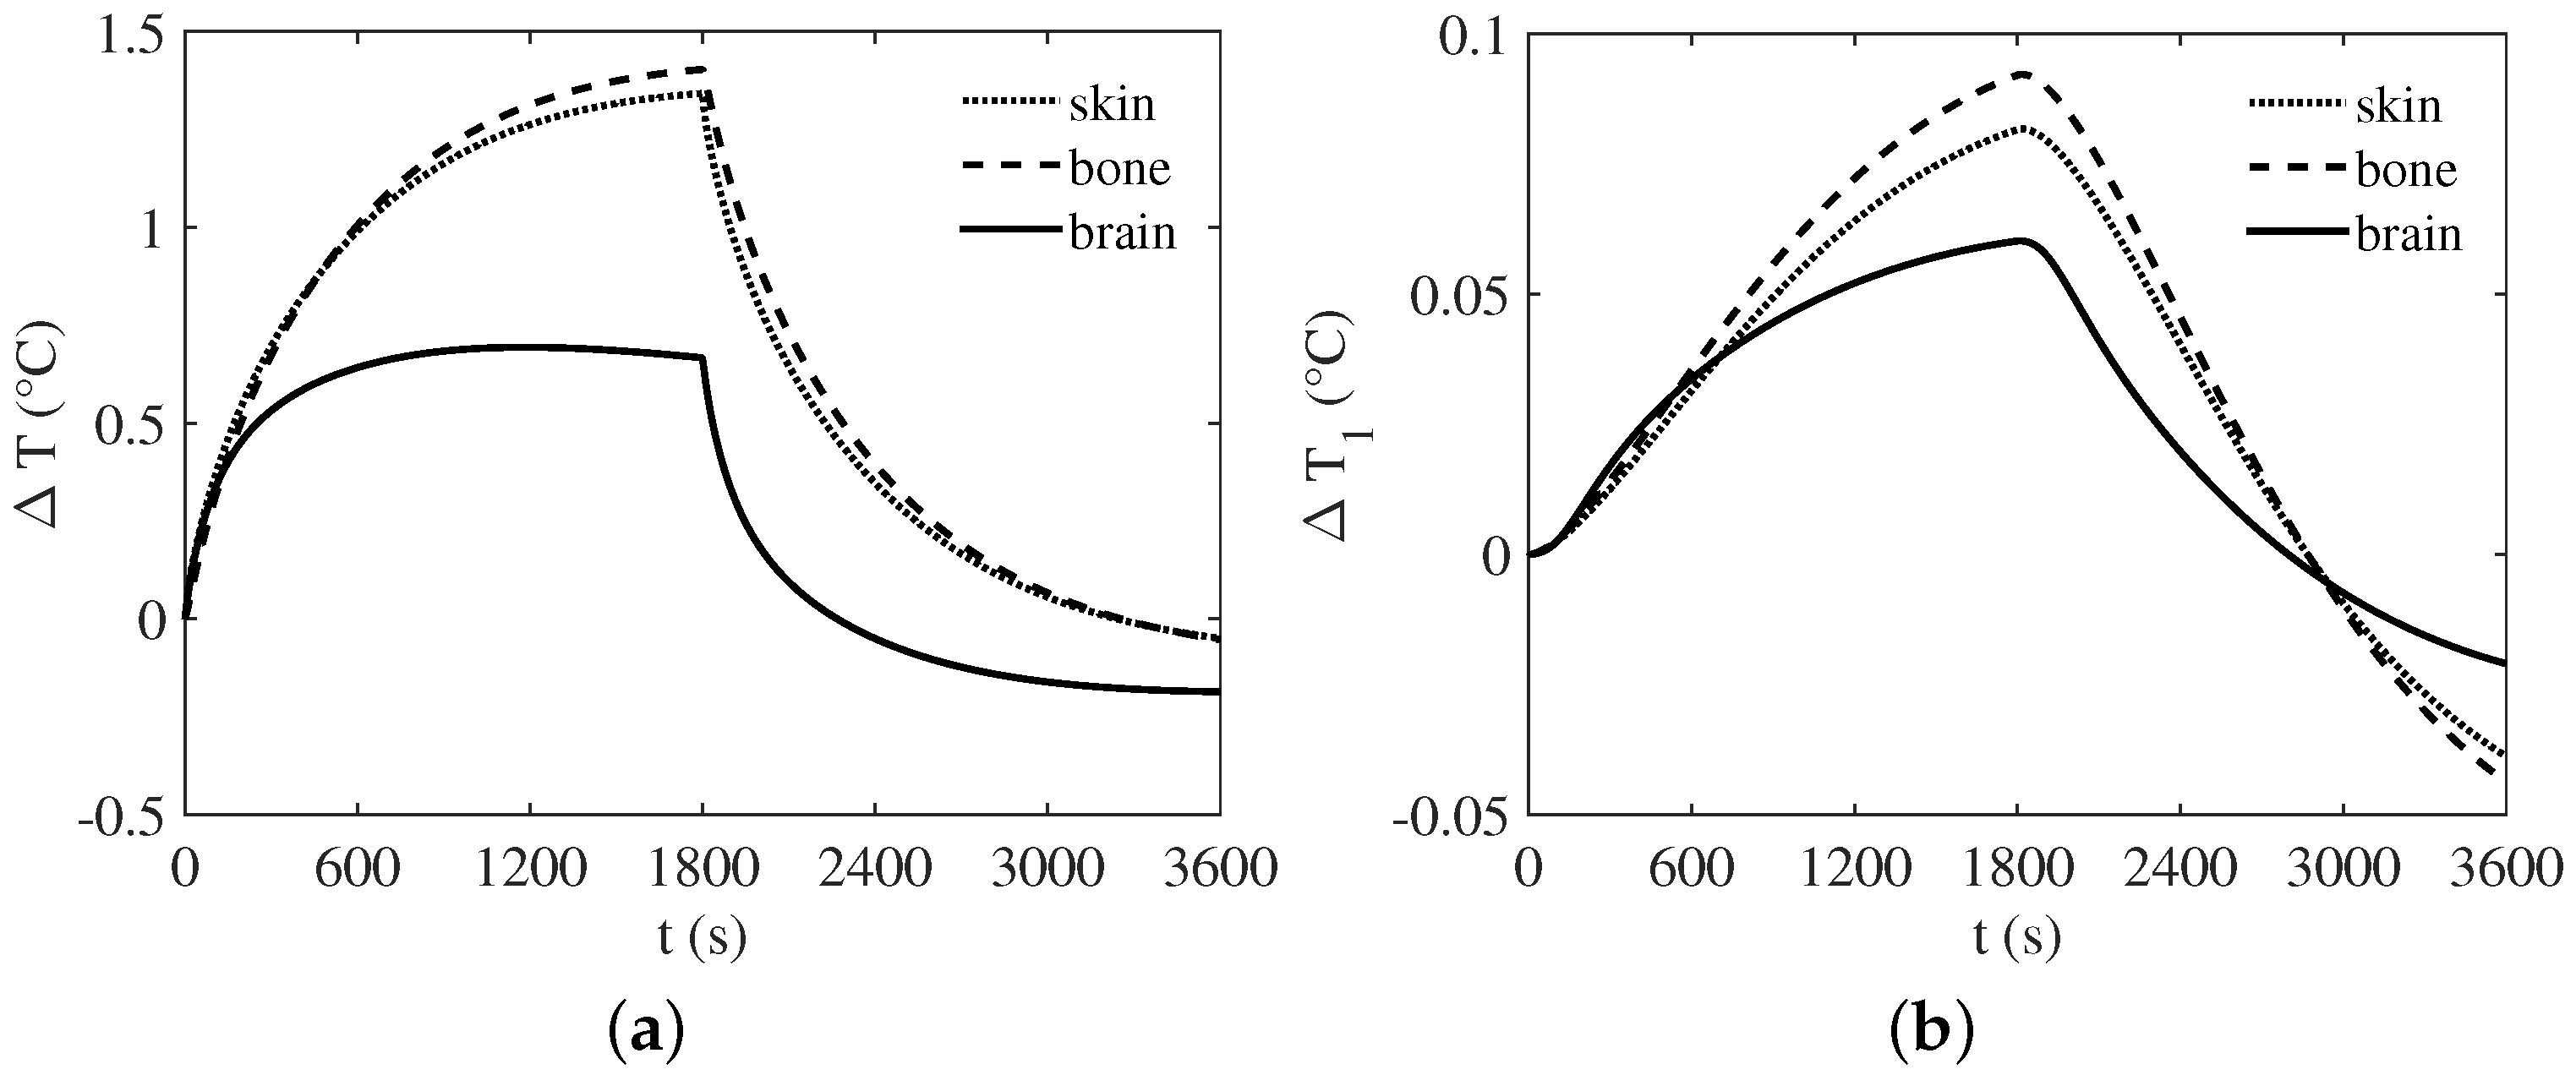
Figure 5a illustrates the increase in temperature versus the time in the skin, bone and brain layers. In the simulations, a PEF exposure of 30 min followed by 30 min without exposure have been used. Moreover, the thermoregulated model and the external temperature equal to are considered. By an inspection of the figure, it can be inferred that, with respect to the skin and bone layers, the brain is more protected by the temperature increase. In fact, the temperature grows more than in the outer layer of the head and around inside the brain. The temperature rise in each biological medium is directly connected to the corresponding thermal properties such as the thermal conductivity and blood perfusion rate. In particular, higher thermal conductivity enhances the thermal diffusion resulting in a lowering of the mean temperature. Meanwhile, higher blood perfusion rate increases the heat exchange with the blood ensuring a more stable temperature around the steady-state value. On the basis of these remarks, it is possible to justify the highest increase in temperature occurring inside the bone layer since it exhibits the lowest values of both the thermal conductivity and blood perfusion rate. Instead, the higher values of such parameters result in a more limited temperature rise in the brain layer. On the other hand, the temperature improvement due to the PEF exposure is mitigated by the thermoregulation process, which reduces the metabolic heating and improves, via vasodilatation, the blood flow, as well as it enables the production of sweat. Moreover, when the sources is turned off, the reduced metabolic activity and the starting of the sweating process allow a temporary temperature reduction below the steady-state value.
Figure 5b highlights the temperature changes due to the model including the thermoregulation mechanisms. It can be noticed that when the PEF signal is turned on, in each biological layer. This means that the temperature rise calculated using the thermoregulated model is lower than that calculated using the non-thermoregulated one. This occurrence can be explained by considering that the thermoregulation phenomenon modifies the blood perfusion and the metabolic heating, as well as it activates the sweating process. When the PEF signal is turned off, the sweating process and the reduced metabolic heating generate a faster temperature decrease compared to the one calculated using the non-thermoregulated model. As a result, a temporary negative value of occurs. In response to such a negative value, the thermoregulation phenomenon should seek to stabilize the temperature as much as possible closer to the steady-state value. However, the noticeable discordance is a compelling argument for necessarily using the more complex model employing the thermoregulation mechanisms.
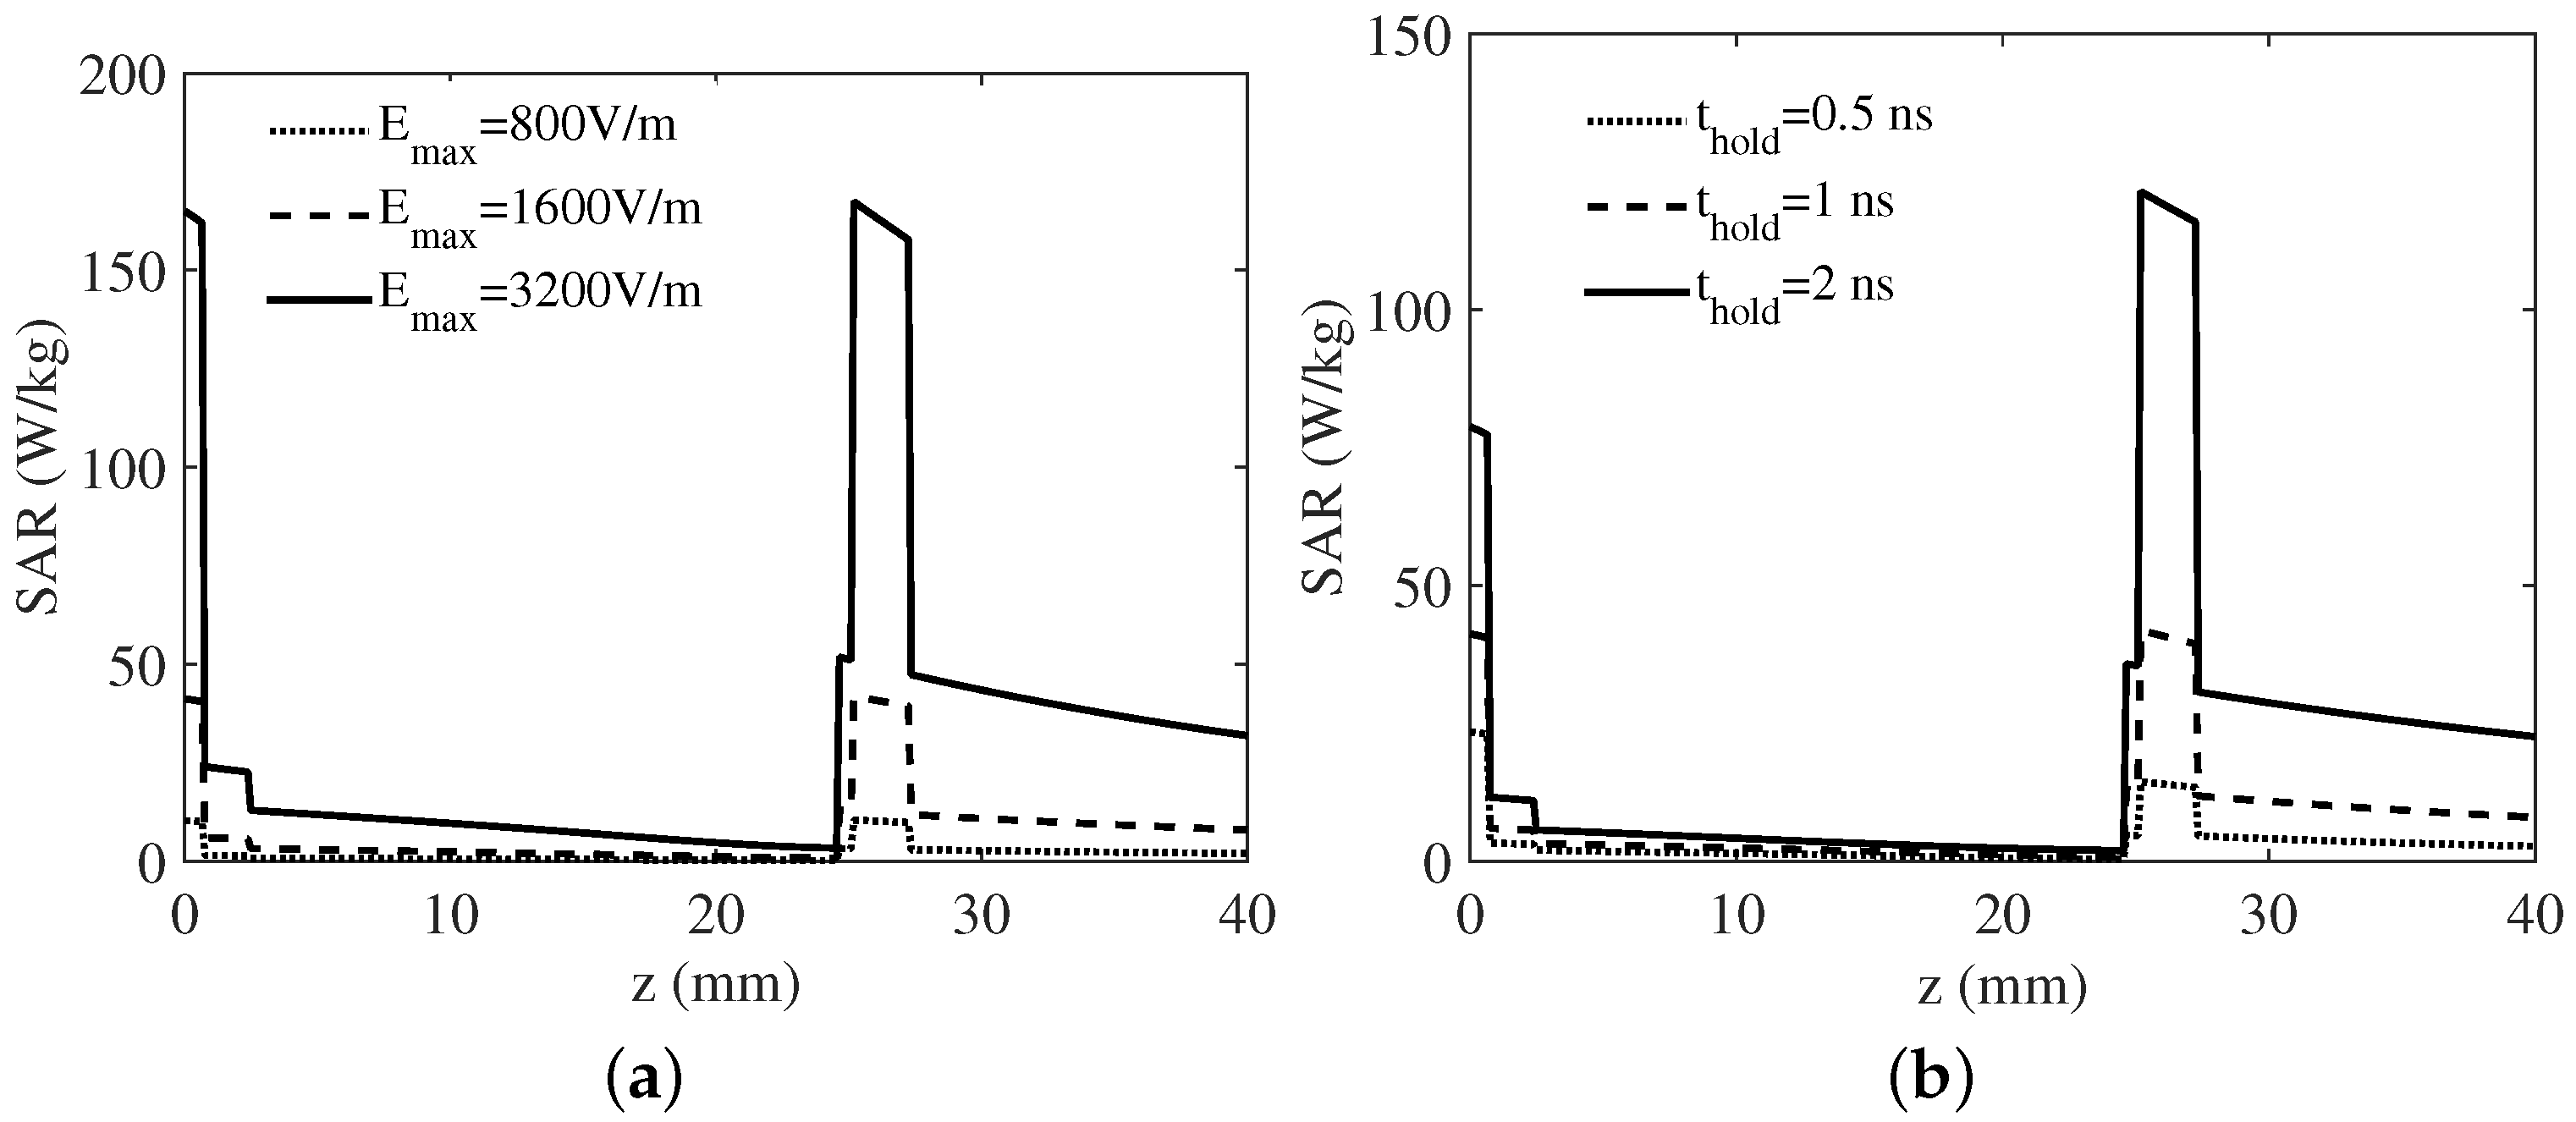
In order to gain insights into the interaction of PEF with the multilayered human head, additional parametric studies have been carried out. Two different test cases have been considered. In the first one, the PEF amplitude is changed, and the hold time is equal to . The second test case pertains to the parametric analysis performed by varying the hold time and fixing . Figure 6 displays the spatial distribution of the SAR concerning (a) the first and (b) the second test case. As it would be expected, the electromagnetic power enhancement due to the PEF amplitude rise generates higher SAR in each biological layers (see Figure 6a). The SAR also increases for longer pulse durations (see Figure 6b). In the latter case, the SAR improvement depends on the spectral band associated with the pulsed signal as well as on the penetration depth of the PEF inside the head. For shorter PEF signals, the SAR value is higher in the outer layer because the electromagnetic wave is strongly attenuated by the skin. Instead, by increasing the pulse duration, the electromagnetic wave propagates deeper, generating higher values of SAR inside the CSF layer, which shields the brain from the electromagnetic radiation.
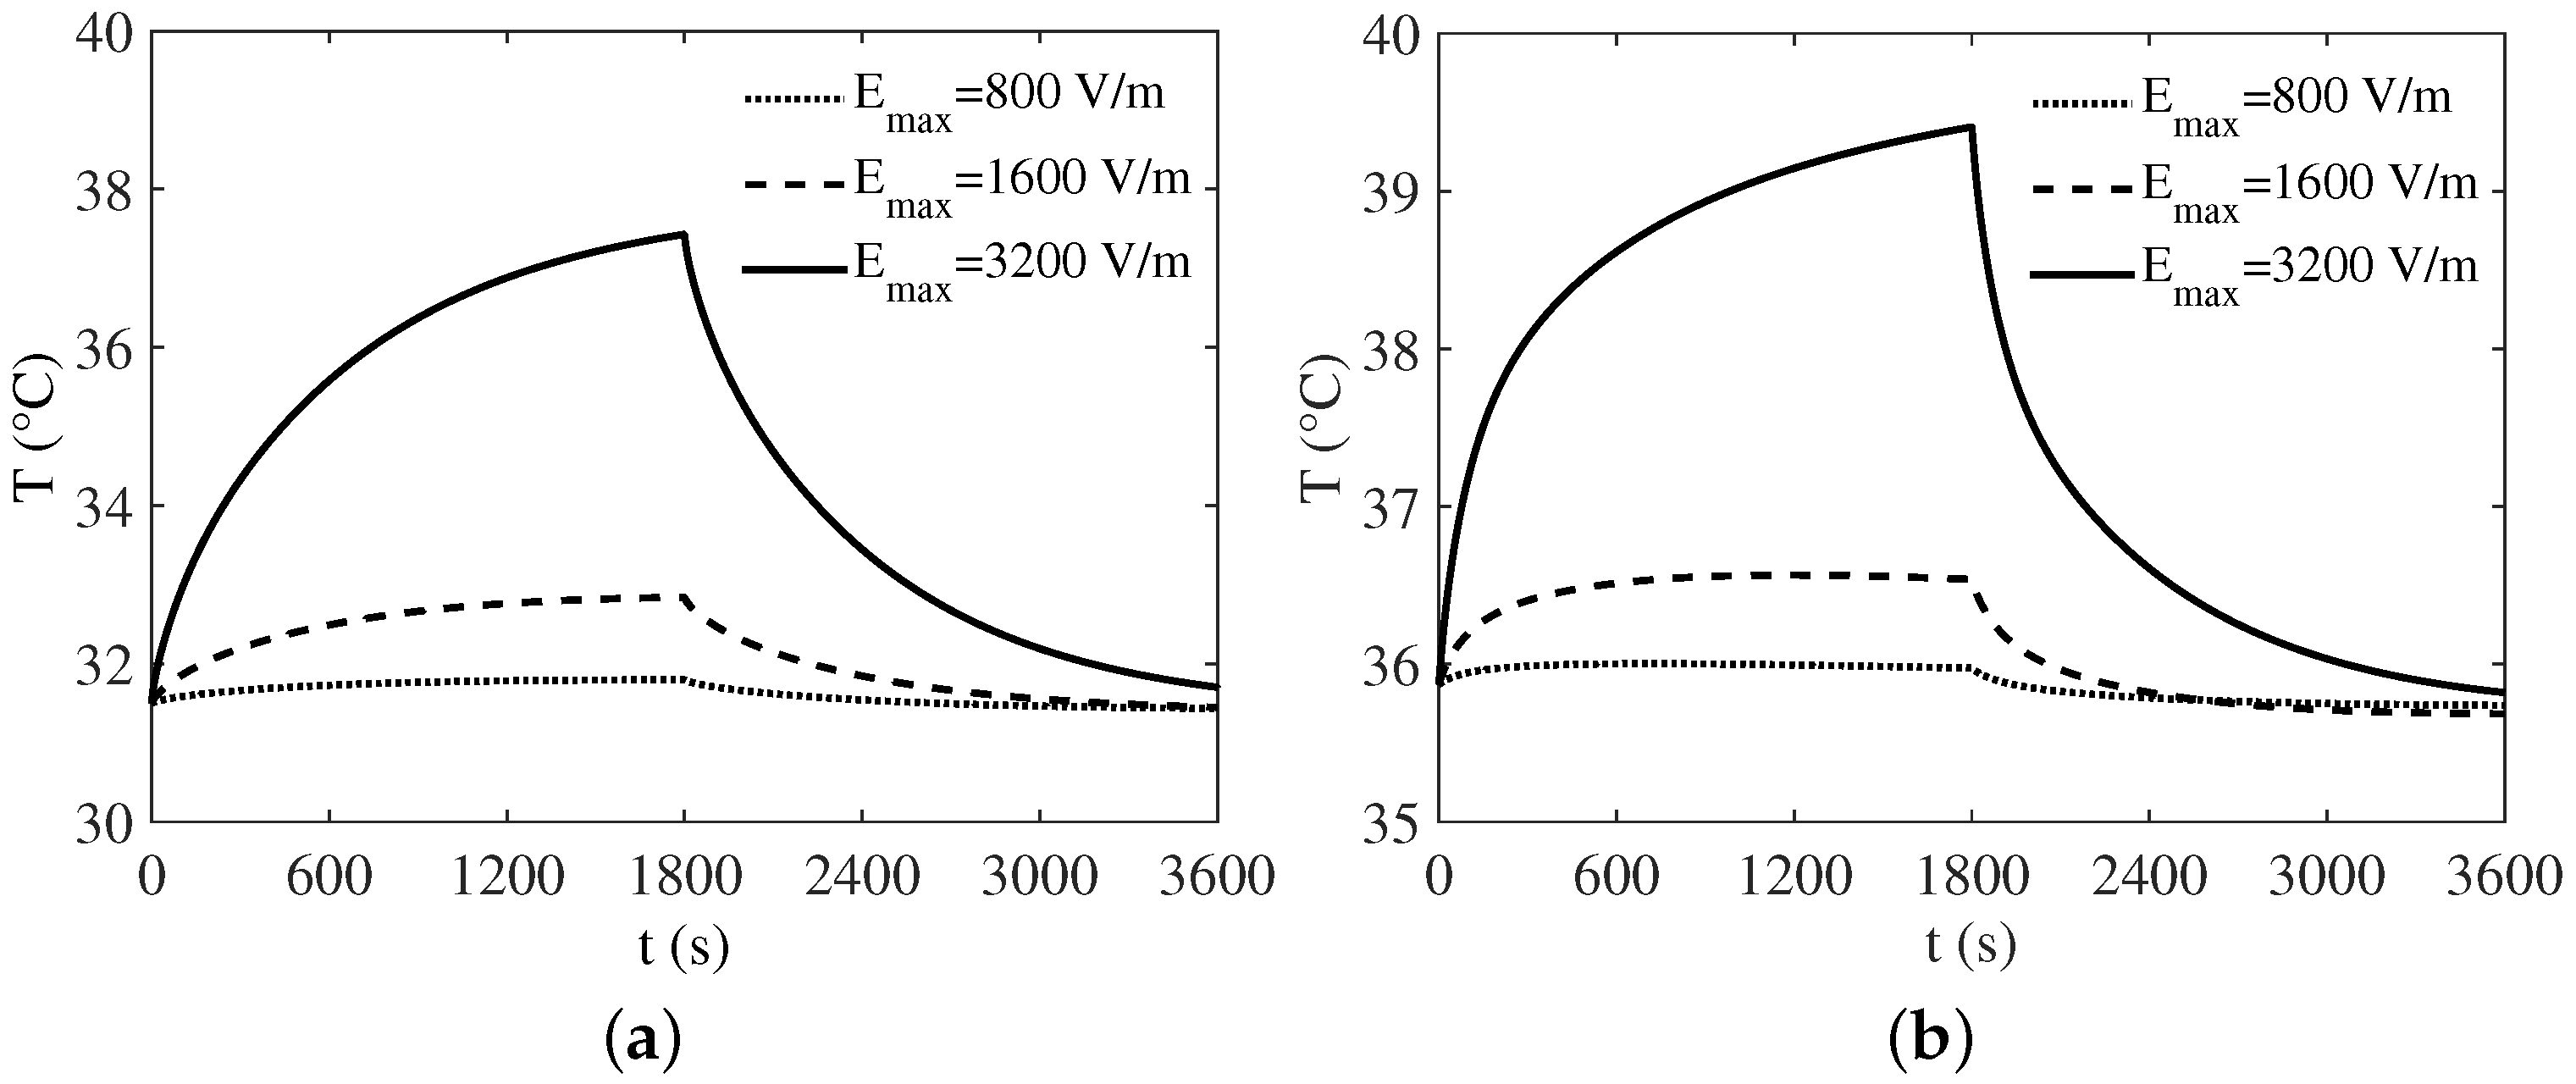
Figure 7 shows the temperature versus the time for three different PEF amplitudes (a) at the air-skin boundary and (b) at the outer surface of the brain layer. In the simulations, the SAR profiles illustrated in Figure 6a have been used, as well as the source is active for the first 30 min and turned off for the following 30 min. The temperature improvement is directly correlated with the amplitude of the PEF source. In fact, for , a negligible temperature rise can be observed. On the other hand, for , a strong thermal effect occurs inside the whole multilayered structure. Such behavior is due to the electromagnetic power associated with the pulse propagating inside the biological system. The power lost inside the biological tissues increases as the PEF amplitude increases, producing a higher heat load. In particular, the temperature increases more than on the skin surface and around inside the brain, reaching values that would result in damage to the biological tissues.
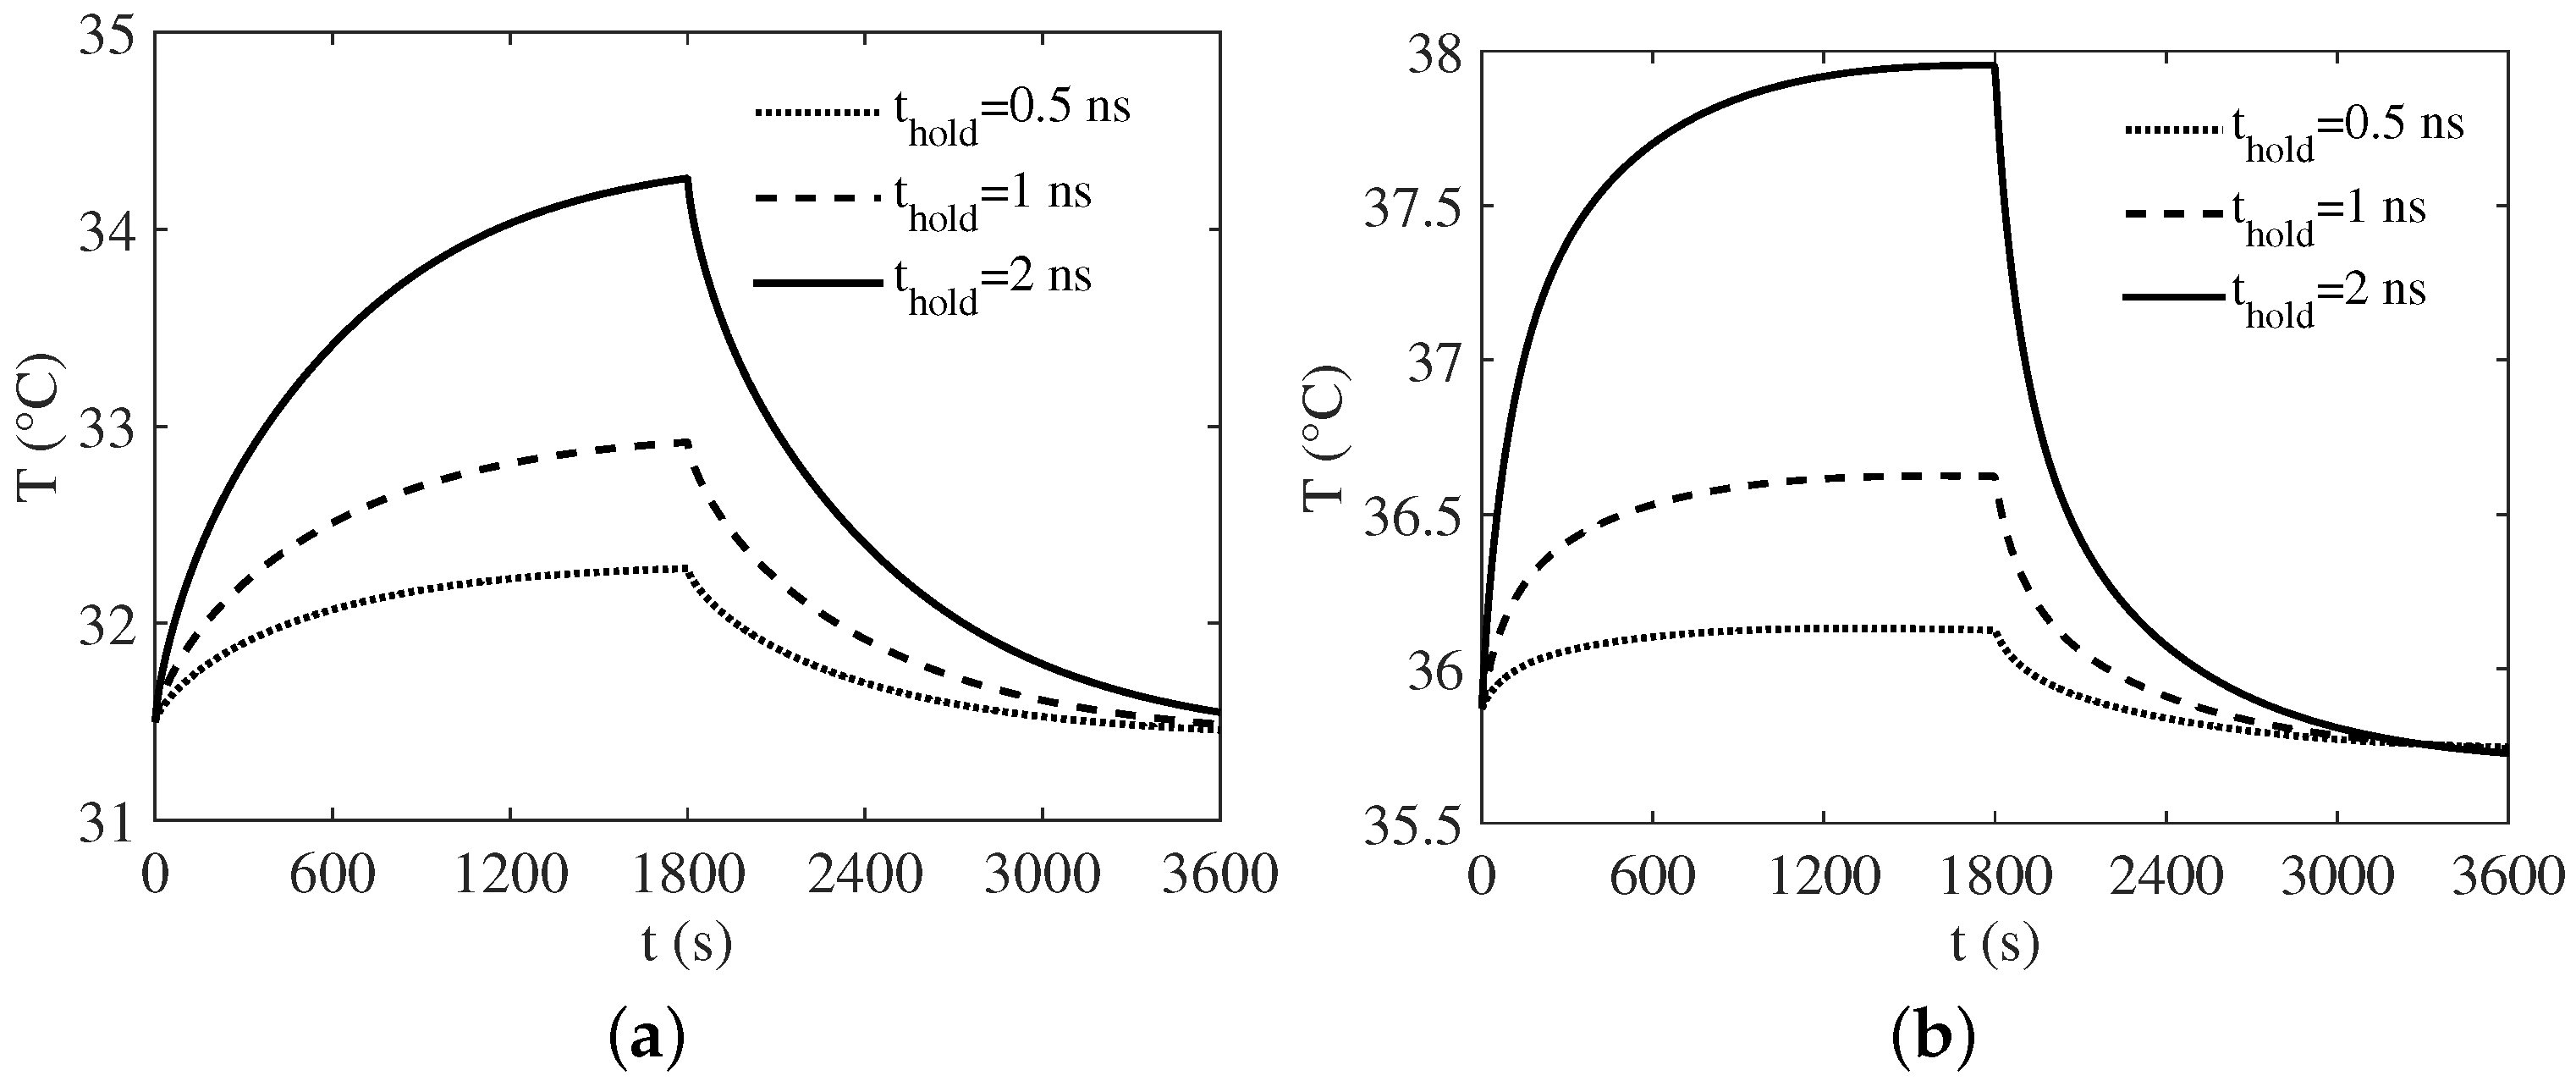
Figure 8 shows the temperature versus the time for three different PEF durations (a) at the air-skin boundary and (b) at the outer surface of the brain layer. The SAR profiles illustrated in Figure 6b have been used, as well. It is clear that the temperature increases by increasing the pulse duration. In particular, with respect to the steady state value, the temperature improvement at the air-skin boundary changes from , for , to , for . However, at the outer surface of the brain, a more limited temperature change occurs ranging from , for to , for . The temperature rise exhibits a non-linear dependance respect to the PEF duration. In fact, it is higher for a longer pulse duration since the electromagnetic field propagates deeper. As a result, a more efficient heating occurs. For this reason, the temperature at the air-skin surface linearly increases for longer PEF durations, and a more evident changes inside the brain can be observed. In fact, for shorter pulses, the high frequency spectral components exhibit a strong attenuation before reaching the brain, thus producing a lower temperature rise. On the other hand, by extending the pulse duration, the spectral energy is mainly associated with lower frequency spectral components, which can reach the brain layer.
4. Conclusions
In this paper, a novel mathematical model based on an electromagnetic FDTD fractional scheme coupled with the bioheat equations and thermoregulated Gagge’s two-node model has been illustrated. In the presented model, the fractional derivatives appearing in the permittivity function characterizing the dispersive materials are directly incorporated into the FDTD scheme by using the Riemann–Liouville definition. The developed numerical tool has been applied to the analysis of pulse wave propagation in a multilayered human head structure. After a validation carried out by comparison with a fully-analytical approach, the numerical code has been applied to study various test cases. The obtained results show that the presented multiphysics model provides the space-time temperature distribution inside the biological layers forming the human head when it is exposed to PEF radiation. Moreover, in order to investigate the effects of the amplitude and pulse duration on the temperature rise inside the head, several parametric simulations have been carried out. The obtained results demonstrate that the proposed numerical model could be a useful tool to study the coupled thermal and electromagnetic problems occurring in biological tissues.
Acknowledgments
This study has been partly carried out in the framework of the research and development program running at The Antenna Company Nederland B.V. and EmTeSys S.R.L. For further information, please visit the websites http://www.antennacompany.com/ and http://www.emtesys.com/.
Author Contributions
Luciano Mescia and Diego Caratelli conceived the fractional calculus based FDTD theoretical model; Luciano Mescia and Pietro Bia developed the theoretical model based on the bioheat equation and thermoregulation; Pietro Bia designed and implemented the whole numerical algorithm; Michele Alessandro Chiapperino performed some simulations; Luciano Mescia wrote the paper.
Conflicts of Interest
The authors declare no conflict of interest.
Abbreviations
The following abbreviations are used in this manuscript:
| FDTD | Finite difference time domain |
| PEF | Pulsed electric field |
| EM | Electromagnetic |
| CSF | Cerebro-spinal fluid |
| SAR | Specific absorption rate |
| HN | Havriliak-Negami |
| UPML | Uniaxial perfectly-matched layer |
| RF | Radio frequency |
| EWQPSO | Enhanced weighted quantum particle swarm optimization |
References
- Chen, W.J.; Shao, W.; Wang, B.Z. ADE-Laguerre-FDTD method for wave propagation in general dispersive materials. IEEE Microw. Wirel. Compon. Lett. 2013, 23, 228–230. [Google Scholar] [CrossRef]
- Maradei, F.; Ke, H.; Hubing, T.H. Full-wave model of frequency-dispersive media with Debye dispersion relation by circuit-oriented FEM. IEEE Trans. Electromagn. Compat. 2009, 51, 312–319. [Google Scholar] [CrossRef]
- Lin, Z.; Fang, Y.; Hu, J.; Zhang, C. On the FDTD formulations for modeling wideband lorentzian media. IEEE Trans. Antennas Propag. 2011, 59, 1338–1356. [Google Scholar] [CrossRef]
- Ramadan, O. General ADI-FDTD formulations for multi-term dispersive electromagnetic applications. IEEE Microw. Wireless Compon. Lett. 2011, 21, 513–515. [Google Scholar] [CrossRef]
- Ha, S.G.; Cho, J.; Choi, J.; Kim, H.; Jung, K.Y. FDTD dispersive modeling of human tissues based on quadratic complex rational function. IEEE Trans. Antennas Propag. 2013, 61, 996–999. [Google Scholar] [CrossRef]
- Ha, M.; Swaminathan, M. A Laguerre-FDTD formulation for frequency-dependent dispersive materials. IEEE Microw. Wirel. Compon. Lett. 2011, 21, 225–227. [Google Scholar]
- Feliziani, M.; Cruciani, S.; Santis, V.D.; Maradei, F. FD2TD analysis of electromagnetic field propagation in multipole Debye media with and without convolution. Prog. Electromagn. Res. B 2012, 42, 181–205. [Google Scholar] [CrossRef]
- Exposure to high frequency electromagnetic fields, biological effects and health consequences (100 Hz–300 GHz). Available online: http://www.icnirp.org/en/publications/article/hf-review-2009.html (accessed on 28 November 2017).
- Baker-Jarvis, J.; Kim, S. The interaction of radio-frequency fields with dielectric materials at macroscopic to mesoscopic scales. J. Res. NIST 2012, 117, 1–60. [Google Scholar] [CrossRef] [PubMed]
- A Rationale for Biologically-Based Exposure Standards for Low-Intensity Electromagnetic Radiation. Available online: http://www.bioinitiative.org/ (accessed on 28 November 2017).
- Weaver, J.C. Electroporation of cells and tissues. IEEE Trans. Plasma Sci. 2000, 88, 28–33. [Google Scholar] [CrossRef]
- Teissi, J.; Escoffre, J.M.; Rols, M.P.; Golzio, M. Time dependence of electric field effects on cell membranes. A review for a critical selection of pulse duration for therapeutical applications. Radiol. Oncol. 2008, 42, 196–206. [Google Scholar] [CrossRef]
- Guo, F.; Yao, C.; Li, C.; Mi, Y.; Wen, Y.; Tang, J. Dependence on pulse duration and number of tumor cell apoptosis by nanosecond pulsed electric fields. IEEE Trans. Dielectr. Electr. Insul. 2013, 20, 1195–1200. [Google Scholar]
- Esser, A.T.; Smith, K.C.; Gowrishankar, T.R.; Weaver, J.C. Towards solid tumor treatment by nanosecond pulsed electric fields. Technol. Cancer Res. Treat. 2009, 8, 289–306. [Google Scholar] [CrossRef] [PubMed]
- Breton, M.; Mir, L.M. Microsecond and nanosecond electric pulses in cancer treatments. Bioelectromagnetics 2012, 33, 106–123. [Google Scholar] [CrossRef] [PubMed]
- Lamberti, P.; Tucci, V.; Romeo, S.; Sannino, A.; Scarfì, M.R.; Zeni, O. nsPEF-induced effects on cell membranes: Use of electrophysical model to optimize experimental design. IEEE Trans. Dielectr. Electr. Insul. 2013, 20, 1231–1238. [Google Scholar] [CrossRef]
- Fernand, F.; Rubinsky, L.; Golberg, A.; Rubinsky, B. Variable electric fields for high throughput electroporation protocol design in curvilinear coordinates. Biotechnol. Bioeng. 2012, 109, 2168–2171. [Google Scholar] [CrossRef] [PubMed]
- Mescia, L.; Chiapperino, M.A.; Bia, P.; Gielis, J.; Caratelli, D. Modeling of Electroporation Induced by Pulsed Electric Fields in Irregularly Shaped Cells. IEEE Trans. Biomed. Eng. in press. [CrossRef]
- Foster, K.; Schwan, H. Dielectric properties of tissues. In Biological Effects of Electromagnetic Fields; Polk, C., Postow, E., Eds.; CRC Press: New York, NY, USA, 1996. [Google Scholar]
- Taflove, A.; Hagness, S. Computational Electrodynamics: The Finite-Difference Time-Domain Method; Artech House: Norwood, MA, USA, 2005. [Google Scholar]
- Caratelli, D.; Massaro, A.; Cingolani, R.; Yarovoy, A. Accurate time domain modeling of reconfigurable antenna sensors foe non-invasive melanoma skin cancer detection. J. Sens. 2012, 12, 635–643. [Google Scholar] [CrossRef]
- Mescia, L.; Bia, P.; Caratelli, D. Fractional Derivative Based FDTD Modeling of Transient Wave Propagation in Havriliak–Negami Media. IEEE Trans. Microw. Theory Tech. 2014, 62, 1920–1929. [Google Scholar] [CrossRef]
- Bia, P.; Caratelli, D.; Mescia, L.; Cicchetti, R.; Maione, G.; Prudenzano, F. A novel FDTD formulation based on fractional derivatives for dispersive Havriliak–Negami media. Signal Process. 2015, 107, 312–318. [Google Scholar] [CrossRef]
- Mescia, L.; Bia, P.; Caratelli, D. Authors’ reply. IEEE Trans. Microw. Theory Tech. 2015, 63, 4191–4193. [Google Scholar] [CrossRef]
- Bia, P.; Mescia, L.; Caratelli, D. Fractional Calculus–based Modelling of Electromagnetic Field Propagation in Arbitrary Biological Tissue. Math. Probl. Eng. 2016, 2016. [Google Scholar] [CrossRef]
- Caratelli, D.; Mescia, L.; Bia, P.; Stukach, O. Fractional-Calculus-Based FDTD Algorithm for Ultrawideband Electromagnetic Characterization of Arbitrary Dispersive Dielectric Materials. IEEE Trans. Antennas Propag. 2016, 64, 3533–3544. [Google Scholar] [CrossRef]
- Zolfaghari, A.; Maerefat, M. A new simplified thermoregulatory bioheat model for evaluating thermal response of the human body to transient environments. Build. Environ. 2010, 45, 2068–2076. [Google Scholar] [CrossRef]
- Drossos, A.; Santomaa, V.; Kuster, N. The Dependence of Electromagnetic Energy Absorption Upon Human Head Tissue Composition in the Frequency Range of 300–3000 MHz. IEEE Trans. Microw. Theory Tech. 2000, 48, 1988–1995. [Google Scholar]
- Havriliak, S.; Negami, S. A complex plane representation of dielectric and mechanical relaxation processes in some polymers. Polymer 1967, 8, 161–210. [Google Scholar] [CrossRef]
- Wolf, M.; Gulich, R.; Lunkenheimer, P.; Loidl, A. Broadband dielectric spectroscopy on human blood. Biochim. Biophys. Acta 2011, 1818, 727–740. [Google Scholar] [CrossRef] [PubMed]
- Sabbah, A.; Dib, N.; Al-Nimr, M. Evaluation of specific absorption rate and temperature elevation in a multi-layered human head model exposed to radio frequency radiation using the finite-difference time domain method. IET Microw. Antennas Propag. 2011, 5, 1073–1080. [Google Scholar] [CrossRef]
- Miklavcic, D.; Pavcelj, N.; Hart, F.X. Electric Properties of Tissues. In Encyclopedia of Biomedical Engineering; Wiley-InterScience: Hoboken, NJ, USA, 2006. [Google Scholar]
- Gabriel, S.; Lau, R.; Gabriel, C. The dielectric properties of biological tissues: II measurements in the frequency range 10 Hz to 20 GHz. Phys. Med. Biol. 1996, 41, 2231–2249. [Google Scholar] [CrossRef] [PubMed]
- Bia, P.; Caratelli, D.; Mescia, L.; Gielis, J. Analysis and synthesis of supershaped dielectric lens antennas. IET Microw. Antennas Propag. 2015, 9, 1497–1504. [Google Scholar] [CrossRef]
- Sanchez-Hernandez, D.A. High Frequency Electromagnetic Dosimetry; Artech House: Norwood, MA, USA, 2009. [Google Scholar]
- Parson, K. Human Thermal Environments; CRC Press: Boca Raton, FL, USA, 2002. [Google Scholar]
- Du Bois, D.; Du Bois, E.F. A formula to estimate approximate surface area, if height and weight are known. Arch. Intern. Med. 1916, 17, 863–871. [Google Scholar] [CrossRef]
- Developments in Heat Transfer. Available online: https://www.intechopen.com/books/developments-in-heat-transfer (accessed on 28 November 2017).
- Wang, L.K.; Yang, C.T.; Wang, M.S. Advances in Water Resources Management; Springer: Cham, Switzerland, 2015. [Google Scholar]
- Kaynakli, O.; Kilic, M. Investigation of indoor thermal comfort under transient conditions. Build. Environ. 2005, 40, 165–174. [Google Scholar] [CrossRef]
- Yeh, P. Optical Waves in Layered Media; Wiley: New York, NY, USA, 1988. [Google Scholar]
- Wang, J.; Fujiwara, O. FDTD Computation of Temperature Rise in the Human Head for Portable Telephones. IEEE Trans. Microw. Theory Tech. 1999, 47, 1528–1534. [Google Scholar] [CrossRef]
Figure 1.
Sketch of the layered structure considered in the simulations.
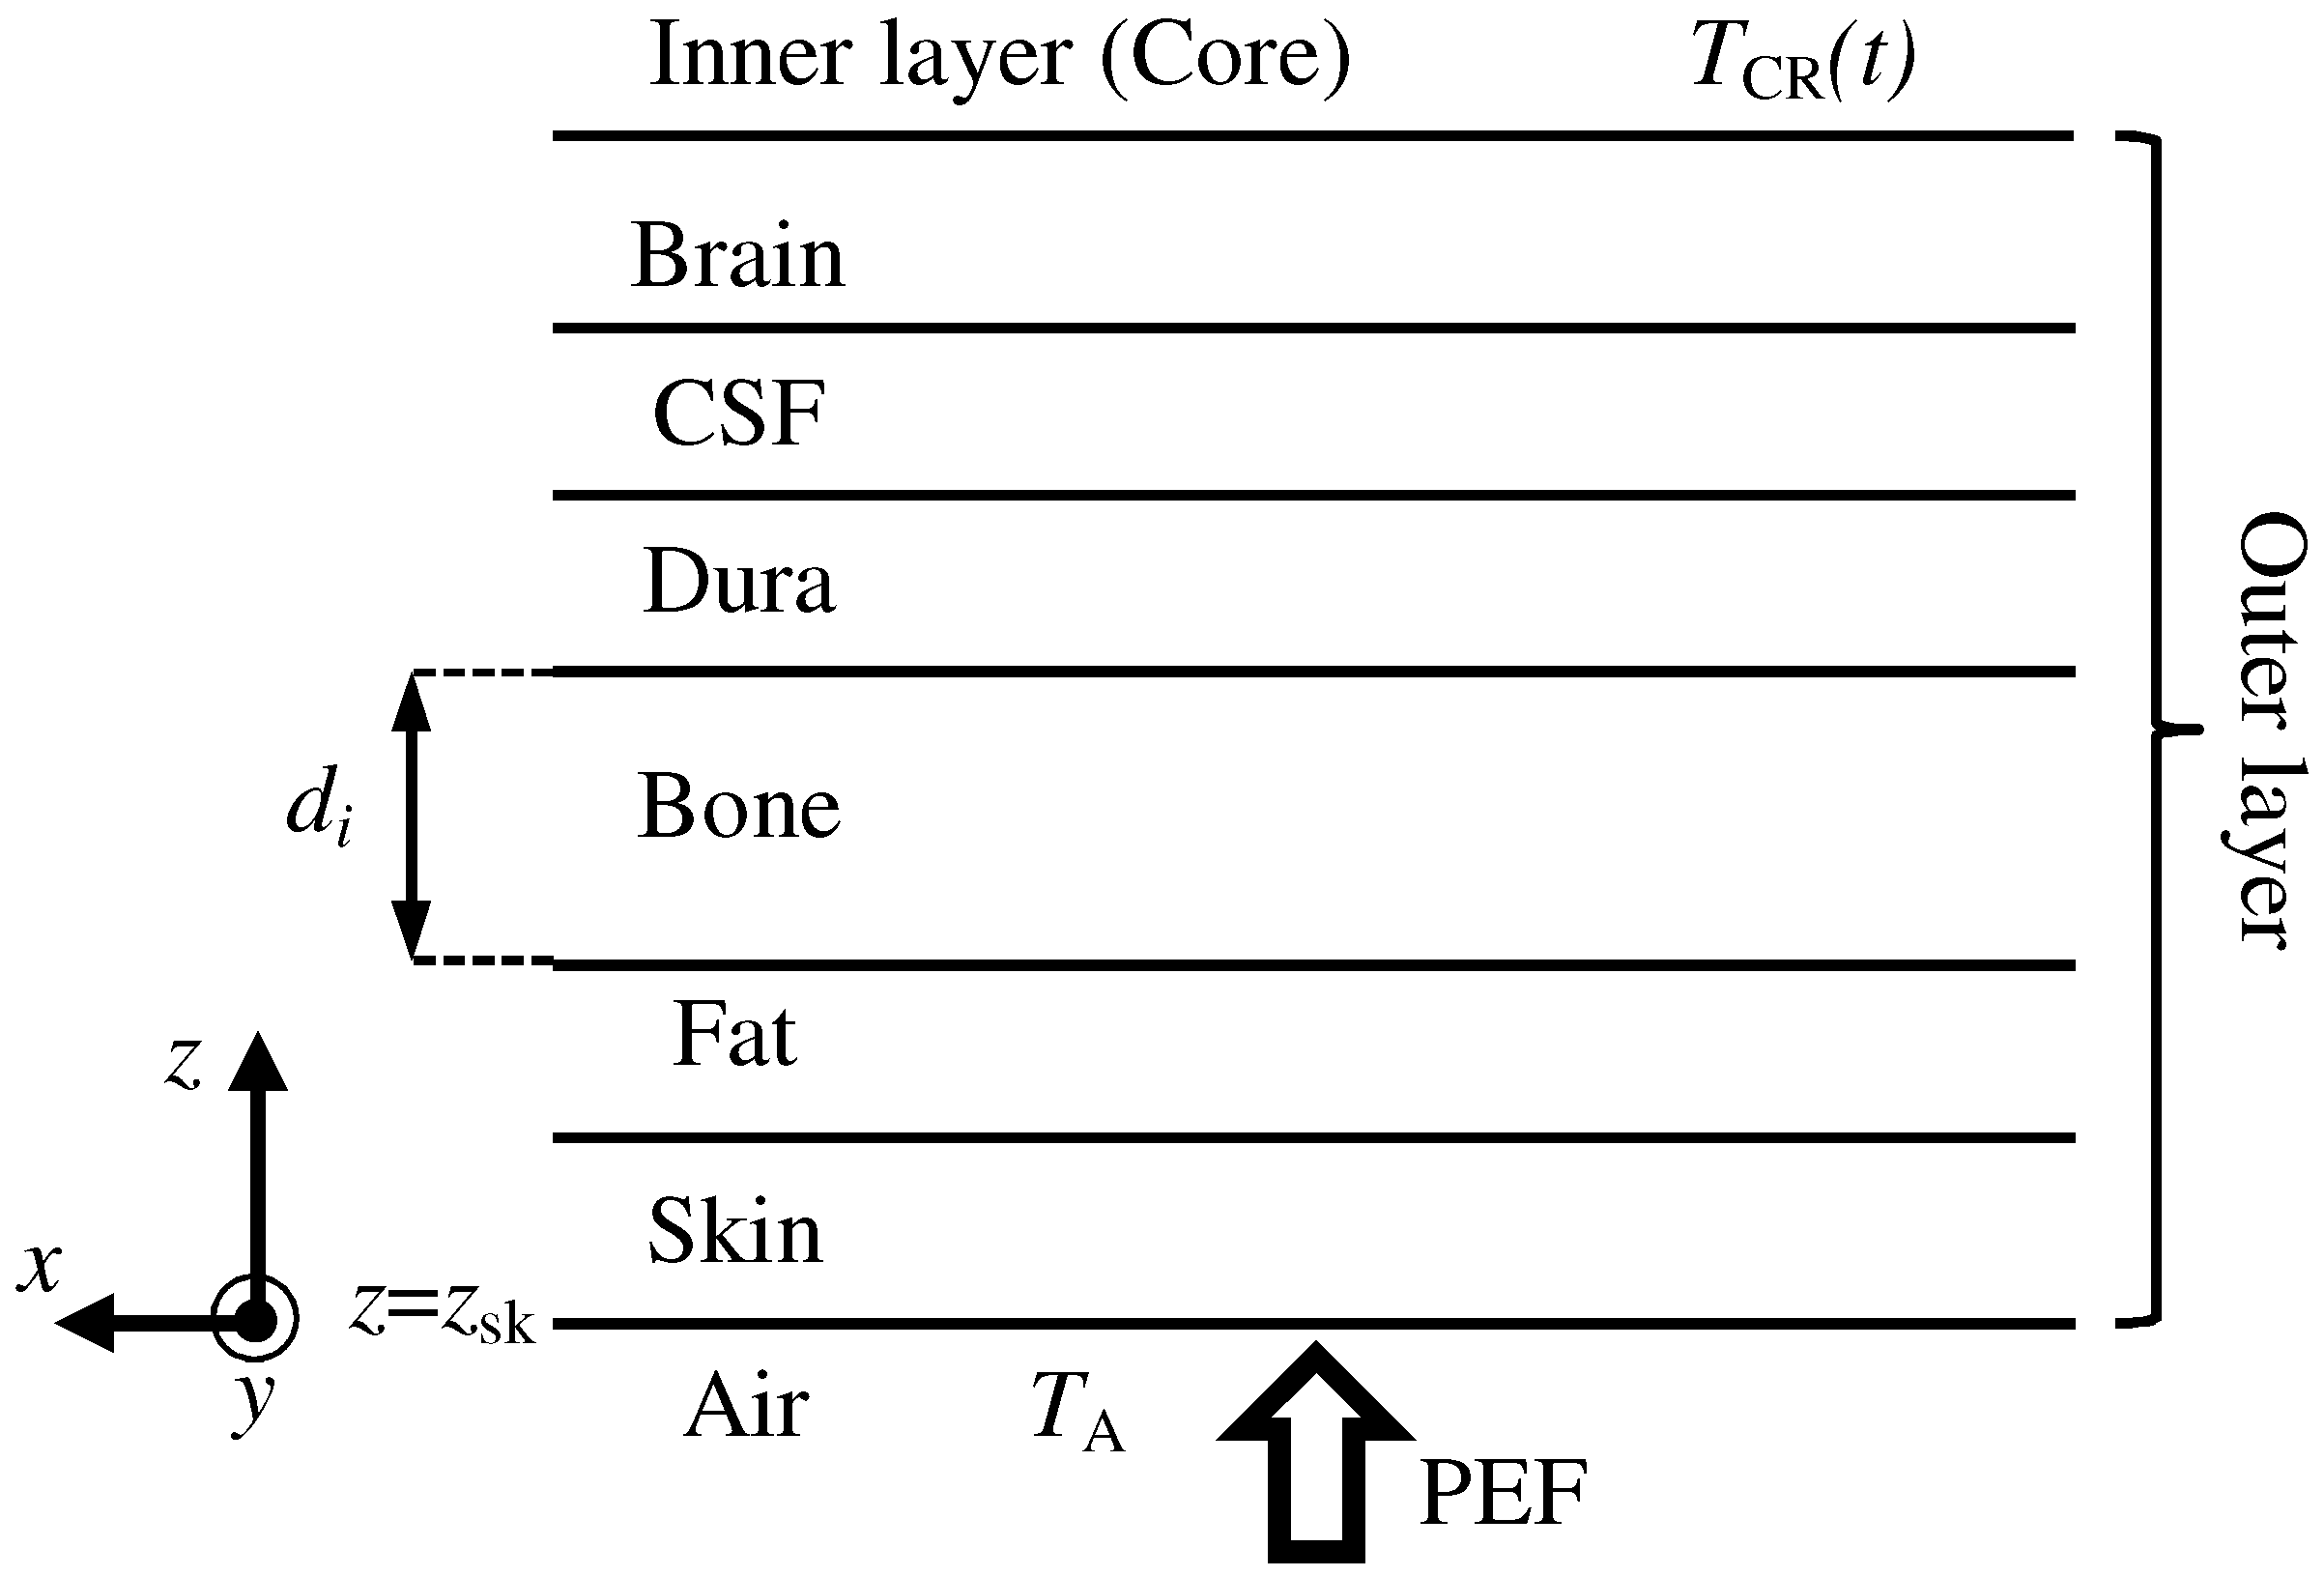
Figure 2.
Sketch illustrating the thermoreceptor signals and the thermoregulation mechanisms involved in Gagge’s two-node model.
Figure 2.
Sketch illustrating the thermoreceptor signals and the thermoregulation mechanisms involved in Gagge’s two-node model.
Figure 3.
Reflectance and transmittance spectrum of the six-layered dielectric slab shown in Figure 1.
Figure 3.
Reflectance and transmittance spectrum of the six-layered dielectric slab shown in Figure 1.

Figure 4.
(a) PEF source having and ; (b) the corresponding SAR profile inside the multilayered head structure.
Figure 4.
(a) PEF source having and ; (b) the corresponding SAR profile inside the multilayered head structure.

Figure 5.
(a) Time-dependent temperature rise in the skin, bone, and brain layers; (b) comparison between non-thermoregulated and thermoregulated models.
Figure 5.
(a) Time-dependent temperature rise in the skin, bone, and brain layers; (b) comparison between non-thermoregulated and thermoregulated models.

Figure 6.
SAR profile obtained by considering a PEF source with (a) three different pulse amplitudes; (b) three different hold times.
Figure 6.
SAR profile obtained by considering a PEF source with (a) three different pulse amplitudes; (b) three different hold times.

Figure 7.
Temperature versus the time for three different PEF amplitudes; (a) at the air-skin boundary and (b) at the outer surface of the brain layer.
Figure 7.
Temperature versus the time for three different PEF amplitudes; (a) at the air-skin boundary and (b) at the outer surface of the brain layer.

Figure 8.
Temperature versus time for three different PEF durations; (a) at the air-skin boundary and (b) at the outer surface of the brain layer.
Figure 8.
Temperature versus time for three different PEF durations; (a) at the air-skin boundary and (b) at the outer surface of the brain layer.


Table 1.
Dielectric and geometrical parameters of the simulated layered structure.
| Parameter | Skin | Fat | Bone | Dura | CSF | Brain |
|---|---|---|---|---|---|---|
| 0.93 | 0.92 | 0.91 | 0.88 | 0.92 | 0.93 | |
| 0.92 | 0.91 | 0.70 | 0.81 | 0.99 | 0.99 | |
| 0.99 | 0.99 | 0.99 | 0.99 | 0.99 | 0.99 | |
| 0.87 | 0.85 | 0.99 | 0.97 | 0.85 | 0.79 | |
| 8.02 | 8.34 | 13.79 | 8.02 | 8.03 | 8.01 | |
| 67.68 | 23.98 | 63.96 | 105.85 | 24.71 | 117.25 | |
| 36.94 | 2.35 | 8.18 | 37.89 | 63.23 | 42.93 | |
| 1789.8 | 79.20 | 130 | 1087.4 | 315.09 | 2823.9 | |
| 0 | 0.01 | 0.006 | 0.5 | 2 | 0.02 | |
| 4 | 2.5 | 2.5 | 4 | 4 | 4 | |
| 0.7 | 1.6 | 20.5 | 0.5 | 2 | ∞ |
Table 2.
Bioheat parameters of the layered media.
| Medium | ||||
|---|---|---|---|---|
| Skin | 1100 | 3600 | 0.42 | 0.0025 |
| Fat | 920 | 3000 | 0.25 | 0.0005 |
| Bone | 1850 | 3100 | 0.39 | 0.0005 |
| Dura | 1050 | 3600 | 0.5 | 0.0003 |
| CSF | 1060 | 4000 | 0.62 | 0 |
| Brain | 1030 | 3650 | 0.535 | 0.011 |
| Blood | 937 | 3889 | - | - |
Table 3.
Thermal increase comparison inside the brain layer by considering the thermal model published in [42] and the proposed thermoregulated model.
© 2017 by the authors. Licensee MDPI, Basel, Switzerland. This article is an open access article distributed under the terms and conditions of the Creative Commons Attribution (CC BY) license (http://creativecommons.org/licenses/by/4.0/).
Share and Cite
MDPI and ACS Style
Mescia, L.; Bia, P.; Chiapperino, M.A.; Caratelli, D. Fractional Calculus Based FDTD Modeling of Layered Biological Media Exposure to Wideband Electromagnetic Pulses. Electronics 2017, 6, 106. https://doi.org/10.3390/electronics6040106
AMA Style
Mescia L, Bia P, Chiapperino MA, Caratelli D. Fractional Calculus Based FDTD Modeling of Layered Biological Media Exposure to Wideband Electromagnetic Pulses. Electronics. 2017; 6(4):106. https://doi.org/10.3390/electronics6040106
Chicago/Turabian StyleMescia, Luciano, Pietro Bia, Michele Alessandro Chiapperino, and Diego Caratelli. 2017. "Fractional Calculus Based FDTD Modeling of Layered Biological Media Exposure to Wideband Electromagnetic Pulses" Electronics 6, no. 4: 106. https://doi.org/10.3390/electronics6040106
Note that from the first issue of 2016, this journal uses article numbers instead of page numbers. See further details here.