The Platform Development of a Real-Time Momentum Data Collection System for Livestock in Wide Grazing Land


1
School of Mechanical, Electrical and Information Engineering, Shandong University, Weihai 264209, China
2
Department of Electromechanical Convergence Engineering, Korea University of Technology and Education, Cheonan 31253, Chungnam, Korea
3
Technology Research Center, INOFARM Co., Ltd. Yusung-gu, Taejon 305‐701, Korea
*
Author to whom correspondence should be addressed.
Electronics 2018, 7(5), 71; https://doi.org/10.3390/electronics7050071
Submission received: 22 April 2018
/
Revised: 11 May 2018
/
Accepted: 13 May 2018
/
Published: 14 May 2018
(This article belongs to the Special Issue Open-Source Electronics Platforms: Development and Applications)
Abstract
:In the process of animal husbandry production through grazing, animals are active in large grassland or mountain areas, and it is very difficult to obtain and deal with the information on animal activity and state of life. In this paper, we propose a platform for operation of data transmission and analysis system which gathers activity and status information of livestock. The data collected in real time from integrated livestock sensor modules are anticipated to assist farmers to supervise animal activities and health. While at the same time the improvements of viable farming techniques are expected to reduce the impact of the livestock industry on the environment. For the individual management of target livestock, the data collection system needs a convergence technology with a physical active sensor, a wireless sensor network and solar power technology to cover the wide area of mountains. We implemented a momentum data collection system to collect and transfer the information of ecological and situations of livestock in grazing, which include sensor and communication modules, repeaters with solar panels to cover the problems of communications in wide grazing and a receiver connected to main server. Besides, in order to prevent data collisions and deviations on multiple transmitter operation, we renewed the format of the communication protocol and made a platform to analyze animal activities information by software. Finally, the system and platform were applied and tested in National Rural Development Administration in Republic of Korea.
1. Introduction
Raw information and reliable sources of animal production are important for the economy of meat products. Meat is limited by shelf life and some meat with long shelf life is considered unhealthy due to the use of preservatives [1]. Out of consideration of food safety and economic benefits, the raw material information of meat should be controlled by the consumer, producer and distributer. Consequently, how to collect and analyze the original information of animal production has become an important research field, to which a variety of technologies have been employed [2].
Livestock management is an important issue for the green food industry, but the effective management of the target animal is very difficult because of securing of animal issues of livestock [3], increase of eco-friendly breeding methods [4], safety of foodstuffs due to the application of various technologies [5], and the famer’s economics [6]. Regarding these issues, we need to be concerned with eco-friendly feeding methods and how to create and implement environments to effectively manage livestock. In particular, applying the high-level technology such as bio-chemistry and/or genetics to the food industry without appropriate treatment usually cannot guarantee safe foods. Besides, the use of these technologies is strictly protected. Thus, we have to apply the higher-level technologies carefully and selectively.
China is a big country in the production of animal husbandry, and the annual output of livestock and poultry products is considered the highest in the world. In 2015, the total output value of China’s animal husbandry was 2 trillion and 978 billion 38 million Chinese Yuan, up 2.85% from the same period (Data source: China National Bureau of Statistics). However, the production efficiency is very low and the data statistics are difficult. Furthermore, China’s livestock industry has led to huge carbon emissions [7]. It is a problem to improve the production animal husbandry in China. And large-scale raising of livestock cannot be maintained in places, because the amount of available arable and grazing land is decreasing due to urbanization. The livestock contamination issues are very serious social problems to maintain in terms of the green environment.
In Korea, as the agricultural economic structure changes, the total number of famers in the livestock industry is gradually decreasing. The main cause is the decrease in the income of livestock industry workers. Therefore, the increase of the livestock industry workers’ income needs to be considered for the livestock environment and structure of farmers’ incomes [8].
For the above-mentioned reasons, it is important to construct an effective technical path to manage the livestock according to changes in the livestock environment including livestock diseases. Health condition of livestock can be predicted with the physical activity of the target livestock. Traditional farm monitoring, such as using written notes or a simple device without data sharing capabilities, is an inaccurate method with high probability of human error. The health information of the target cannot be the useful data for management of the target and the use of Global Positioning Systems was proposed, but it required detailed field maps and was costly due to the involvement of transmission of data from satellites so, it is not suitable for real field [2].
In order to meet the requirements, the proposed system is implemented to have the ability to collect and transmit data of real time physical activities in wide range mountainous areas. After collecting raw data, the data will be analyzed to satisfy the issues. In order to monitor livestock, shed monitoring system based on a wireless sensor network [9,10] uses bio and environmental sensors such as temperature and humidity [11]. Advanced management of livestock sheds uses infrared wireless sensor nodes and unmanned surveillance cameras [12]. Studies on the monitoring of the livestock state had been carried out on the IoT-based cattle biometric information collection terminal [13], cattle health monitoring system based on biosensors [14], design and implementation of livestock disease prediction system [15] and etc. However, the application of these systems is limited to a narrow field of livestock sheds, so it is difficult to be applied in the free-range grazing system. Muhammad Fahim et al. [16,17,18] proposed a method of using the accelerometer sensor of the smart phone to recognize user situations (i.e., still or active) and developed a cloud-based smart phone application supported by a web-based interface to visualize the sedentary behavior. Complex and large-scale sensor communication [19] is needed under these circumstances.
In this paper, we propose a momentum data collection system to provide ecological information and situations of livestock in grazing. In order to operate an unmanned ranch, it is difficult to apply high price sensors with high performance for economic benefit. We constructed a solar power supply system for the outdoor data repeater with low power consumption using solar panel and designed a data transfer platform for the analysis and storage of physical activity information of targets. We renewed the format of the communication protocol and data analysis method. The system and platform were applied to an actual grazing field and tested in National Rural Development Administration in Republic of Korea.
2. System Design and Structure
The Data collection system is composed of three parts: data transceiver module with sensor (Sensor Network Transceiver: SNR), repeater and main system. The sensors count the physical activities of targets which can be recognized by target number by SNR. The repeaters were evenly arranged and distributed on grazing land and the main system was installed in building inside a data-base computer with data storage and analysis software.
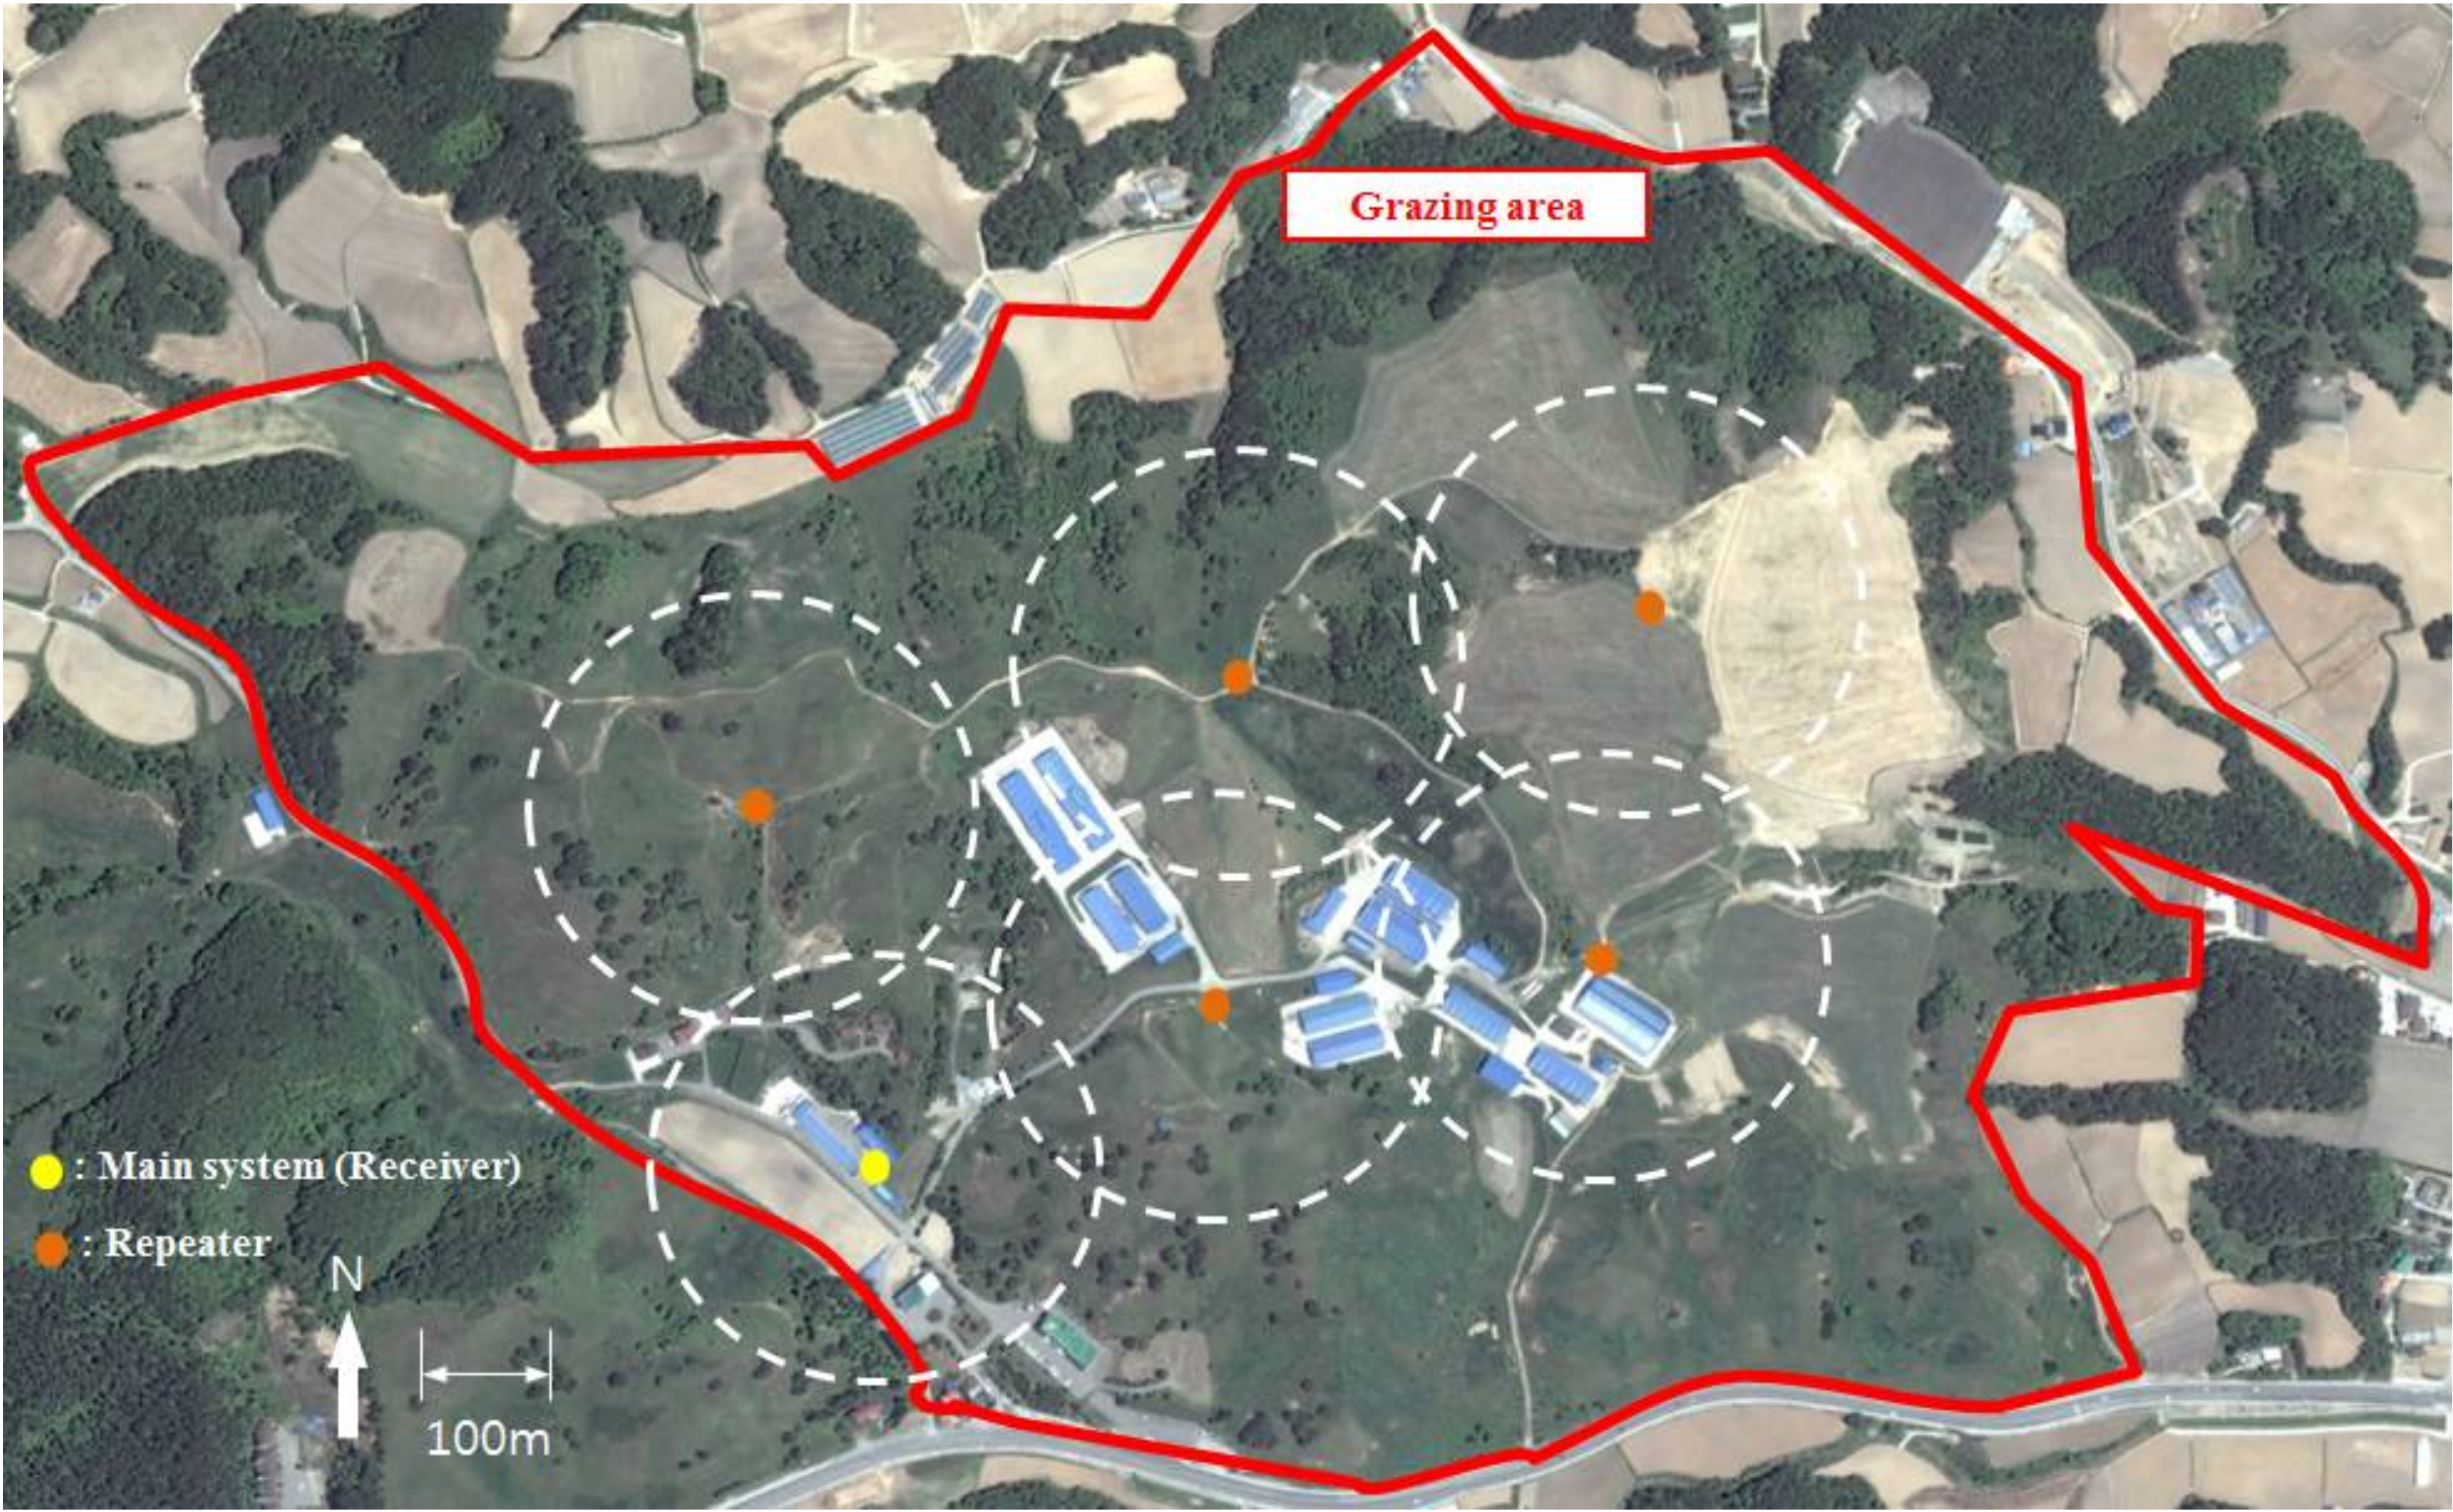
Figure 1 shows the plane map of the grazing land. The capacity of area for a breeding stock that requires 50 kilos of forage a day is about 1.5 kg per m2. 100 targets (Korean cattle) require an area about 4500 m2.
When cattle stay on the grazing ground, targets have a characteristic behavior of jumping, sitting, running and rubbing for their feed. So, we have difficulties to get direct physical data by momentum sensors. In general, sensors for receiving target’s Data [20] are attached directly on the leg of a target, so it is very hard to replace them by workers; it should be designed to be a low power module with a long life cycle. Unfortunately, the distance of the data transmission is related to power consumption of the SNR module which has a limited transceiver distance by module’s design. Because high power consumption equipment cannot be used for signal transmission [21] in wearable devices, a low power RF-IC is the only choice for the system to minimizing power consumption. Therefore, in order to cover the wide grazing, relay stations are necessary. For long time operation, solar panels are used to power them. The conclusion is that we have to make a sensor module, a data transfer module and a solar-powered repeater station for the transmission of the data in wide grazing. Information is eventually concentrated in the main server. The information is stored in a database and analyzed by specially designed analysis software, through which the behavior patterns of livestock can be summarized and utilized.
Figure 2 illustrates the overall flowchart of the system. When a sensor is attached to a cow’s neck and is ready for operation, the sensor can detect the cow’s movement impact which produces electrical signals or still—no signal. In this case, the sensor recognizes the impact as an Event. The movement of livestock in general can be perceived by the sensor, but with the time interval, the validity period of information will be different. The cow might move faster or slower. If the cow moves faster, it is a general activity, signifying it is not a special activity signal. The events occur continuously within 4–6 s and when the impact signal appears once or twice within 8 s, it may be considered as a signal such as a cow’s mount or a decrease in activity. If there is no more than 8 s of exercise, it can be divided into normal food or an ordinary activity. Hence, we can recognize the cow’s activities. If the activity signal is divided into an event failure, the signal patterns occurring within 4~6 s and the signal patterns that occur within 8 s can be predicted to be the biological changes of the animals that have occurred. Therefore, through the Event which is an electric signal by sensor, we detect the cow’s activity. The activity is within a specific time range and accumulates the number—which is count—of activities in unit time. Normally, the accumulated data (Number of events) can be transmitted to the main system for a period of time to observe the activity characteristics of the cattle by analysis with graphs or raw data.
3. System Implementation and Test
3.1. Data Transeiver Module with Sensor
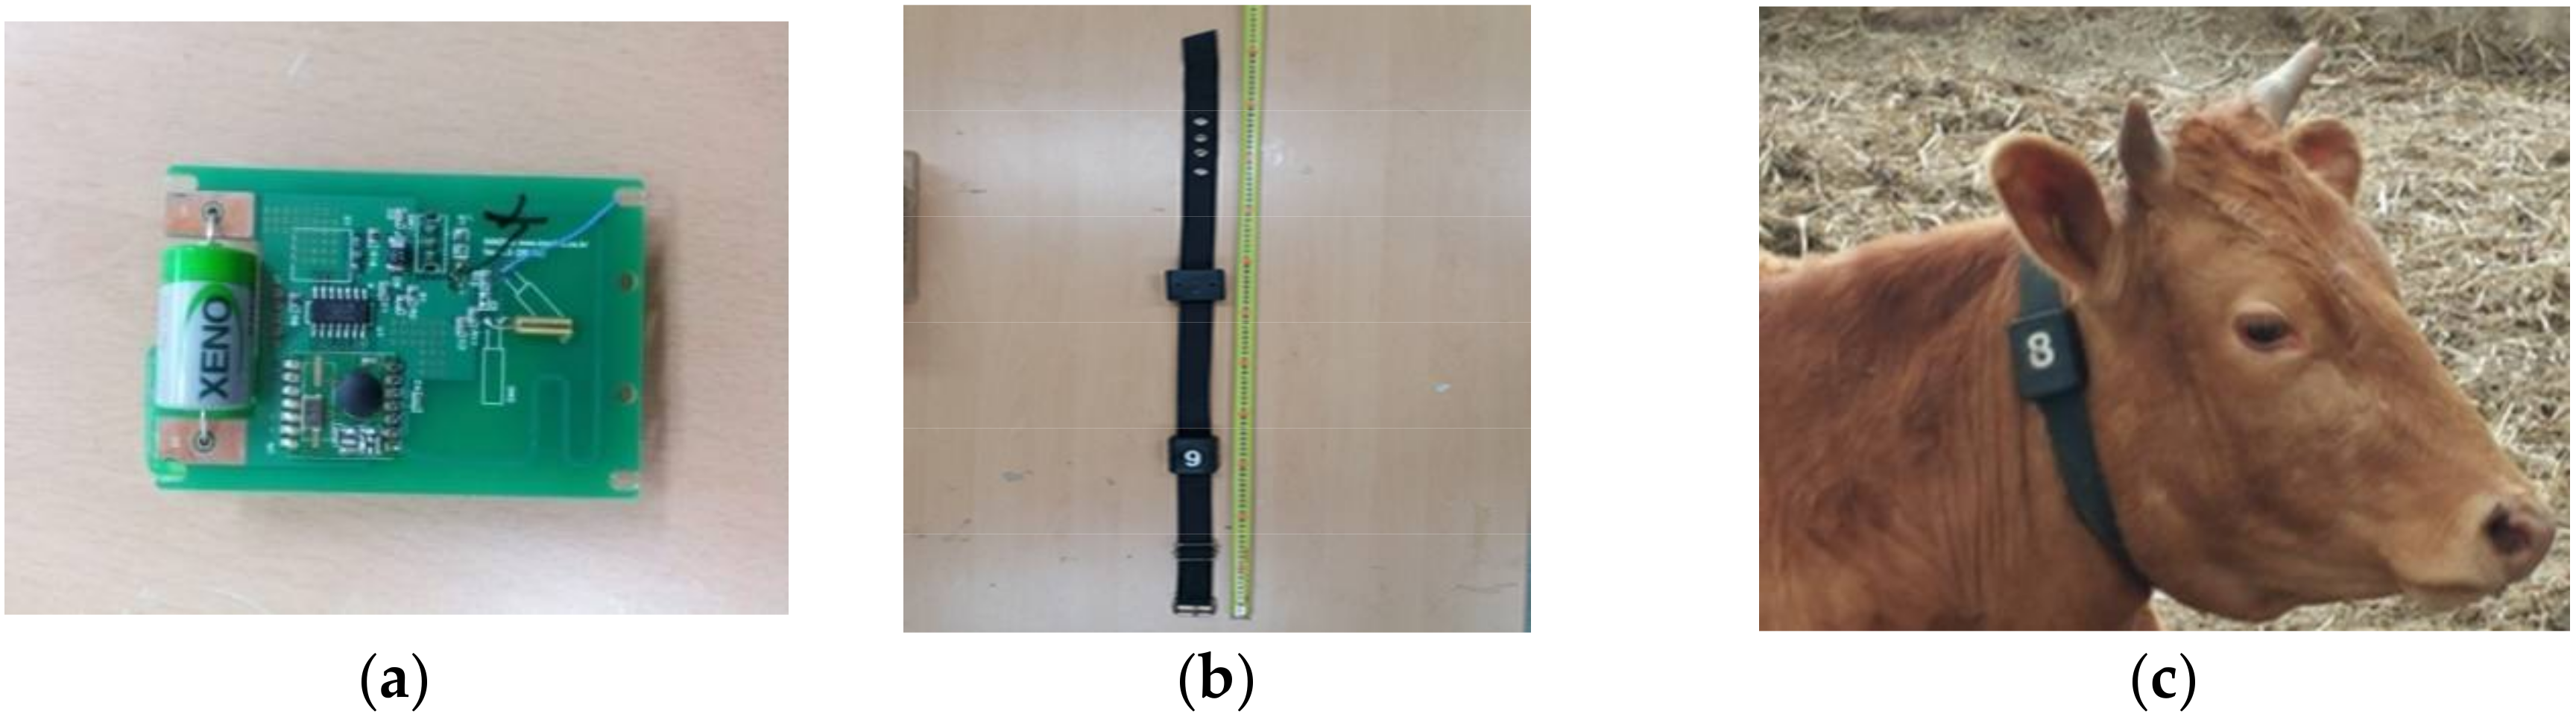
The SNR is made up of micro-component of impact-detecting, microprocessor and RF component. The module case is waterproof and has a battery. The microprocessor operates by a call from the main system which counts the number of the target’s physical activities from the impact-detecting component, and the data transfer to main the system via RF components. In the case of previous research, the sensor is attached to cattle’s ears by piercing but attached/inserted type can be changed to necklace type with target’s ID number [17] which enables easy recognition for each target. Figure 2 is a feature of SNR and its installation.
Figure 3 shows a feature of SNR and its installation. The SNR is made up of micro-component of impact detecting, microprocessor and RF component. In previous research, the sensor was attached on cattle’s ears by perforation. The attached/inserted type was changed to a necklace type with the target’s ID number [22]. In this way, each target could be easily distinguished.
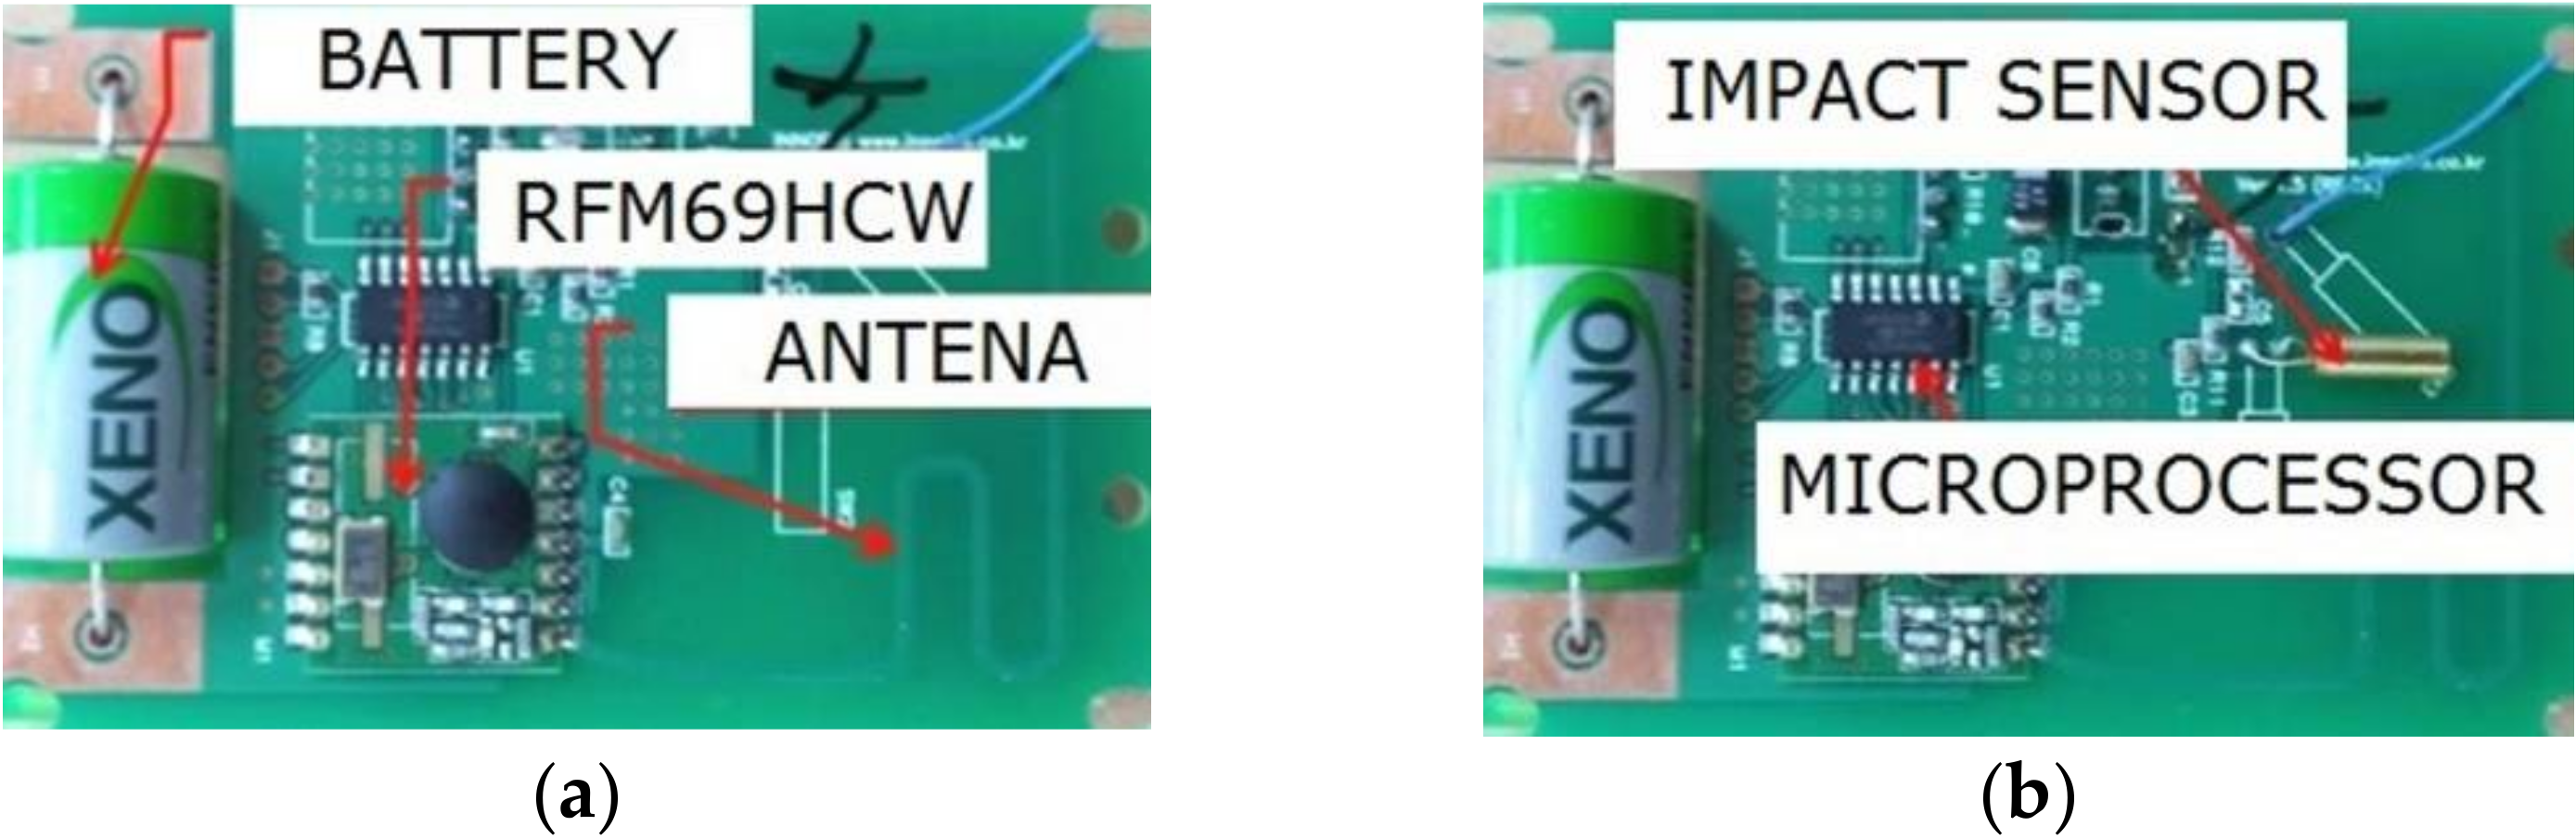
Figure 4 shows the IC structure of the SNR. Data are transmitted to main system through the RF module—RFM69HCW [23] which is optimized for low power consumption while offering high RF output power and channelized operation. The module case is waterproof and has a battery. The microprocessor operates by a call from the main system which counts the number of the target’s physical activities from the impact-detecting sensor.
3.2. DATA Transmission and Repeater
To manage the wide area of grazing, the system needs repeaters shown in Figure 5. The grazing has no power line, so wired electrical devices cannot be used. The repeater gets energy from solar panels and transmits the data from SNR to the main system receiver [24], and transfers the call signal from the main system to each sensor which can be recognized by the target ID. In that case, the wireless signals get errors for several reasons such as target movements, weather and obstacles. So considering these reasons, the data transmitter needs a special platform.
3.3. Format of Communication Protocol and Data Analysis
Detour path and traffic concentration problems are the fundamental problems of the general tree routing protocols [25], which cause overall network performance degradation. The forwarding scheme is prone to cause uneven load distribution and further lead to network congestion [26]. Nodes mounted on targets move frequently, and constant end-to-end paths are rarely available [27]. It is a challenging task to maintain quality of service with respect to parameters such as high throughput, and minimum end-to-end delay [28,29].
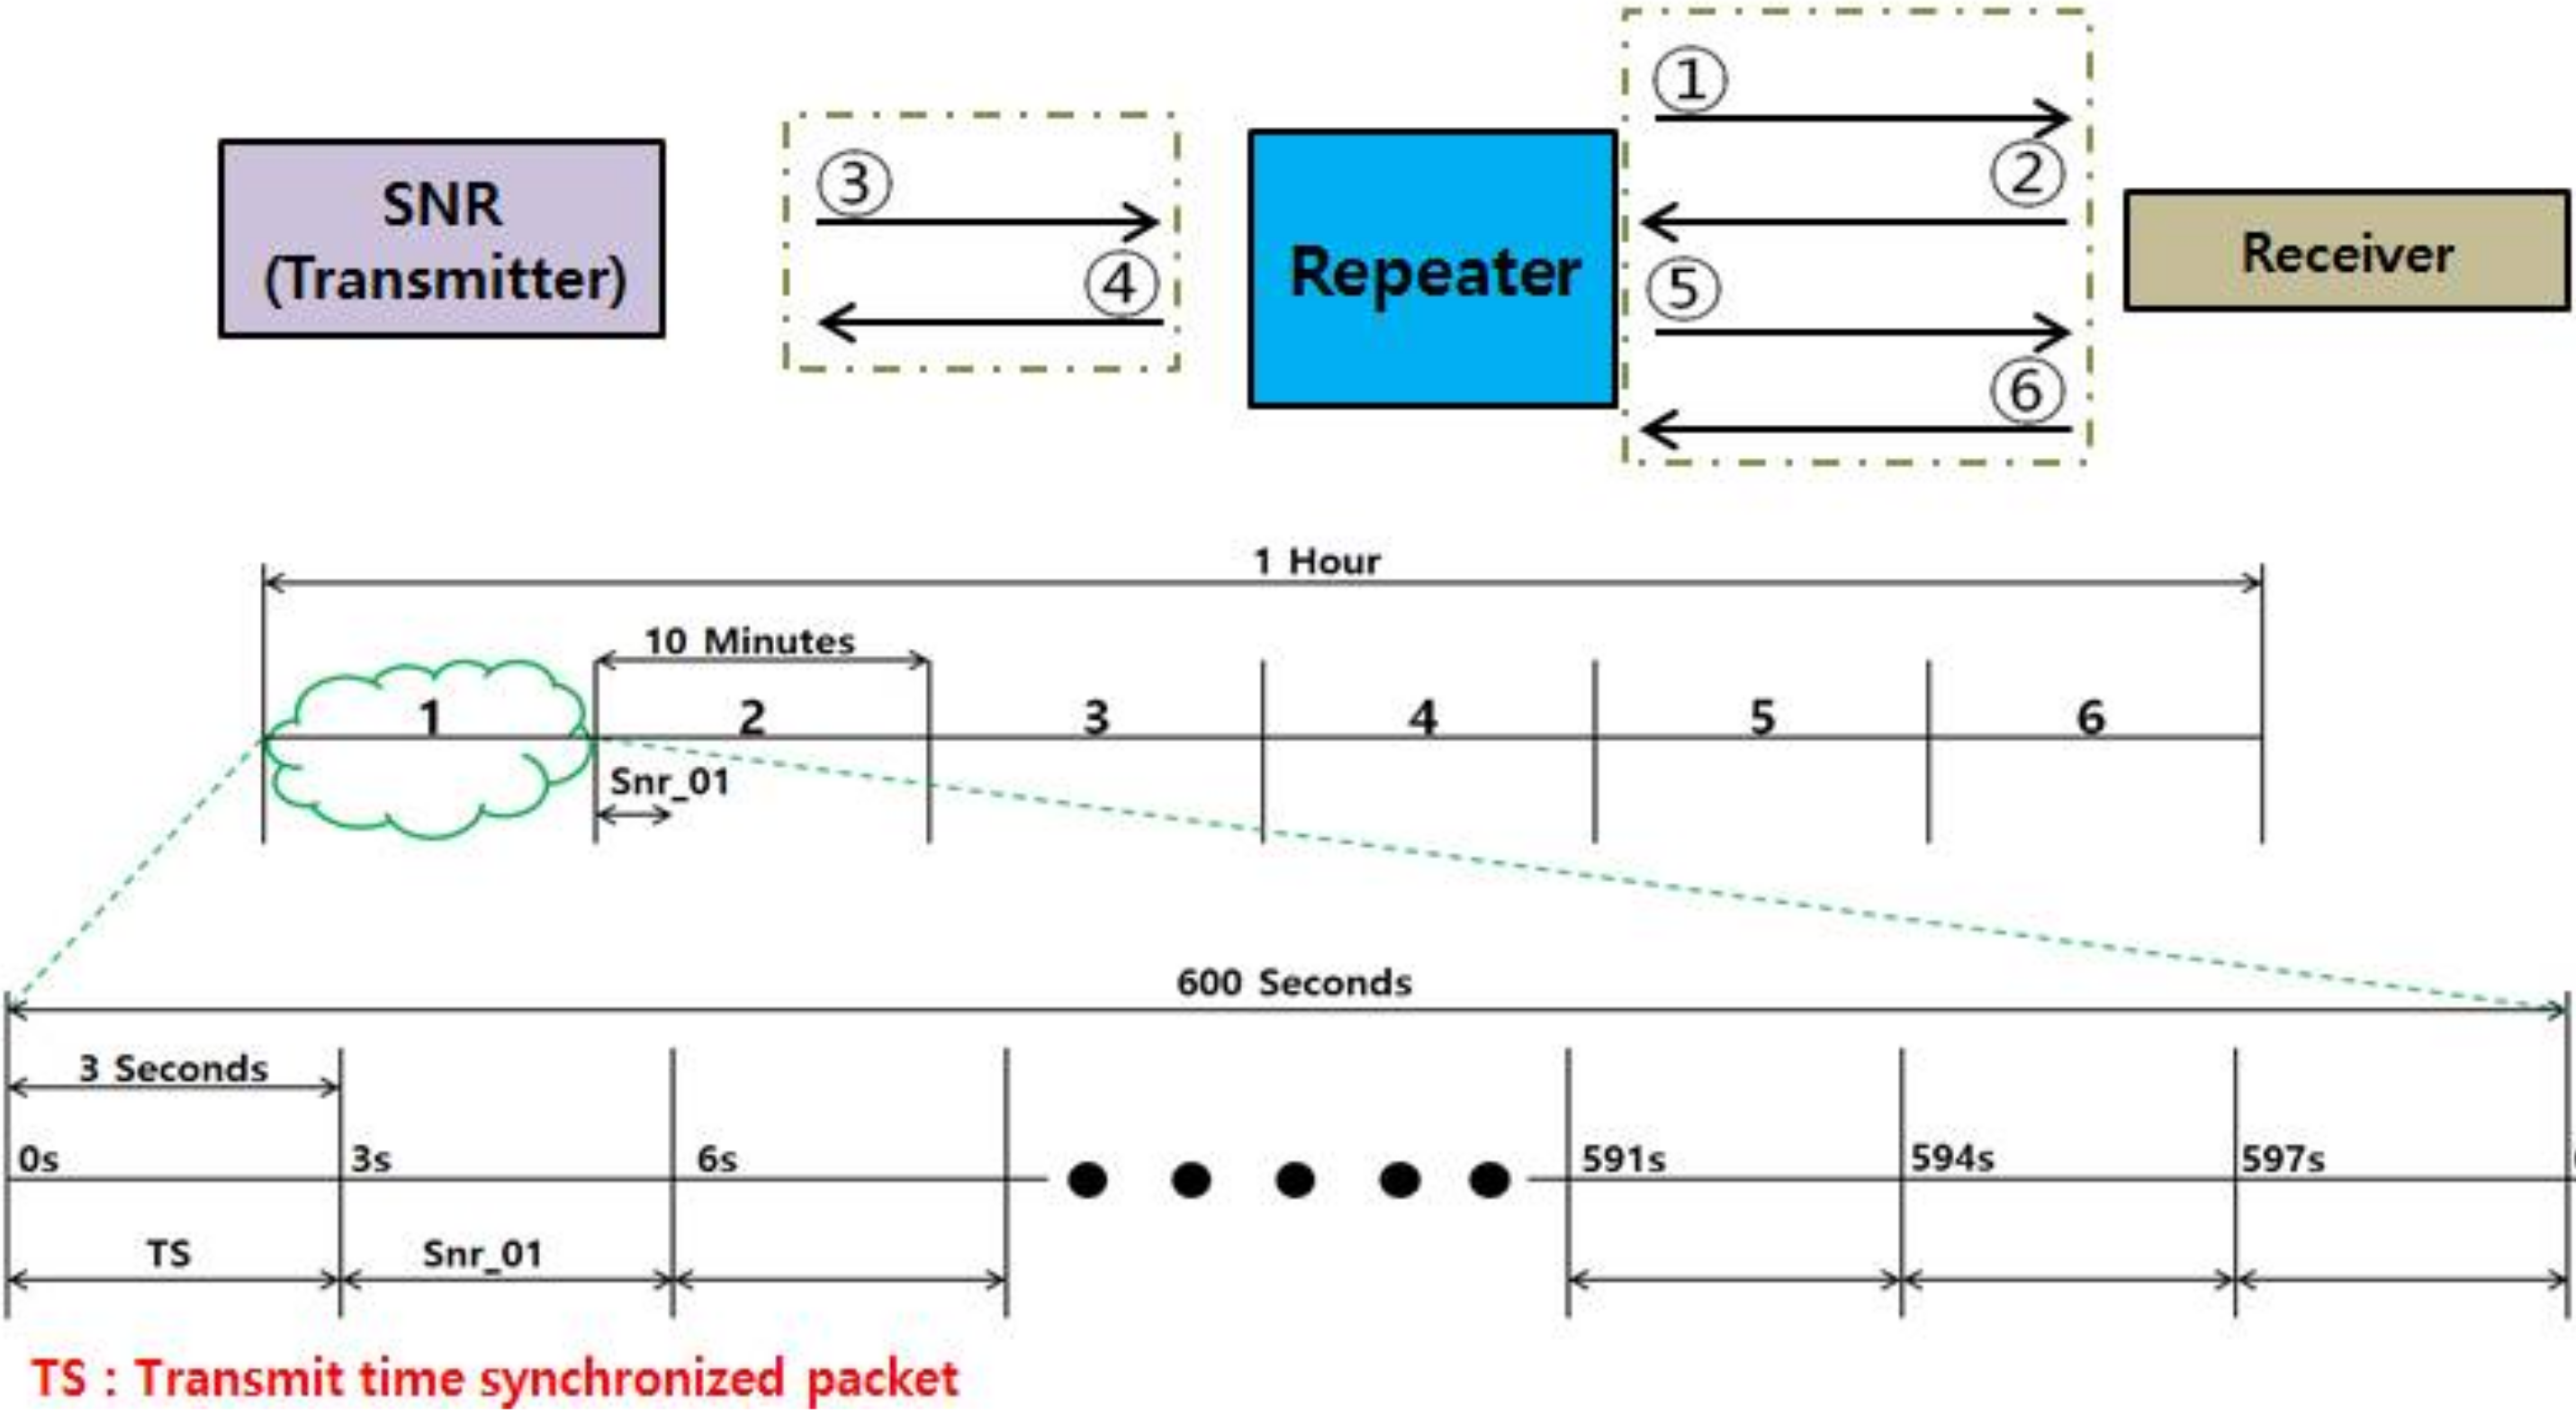
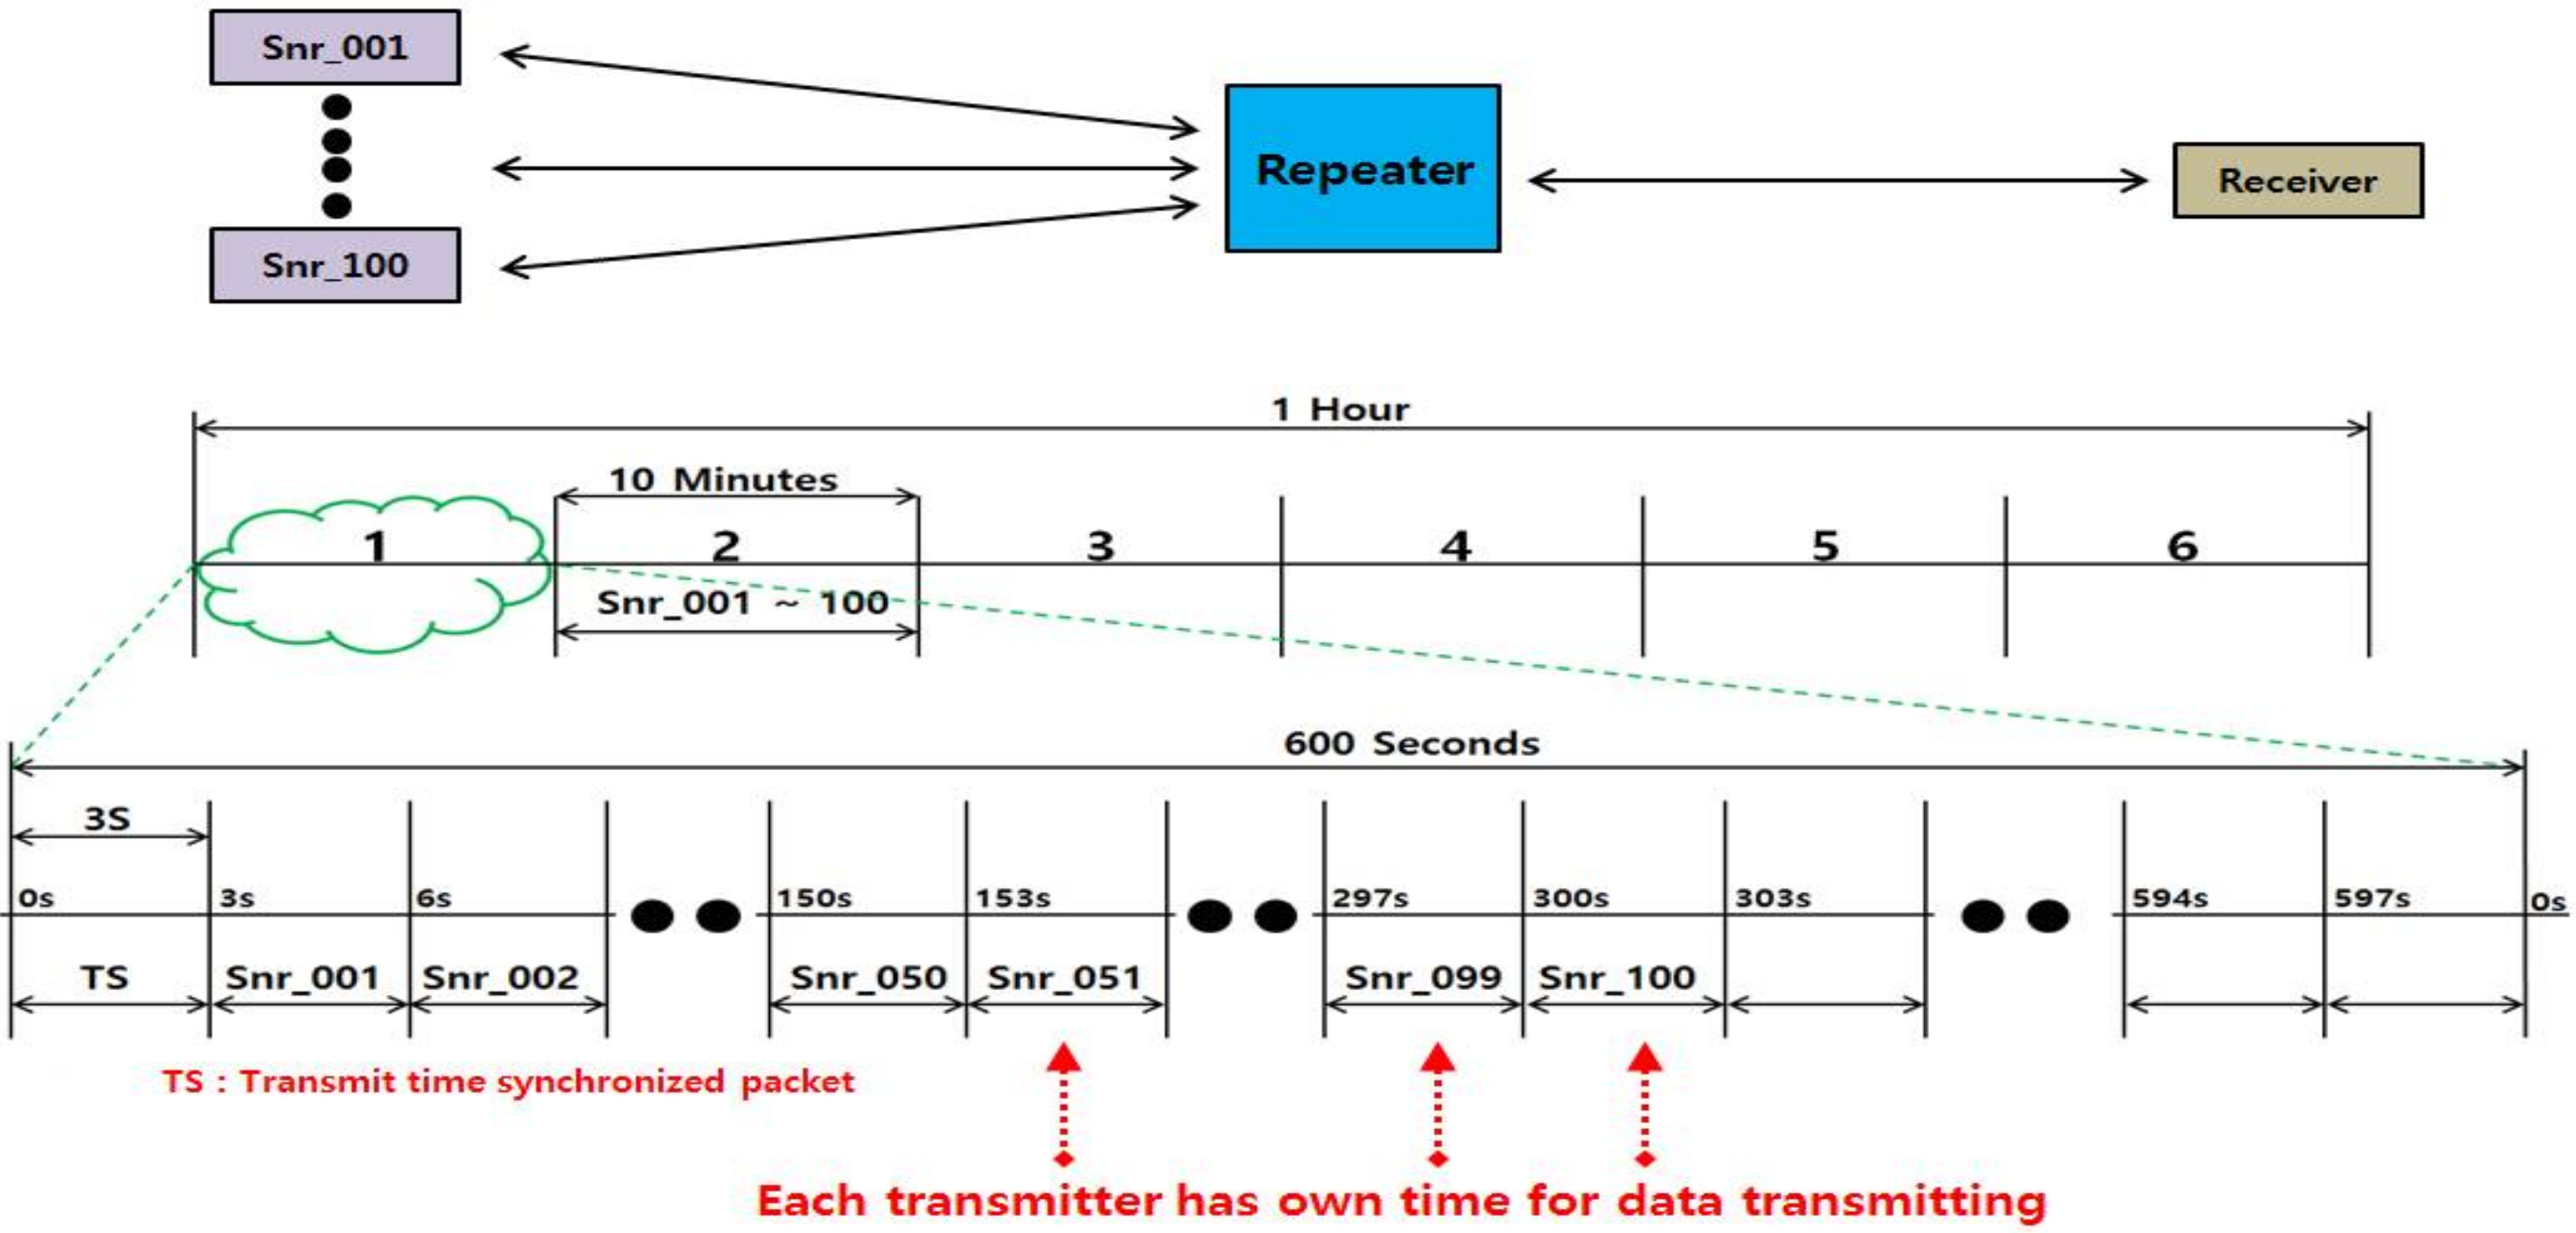
As shown in Figure 6, the receiver and each SNR use a program to measure the time to synchronize the data transmission cycle. However, if the data transmits and receives for a long time, data signal collisions and deviations occur at the same time in each transmitter. In order to solve this problem, each transmitter is synchronized by measuring time on each transmitter, and each transmitting time is revised by the receiver’s origin time, which is the correct method.
In Figure 7, each transmitter is performed by the program in its own time, but each transmitter’s data packaged by the algorithm with original time is allocated a data packet. The final data packet can prevent data collisions and deviations on multiple transmitters operations. The data collects in the data base in the main system from each sensor which resulted from a packet of single transmitter or multi transmitter format. In some cases of the data transmission, the repeater makes a multi transmission format in a 600-s time limit and the raw data format can cover one target cattle every three seconds, so one packet can cover 200 target cattle every ten minutes [30].
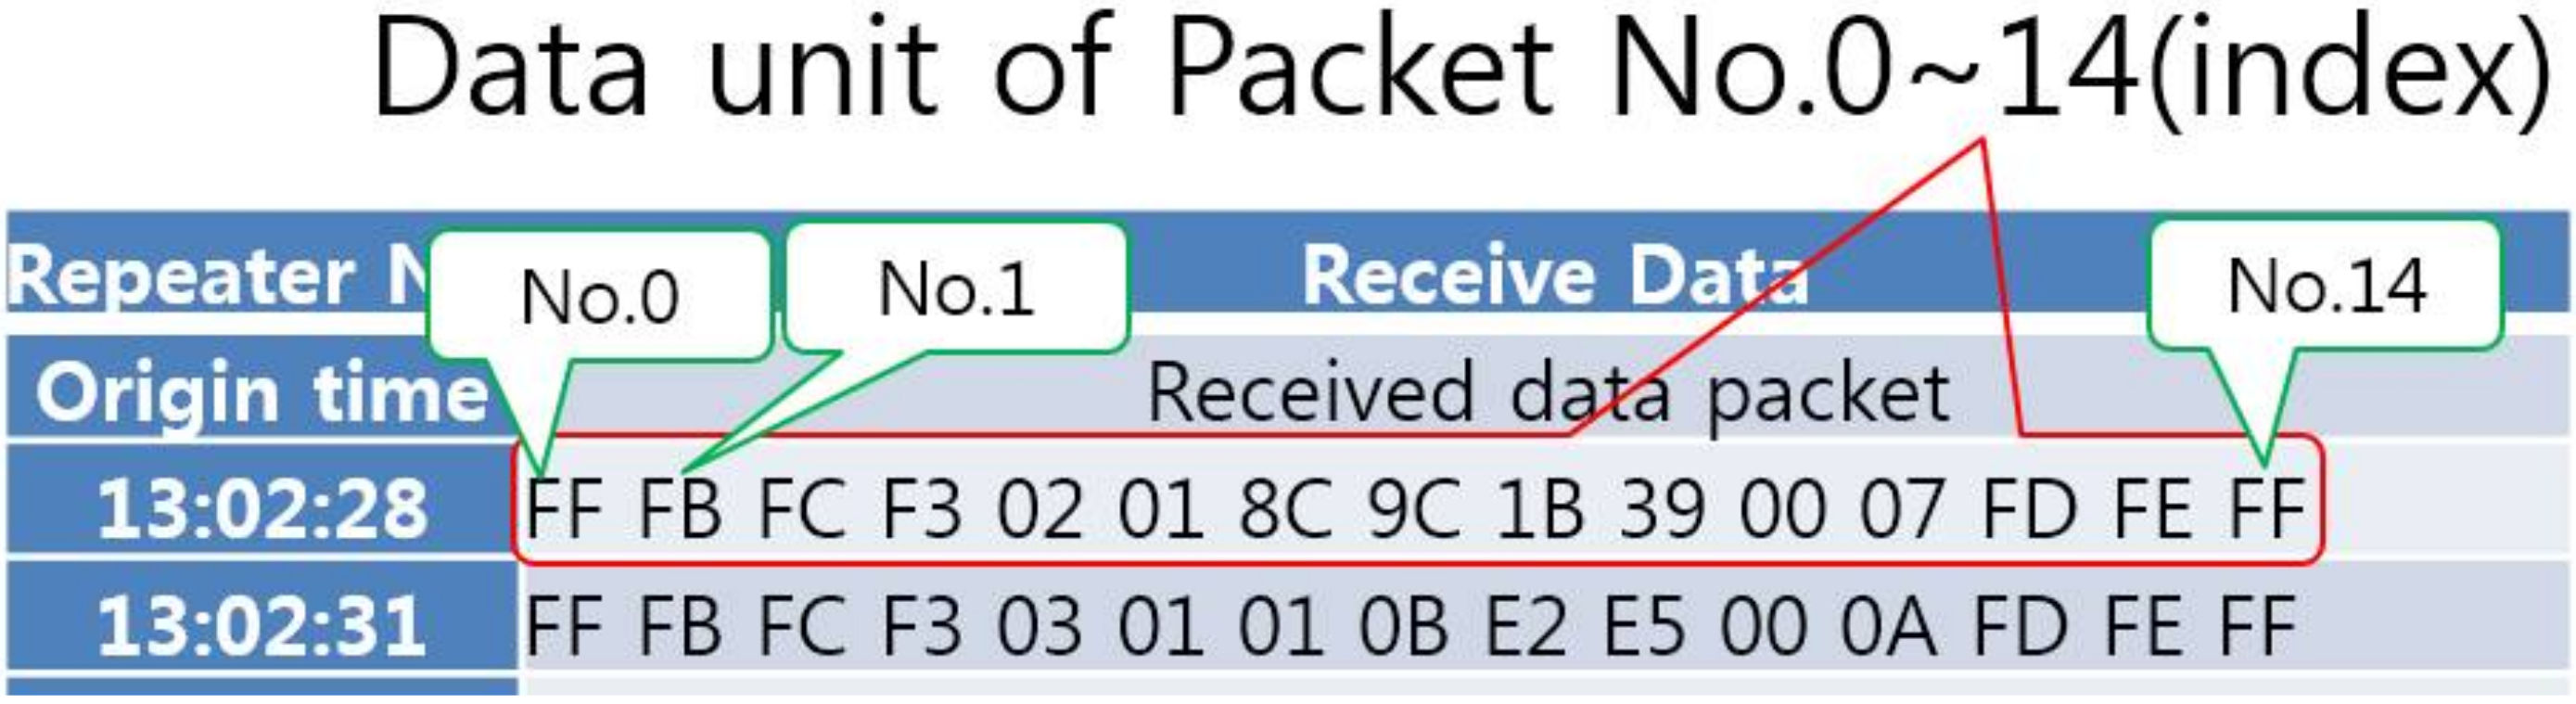
The main system (receiver) has a packet communication protocol as shown in Table 1 and Table 2. The data protocol has 15 units of packet. In this study, one kind of data is used, which is count number of physical activities of the targets. The packets could be extended, to such as temperature and humidity. The sensors of temperature and humidity need a lot of electric power for a long time operation. Thus, those sensors are not used in this study.
The communication code is shown in the Table 1, the first column is the original time, and the second column is the received data packet. There are 15 units in every data packet shown as Figure 8.
Table 2 interprets the unit formation by typical examples. The no. 0–2 units are for the Sync. from sensor, repeater and main system by wireless communication. The no. 3 is Sensor ID. The no. 4 is flag data for dividing from communication and activity data. The no. 5 is activity data which is accumulated from sensing unit time (NOW). The no. 6 is activity data which is accumulated from sensing unit time (Before 10 min). The no. 7 is activity data which is accumulated from sensing time (Before 20 min). The no. 8 is packet sequence number which is divide the packets from get a lot of sensors (at a same time the receiver can get a signal from many sensors at a same time, so the packet sequence information using for filtering of not-useful packets). The no. 9 is the check sum bit. The no. 10 and 11 are real time activities data (MSB and LSB). The no. 12 to 14 are end of communication Sync. Bit. After receiving the data, the main system performs the formalization the data with the data base software shown as Figure 9.
After receiving the data, the main system performs formalization of the data with the data base software as Figure 9.
Normally in livestock industrial field, the farmer needs an estrus [31] time of targets. The activity graph shows the most important information about the state of the target, so it could be possible to estimate insemination time [32].
Figure 10 is an activity graph about one target. The red line in the graph represents the average activity every seven days and the blue line is activity number within one day. Farmers can estimate the insemination time about the target with graph analysis. After formalizing the data, it is processed into information and analyzed by the software that can provide a customized service by the needs from the famers, researchers, government officers, supporters and etc. [33,34]. On a specific basis, the continuous collection of data regarding the amount of activity of the animals of the object has a role in distinguishing the animal from the object, such as fertilization, estrus, disease, fertility and other biological changes (water medicine). Therefore, one months of activity (band curve) and average activity (fast curve) Change has the most important meaning. For more specific judgment, one day of dramatic changes in the amount of activity, the change of activity (the Bohr icon) and the change of the average activity (red chart) are used as important information to determine the biological state of the animal, if the results of the analysis are used to isolate livestock by isolation, germination, disease and so on. Measures of protection and so on to enlargement the effect of animal husbandry.
4. Conclusions and Discussion
The platform and systems developed in this study provide a complete implementation of a momentum data collection system using solar power type of repeaters and sensors that collect data of physical activities in the process of feeding and breeding in grazing. The transmission platform was designed and its effectiveness was tested through experiments. The platform and system was verified in the Korea-cattle Experiment Station of National Rural Development Administration in Republic of Korea. This study may provide solutions to prevent the expected problems for changing environment of the livestock industry using different kinds of useful technologies in this field. The data of physical activities can be used for prevention of diseases and breeding managements. In this study, the expert system of veterinary judgment can be based on future technical research. The current system is the processing of the collected data, as veterinary experts and other experts can determine the basic data of the biological status of livestock. In order to monitor the activity of livestock, the information collection system suitable for animal husbandry environment is set up, and the information collected by quantitative analysis is used to reflect the combination of different technologies and use it for the purpose of industry. The proposed system is the first step considering several multiple issues to human and animals by different methods with the convergence of technology.
The platform of the system solved the problems about sensing the target’s active-moment, transferring the data to a main system and energy supply with solar panels. The data analysis will be defined by animal experts or famers, so the system is partly automated to management of the target’s state. In the future, the system should be fully automatic system with other physical and bio sensors and expert’s knowledge by IT technology. The convergence technology should be popularized more quickly to solve problems such as power consumption, collection of the different kind of data, increment number of targets, etc. Once the system is stabilized, the data mapping algorithm with artificial intelligence, IoT, Big-DATA technology and expert-knowledge can be added and applied on the system for monitoring several events such as diseases, insemination and delivery of the target.
Author Contributions
Conceptualization, J.K. and L.Z.; Methodology, J.K.; Software, J.K.; Validation, L.Z., J.K. and Y.L.; Formal Analysis, L.Z.; Investigation, J.K.; Resources, J.K.; Data Curation, Y.L.; Writing-Original Draft Preparation, L.Z.; Writing-Review & Editing, J.K. and L.Z.; Visualization, Y.L.; Supervision, J.K.; Project Administration, J.K.
Funding
This research received no external funding.
Conflicts of Interest
The authors declare no conflict of interest.
References
- Nakade, K.; Ikeuchi, K. Optimal ordering and pricing on clearance goods. Int. J. Ind. Eng. 2016, 23, 155–165. [Google Scholar]
- Neethirajan, S. Recent advances in wearable sensors for animal health management. Sens. Bio-Sens. Res. 2017, 12, 15–29. [Google Scholar] [CrossRef]
- Hahm, T.S. A Legal study on trends and issues of animal law in the US—Focusing on criminal issues. Study Am. Const. 2015, 26, 337–378. [Google Scholar]
- Jung, K.S. The efficient policy programs of the livestock pollution abatement. Korean J. Agric. Manag. Policy 2001, 28, 167–185. [Google Scholar]
- Jang, W.K. Improvement of livestock environment for the livestock’s epidemic. In Proceedings of the Spring Conference of the Korean Journal of Environment Agriculture, Daejeon, Korea, 17 May 2011; pp. 3–23. [Google Scholar]
- Kim, G.N. The National Guide for Raising of Korean Cow; Ministry of Agriculture, Food and Rural Affairs: Guelph, ON, Canada, 2002; pp. 86–90. [Google Scholar]
- Chen, Y.; Shang, J. Disconnect analysis and influence factors of animal husbandry in China. China Popul. Resour. Environ. 2014, 24, 101–107. [Google Scholar]
- Park, M.S. Structural change in agriculture—Raw data analysis of 2005 agricultural census report 2005. Coop. Manag. Rev. 2005, 37, 1–28. [Google Scholar]
- Keshtgari, M.; Deljoo, A. A wireless sensor network solution for precision agriculture based on Zigbee technology. Wirel. Sens. Netw. 2012, 4. [Google Scholar] [CrossRef]
- Othman, M.F.; Shazali, K. Wireless sensor network applications: A study in environment monitoring system. Procedia Eng. 2012, 41, 1204–1210. [Google Scholar] [CrossRef]
- Kwong, K.H.; Wu, T.T.; Goh, H.G.; Sasloglou, K.; Stephen, B.; Glover, I.; Shen, C.; Du, W.; Michiel, C.; Andonovic, I. Implementation of herd management systems with wireless sensor networks. IET Wirel. Sens. Syst. 2011, 1, 55–65. [Google Scholar] [CrossRef]
- Yoon, M.; Chang, J.W. Design and implementation of an advanced cattle shed management system using an infrared wireless sensor nodes and surveillance camera. J. Korea Contents Assoc. 2010, 12, 22–34. [Google Scholar] [CrossRef]
- Kim, Y.B.; Choi, D.W. Design of business management system for livestock pens based of IoT. J. Korean Entertain. Ind. Assoc. 2014, 8, 207–216. [Google Scholar] [CrossRef]
- Park, M.C.; Ha, O.K. Development of effective cattle health monitoring system based on biosensors. Adv. Sci. Technol. 2015, 117, 180–185. [Google Scholar]
- Kim, H.G.; Yang, C.J.; Yoe, H. Design and implementation of livestock disease forecasting system. J. Korean Inst. Commun. Inf. Sci. 2012, 37, 1263–1270. [Google Scholar] [CrossRef]
- Muhammad, F.; Thar, B.; Masood, K.A.; Babar, S.; Saiqa, A.; Francis, C. Context mining of sedentary behaviour for promoting self-awareness using a smartphone. Sensors 2018, 18, 874. [Google Scholar] [CrossRef]
- Muhammad, F. Alert Me: Enhancing active lifestyle via observing sedentary behavior using mobile sensing systems. In Proceedings of the 2017 IEEE 19th International Conference on e-Health Networking, Applications and Services (Healthcom), Dalian, China, 12–15 October 2017. [Google Scholar]
- Fahim, M.; Khattak, A.M.; Baker, T.; Chow, F.; Shah, B. Micro-context recognition of sedentary behaviour using smartphone. In Proceedings of the 2016 Sixth International Conference on Digital Information and Communication Technology and its Applications (DICTAP), Konya, Turkey, 21–23 July 2016. [Google Scholar]
- Senthilnath, J.; Harikumar, K.; Suresh, S. Dynamic area coverage for multi-UAV using distributed UGVs: A two-stage density estimation approach. In Proceedings of the Conference: IEEE International Conference on Robotic Computing, Laguna Hills, CA, USA, 31 January–2 February 2018. [Google Scholar]
- Gong, D.; Yang, Y. Low-latency sinr-based data gathering in wireless sensor networks. IEEE Trans. Wirel. Commun. 2014, 13, 3207–3221. [Google Scholar] [CrossRef]
- Chang, Y.S.; Lin, Y.S.; Wu, N.C.; Shin, C.H.; Cheng, C.H. Scenario planning and implementing of a dairy cattle UHF RFID management system. Proceedings of 2013 4th International Asia Conference on Industrial Engineering and Management Innovation (IEMI2013); Springer: Berlin/Heidelberg, Germany, 2014; pp. 643–654. [Google Scholar]
- Gutiérrez, A.; Dopico, N.I.; González, C.; Zazo, S.; Jiménez-Leube, J.; Raos, I. Cattle-powered node experience in a heterogeneous network for localization of herds. IEEE Trans. Ind. Electron. 2013, 60, 3176–3184. [Google Scholar] [CrossRef]
- RFM69HCW Datasheet, HOPERF. Available online: http://www.hoperf.com/upload/rf/RFM69HCW-V1.1.pdf (accessed on 22 April 2018).
- Senthilnath, J.; Kandukuri, M.; Dokania, A.; Ramesh, K.N. Application of UAV imaging platform for vegetation analysis based on spectral-spatial methods. Comput. Electron. Agric. 2017, 140, 8–24. [Google Scholar] [CrossRef]
- Wadhwa, L.K.; Deshpande, R.S.; Priye, V. Extended shortcut tree routing for ZigBee based wireless sensor network. Ad Hoc Netw. 2016, 37, 295–300. [Google Scholar] [CrossRef]
- Wei, K.M.; Dong, M.X.; Weng, J.; Shi, G.Z.; Ota, K.R.; Xu, K. Congestion-aware message forwarding in delay tolerant networks: A community perspective. Concurr. Comput. Pract. Exp. 2015, 27, 5722–5734. [Google Scholar] [CrossRef]
- Mavromoustakis, C.X.; Karatza, H.D. Real-time performance evaluation of asynchronous time division traffic-aware and delay-tolerant scheme in ad hoc sensor networks. Int. J. Commun. Syst. 2010, 23, 167–186. [Google Scholar] [CrossRef]
- Bali, R.S.; Kumar, N.; Rodrigues, J.J.P.C. An efficient energy-aware predictive clustering approach for vehicular ad hoc networks. Int. J. Commun. Syst. 2017, 30, e2924. [Google Scholar] [CrossRef]
- Wei, K.; Guo, S.; Zeng, D.; Xu, K. A multi-attribute decision making approach to congestion control in delay tolerant networks. In Proceedings of the IEEE International Conference on Communications (ICC), Sydney, Australia, 10–14 June 2014; pp. 2748–2753. [Google Scholar]
- Kim, S.J.; Jee, S.H.; Cho, H.C.; Kim, C.S.; Kim, H.S. Implementation of unmanned cow estrus detection system for improving impregnation rate. J. Korean Acad. Ind. Coop. Soc. 2015, 16, 1–11. [Google Scholar] [CrossRef]
- Andersson, L.M.; Okada, H.; Miura, R.; Zhang, Y.; Yoshioka, K.; Aso, H.; Itoh, T. Wearable wireless estrus detection sensor for cows. Comput. Electron. Agric. 2016, 127, 101–108. [Google Scholar] [CrossRef]
- Bauckhage, C.; Kersting, K. Data mining and pattern recognition in agriculture. KI-Künstliche Intell. 2013, 27, 313–324. [Google Scholar] [CrossRef]
- Guo, Y.; Corke, P.; Poulton, G.; Wark, T.; Bishop-Hurley, G.; Swain, D. Animal behaviour understanding using wireless sensor networks. In Proceedings of the 31st IEEE Conference on Local Computer Networks, Tampa, FL, USA, 14–16 November 2006; pp. 607–614. [Google Scholar]
- Gutierrez-Galan, D.; Dominguez-Morales, J.P.; Cerezuela-Escudero, E.; Rios-Navarro, A.; Tapiador-Morales, R.; Rivas-Perez, M.; Dominguez-Morales, M.; Jimenez-Fernandez, A.; Linares-Barranco, A. Embedded neural network for real-time animal behavior classification. Neurocomputing 2018, 272, 17–26. [Google Scholar] [CrossRef]
Figure 1.
Operation Condition of the System in Grazing Area.

Figure 2.
Operation flowchart of the system in grazing area.

Figure 3.
Feature and installation of the SNR on a target (a) SNR, (b) Feature of the module, (c) Installation module on the target.
Figure 3.
Feature and installation of the SNR on a target (a) SNR, (b) Feature of the module, (c) Installation module on the target.

Figure 4.
The PCB circuit of SNR (a) Battery and transceiver, (b) Microprocessor and sensor.

Figure 5.
Installation of the repeater with solar panel, (a) Installation, (b) Installation result, (c) Repeater.
Figure 5.
Installation of the repeater with solar panel, (a) Installation, (b) Installation result, (c) Repeater.

Figure 6.
DATA Transmission in single repeater with single transmitter.

Figure 7.
DATA Transmission in single repeater with multi transmitter.

Figure 8.
Structure of DATA unit of packet.

Figure 9.
Analyzed information from the data in the Main system.

Figure 10.
Activities information analyzing of one target.


Table 1.
The Sample of raw data received from packet.
| Repeater No. [01] | Receive Data |
|---|---|
| Origin Time | Received Data Packet |
| 13:02:28 | FF FB FC F3 02 01 8C 9C 1B 39 00 07 FD FE FF |
| 13:02:31 | FF FB FC F3 03 01 01 0B E2 E5 00 0A FD FE FF |
| 13:02:34 | FF FB FC F3 04 01 0D 06 E4 EF 00 0C FD FE FF |
| 13:02:36 | FF FB FC F3 05 01 71 33 C5 62 00 0F FD FE FF |
| 13:02:39 | FF FB FC F3 06 01 55 68 1D D4 00 12 FD FE FF |
| 13:02:42 | FF FB FC F3 07 01 16 35 D8 1E 00 15 FD FE FF |
| 13:02:45 | FF FB FC F3 08 01 01 06 DE E1 00 18 FD FE FF |
| 13:02:49 | FF FB FC F3 09 01 0D 14 D5 F3 00 1B FD FE FF |
| 13:02:52 | FF FB FC F3 0A 01 03 27 CB F3 00 1E FD FE FF |
| 13:02:55 | FF FB FC F3 0B 01 06 1B 19 39 00 21 FD FE FF |
Table 2.
Definition of the packet units.
| Packet Buffer | Index No. | Meaning | Value | |
|---|---|---|---|---|
| Min. | Max. | |||
| RF TX Buffer | 0 | 0xFF (Start-Sync.-First check bit) | 252 | 252 |
| 1 | 0xFB (Start-Sync.-Mid. check bit) | 1 | 250 | |
| 2 | 0xFC (Start-Sync.-Final check bit) | 252 | 252 | |
| 3 | Sensor ID | 1 | 250 | |
| 4 | Flag Bits (DATA) | 0 | 127 | |
| 5 | Number of activities (present) | 0 | 250 | |
| 6 | Number of activities (before 10 Min.) | 0 | 250 | |
| 7 | Number of activities (before 20 Min.) | 0 | 250 | |
| 8 | Packet Sequence Number | 0 | 250 | |
| 9 | Check Sum | 0 | 250 | |
| 10 | Time data bit—MSB (counting the time) | |||
| 11 | Time data bit—LSB (counting the time) | |||
| 12 | 0xFD (End-Sync. check bit) | It can be extension. | ||
| 13 | 0xFE (End-Sync. check bit) | |||
| 14 | 0xFE (End-Sync. check bit) | |||
© 2018 by the authors. Licensee MDPI, Basel, Switzerland. This article is an open access article distributed under the terms and conditions of the Creative Commons Attribution (CC BY) license (http://creativecommons.org/licenses/by/4.0/).
Share and Cite
MDPI and ACS Style
Zhang, L.; Kim, J.; LEE, Y. The Platform Development of a Real-Time Momentum Data Collection System for Livestock in Wide Grazing Land. Electronics 2018, 7, 71. https://doi.org/10.3390/electronics7050071
AMA Style
Zhang L, Kim J, LEE Y. The Platform Development of a Real-Time Momentum Data Collection System for Livestock in Wide Grazing Land. Electronics. 2018; 7(5):71. https://doi.org/10.3390/electronics7050071
Chicago/Turabian StyleZhang, Liang, Jongwon Kim, and Yongho LEE. 2018. "The Platform Development of a Real-Time Momentum Data Collection System for Livestock in Wide Grazing Land" Electronics 7, no. 5: 71. https://doi.org/10.3390/electronics7050071
Note that from the first issue of 2016, this journal uses article numbers instead of page numbers. See further details here.