Phase Difference Measurement Method Based on Progressive Phase Shift


1
School of Aerospace Science and Technology, Xidian University, Xi’an 710071, China
2
Key Laboratory of Electronic Equipment Structure Design, Ministry of Education, Xidian University, Xi’an 710071, China
*
Author to whom correspondence should be addressed.
Electronics 2018, 7(6), 86; https://doi.org/10.3390/electronics7060086
Submission received: 15 May 2018
/
Accepted: 30 May 2018
/
Published: 1 June 2018
(This article belongs to the Special Issue All-Digital Time-Mode Approaches for Mixed Analog-Digital Signal Processing)
Abstract
:This paper proposes a method for phase difference measurement based on the principle of progressive phase shift (PPS). A phase difference measurement system based on PPS and implemented in the FPGA chip is proposed and tested. In the realized system, a fully programmable delay line (PDL) is constructed, which provides accurate and stable delay, benefitting from the feed-back structure of the control module. The control module calibrates the delay according to process, voltage and temperature (PVT) variations. Furthermore, a modified method based on double PPS is incorporated to improve the resolution. The obtained resolution is 25 ps. Moreover, to improve the resolution, the proposed method is implemented on the 20 nm Xilinx Kintex Ultrascale platform, and test results indicate that the obtained measurement error and clock synchronization error is within the range of ±5 ps.
1. Introduction
Precise measurements of phase differences are frequently required in applications of frequency synchronization, satellite navigation, laser ranging finders, communication networks and signal demodulation [1,2,3,4,5,6,7,8,9]. Phase difference measurement can be realized by many approaches. Digital signal processing, such as FFT (fast Fourier transformation) [4,7], the cross-correlation [3] and Kalman filtering [5], are widely used phase difference measurement method. However, these methods usually require a long time to perform the calculations. Phase comparison, which uses analog components to convert the phase difference into voltage, is another commonly used method. However, the method introduces voltage drift and A/D quantization error, which increases the measurement nonlinearity and measurement error. Precise measurement of phase differences is similar to a time-to-digital Converter (TDC). Measurement of phase differences is usually used to measure the phase difference between periodic signals, aiming at realizing accurate clock and data synchronization. However, in most conditions, TDC measures the time difference between physical events.
Most of TDCs or phase difference measurement systems suffer from the PVT (process, voltage and temperature) variations, especially systems implementing on FPGA (field programmable gate array) or ASIC (application specific integrated circuit) circuits. Therefore, the DLL (delay-locked-loop) structure is always employed to provide calibration against PVT variations [10,11,12]. Using a DLL, the time delay of delay unit is voltage-controlled and is locked to a reference period to reduce the impact of temperature and voltage variations, regardless of process variations. Reference [10] designed a TDC with embedded DLL, and it achieved a resolution of 10 ps. In references [11,12], DLL is used to lock the resolution against changes in temperature and the FPGA internal core voltage. The best resolution they obtained is 40 ps and 63.3 ps, respectively.
In this paper, a phase difference measurement method based on the principle of progressive phase shift is proposed and tested. The realized phase difference measurement system obtained a resolution of 25 ps. The method is insensitive to environment variations, which includes variations in the voltage and temperature. It is convenient to integrate on a single chip, such as an FPGA or ASIC chip. Furthermore, the proposed phase difference system can be used in clock data recovery and frequency estimations [4,13].
2. Principle of Progressive Phase Shift
The phase difference between two periodic signals with the same frequency can be calculated by time difference. Progressive phase shift (PPS) utilizes delay accumulation to quantify the time difference, as shown in Figure 1. In the figure, d is the phase difference between Signal_1 and Signal_2. The rising edges of the two signals are detected by the phase detection circuit. When the signals are not aligned, Signal_1 is delayed by τ until edge alignment of the two signals is detected. If the edge alignment is detected after m delays of τ have been performed. Then the measurement result of the phase difference can be obtained from the Equation (1).
Δt = m × τ
Though the principle of PPS is simple, difficulties exist in the implementation of the method. The first difficulty is that we must minimize the step delay (τ) to improve the measurement precision. Second, the delay linearity of the delay elements determines the measurement error of the method. A commonly used method to implement PPS is constructing a delay line. Delay lines can be constructed by digital or analog elements. However, analog circuits usually suffer from large area and poor environment stability. Hence, this paper uses digital circuits to construct the delay line.
Excited by the continuous development in CMOS technology, FPGA devices have become very popular for rapid system prototyping, logic emulation and reconfigurable computing because of their lower manufacturing cost and shorter development time. In the FPGA chip, flip flops, buffers and carry logics are usually used to realize signal delay [14]. However, the delay elements listed above are not easily controlled and the measurement range is limited because of the relatively large size at the state of being cascaded.
Many FPGA devices contain programmable delay elements in the I/O logic resources, which can provide adjustable and fine-resolution delay. The programmable delay elements can be used to realize the phase difference measurement method based on PPS. The programmable delay elements are programmable tap delay lines. In the Xilinx Virtex series FPGA chips, the primitive of the programmable delay element is IDELAY [15,16]. There are 64 delay taps in an IDELAY, and the tap delay is calibrated by the reference clock. The schematic diagram of the IDELAY is shown in Figure 2. The delay taps are voltage controlled delay elements, which are calibrated from the IDELAY control (IDELAYCTRL) module. The IDELAYCTRL module continuously calibrates the individual delay taps in its region, to reduce the effects of process, voltage, and temperature (PVT) variations. The IDELAYCTRL automatically changes the time delay over voltage and temperature to ensure the tap delays remain at the requested time. The individual tap delay of the IDELAY is determined by the frequency of the reference clock, which is calculated from (2). For the frequency of the reference clock, values from 190 MHz~210 MHz or 290 MHz~310 MHz are allowed, then the tap delay can be within the range of 75~82 ps or 50~54 ps. Hence, the resolution of the phase difference measurement can be 50 ps, and the measurement range of a single IDELAY is 3.2 ns.
To enlarge the measurement range, IDELAYs are cascaded into programmable delay lines (PDL). The structure of the design is shown in Figure 3. A total of 120 IDELAYs are cascaded into a line to delay Signal_1, tap by tap, which is controlled by the logic control circuit. An IDELAYCTRL module calibrates 40 IDELAY modules within its clock region, which is shown in Figure 2. The INC signal increases the number of taps to delay Signal_1, while CE enables the increase. The Rdy signal is used to judge whether the counter is full, and the Finish signal is used to enable and disable the counter. When the counter is full or edge alignment is detected, the Finish signal disables the counter and holds its value.
In the phase detection circuit, D flip-flops are used. However, if the setup and hold time of flip-flops are not satisfied, the flip-flop is into metastable state. The flip-flop can return to stable state from metastable state after a certain delay. Therefore, in the phase detection circuit, three D flip-flops are employed to generate the trigger of edge alignment, which is two clock periods later than the time of edge alignment and can eliminate the influence of metastable state to the system.
According to the architecture of the delay line, the delay linearity of delay elements is of great importance, which directly influences the measurement error. Poor linearity results in large measurement error. In this design, IDELAY’s tap delay provides an extraordinary linearity for the delay line because it is driven by an external fixed-frequency reference clock and uses a feed-back structure to calibrate the delay of each tap, which reduces and compensates for the influence of process, voltage and temperature (PVT) variations. Therefore, when the frequency of the reference clock is specified, the tap delay is with excellent delay linearity. The minimum delay a PDL can provide is 50 ps under 310 MHz. Then, the measurement error (ε) caused by edge alignment can be obtained by Equation (3).
ε = Δt − d (0 ≤ ε < 50 ps)
3. Principle of Double Progressive Phase Shift
According to the structure of the IDLEAY module, a relatively programmable delay is featured, and it has the ability of offering a tap delay in the range of 75~82 ps or 50~54 ps. Only a 50 ps tap delay is used in the method above. Hence, we consider whether other delays can be incorporated to improve the measurement resolution.
To improve the resolution, a modified method is introduced, which conducts multiple measurements. The timing diagram of the modified method is shown in Figure 4. The first measurement is carried out using the method described above. The second measurement is performed after Signal_1 has been delayed by τ/n, which means the phase difference is decreased by τ/n. Similarly, the third measurement is performed after Signal_1 has been delayed by 2τ/n. Measurements are performed n times in total. Therefore, the measurement result and measurement error can be calculated from Equations (3) and (4), where Δti and εi represents the measurement result and measurement error of the ith time, respectively, and εi satisfies 0 ≤ εi < τ. The first measurement error is marked as ε1, and the second measurement error ε2 can be calculated from (4). In (4), represents a real remainder operation and the return value is the remainder of x/y. Hence, it can be concluded that the measurement error εi can be calculated from (5), and the measurement error ε can be calculated from (6)–(8).
It is easy to find that is an arithmetic sequence with a common difference of by sorting the values from small to large. The minimum value of the sequence is . According to the summation formula of the arithmetic sequence, the sum of the sequence is less than . Equation (8) is reduced to a simpler form as shown in Equation (9), which can be simplified as .
Equation (9) proves that the modified method is an effective way to reduce the measurement error. Taking PDL’s delay characteristic into account, the 50 ps tap delay and the 75 ps tap delay can be used to realize a double PPS phase measurement method. When τ is 50 ps, an initial 75 ps delay for Signal_1 has the same effect with 25 ps in the second measurement. Then, the measurement error is reduced to τ/2 or 25 ps. Thus the measurement result of the double PPS can be obtained from Equation (10).
Then, two measurements should be performed to obtain Δt1 and Δt2. The logic control circuit calculates Δtj (j = 1, 2) according to Equation (11), where λ1 and λ2 represent the the initial state of the D flip-flops and the phase detection result, respectively. In Equation (11), M is the number of PDLs Signal_1 has passed through, m is the number of active taps in the Mth IDELAY, ci is the number of taps in the first M-1 IDELAYs, and T is the period of the measured signal.
4. Experiments Results
4.1. Setup of Experiments
For function verification and performance evaluation, Xilinx Virtex-5 FPGA chip is adopted for circuit implementation. The evaluation board ML507 (designed by Xilinx Inc., San Jose, CA, USA) is used. We use an oven-controlled crystal oscillator (OCXO) with a frequency of 25 MHz as the reference clock of the board. The reference clock of the IDELAYCTRL module is generated by the PLL (phase-locked loop) module inside the FPGA, which is realized by multiplying or fractionally dividing the reference clock [14]. The phase difference measurement evaluation board communicated with the PC via PCI express.
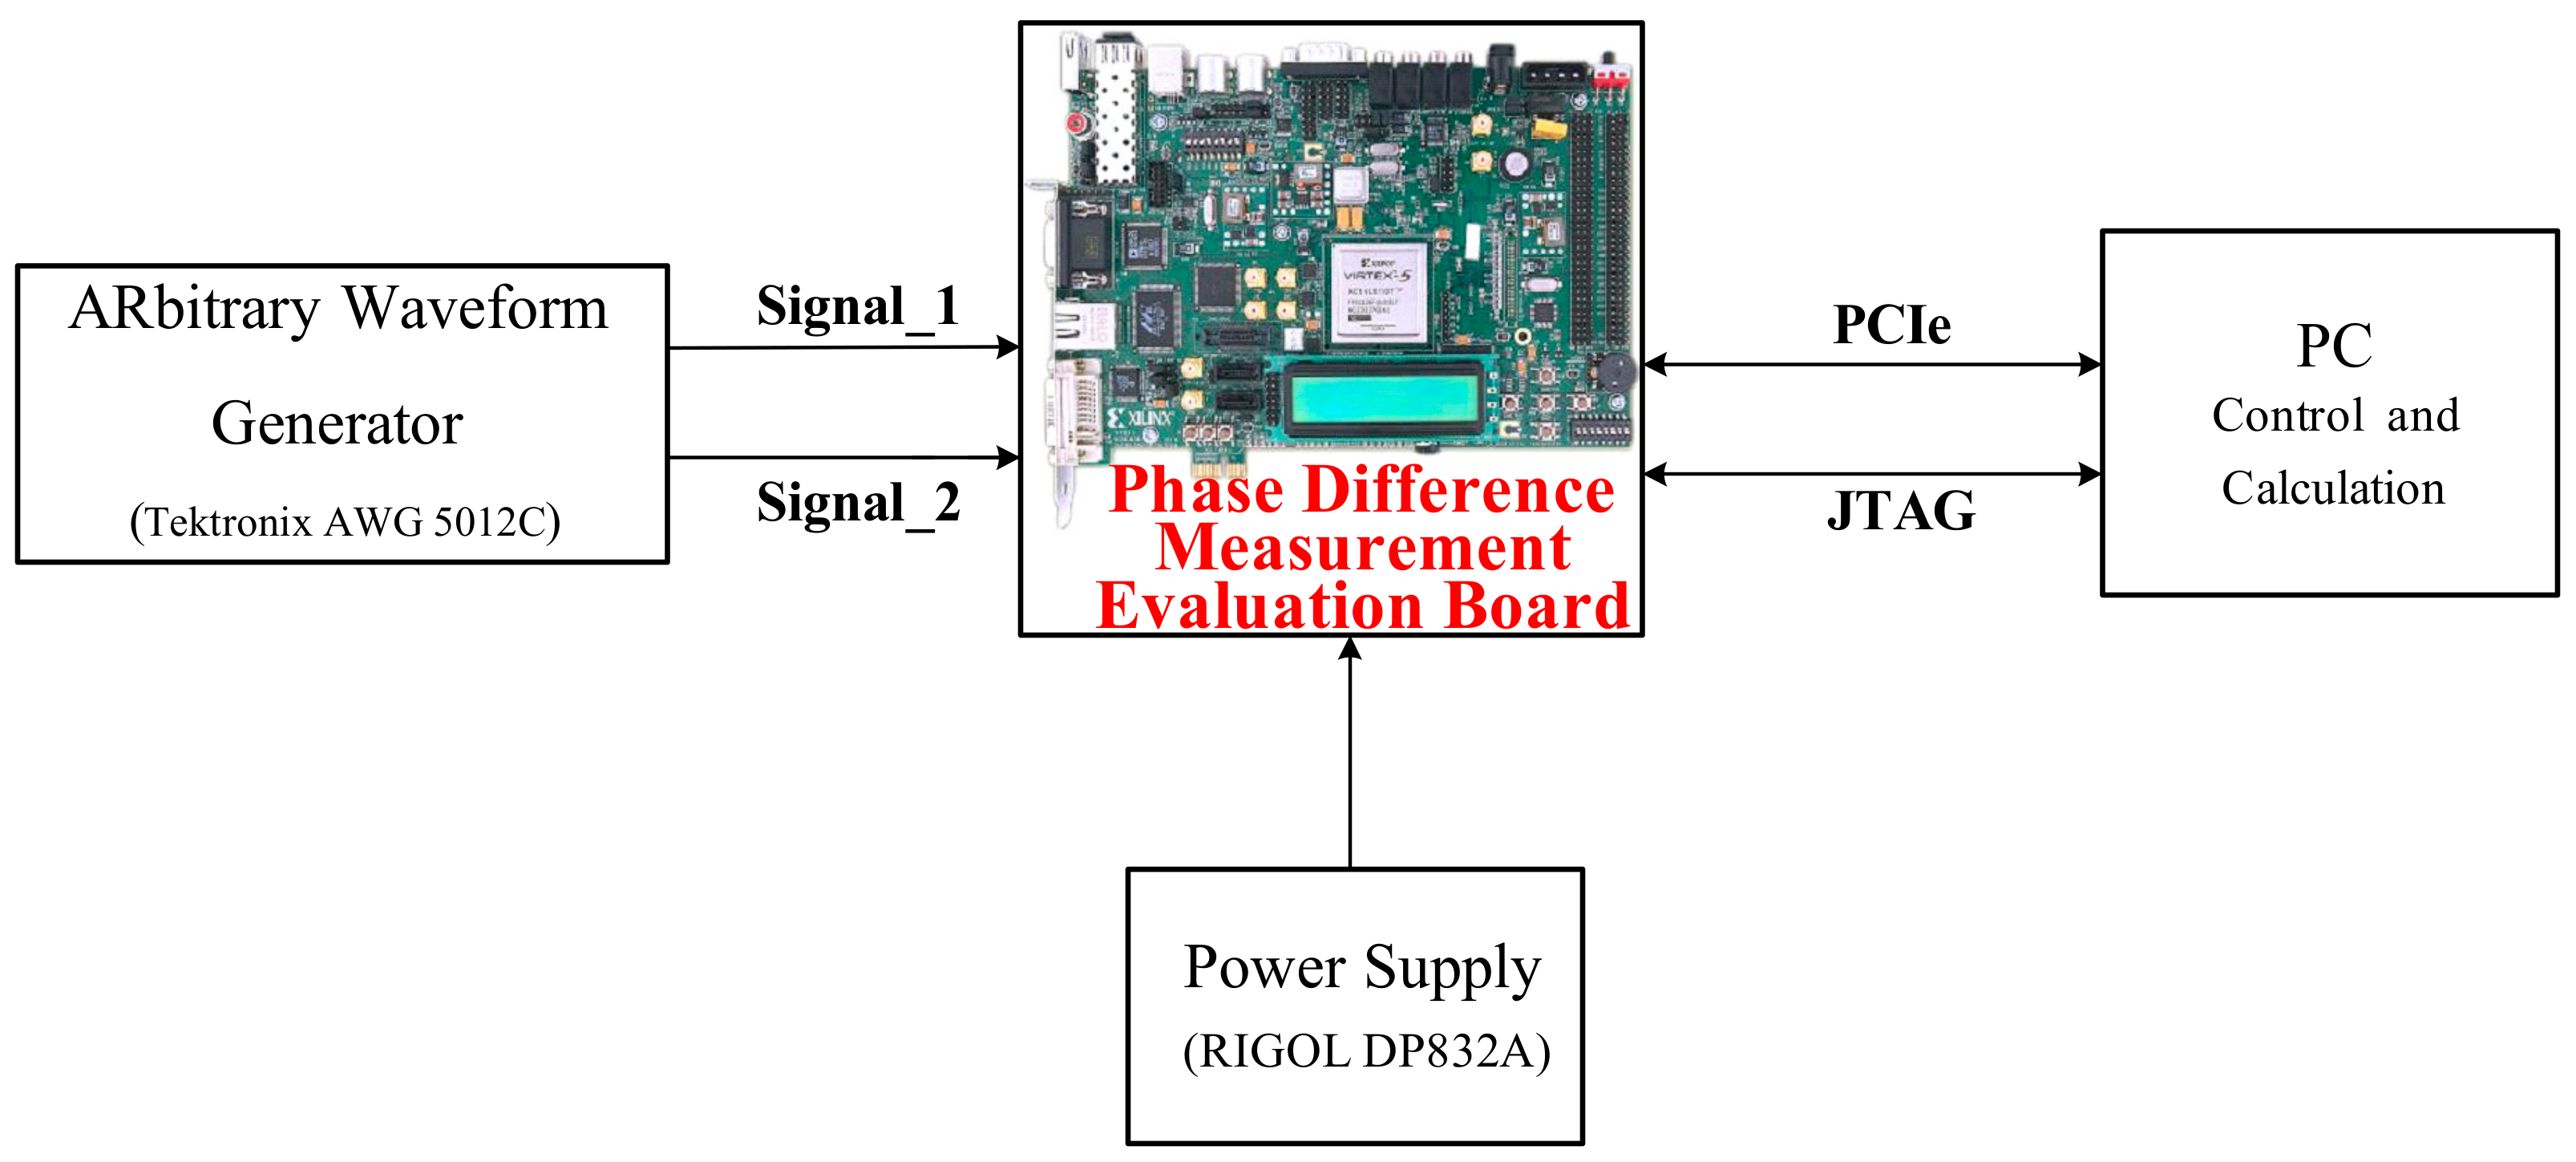
The test bench of the proposed phase difference measurement system is shown in Figure 5. An arbitrary waveform generator (Tektronix AWG 5012C) is employed to generate the phase difference signals, and the phase difference signal is input through the SMA connector, which has the advantage of low noise and impedance. The power of the board is supplied by DC power supply RIGOL DP832A.
4.2. Test Results of Measurement Error and Stability
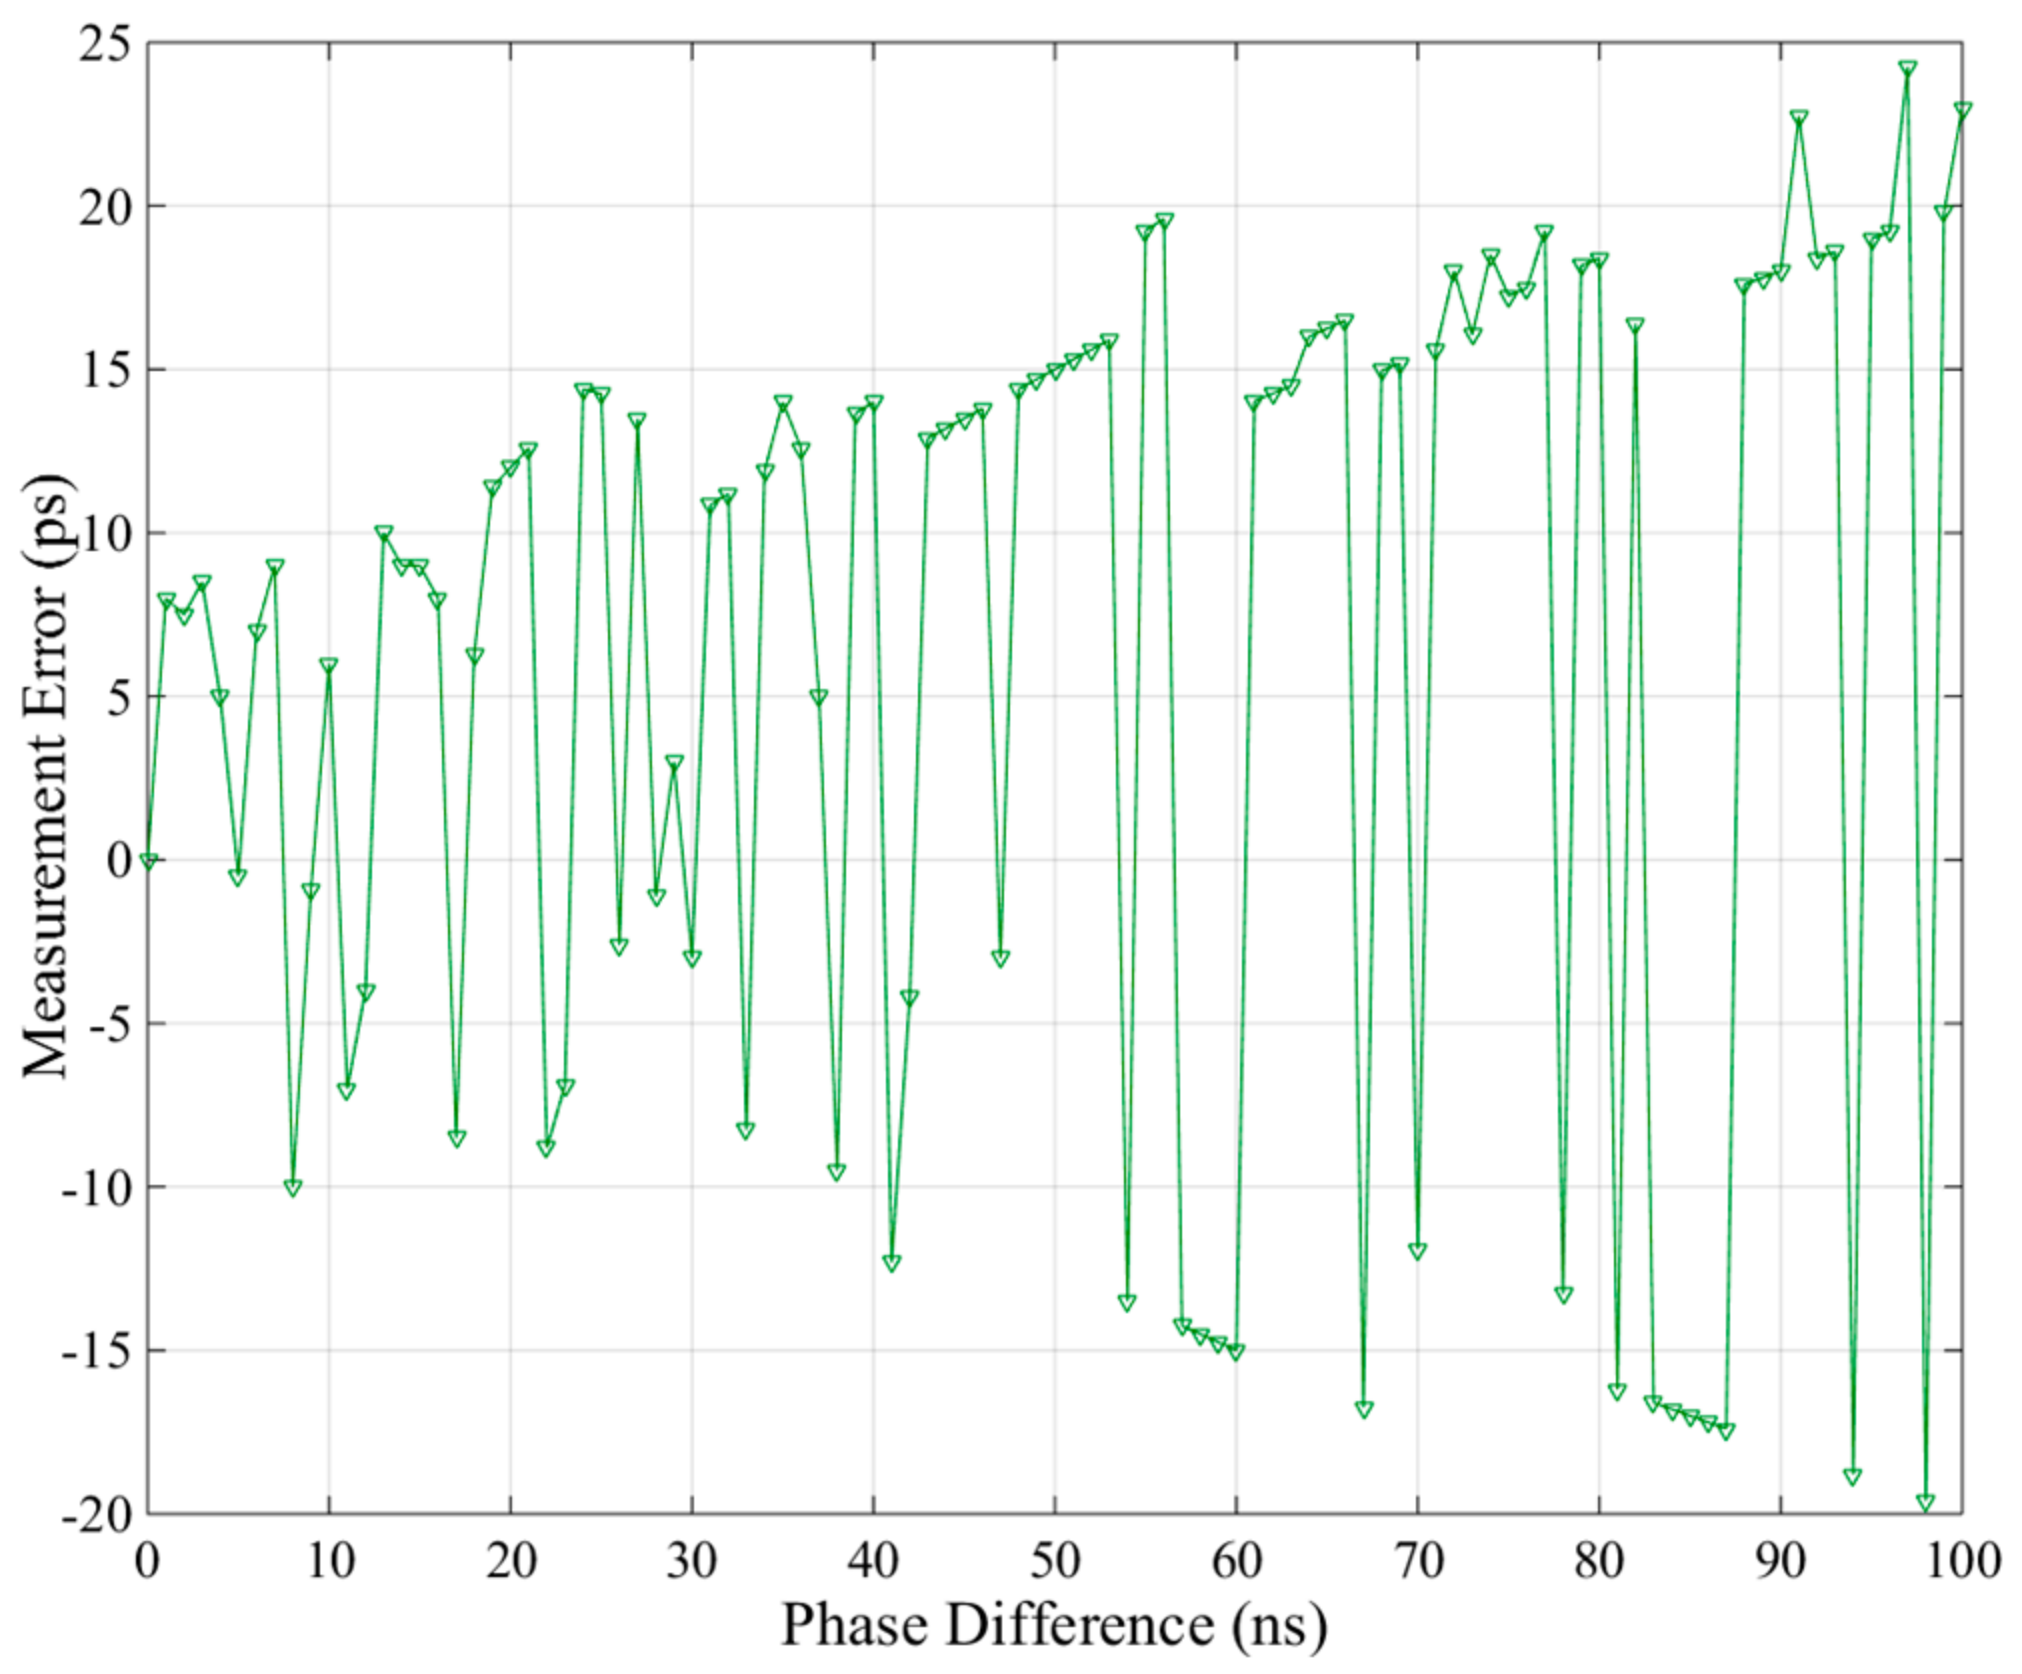
Experiments are conducted to evaluate the performance of the proposed phase difference measurement system based on double PPS. In the experiments, phase differences differing by 1 ns in the range of 0 ns~100 ns are produced. Figure 6 shows the measurement error. In the figure, the largest measurement error is 24.5 ps, and all the measurement errors are less than 25 ps. The measurement error presents a slight increase with the increase in the phase difference, which we think is caused by the phase difference generator.
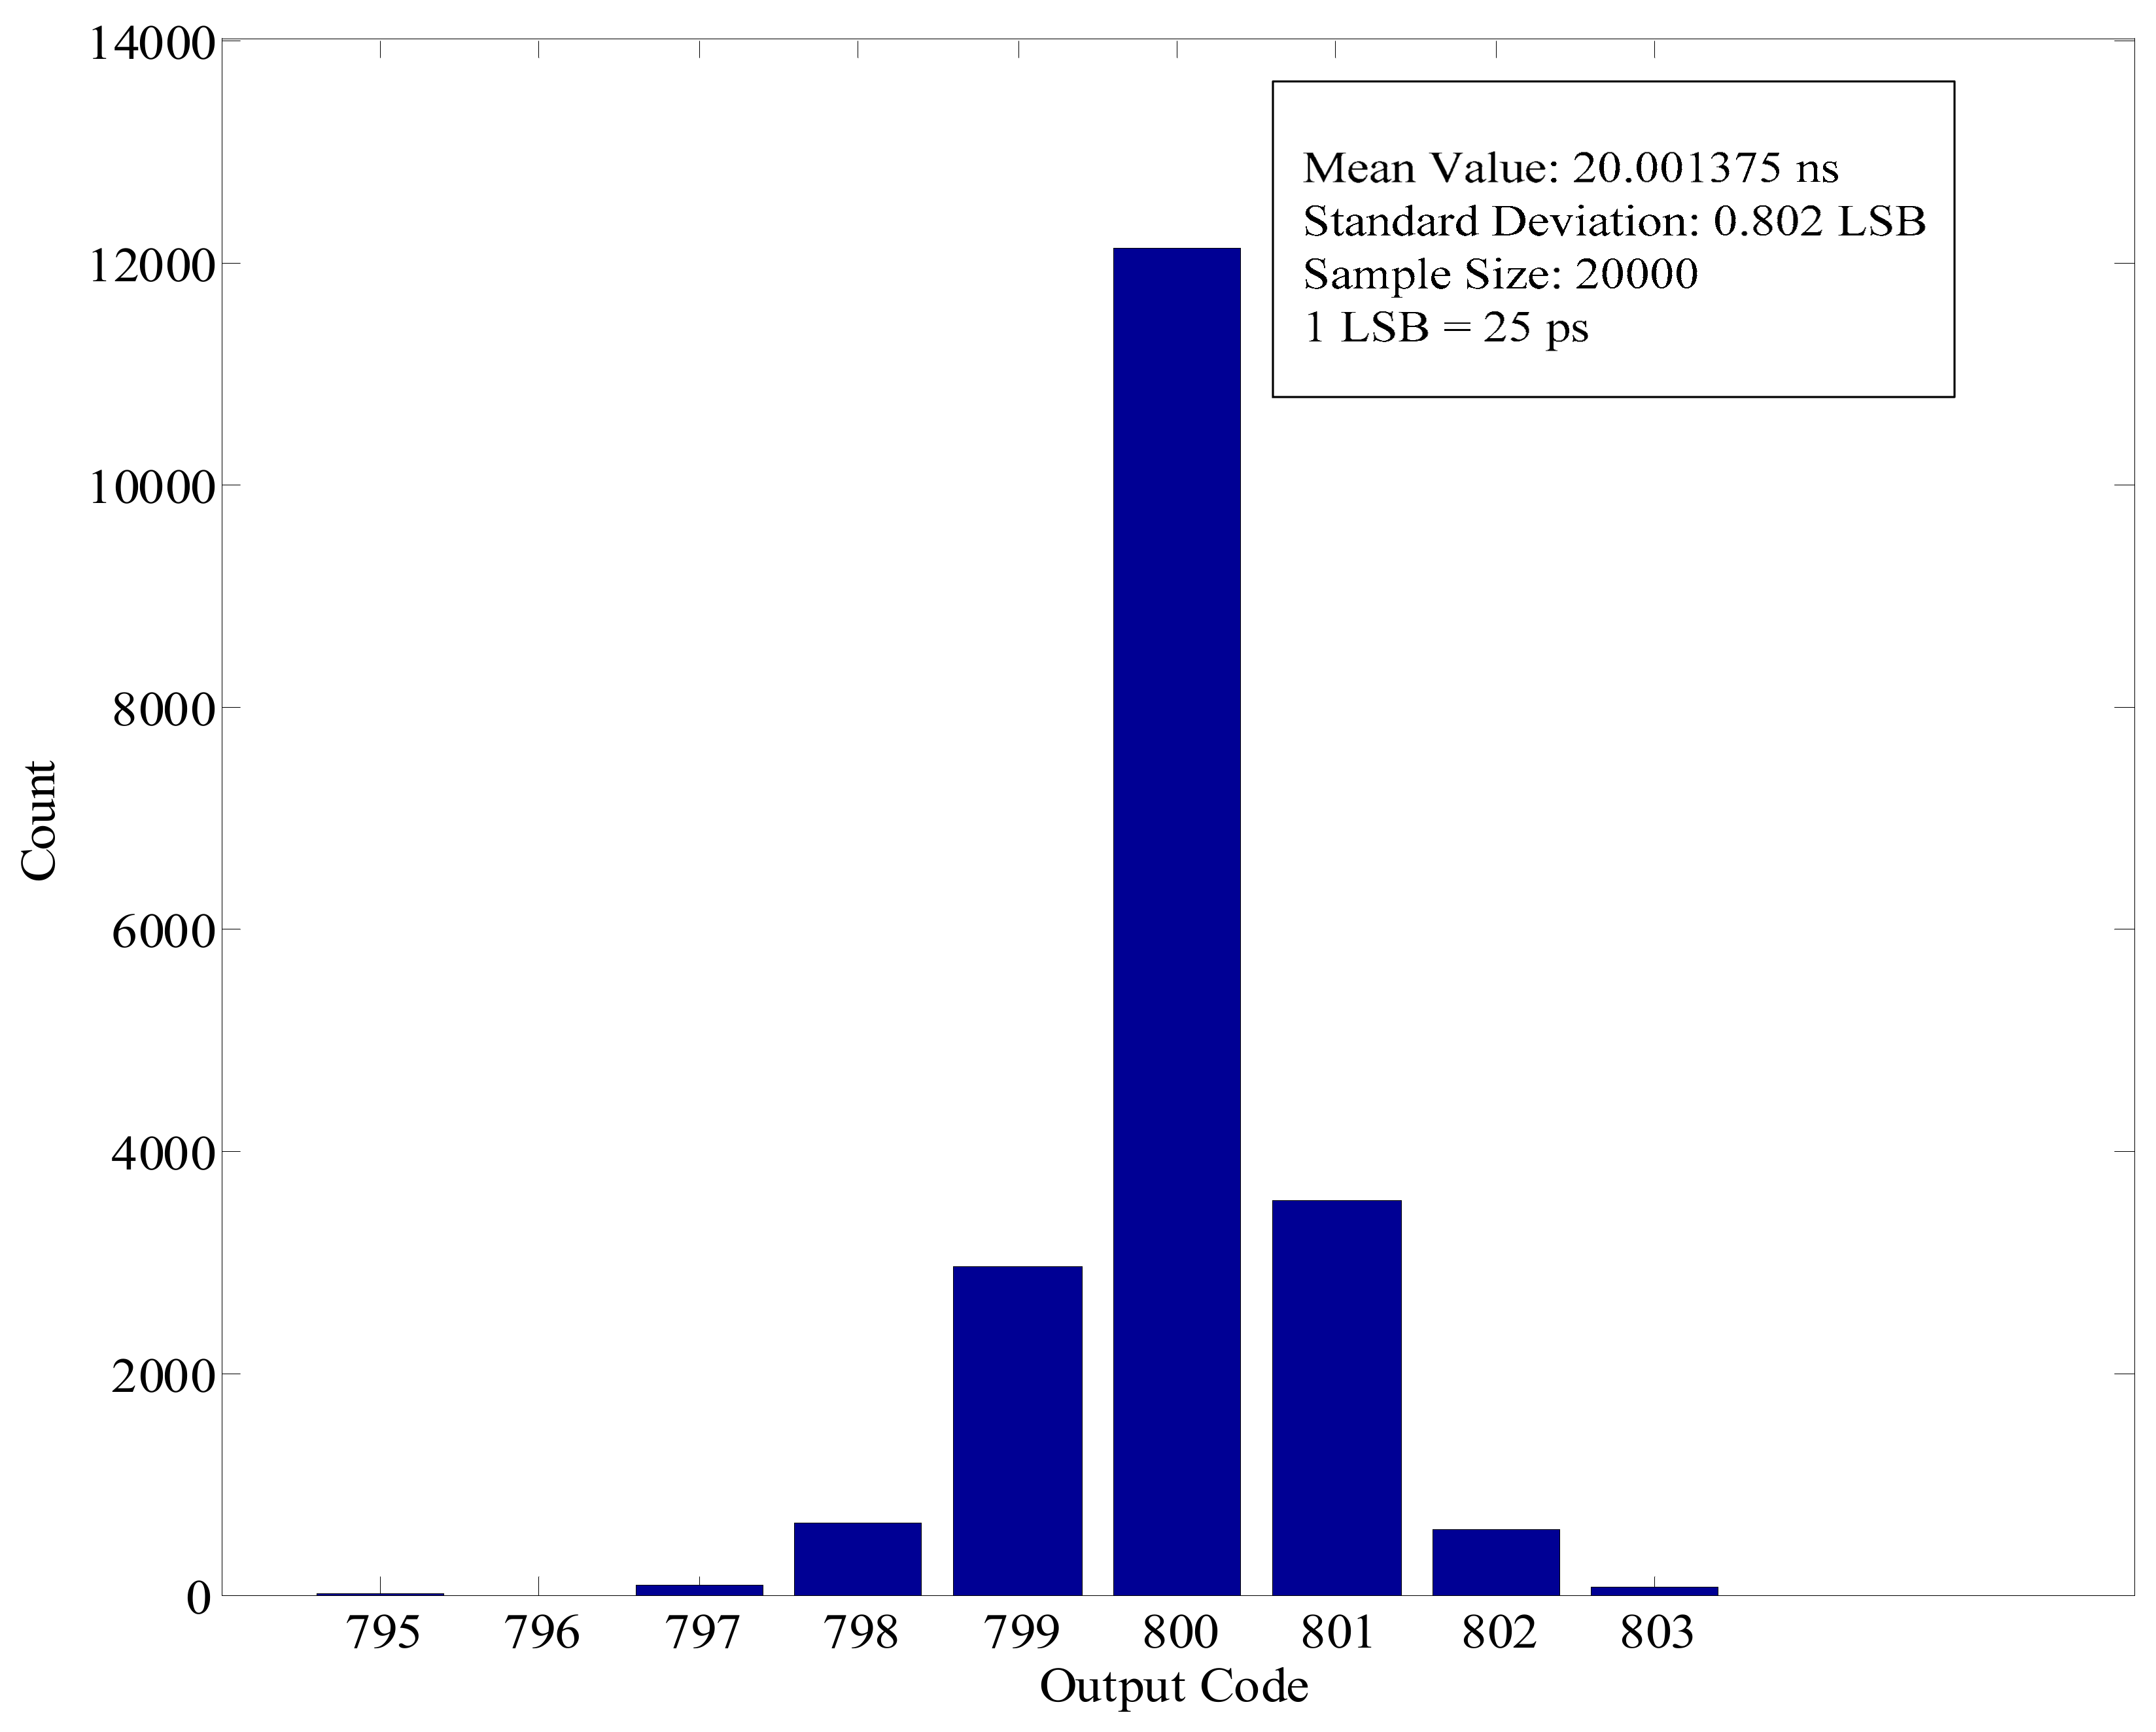
Experiments are also conducted to evaluate the measurement stability of the realized phase difference measurement system. The phase difference signal with a constant phase difference of 20 ns is measured for 20,000 times. The distributions of measurement results are shown in Figure 7. The standard deviations are 0.802 LSB (1 LSB = 25 ps). In the equation, ϭ is the standard deviation, Xi is the measurement result of the ith time, and N is the measurement time.
4.3. Temperature and Voltage Stability of the Proposed System
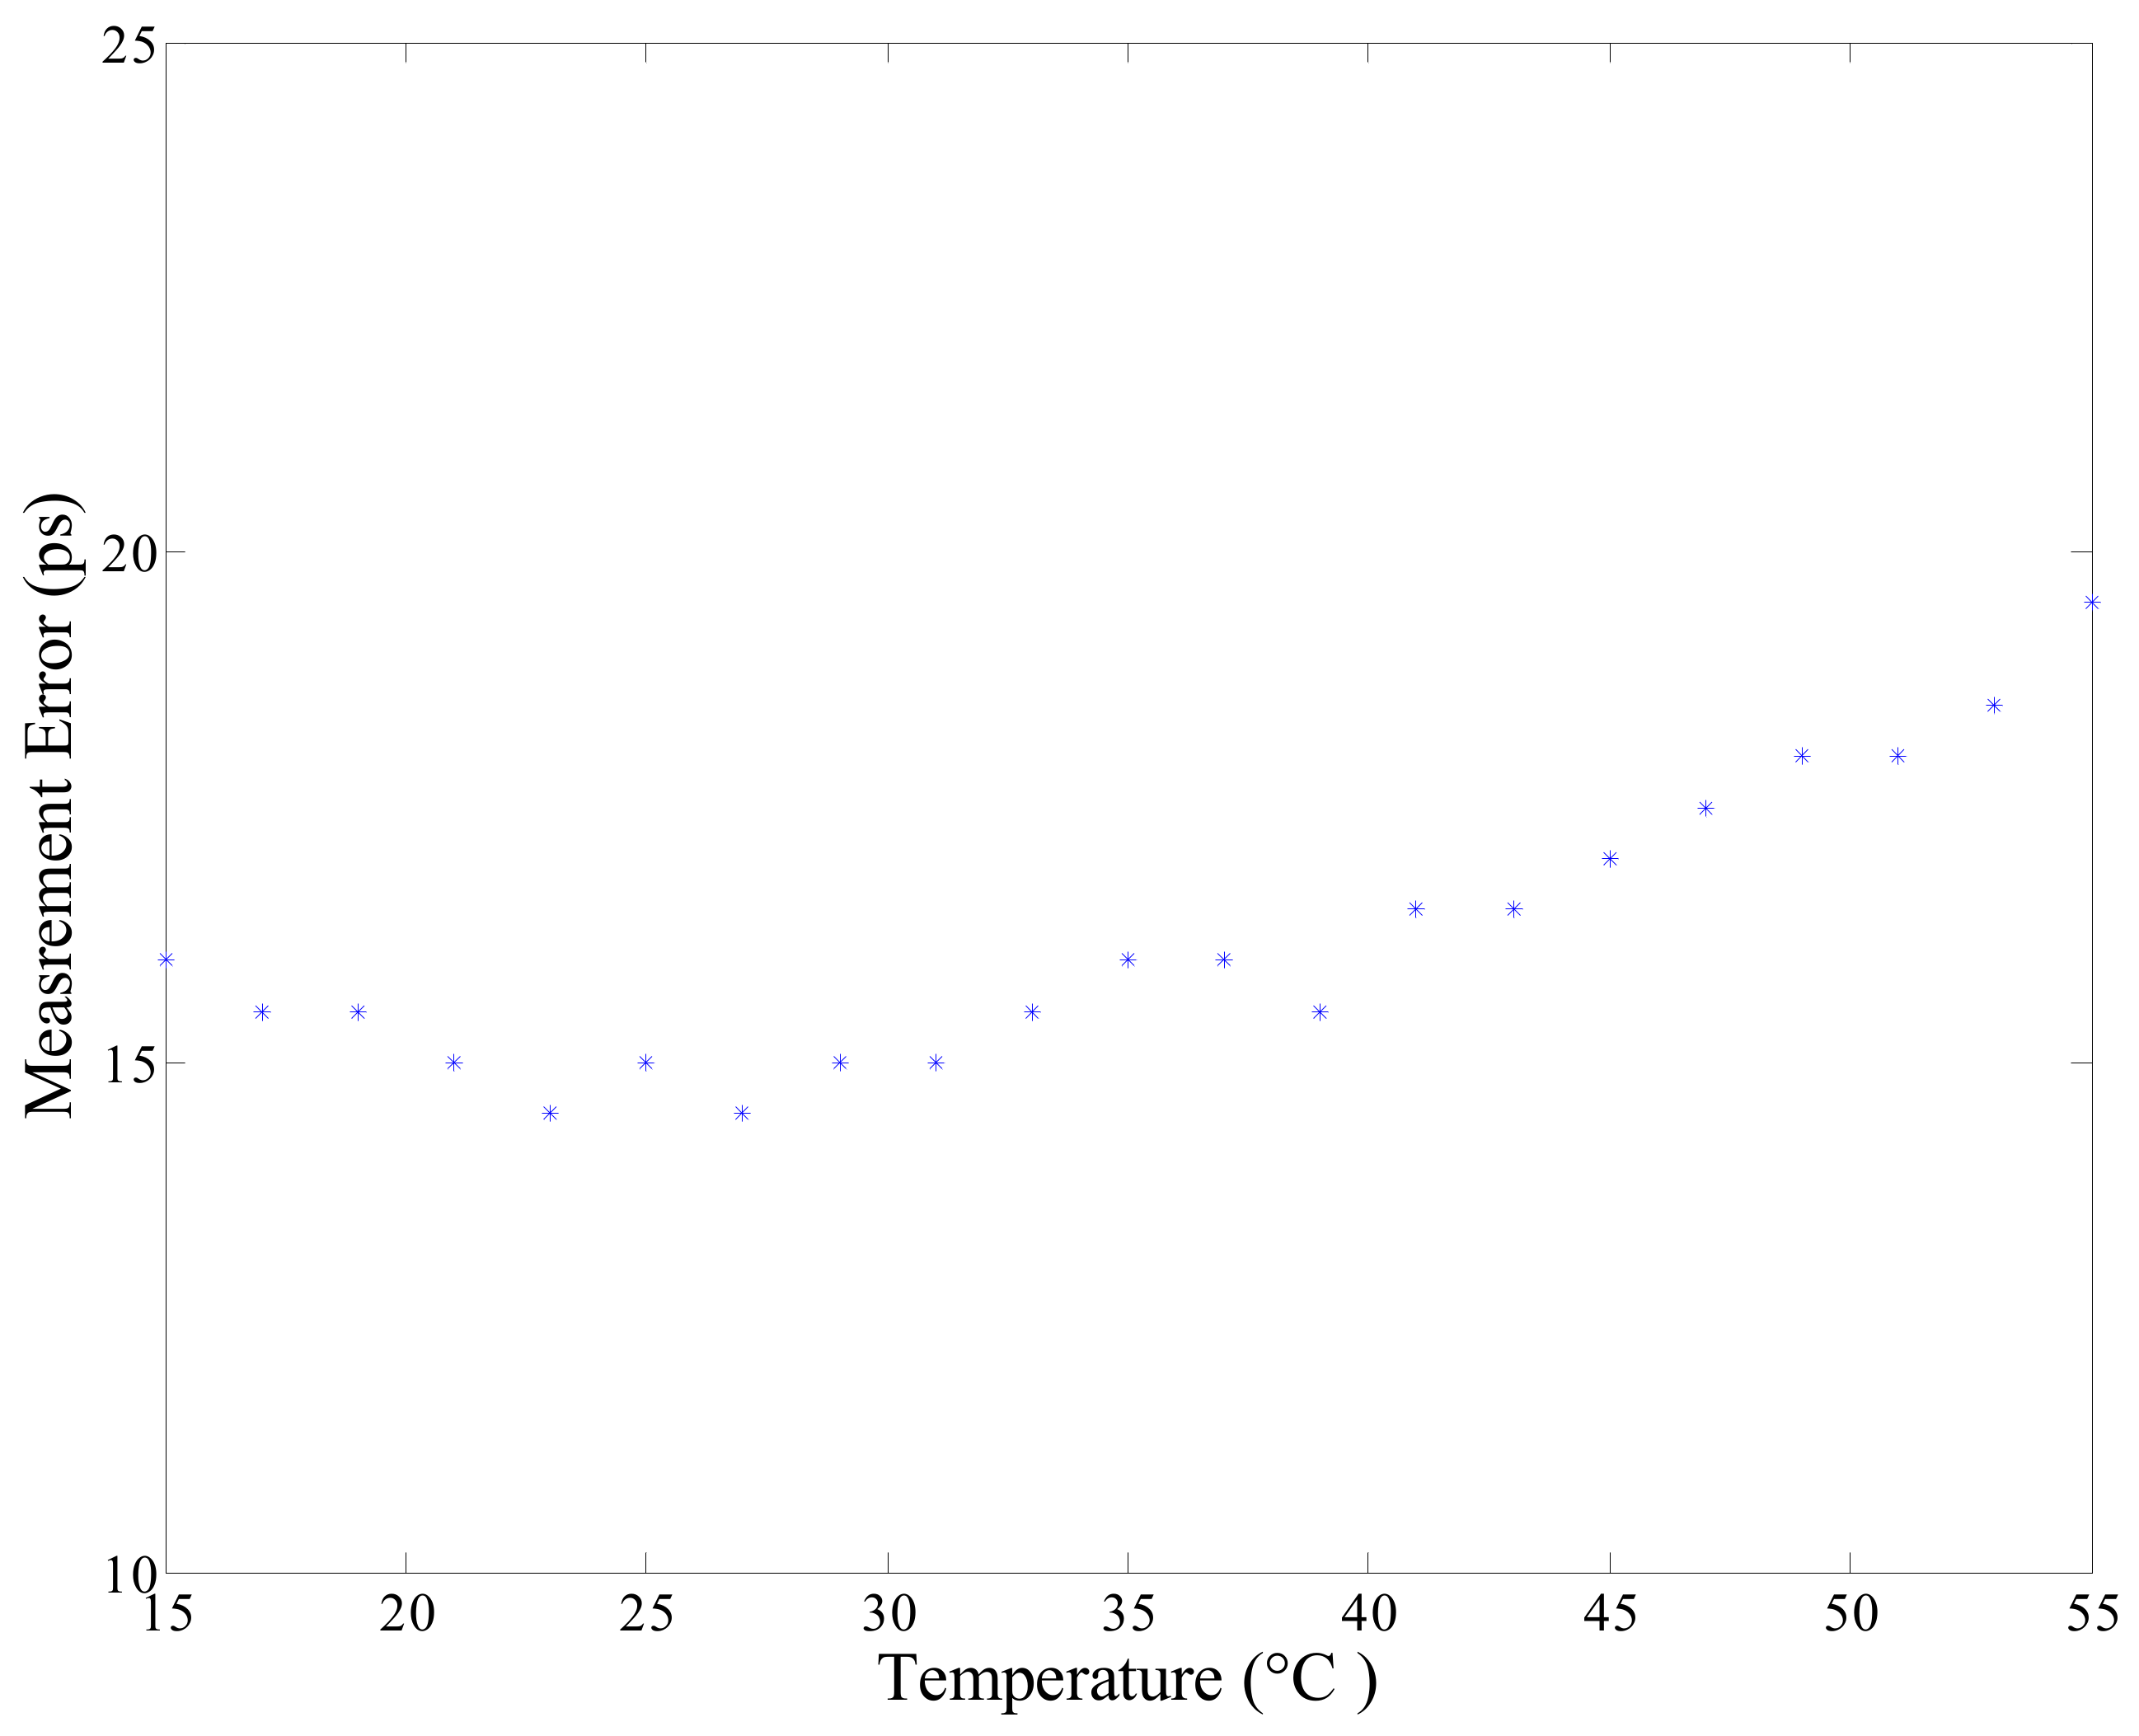
The temperature stability of the proposed phase difference measurement system is tested on the evaluation board. The temperature tests are performed with the use of a thermal chamber. A constant phase difference (5 ns) is measured under different temperature, with a range of 15 °C~55 °C. Measurement under a temperature is repeated 50 times. The measurement error (mean of absolute value) under different temperature is shown in Figure 8. In the figure, the largest variation in the measurement result is 5 ps.
The voltage tests are performed using the DC power supply RIGOL DP832A. The nominal operating voltage of the evaluation board is 1 V (internal supply voltage of FPGA). In the tests, the supply voltage of the FPGA is changed within the range of 0.95 V~1.05 V with a step of 5 mV. A constant phase difference (5 ns) is measured under different supply voltages at an ambient temperature of approximately 25 °C. Each measurement at a given voltage is also repeated 50 times. The measurement error is shown in Figure 9, which indicates that with the change in supply voltage, the largest difference in the measurement error is less than 3.5 ps.
The temperature and voltage tests prove that the proposed phase difference measurement system has good temperature voltage stability, which benefits from the closed-loop feedback mechanism of the IDELAYCTRL module.
4.4. Experiments on Kintex Ultrascale FPGA Platform
The resolution of implementation on Xilinx Viretx-5 FPGA is 25 ps. To further improve the performance, the proposed method is implemented on the Kintex Ultrascale FPGA chip. The manufacturing process of the chip is 20 nm, which provides the chip with enhanced capability of delay adjustments. The Kintex Ultrascale FPGA provides delay element that contains a 512 tap delay line. The reference frequency is within the range of 200 MHz~800 MHz, and the best delay resolution is 2.5 ps.
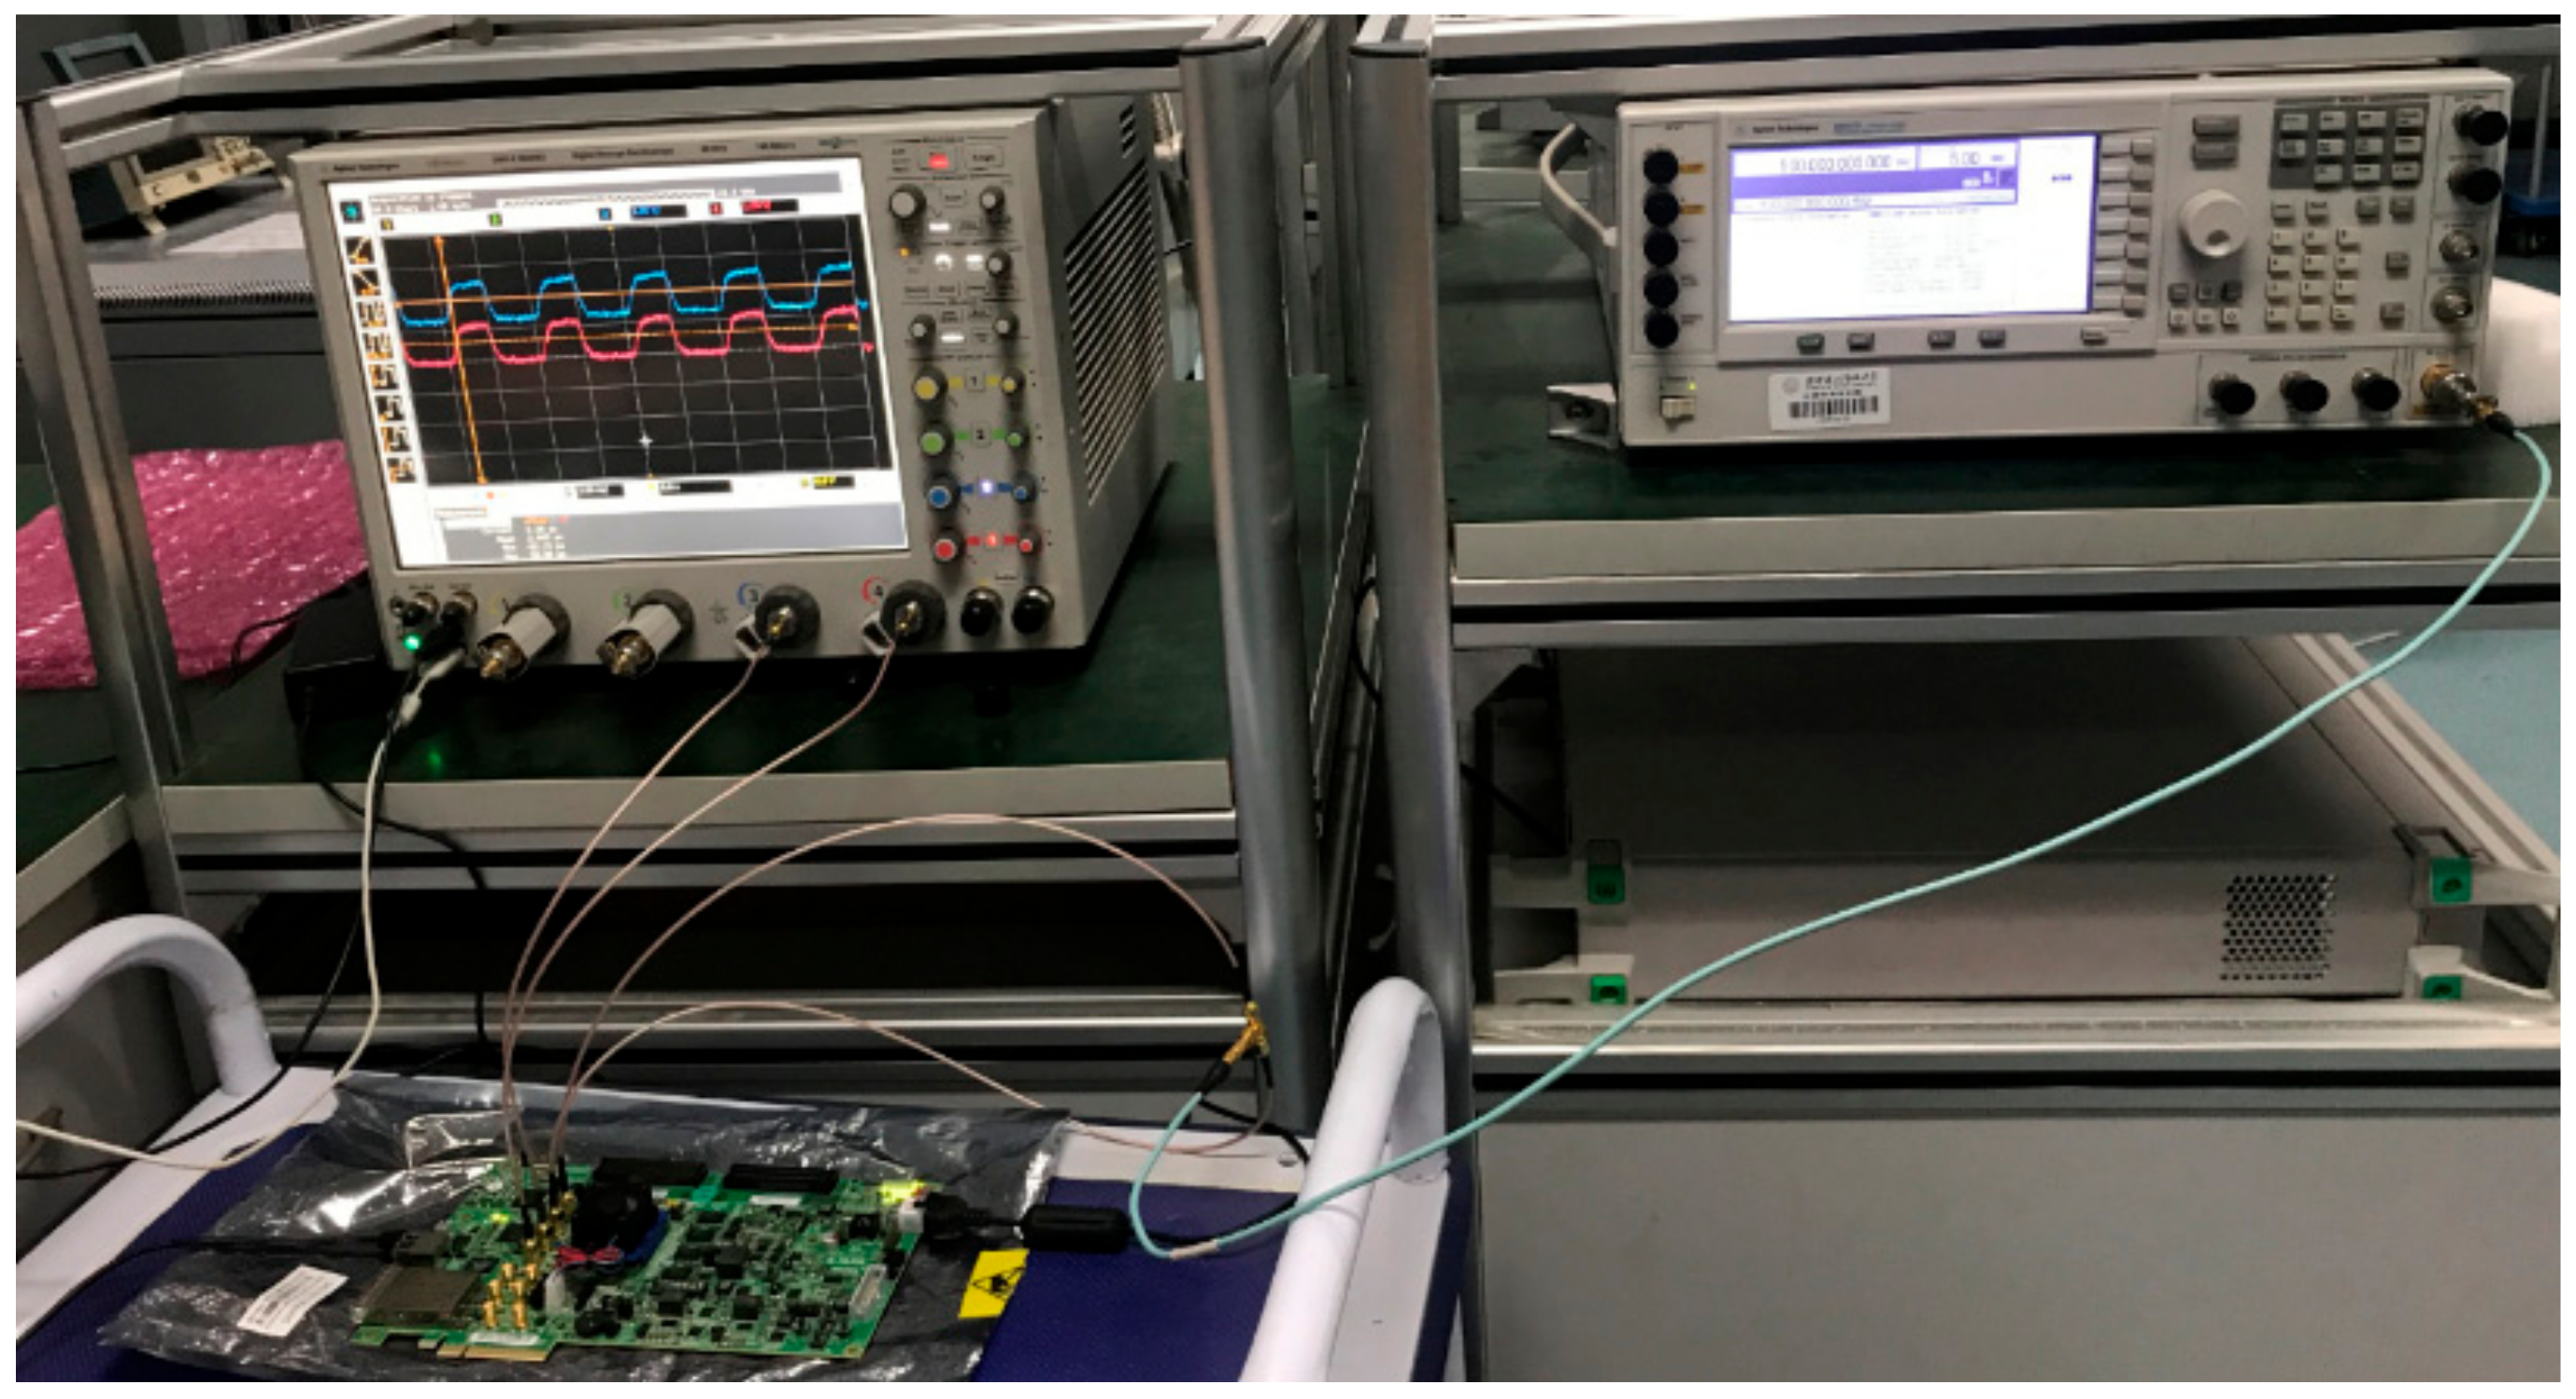
Experiments are performed using the Xilinx KCU105 evaluation board. An oscilloscope, Angilent DSO-X 95004Q, with 160 GSa/s ultra-high sampling rate is employed to verify the measurement precision of the method. Test results show that the measurement error of the KU phase difference measurement system is within the range of ±5 ps.
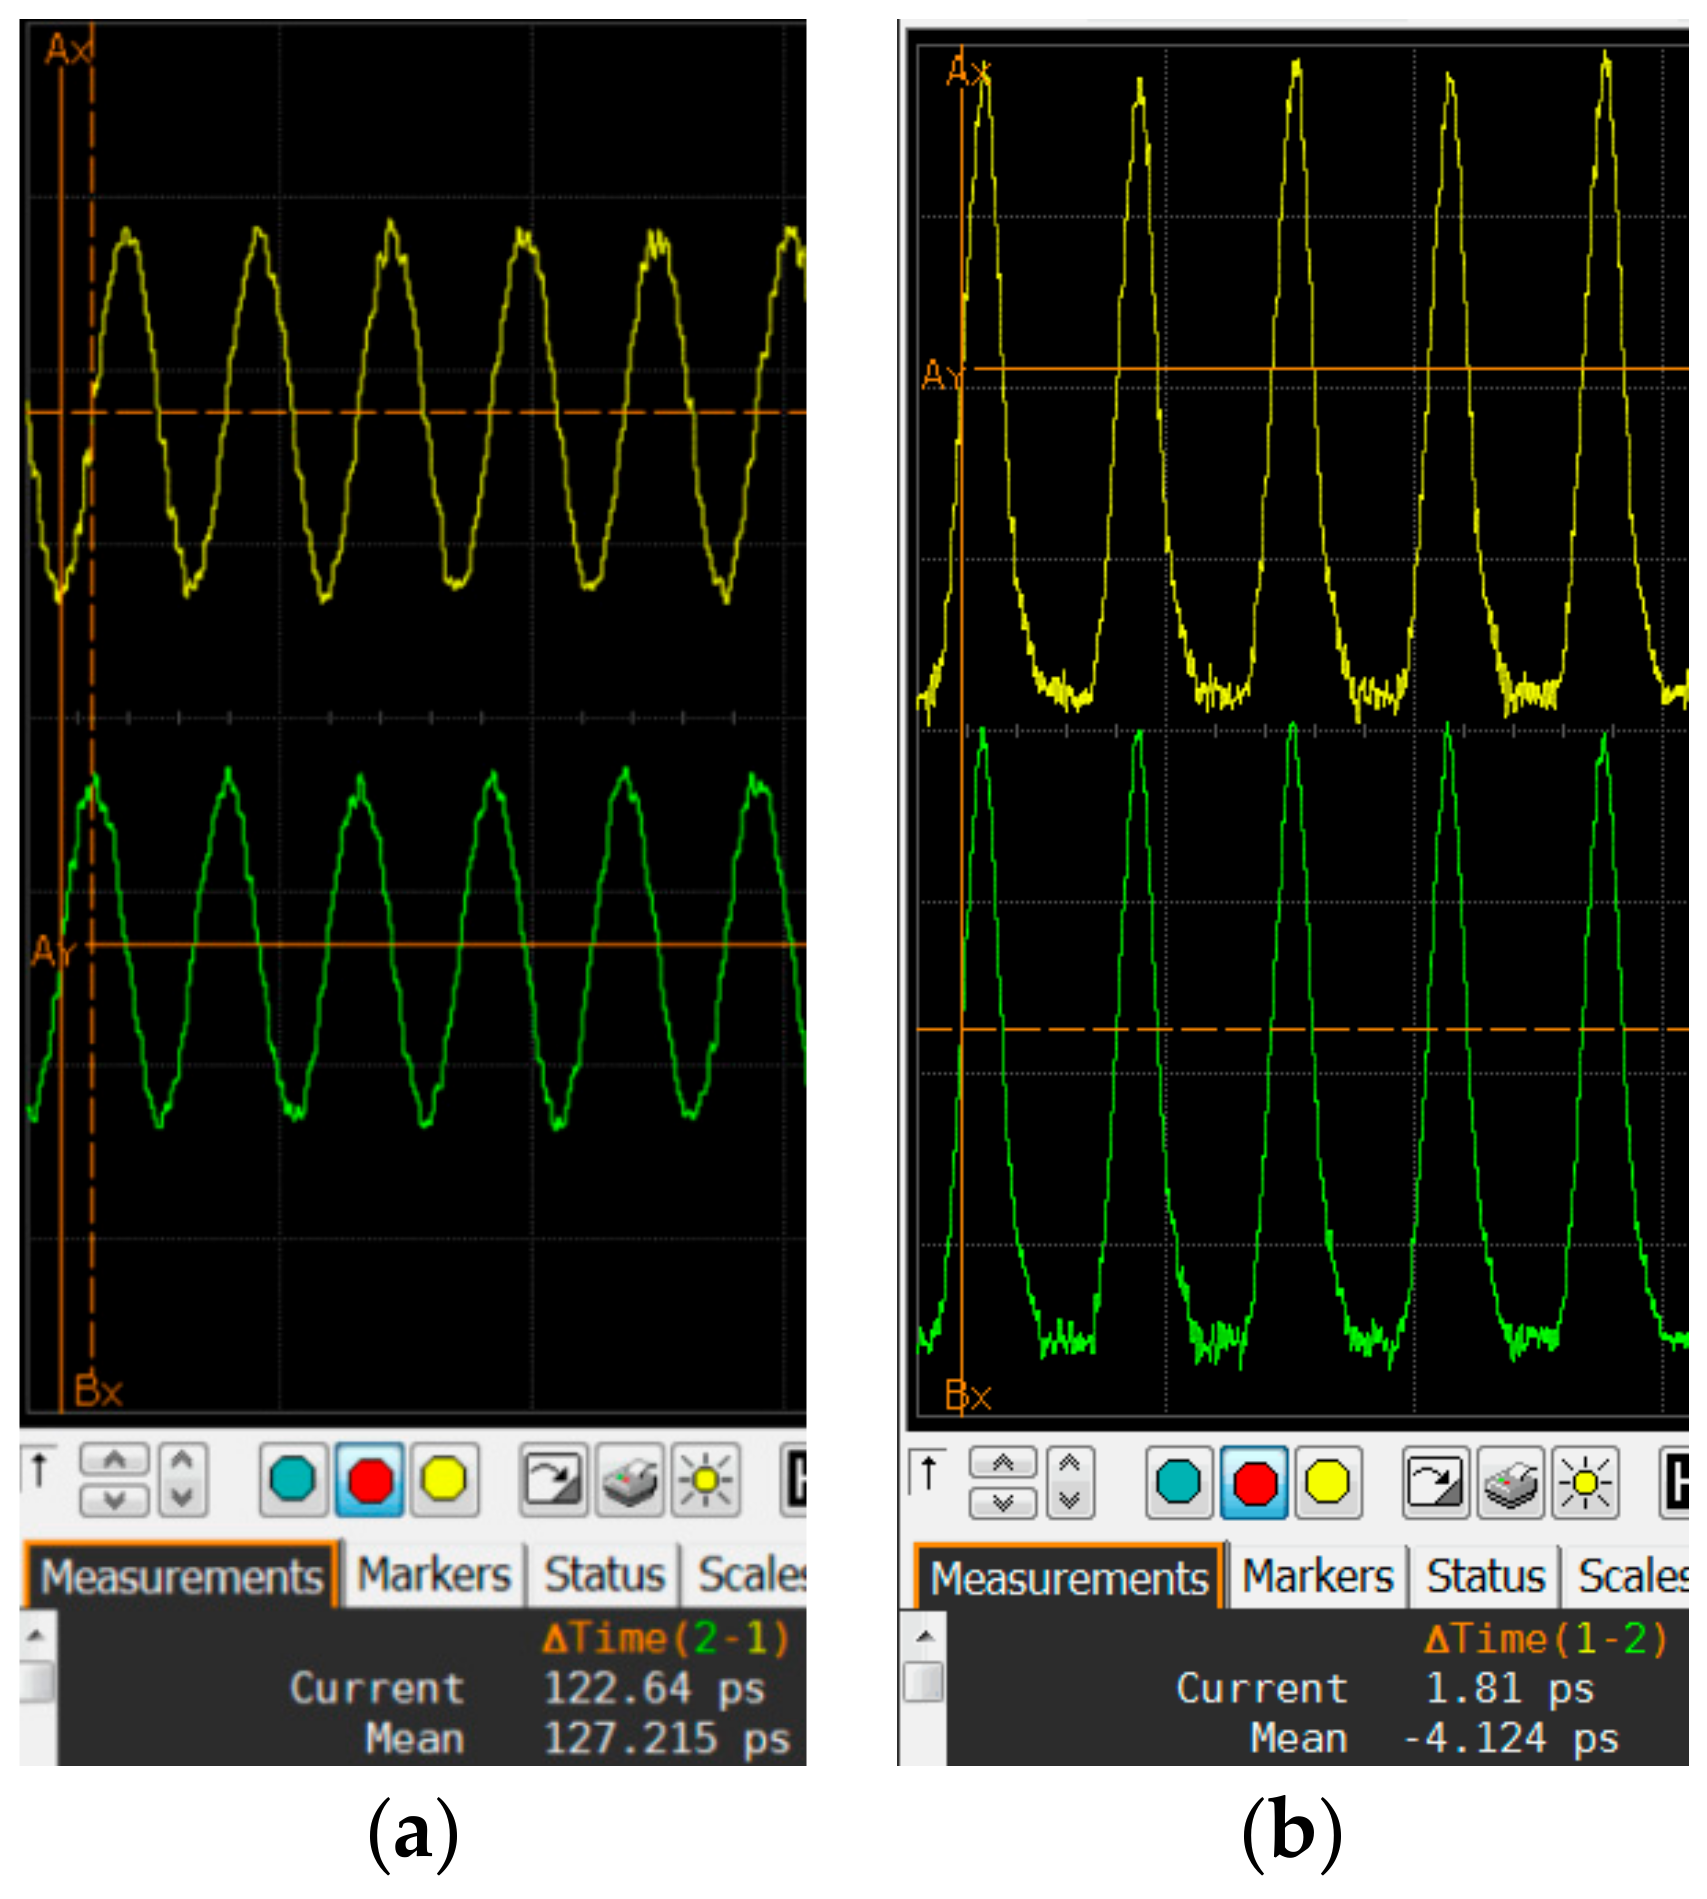
Moreover, tests are also conducted to verify the function of clock synchronization. In the test, a clock signal, generated by the Agilent 81130A signal generator, inputs to the evaluation board through a T-junction and coaxial cables. The phase difference is mainly introduced by the T-junction and the length of the cables. The test platform is shown in Figure 10. In the experiments, frequencies of 200 MHz, 400 MHz, 500 MHz and 800 MHz are tested. The waveform the 400 MHz and 800 MHz signals before and after progressive phase shift is shown in Figure 11, respectively. Figure 11 indicates that the proposed can reduce the phased difference between periodic signals to within the range of ±5 ps.
4.5. Comparison with Related Works
Table 1 compares the performance of the proposed method with similar designs that implements TDC on FPGA devices. Most FPGA based time-related realizations use the carry logic elements to build delay line. Comparison results indicate that the implementation on Kintex Ultrascale platform obtains higher resolution.
5. Conclusions
This paper proposed and tested a phase difference measurement method between two periodic signals based on the principle of PPS. A double PPS method is further proposed to improve the resolution and reduce measurement error. As a result of the double PPS structure, the resolution is improved to 25 ps. To further improve the resolution, the proposed method is implemented on the latest FPGA platform. The implementation on Xilinx KCU105 evaluation board obtains resolution of 2.5 ps, and the measurement error is within the range of ±5 ps.
The proposed method is implemented in a single FPGA chip, which features high integration density and short development time. Another advantage of the proposed method is that it offers a high measurement rate, which profits from the principle of the method algorithm and does not require complicated calculations. The longest time needed for the measurement is less than 0.1 µs. Moreover, experimental results indicate that the proposed method provides good PVT stability.
Author Contributions
M.Z. and H.W. conceived and designed the experiments; M.Z. and H.Q. performed the experiments; Y.L. and W.Z. analyzed the data; M.Z. wrote the paper.
Acknowledgments
This research is supported by the China Postdoctoral Science Foundation and the AreoSpace T.T. and C. Innovation Program.
Conflicts of Interest
All the authors declare no conflict of interest. The founding sponsors had no role in the design of the study; in the collection, analyses, or interpretation of data; in the writing of the manuscript, and in the decision to publish the results.
References
- Lee, K.Y.; Huang, C.F.; Huang, S.S.; Huang, K.N.; Young, M.S. A High-Resolution Ultrasonic Distance Measurement System Using Vernier Caliper Phase Meter. IEEE Trans. Instrum. Meas. 2012, 61, 2924–2931. [Google Scholar] [CrossRef]
- Zhao, L.; Gao, X.; Hu, X. Beam Position and Phase Measurement System for the Proton Accelerator in ADS. IEEE Trans. Nucl. Sci. 2014, 61, 538–545. [Google Scholar] [CrossRef]
- Gueuning, F.E.; Varlan, M.; Eugene, C.E. Accurate distance measurement by an autonomous ultrasonic system combining time-of-flight and phase-shift methods. IEEE Trans. Instrum. Meas. 1997, 46, 1236–1240. [Google Scholar] [CrossRef]
- Huang, X.; Xia, X. A Fine Resolution Frequency Estimator Based on Double Sub-segment Phase Difference. IEEE Signal Process. Lett. 2015, 22, 1055–1059. [Google Scholar] [CrossRef]
- Angrisani, L.; Baccigalupi, A.; Moriello, R.S.L. A measurement method based on Kalman filtering for ultrasonic time-of-flight estimation. IEEE Trans. Instrum. Meas. 2006, 55, 442–448. [Google Scholar] [CrossRef]
- Kim, C.Y.; Ahn, T.J. Fourier-domain mode delay measurement for multimode fibers using phase detection. Opt. Commun. 2015, 345, 26–30. [Google Scholar] [CrossRef]
- Song, C.; Zhu, X. A method phase difference measurement and Error Analysis based on DFT. Electron. Warf. 2003, 18, TM933.312. [Google Scholar]
- Jiang, Y.; He, Y. High-Accuracy Phase Difference Estimation between Same Frequency Components in Two Periodic Signals. Trans. China Electrontech. Soc. 2006, 21, 116–120. [Google Scholar]
- Wang, Y.; Wang, C.; Tao, Y. Fast Frequency Acquisition and Phase Locking of Nonplanar Ring Oscillators. Appl. Sci. 2017, 7, 1032. [Google Scholar] [CrossRef]
- Markovic, B.; Tisa, S.; Villa, F.A.; Tosi, A.; Zappa, F. A high linearity, 17 ps precision time-to-digital converter based on a single stage Vernier delay loop fine interpolation. IEEE Trans. Circuits Syst. I Reg. Pap. 2013, 60, 557–569. [Google Scholar] [CrossRef]
- Hervé, C.; Cerrai, J.; le Caër, T. High resolution time-to-digital converter (TDC) implemented in field programmable gate array (FPGA) with compensated process voltage and temperature (PVT) variations. Nucl. Instrum. Methods Phys. Res. A Accel. Spectrom. Detect. Assoc. Equip. 2012, 682, 16–25. [Google Scholar] [CrossRef]
- Zhang, J.; Zhou, D. A new delay line loops shrinking time-to-digital converter in low-cost FPGA. Nucl. Instrum. Methods Phys. Res. A Accel. Spectrom. Detect. Assoc. Equip. 2015, 771, 10–16. [Google Scholar] [CrossRef]
- Tan, Y.S.; Yeo, K.S.; Boon, C.C. A dual-loop clock and data recovery circuit with compact quarter-rate CMOS linear phase detector. IEEE Trans. Circuits Syst. I Reg. Pap. 2012, 59, 1156–1167. [Google Scholar] [CrossRef]
- Zhang, M.; Wang, H.; Liu, Y. High-Resolution Digital-to-Time Converter Implemented in an FPGA Chip. Appl. Sci. 2017, 7, 52. [Google Scholar] [Green Version]
- Xilinx Inc. Virtex-5 FPGA User Guide UG190 (v4.6); Xilinx Inc.: San Jose, CA, USA; Available online: www.xilinx.com (accessed on 17 May 2010).
- Xilinx Inc. Timing Constraints User Guide UG612 (v11.1.1); Xilinx Inc.: San Jose, CA, USA; Available online: www.xilinx.com (accessed on 9 December 2008).
- Zhao, L.; Hu, X.; Liu, S.; Wang, J.; Shen, Q.; Fan, H.; An, Q. The Design of a 16-channel 15 ps TDC Implemented in a 65 nm FPGA. IEEE Trans. Nucl. Sci. 2013, 60, 3532–3536. [Google Scholar] [CrossRef]
- Wang, Y.; Liu, C. A Nonlinearity Minimization-Oriented Resource-Saving Time-to-Digital Converter Implemented in a 28nm Xilinx FPGA. IEEE Trans. Nucl. Sci. 2015, 62, 2003–2009. [Google Scholar] [CrossRef]
Figure 1.
Principle of progressive phase shift.

Figure 2.
Diagram and locations of IDELAY and IDELAYCTRL modules.

Figure 3.
Schematic diagram of the proposed phase difference measurement system.

Figure 4.
Timing diagram of the modified method based on multiple measurements.

Figure 5.
Test bench of the phase difference measurement system.

Figure 6.
Measurement error within the range of 0–100 ns.

Figure 7.
Output code for a constant phase difference signal.

Figure 8.
Temperature stability of the proposed phase measurement system.

Figure 9.
Voltage stability of the proposed phase measurement system.

Figure 10.
The test platform of clock synchronization.

Figure 11.
The effect of the proposed progressive phase shift method. (a) 800 MHz (b) 800 MHz after PPS.
Figure 11.
The effect of the proposed progressive phase shift method. (a) 800 MHz (b) 800 MHz after PPS.


Table 1.
Comparison with related works.
| Work | This Work | [11] | [17] | [18] | |
|---|---|---|---|---|---|
| Principle | Progressive Phase Shift | Carry Delay Lines | 16 Carry Delay Lines | Carry Delay Line | |
| FPGA | Virtex-5 | Kintex Ultrascale | Virtex-6 | Virtex-5 | Kintex-7 |
| Manufacture Process | 65 nm | 20 nm | 40 nm | 65 nm | 28 nm |
| Resolution | 25 ps | 2.5 ps | 40 ps | 15 ps | 15 ps |
| Frequency | 210 MHz 310 MHz | 800 MHz | 400 MHz | - | 710 MHz |
© 2018 by the authors. Licensee MDPI, Basel, Switzerland. This article is an open access article distributed under the terms and conditions of the Creative Commons Attribution (CC BY) license (http://creativecommons.org/licenses/by/4.0/).
Share and Cite
MDPI and ACS Style
Zhang, M.; Wang, H.; Qin, H.; Zhao, W.; Liu, Y. Phase Difference Measurement Method Based on Progressive Phase Shift. Electronics 2018, 7, 86. https://doi.org/10.3390/electronics7060086
AMA Style
Zhang M, Wang H, Qin H, Zhao W, Liu Y. Phase Difference Measurement Method Based on Progressive Phase Shift. Electronics. 2018; 7(6):86. https://doi.org/10.3390/electronics7060086
Chicago/Turabian StyleZhang, Min, Hai Wang, Hongbo Qin, Wei Zhao, and Yan Liu. 2018. "Phase Difference Measurement Method Based on Progressive Phase Shift" Electronics 7, no. 6: 86. https://doi.org/10.3390/electronics7060086
Note that from the first issue of 2016, this journal uses article numbers instead of page numbers. See further details here.