Measuring the Efficiency of U.S. Pharmaceutical Companies Based on Open Innovation Types


1
Korea National Institute of Health, Health Science Business Convergence, College of Medicine, Chungbuk National University, Cheongju 28644, Korea
2
Department of Interaction Science, Sungkyunkwan University, Seoul 03063, Korea
3
Graduate School of Health Science Business Convergence, College of Medicine, Chungbuk National University, Cheongju 28644, Korea
*
Author to whom correspondence should be addressed.
J. Open Innov. Technol. Mark. Complex. 2018, 4(3), 34; https://doi.org/10.3390/joitmc4030034
Submission received: 26 June 2018
/
Revised: 24 July 2018
/
Accepted: 27 July 2018
/
Published: 8 August 2018
(This article belongs to the Special Issue The 4th Industrial Revolution from Open Innovation in Manufacturing and Service Industry to Cyber-Physics)
Abstract
:The pharmaceutical industry, where research and development (R&D) efficiency is central to company survival, has recently faced significant challenges. To increase efficiency, companies must implement strategies such as open innovation (OI), wherein they sell their intellectual property, maximize their use of external resources, adjust their structures, and implement new business models. In this study, we divided 701 U.S. pharmaceutical companies according to their OI strategies to measure and compare their R&D efficiencies between 2001 and 2016. We analyzed the deal data of companies by first dividing them into four groups (inside-out, outside-in, coupled, and closed) to calculate R&D efficiency using stochastic and meta-frontier analyses. In the first group analysis, the coupled group shows high technical efficiency, but in an overall comparison, the inside-out group achieves the highest efficiency values. These values increased between 2005 and 2010, when the R&D crisis in the industry was great at its highest. We thus identified the characteristics of each group based on our results, and presented extensive analyses using a time-series comparison and enterprise-level analysis. We claim that pharmaceutical companies can still cope with the current R&D crisis by implementing different OI strategies.
1. Introduction
Developing new drugs in the pharmaceutical industry requires astronomical investment and a multidisciplinary team of experts for periods exceeding a decade. In spite of these long-term and high-cost investments, the risk of successful commercialization of blockbuster products is limited to less than 10% [1,2,3].
As the pharmaceutical industry is characterized by (1) high-levels of knowledge [4], (2) high-costs and long-term research and development (R&D), and (3) high-risk and high-returns. The survival of the industry depends on its R&D efficiency [5]. However, R&D efficiency in this industry is gradually declining [6,7] although companies have made various efforts to increase efficiency by reducing investment cost and increasing profit.
Because it is difficult for one company to sustain the cost and duration of developing a new drug, several companies share the product development stage similarly to a relay race [8]. Over the past two decades, large international pharmaceutical companies have been increasingly involved in the transition to an open innovation R&D system from the traditionally closed R&D, through trading and collaboration with external research institutes and companies [9,10]. Each company has a business model that creates value to be exchanged for revenue in a specific disease field, new drug development stage, or solution [11]. As a result, technology deals, mergers and acquisitions (M&A), collaborative networking, division of labor, and specialization are increasing in the pharmaceutical industry. Some studies confirm the activities of pharmaceutical companies of exchanging technology and information using the transaction histories of companies [12,13].
In the early 2000s, studies focused on increasing R&D costs [1,2,14]. Specifically, efficiency measurement studies argued that (1) there is a positive correlation between stock price and individual firm’s efficiency [15], (2) there is still inefficiency in the industry [16], and (3) there is the need to reward technology [17] to achieve innovation increases efficiency. After 2010, as R&D productivity decline becomes an issue in this industry, there have been studies to identify the cause [5,18], confirming whether M&A have increased productivity [19,20,21]. Industry experts affirm that The implementation of open innovation (OI) methods in pharmaceutical R&D is no longer a philosophical problem of ‘whether to do it’ instead of a logistical problem of ‘how to do it’ [22].
Nevertheless, studies on R&D efficiency that target pharmaceutical companies are beset by limitations as follows. (1) There has been no research on how to measure open innovation (OI) and spreading within the industry. (2) Most studies use small data samples and output variables are limited to the number of patents or academic publications rather than based on corporate financial information data. The academic results reflect the outcomes of basic research, so it is hard to see it as a company’s achievement. (3) Because of the small data size, in terms of methodology, previous studies used data envelopment analysis (DEA) [23,24], a nonparametric methodology, not a statistical significance method. Because of the limitations of the methodology, studies were unable to compare efficiency by groups. When the efficiency of two or more groups is analyzed, the efficiency results of the two groups cannot be compared because each group uses each different production functions with different weights. The technical efficiency, result of DEA, of more than two groups under different production functions cannot be compared. A limitation of the methodologies is that a meta-frontier analysis has emerged and can be solved by comparing the TGR (technology gap ratio) values with each other [19]. Extant research is currently limited to understanding global pharmaceutical companies or only small- and medium-sized enterprises (SMEs) in specific countries.
In this study, we are going to measure and compare the efficiency values of pharmaceutical companies’ R&D given different OI types. We use the meta-frontier analysis (MFA)—a more advanced efficiency analysis method. We cover more than 700 U.S. pharmaceutical companies to analyze the period from 2001 to 2016. The United States, along with Europe, is considered a major axis in the pharmaceutical industry, accounting for one-third of the total market. Moreover, most biopharmaceutical companies are located in the United States.
Analyzing and comparing the production efficiency of OI type pharmaceutical company groups serves as a reference material for companies formulating strategies. This is because OI activities reflect the management strategies of individual pharmaceutical companies.
We identified OI activities through transaction information data that show a close relevance between corporate R&D activities and OI activities. Our research thus enables readers to understand whether statistically significant data are being developed and if OI strategies are being used to achieve efficiency. We thus show how the efficiency of pharmaceutical companies by OI type changes over time flow, from the time OI was introduced to the present. Identifying each type of OI would thus help readers understand the bigger picture from a broader perspective.
2. Literature Review
2.1. Challenges of the Pharmaceutical Industry and Open Innovation as Breakthrough
The global pharmaceutical industry faces various challenges wherein it must create a low-growth industrial environment with environmental changes [25]. Medicine development directly contributes to human life and health, and it involves a high level of expertise on biology and biochemistry. Medicines cannot be commercialized until they are approved by the Food and Drug Administration (FDA) to demonstrate a high level of effectiveness and safety under very stringent standards. During this process, astronomical costs are incurred and R&D costs can only be recovered if the approved medicines are patented and sold exclusively. On the other hand, the cost of manufacturing an approved drug is relatively inexpensive. Because of these characteristics, the following changes in the 2000s have triggered a crisis for large pharmaceutical companies.
First, governments have tightened drug approval standards, and lowered and stressed drug prices for businesses. On one hand, health authorities in major countries or regions such as the United States, Japan, Europe, and China have significantly increased approval standards for the safety of medicines. On the other hand, in order to prevent financial deterioration, policy changes have been made to reduce public medical expenditures. This move by the government poses a high risk to pharmaceutical companies, in addition to affecting profits.
Second, the patent expiration of blockbuster drugs, which were a major source of revenue for large pharmaceutical companies, has hindered corporate growth [10,26]. In the United States, the blockbuster patents of large US pharmaceutical companies such as Pfizer, Merck, Johnson & Johnson, Amgen, Gilead Science, and many others, have expired. Large pharmaceutical companies are guaranteed massive profits based on such patents, but, when they expire, they are forced to compete with generic drugs that may be one-tenth of the price [5]. This leads to fierce competition with generics, along with gradually declining sales. In emerging countries, pharmaceutical companies have entered a low-growth business environment as they push competitive generic drugs with low margins. Thus, the decline in sales because of patent expiration is thus of serious concern. A typical example is the patent expiration of Pfizer’s product, Lipitor. In 2010, the drug added $10.7 billion in revenue, which dropped to $1.9 billion in 2015 following Lipitor’s genetics availability [27].
The third change that affected pharmaceutical companies are represented by the decline in R&D productivity, for which there are several reasons. One reason is that the target disease has changed from an infectious one to a chronic one. Research has also become more difficult because diseases have become complicated in their mechanism of action. As a result, the cost of R&D investment has increased, while the success rate has decreased. To overcome the crisis of R&D productivity, SMEs with limited resources and global conglomerates have been pursuing OI strategies. Large pharmaceutical companies have been implementing such strategies to reduce the number of laboratories in order to obtain licenses of promising new drug candidates from universities and small-scale biotech companies instead [10].
Meanwhile, research on OI has been undergoing tremendous progress. The concept of OI was initially introduced by Chesbrough in his book [28] in 2003. Subsequently, OI became an important concept and has spread out across both academia and business as a new paradigm. The flow has changed from closed innovation to OI that deals actively intellectual property rather than preventing it from leaking [29,30,31,32]. In 2014, open innovation was re-defined as “a distributed innovation process based on purposively managed knowledge flows across organizational boundaries [33]”. There are two kinds of knowledge flows: outside-in and inside-out—also referred to as inbound and outbound, respectively [33]. There are many different ways to devise open innovation practices, but most widely accepted processes are three archetypes: outside-in, inside-out, and coupled [30,34,35,36].
‘Outside’ practices are the opening of the company’s innovation process to various external inputs and contributions. Both academic research and the industry have given great attention to this aspect. In contrast, ‘inside-out’ practices require that unused and underutilized ideas get outside the organization for others to use in their businesses and business models [29,34].
- (1)
- ‘Outside-in’ type represent the opening to various external inputs and contributions. Companies could enrich their knowledge base through the integration of external inputs.
- (2)
- ‘Inside-out’ type benefits from selling the internal intellectual property to the outside. Bringing ideas to market, selling the intellectual property (IP), and multiplying technology by transferring ideas to the outside could be the examples of inside-out type’s activities.
- (3)
- ‘Coupled’ type alliances with complementary partners. In the pharmaceutical industry, research, development, clinical, licensing, manufacturing, marketing, and distribution are specialized so that each phase of drug R&D and commercialization can be entrusted to partners.
The extensive corpus of research in this field divides the concept of OI and links it with the business activities of companies [19,20,21,22]. There are studies that identify actual management activities according to the type of OI, which has provided a basis for analyzing management activity records to determine what types of OI activities have been achieved and how they affect management indicators. Among the typologies of OI practices, the most common method is the distinction based on knowledge flows. Thus, we divide the management activities of the companies into four types: outside-in, inside-out, coupled, and closed.
OI essentially entails the transfer and absorption of knowledge, making it suitable for technology-oriented industries, rather than the traditional ones. In the vast knowledge industry, the pharmaceutical sector has a high proportion of R&D, rendering it influential in terms of enterprise competition. Moreover, patent technologies have been actively traded for a long time. Therefore, the management of the R&D pipeline and the securing of IP rights are core elements of the business. Hence, we note this the industry has been adopting and utilizing OI faster than any other industry. The OI activities that occur between companies are seen as contractual records, that can be analyzed to determine where technology, information, people, and infrastructure move or collaborate. Therefore, the empirical studies on OI have primarily focused on the pharmaceutical industry [21,22,23,24,25,26].
The recent literature has showed that technological advances have shifted the focus of drug development from chemicals to biologically based, large molecule drugs [27,28,29,30]. However, this fundamental change has presented certain problems such as increased drug development costs, decreased R&D productivity, and Big Pharma’s patent cliff. Additionally, the government’s pressure to approve and prescribe generic medicines, as well as the pressure to reduce healthcare spending, complicates the business environmen. Pharmaceutical companies have thus undergone industrial restructuring to overcome these issues. Furthermore, these developments have also increased OI activities, such as patent transactions, mergers and acquisitions (M&A), outsourcing, collaborative activities, and joint investments to reduce costs and increase productivity. Hence, OI is now recognized as a requirement, not an option.
2.2. Efficiency
Efficiency means the ratio of input to output. Input is the resource or effort to achieve a certain goal, and output is the result achieved using the from input. It is the purpose of efficiency analysis to measure this concept numerically, and the resulting index is called efficiency. Efficiency can be further divided into absolute efficiency and relative efficiency, where absolute efficiency means the ratio of output to input. One example of the absolute efficiency measures of a person is the hourly rate expressed as “income per hour”. The concept of absolute efficiency is often used in the ‘productivity’ analysis methodology, where the ratio of output to input is itself the subject of analysis.
In economic activity, the concept of relative efficiency is more commonly used than absolute efficiency, because the focus is on whether object have done better than others or the previous period. Relative efficiency is determined by comparisons with other analytical objects and is usually expressed as the relative ratio standardized based on the highest efficiency value. That is, the efficiency of the object when the highest-level efficiency is set to 1 can be expressed as 0.7.
The first studies on efficiency were those of with Koopmans (1951) [37] and Debreu (1951) [38]. Farrell (1957) [39] attempted to empirically measure efficiency. Later, Farrell’s work has developed into two measurement methods, stochastic frontier analysis (SFA) and data envelopment analysis (DEA). The parametric methodology SFA was developed by Aigner, Lovell & Schmidt (1977) [40], and Meeusen & van den Broeck (1977) [41]. Jondrow, Lovell, Materov, and Schmidt (1982) [42] have improved this methodology to enable efficiency measurement at the individual firm level. Another measurement nonparametric method, DEA, was developed by Charnes et al. (1978) [43]. Both methods estimate the frontier and measure its efficiency, but the fundamental difference is whether the form of the production function and the assumptions about error terms are included. Under both methods, various variational models are presented.
The SFA estimates the statistical modeled production frontier function, and the technical efficiency (TE) of each company using the function. TE takes a value between 0 and 1, and is the most efficient when its value is 1. The advantage of the SFA is that it can determine the inefficiency indicators in detail and identify the cause of the inefficiency. The translog and Cobb–Douglas function are most widely used as the production function of the SFA. The translog function includes the intersection term of the input element and can express the effect, while the data can represent the actual curve shape of the function.
The DEA is a measure of efficiency based on linear programming and is used not only for efficiency, but also for analyzing the causes of inefficiencies and setting goals for efficiency improvement. Specifically, it constructs a production frontier line from a given set of data and presents the degree of inefficiency of the inefficiency viewpoints within the producable set as the distance from the production change. This methodology provides information for finding efficient input–output combinations by improving inefficiencies. It has the advantage of being able to handle multiple input and output variables explicitly, but also the limitation of a deterministic model that does not consider the influence of the probability error.
There are various companies in the industry, and their efficiency can be evaluated through input and output. When measuring efficiency with SFA or DEA, the companies to be measured should have the same production function. However, even in the same industry, not all companies have the same production function. The differences in production function can be classified into several groups. The comparison of TE between groups cannot be performed using the traditional SFA because the TE of a particular company is difficult to compare with those of companies that operate with other technologies. However, the meta-frontier function can compare the level of corporate efficiency of groups operating under different technical conditions [44].
Nevertheless, some studies conducted MFA, a method for comparing and analyzing groups with different characteristics, in Ghana [45], Taiwan [46,47], and India [48]. In these countries, the history of the pharmaceuticals is short and focused on producing already commercialized drugs rather than R&D. Specifically, Ghana’s pharmaceutical companies focus on manufacturing facilities to supply pharmaceuticals to the country and emphasize the need to invest in better facilities [45]. Meanwhile, the cost inefficiency of Taiwan’s biotech and pharmaceutical industry averages 15.87%. The Taiwanese government’s support in helping the industry scale and improve its environment allowed it to reduce inefficiency [46]. However, the availability is limited because of the small number of companies and the short time span. However, those studies did not have a wealth of data. Because the number of companies and panel data are small, the results should be limited. Research that targets pharmaceutical companies listed on the Indian stock market has also been conducted too. In this case, companies were re-grouped according to size, strategy, and product composition for a group comparison of technological efficiencies [48].
This study examines the results of SFA on the pharmaceutical industry regarding the efficiency average value (TE) and the ratio of the industry frontier function to the meta-frontier function (TGR). The efficiency average value (TE) is an indicator of efficiency within the group, which means that the companies within the group industry are effectively evolving together. On the other hand, the ratio of the industry frontier function (TGR) to the meta-frontier function is the ratio of the meta-frontier (the maximum efficiency the entire pharmaceutical industry can achieve) to the group-frontier as a comparison index for maximum efficiency. This means that technological innovation is more active than in other groups, and lower TEs have higher growth potential than other groups.
2.3. Research Design
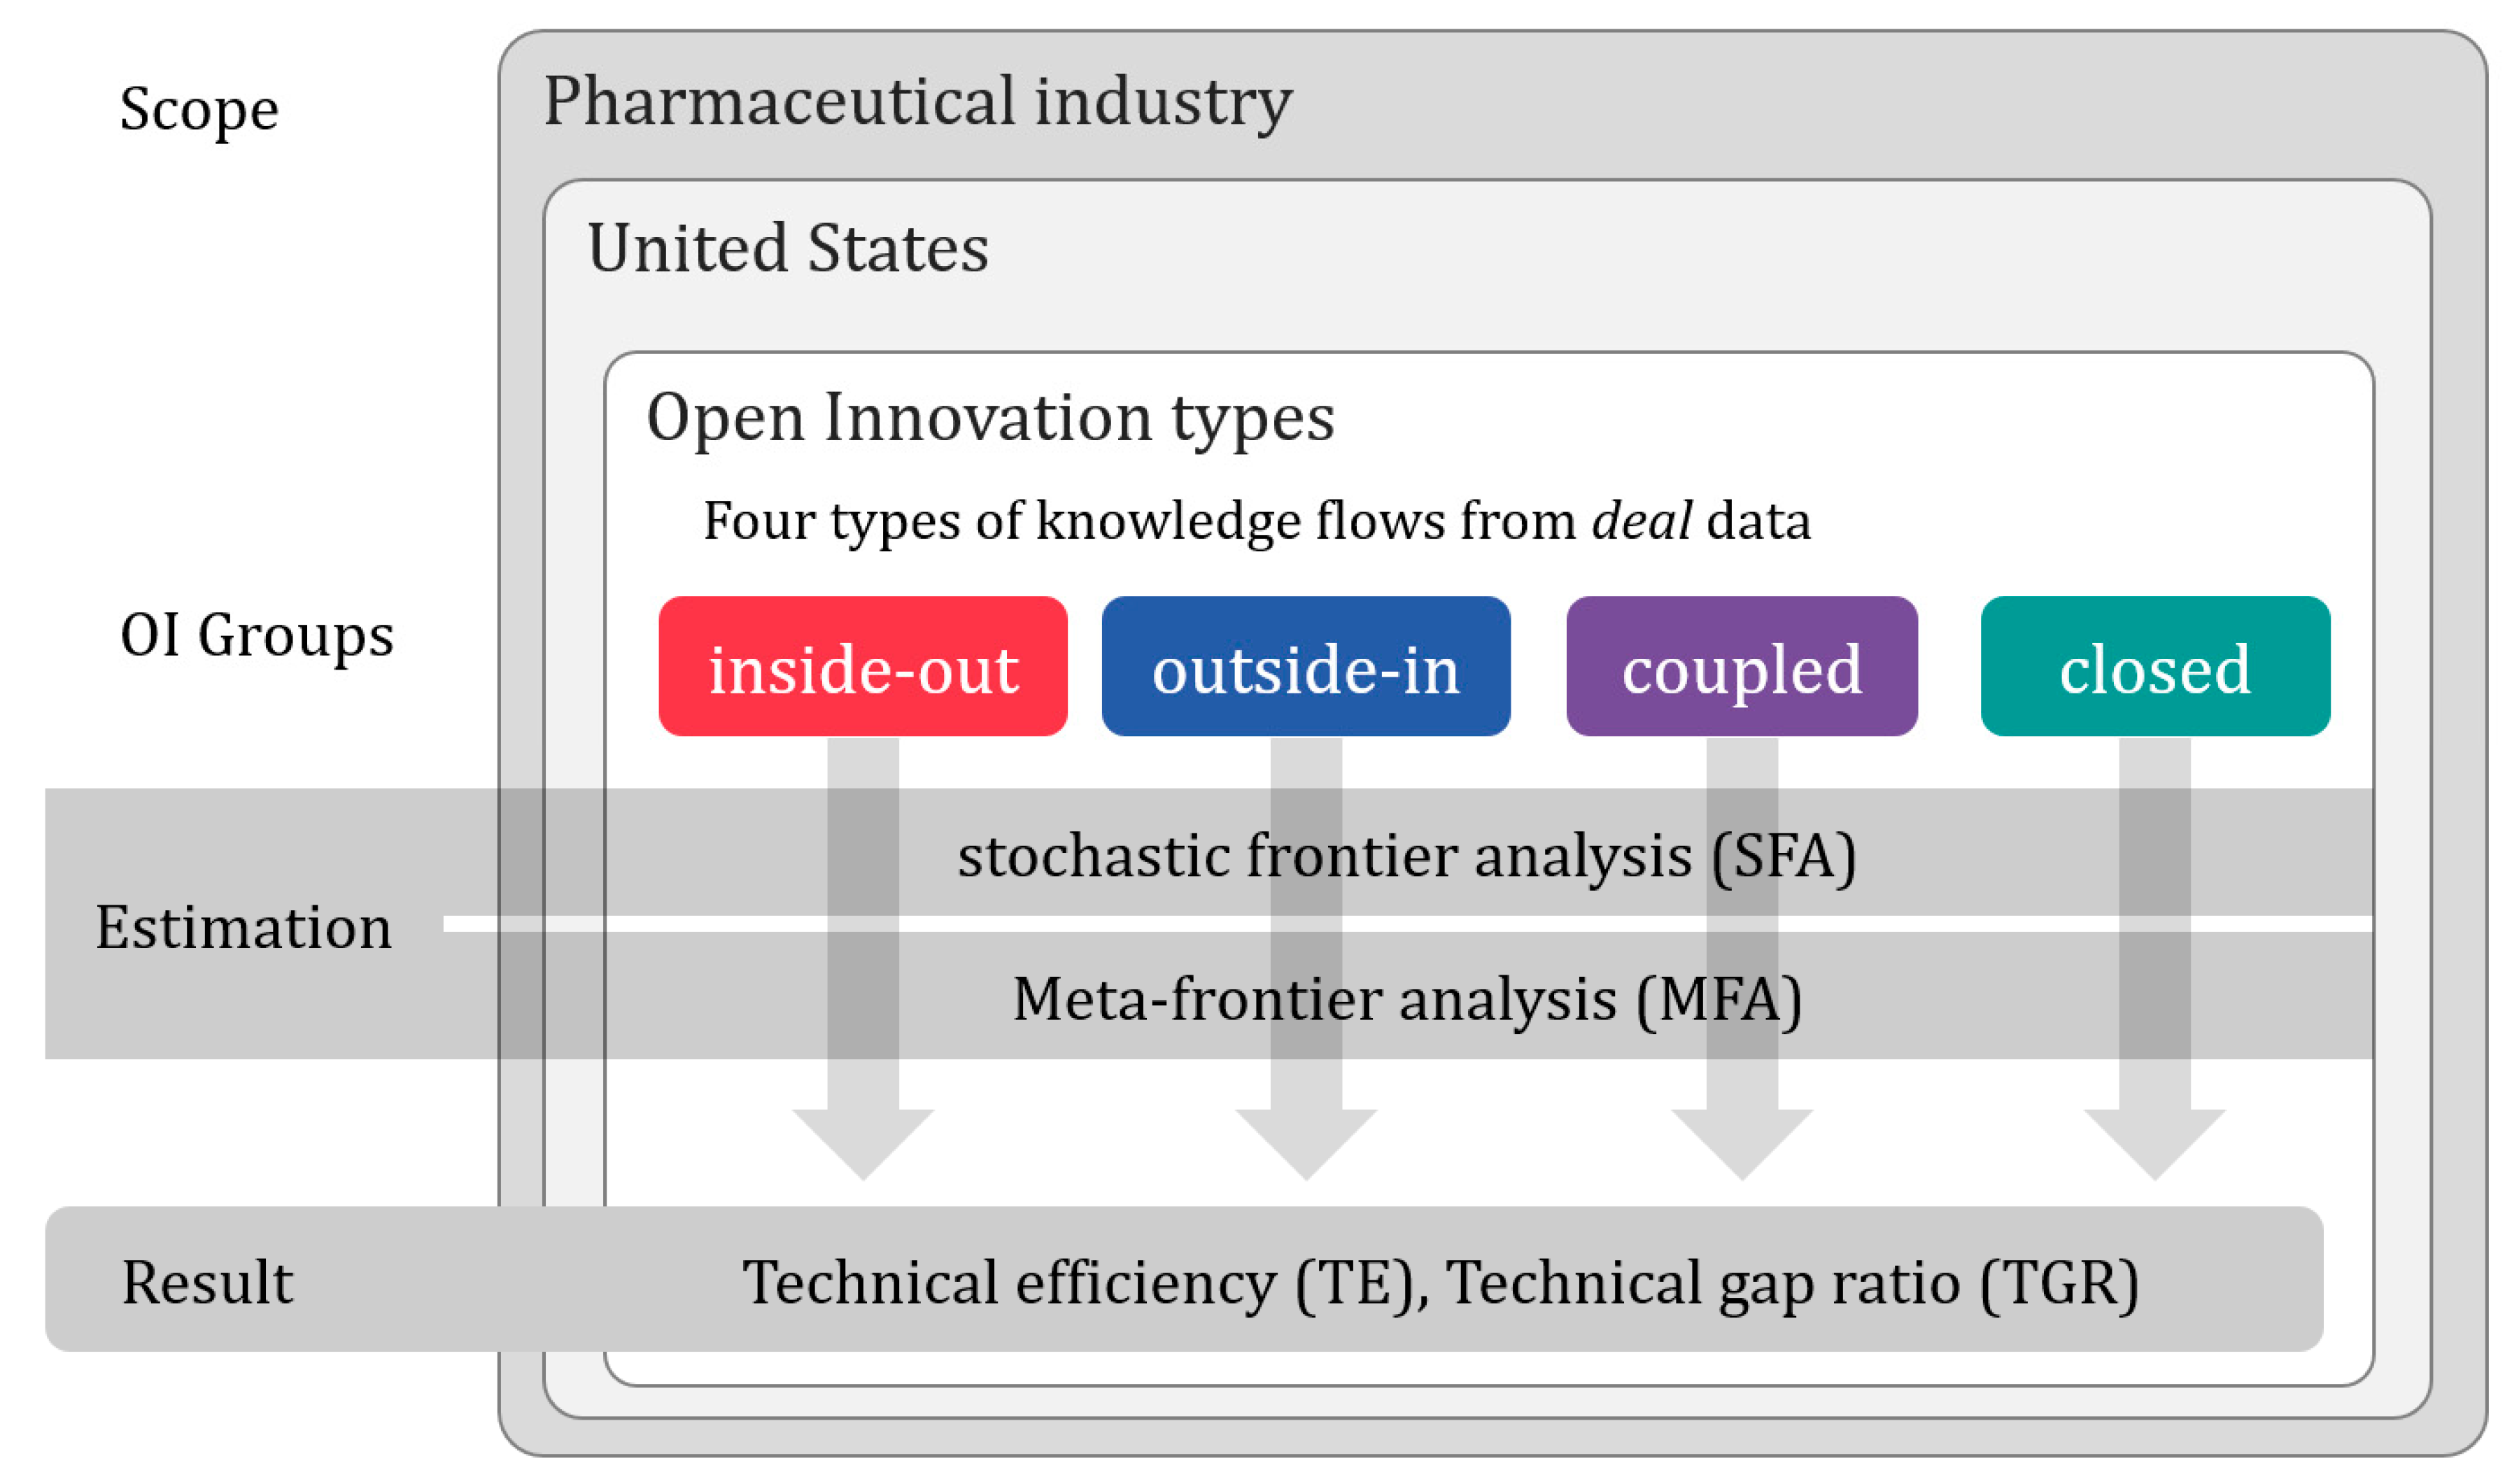
To measure the efficiency of different OI strategies, we design the study as shown in Figure 1. Specifically, we first divide deal data according to OI type. Then, based on these data, we divide the OI types of the companies that participate in the deal. Second, the number of OI activities in the deal transactions of U.S. pharmaceutical companies is determined for 2001–2016; the most used OI type is judged as the OI strategy of the company, and the OI type is then assigned. Third, the (SFA) method is used to derive the (TE) values of the four groups. Although the SFA method provides the TE values of each group, it does not provide a comparison of efficiencies across the different groups. Finally, the MFA method is used to derive and compare the efficiency of the four groups with different characteristics. We use Frontier 4.1 software for SFA, and MATLAB for MFA.
Based on the previous studies [31,34,35,36] that identified and systematized the activities of companies by OI type, we re-classified OI type as shown in Table 1. We then identified the deal data by company and categorized the activities in Table 1 for each transaction. As information and technology impact each transaction, inside-out and the outside-in activities are paired because we can make two different divisions: the providing and the receiving companies. Some companies do not have transactions, so they are classified as closed groups.
3. Methods
To measure the efficiency value of U.S. pharmaceutical companies with different OI strategies, we first apply the SFA method to obtain the efficiencies of the four groups. Then, the suggested MFA method is used to compare the efficiencies of the four groups of firms that engage in production activities under a different production function (see Appendix A for more details) [49,50,51].
3.1. Stochastic Frontier Analysis
The SFA indicates the relationship between input and output using a production function. Specifically, it uses the frontier production function, that is, the maximum output from a given input, to estimate the TE. The TE of a firm refers to how the technology level of a given firm stands relative to the TE standard represented by the frontier production function. Here, we find that as the distance between a firm’s technology level and the frontier production function increases, the given firm’s efficiency level decreases. This model [44,52] has been developed to reflect time trends better than the previous model [53], so we consider the change of technology efficiency according to the panel data and time.
To reflect the change in efficiency over time, Equation (1), based on the SFA model suggested by Battese and Coelli (1995) [52], is used to estimate efficiency.
where is the output of firm in period ; is an input vector of firm in period ; is the production function; β is the parameter of the production function; is independent from , and is a random error that follows a distribution of ; and finally, Uit is a non-negative random variable that represents the TE of firm in period t. If is a typical random error of a regression, is the firm’s inefficiency. To denote a fixed inefficiency, is not negative. We currently assume that follows a half-normal distribution. From Equation (1), the TE of firm in period t, , is
Generally, the Cobb–Douglas or the translog function is most widely used as the production function of SFA. However, the Cobb–Douglas function has a tendency toward oversimplification, as it considers output variables only as a log-linear combination of input variables. Therefore, the translog function, more specifically, the random effects time-varying production model, is used here. When assuming the use of the translog production function, Equation (1) can be expressed as Equation (3):
where is the amount of capital (K) of an ith firm in period , is the amount of R&D expense (M) of an ith firm in period , and is the number of employees of an ith firm in period that received a salary (L). Total assets are denoted as K, the cost of revenue as M, and the number of employees as L. Furthermore, the net sales value is used as output Y.
3.2. Meta-Frontier Analysis
The traditional SFA method cannot be used to compare TEs across different groups of firms with different technologies. Consequently, we use the meta-frontier production function which encompasses the production functions of the different groups [44].
There are two methods to calculate the parameters of the meta-frontier production function: linear programming (LP) and quadratic programming (QP). The former minimizes the sum of the absolute value of deviations, whereas the latter minimizes the sum of the squared deviations. According to Battese et al. (2004) [54], LP and QP are defined as follows:
where denotes each group, and the different pricing groups are represented as follows: the firm that offers paid content , the firm that offers free content , and the firm that offers both paid and free content . β is the unknown vector variable of the meta-frontier function that satisfies Equation (4). As per Equation (4), the meta-frontier production function graph is always located above each group’s production frontier function graph during all periods. That is, the meta-frontier production function envelopes the frontier function of each group with identical technologies. For simplification, when function in Equation (1) is assumed to be in the form of , Equation (1) can be transformed as follows:
when both sides of Equation (5) are divided by , Equation (6) is derived as follows:
The first part of the right-hand side of Equation (6), that is, , refers to the TE of group . The second part is the (TGR) or meta-technology ratio, which denotes the ratio of group j’s frontier function to the meta-frontier function. The meta-frontier TE, that is, , is the product of TE and TGR. It can be expressed as follows:
As previously noted, LP and QP are used to calculate the parameters of the meta-frontier production function [54], being defined as follows:
4. Data and Variables
4.1. Data
We use data from the Medtrack and Wharton Research Data Services (WRDS) databases. The Medtrack database is provided by INFORMA PLC. Its “deal database” is built by collecting all data on transactions from the biotechnology and pharmaceutical industries. These transaction data are divided into public offerings, M&A and private equity transactions, partnership transactions, venture finance, and private transactions. We use this information to identify the nature of OI activity for individual transaction data.
WRDS is affiliated with the Wharton School and is recognized as a comprehensive and accurate research database service, from which we obtained the financial data of U.S. pharmaceutical companies, including corporate, accounting, banking, and finance data. From more than 1000 data items, the items with high values and common as in the production function are selected and used as variables.
The Medtrack Deal database has more than 133,000 contract records from 2001 to 2016. Some transaction data are excluded because the company names were set to private. As most deals are conducted by both companies, they are approximately 267,000 observations that we distinguish according to OI activity criteria as shown in Table 2. For transaction data, the inside-out and outside-in groups are divided into the providing and the receiving sides, with the same number of observations. However, the percentage changes when companies are divided into different OI groups. For example, three inside-out activities and four coupled activities are added to the coupled group. The number of companies in the coupled group thus increases upon reflecting of the amount of transactions or recent transactions. On the other hand, the number decreases because of the exclusion of non-company-organizations such as universities, research institutes, and government agencies because these. Organizations are not suitable for analyzing efficiency using corporate financial data. Their basic research differs in both operation and scope. For instance, most of them do not seek profit, and they obtain investments from funds. Thus, the results show that inter-corporate agreements account for a relatively small proportion. Conversely, the number of deals shows that transactions with non-corporations are common than those between firms. Research institutions produce extensive research, and this knowledge flows into the pharmaceutical industry, creating a wealth of new drug development pipelines.
As per Table 3, the United States has a higher percentage of companies that offer patent licenses. It is estimated that the number of outside-in activities is far below that of other OI activities because the number of purchasing companies is small.
4.2. Variables
The frontier analysis is based on quantitative methods for business and management, where assets, R&D expense, and employees are set as input variables, while revenues are set as output variables. However, the focus on R&D efficiency evaluation leads us to reviewing the literature on input–output selection. For instance, R&D expenditures and personnel are two inputs that have been broadly employed in R&D efficiency evaluation.
The characteristics of each variable (see Table 3) shows that the deviation values are large because each group includes companies of various sizes. By comparing the average and median values of each variable, we find their magnitudes to be significantly different. Among them, the coupled group is the most divergent, with many enterprises and a mix of companies of various sizes. It seems that various companies, from the largest to the smallest, are engaged in cooperative transactions. This group also includes items characterized by high R&D expenses. The inside-out group is generally small, with less variation. The average and median values are less than half of those of the other groups.
5. Results
The probabilistic SFA model is effective in comparing the efficiencies of companies with in a group. A company’s TE cannot be used to compare the efficiencies between groups with different technical characteristics. However, this value can overcome these limitations if we calculate the additional decomposition. We thus propose a more transparent analysis of the technology gap of different groups, as well as their efficiency level. The ratio of averaged technical differences, random error, and TE provides us with an additional explanation compared to the analysis based only on the stochastic frontier function of the different groups. The TGR plays an important role in explaining the ability of a group of companies to compete with other companies in different groups within the industry. This ratio estimates the technical gap between the entire group and the industry as a whole.
As previously mentioned, we categorized pharmaceutical companies operating in the United States into four groups based on OI strategy. We evaluated the production function of each company from the SFA operation, and then calculated the meta-frontier production function.
Table 4 and Table 5 show the SFA and MFA calculation results, respectively. First, the first column in each of the four groups provides the value of the production functions (TE). The two columns on the right display the TGR derived from the MFA operation. The estimated results show the highest average TE value (0.587) for the closed group (see Table 5), followed by the coupled (0.519); the outside-in (0.487); and the inside-out group (that is, TE: coupled > closed > outside-in > inside-out). The TGR, which compares the efficiency of a group by measuring the distance between the discovered meta-frontier and the group frontier production function, has the opposite result (that is, TGR: inside-out > coupled > outside-in > closed).
The question is, when we consider the industry as a whole, why does the group with the highest TE value record a relatively low TGR? Conversely, why does the inside-out group, which has significantly lower TE values, record higher TGR values?
If a company has significantly higher TE value in a group, the TE value of other companies are relatively low. Subsequently, the resulting average TE value of this group would be lower. In this case, companies that have achieved exceptionally high performance may have achieved innovation as well. Conversely, leveled groups will generally register small differences between TE values. In this case, most companies would achieve relatively high TE values.
The TE values are calculated only within the group. Therefore, the comparison between groups in the TE graph is meaningless. However, we use the graphs to observe time-series changes more easily. The TE and TGR values are both 1 when the efficiency shows perfect efficiency, and the relative comparison of the productivity of each company shows similar values. The difference is that the TGR compares one group at a time, which allows us to see the bigger picture.
The number of units represent statistical significance even when divided by year and group. Hence, we consider the changes by year (Figure 2) in the average values of TE and TGR. TE values in four graphs, each group has a large efficiency change year after year, which also drops sharply. However, TGR values, generally, all groups operate more reliably in higher numerical ranges.
The inside-out group (A) stays at has the lowest score in the TE, but stably shows a high and stable figure in the TGR graph. It is the closest group to the meta-frontier line because it keeps the highest TGR score compared to the other three groups. As previously mentioned, a small number of innovative companies may raise efficiency standards, which may mean that the average efficiency within a group is significantly different. The analysis shows that the group is constantly innovating or pursuing high-risk, high-return. As mentioned above, this group with a low average TE value and a high average TGR value. If we were to analyze only the average value of the TE is analyzed, this group can would be misunderstood as a group one with low production efficiency. The reason for this is because difference is that the value of the frontier is set at a high standard, with a small number of outstanding companies. Although the majority of the companies have achieved satisfactory results, they can be considered to for as have low technical efficiency TEs because the frontier value is too high.
In outside-in group (B) in 2001, the highest TE value among the four groups showed a high performance, but then plummeted, and since 2011, it has continued to decline year by year. The TGR value is a weak decline, but it has risen in 2006–2008 and in 2011–2013. The change in TE value is assumed to be due to deterioration of management conditions, innovation and the spread of innovation in this group. During both periods of 2001–2003 and 2012–2013, the TE value declined and the TGR value rose. In the previous period, the productivity crisis was a concern due to a decline in the number of FDA-approved medicinal substances. In the following period, profits from large-scale patent expiration deteriorated. On the other hand, in both periods, some companies started to sell biopharmaceuticals and achieved differential growth [6].
The coupled group (C) has the most noticeable feature—it has the highest average value in TE. The TE graph shows a steep improvement in the index between 2007 and 2011, but declines without change after peaking. In the TGR graph, this group steadily falls from the highest value to the lowest in recent years. TE prices rose until 2009 and then turned downward. Improvements such as cost reduction have been made continuously, but they have not achieved innovative results. Or it could have achieved high efficiency by succeeding in innovation in other groups in the industry. The TGR value is steadily declining, which means that this group is moving away from the highest efficiency levels in the industry. The continuing decline in TE and TGR since 2009 suggests that this group's revenue mode has deteriorated or that its business environment has changed. The net income is gradually falling, causes could be inferred that the barriers to entry were lowered or the competition among companies became more intense.
The coupled group includes outsourcing and solution providers at a high rate. While the TE values are high, the TGR is continuously declining. Although it is highly efficient in terms of revenue versus investment, it is gradual in the U.S. pharmaceutical industry as a whole, but continues to be inefficient. This can be seen as equalization among firms, or less dynamism and innovation. The exact cause needs to be understood through the transaction information or a company interview.
Closed group (D) as opposed to inside-out groups, are close to the average of TE and TGR and will rise or fall in the same direction until 2009. During this period, it seems that no innovation has taken place within this group. However, after 2009, TE values have fallen and TGR values are moving upside down. This seems to be the result of some companies achieving innovation. There were several blockbuster patents expired at this time, and sales of generic drugs increased.
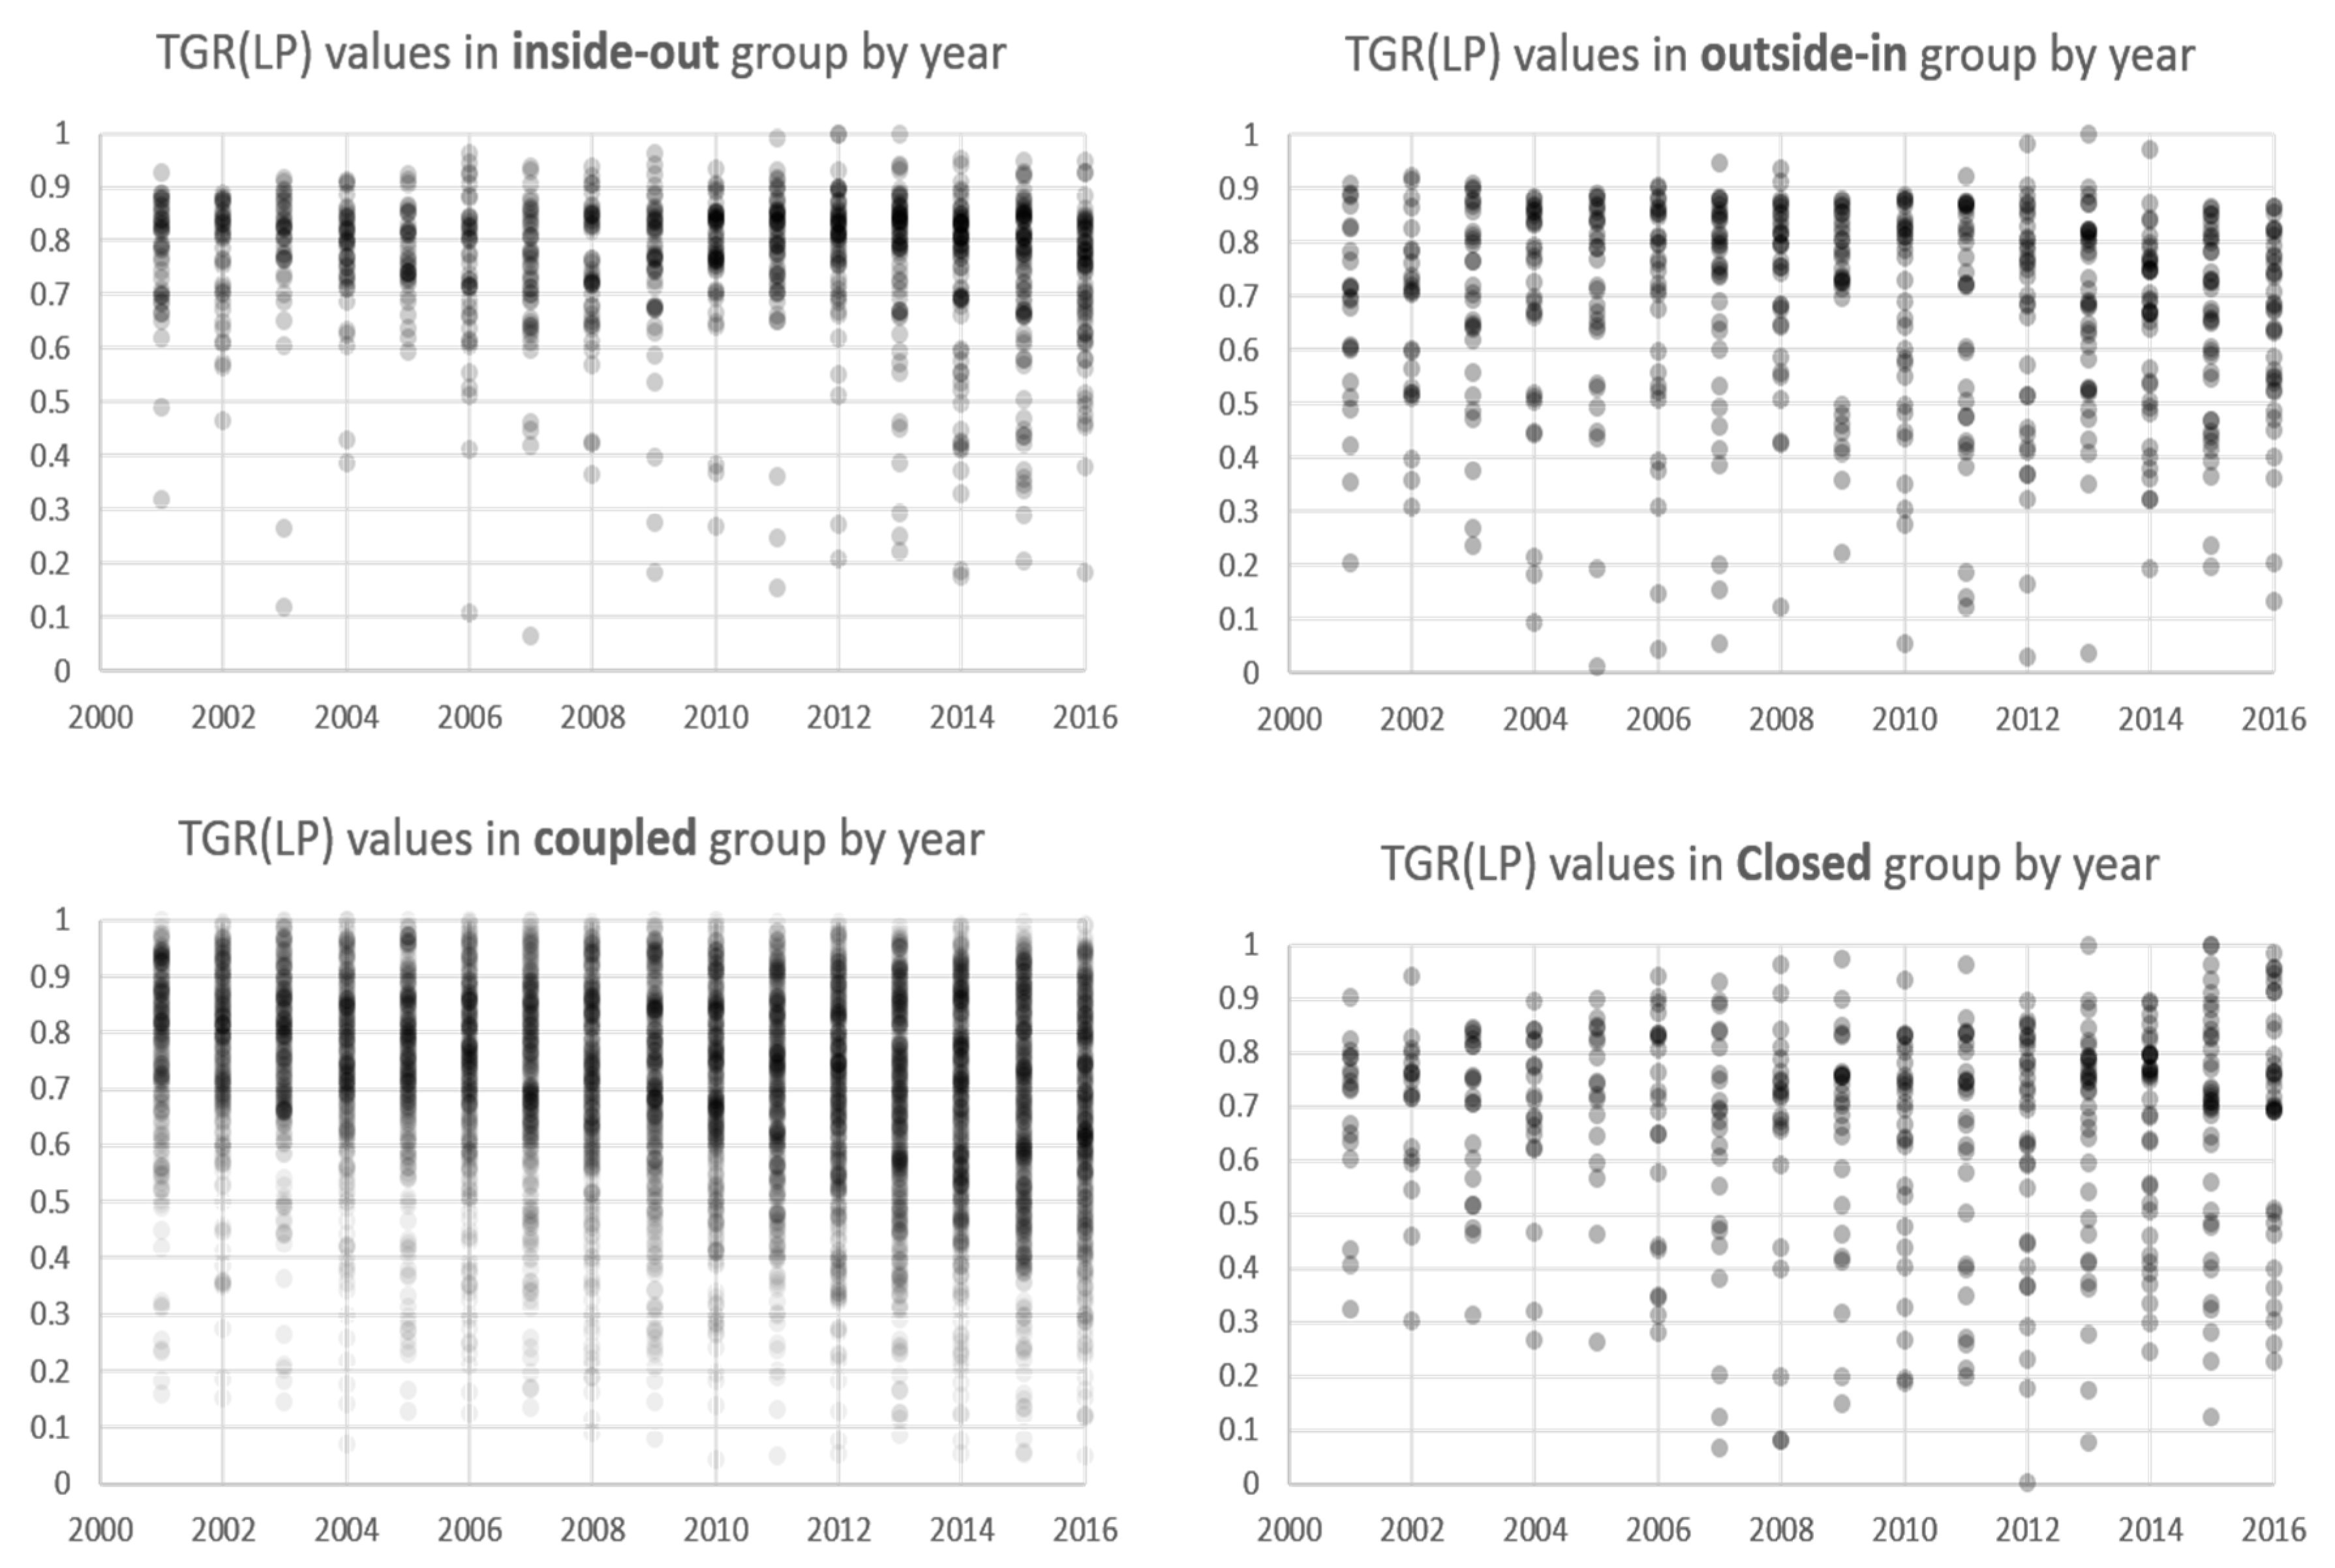
Table 6 presents the estimation results. This shows the production function estimates for all groups. Figure 3 shows the TGR values of companies for each year as translucent dots. This illustration helps us understand deviation, density, and so on, which are otherwise difficult to understand when simply observing the average value. The dark area is where many TGR values are concentrated, as the TGR value either records the median score or the point, at which both the high score and low score appear together. For the early 2000s, the TGR values are clustered in the high score range. However, over time, they gradually expanded, which is common to all groups.
The TGR values of each individual company are verified to clearly understand the characteristics of each group without falling into the error of the average value (see Figure 3). In all groups, we find the TGR values near the meta-frontier line to be close to 1. However, the graph shows different aspects for each group. First, the inside-out group has a significantly low TGR value of 0.5, while most companies are in the 0.7 to 0.9 range. The distribution within this group has widened in the past five years, but there are a considerably larger number of companies for the frontier line than in the other groups. In the outside-in group, the pharmaceutical giant that recorded an earnings boost in 2012 and 2014 hit the frontier line, but recorded a variety of distributions. In the closed groups with the largest number of companies, we find the highest annual values, but enterprise TGR values are widely distributed from 0.4 to 0.95. As the distribution spreads more widely each year, the overall average declines. The closed groups are gradually divided into upper and lower groups after 2005. The top-tier group grew more toward the frontier line over the past two years, with better performance. The subgroups show a TGR below 0.5.
Companies with the highest average TGR values from the inside-out group (Table 4 and Table 5) are mostly well-established companies cutting-edge medical technology. Many of them have advanced medical technologies that emerged as new alternatives beyond traditional therapeutic approaches, such as cell therapy, regenerative therapy using stem cells, and cancer therapy using immune cells. These technologies are based on biotechnology, and have been recently subject to experimental treatment. Pathfinder Cell Therapy, which has the highest mean TGR value, has developed a novel cell-based therapy to treat diabetes, renal disease, myocardial infarction, and other diseases. Other companies are either those that specialize in chemical products and materials technology, or in information technology (IT). The most efficient companies in the outside-in group are those that exclusively supply products in specific areas with specific expertise. The products sold by this group include cryogenic cooling technology, computerized solutions, knee joint implants, ophthalmic medical devices, and medical devices that measure and transmit patient’s heart rate defibrillation. These companies have mature technologies that can already be commercialized. Moreover, they often created goods or services based on their technologies, which are also better known to the public than those made by the inside-out group. Such goods and services have proven safety and effectiveness, and sometimes bypass existing technologies. Analyzing the homepages of these companies shows they offer the most exclusive technology in the industry and they are wary of competitors that sell similar products.
It was difficult to find information that targets a specific disease in the introduction information of the coupled group of companies. These companies have technologies or solutions that could be applied to a variety of fields, rather than products based on specific diseases. There are numerous types of technology-oriented companies that involve operations such as facility manufacturing, platform construction, gene diagnosis, critical care emergency treatment, computerized tomography system, injection and inhalation technology, and technologies that optimize solutions according to disease types. These companies emphasize their unique technologies and consider them as concrete solutions for other companies. This indicates that such companies may operate in the Business-to-Business (B2B) environment, which targets other professionals. However, the terminology used makes them inaccessible to ordinary consumers.
6. Discussion
This study used financial information from 2001 to 2016 to determine how effective have U.S. pharmaceutical companies been. Based on negotiation data from the same period, companies were designated an “OI type” and grouped accordingly. We analyzed as many U.S. companies involved in the pharmaceutical industry as possible.
According to the analysis, the efficiency of the outside-in group, which comprises many large pharmaceutical companies, has been steadily declining. In fact, researchers [5,7,19,20] have been concerned with the ongoing crisis in this industry and the lack of efficiency improvement, which have yet to be solved.
Our empirical data provide evidence to show that efforts have been made to determine change in this group. The data show that large-scale investments have been made, corporate efficiency has fluctuated, and that the success or failure of the investment performance has resulted in a decline in the efficiency figures for each individual company. Next, the efficiency of the inside-out group was consistently high, with increased TGR value. The companies in this group were small in scale, with short histories. Among the companies with high efficiency scores are those that achieved success in biotechnology. These companies performed well in technologies that are expected to change the future medical paradigm, such as cell therapy, stem cells, genetic information analysis, and data analysis. Based on this technology, they can either attract investments or choose to license, that is, sell their solutions to other pharmaceutical companies. This is in line with the view that pharmaceutical R&D takes place within the enterprise but is also procured from outside, such is the case for small businesses and public institutions [55,56,57]. Small biotech companies and biopharmaceutical companies maximize the success rates of their research by focusing on highly specialized technologies or specific diseases. These companies tend to pursue exit strategies to either sell their technologies or be acquired by large companies. This is because the later steps in technology or drug development are not financially feasible to them, owing to the high costs of clinical trials and commercialization. Similarly, in an environment of rapidly changing technology flows, large companies do not find it feasible to conduct research internally. Consequently, finding promising new drug candidates with the intent to buy them saves time and lowers the probability of failure. [58,59]. Effective R&D management is thus crucial to a company’s ongoing survival because it increases R&D efficiency, innovation, and financial performance. An accurate understanding of R&D projects contributes to a company’s strategic decision-making for sustainable management based on empirical analysis and evaluation [60].
The OI activities of U.S. pharmaceutical companies confirm the mechanisms that help improve their economic efficiencies. Although previous studies reported the economic benefits of OI [30], we note that OI influences business activity through a variety of factors besides financial variables. We previously defined various variables that do not translate into amounts. For example, saving time through OI is possible for both the inside-out and outside-in groups. Incorporating an innovation process, and, then taking full advantage of an innovation, can save time. Conversely, using the innovation process externally can hasten direct merchandising and profitability, resulting in the creation of direct cash flows. One innovation process, combined with various ideas, can bring products and services to the market, and, thus increase the value of R&D. Consequently, various OI activities can increase R&D efficiency in many ways [61].
Finally, there are many variables that are difficult to quantify, such as experts’ abilities, contracting power, corporate culture, collective intelligence, accumulated learning, absorption capability, individual benefit, and intrinsic motivations [62,63,64,65,66,67]. Organizational learning capabilities, collective intelligence, and corporate culture also have a significant effect on the success and failure of OI activities [68]. However, companies need appropriate research personnel and capabilities as they require extensive internal knowledge to adopt the knowledge and skills created by external organizations. Despite these reasons, the economic benefits of OI activities arise from ambiguous standards and measurement difficulties. Financial variables are often used when measuring R&D efficiency, although other variables could be used for this purpose. Nevertheless, the calculations are generally based on the ratio of expected revenue to R&D cost.
6.1. Implications
R&D efficiency in the pharmaceutical industry is a sensitive issue because R&D projects require many resources, and the success and failure of these projects determine the survival of a company. We confirmed that the prevalent concerns in this industry do not necessarily determine its downfall, but indicate a change of technology and its structure. We also examined the groups that have recently improved their efficiencies. In short, the industry has been working more collaboratively and innovatively since the 2010s. We thus identified frontier companies that have achieved higher standards each year through diverse efforts in a bid to respond to change dynamically.
Dahlander and Gann (2010) [69] argued that openness and efficiency are inversely correlated. Thus, each company should make strategic decisions based on a balance of costs and benefits. Openness and cost increase together because of the increased external communication and complexity of internal processes. Exploring new opportunities would thus require increased costs for learning and communication, and the risk of corporate secrets being leaked. The complexity of such processes further increases when information and technology are traded with different external organizations during collaboration. For example, a company with a high degree of openness may rely on open revenue in a joint project, lower the barriers to entering the business, increase competition, and eventually lower its profits even at high growth rates. Businesses can benefit from negotiations when they have exclusive core competencies [70]. This can be understood as risk management. Particularly, pharmaceutical R&D requires risk management because of the large size of R&D expenditures. Therefore, an effective R&D risk management enhances corporate sustainability [60]. Additionally, OI is a positive and flexible substitute for environmental change or risk. Connecting and communicating using the knowledge systems of each organization should be based on mutual respect, responsibility, and trust, and a community with these virtues can develop robust, resilient, and agile management responsiveness to change [71].
Our study showed that the efficiency of a company varies according to the OI strategy it pursues. Considering the worsening business environment post-2000s, openness and efficiency have differed according to the strategies U.S. pharmaceutical companies pursued. Each company has sought different strategies according to situation and the internal resources it holds. Nevertheless, the strategies resulting in higher efficiency in the 2000s were found to be inside-out strategies.
Conversely, the efficiency value of the outside-in group fluctuates or decreases. Consistently, Companies in this group should actively experiment with innovations to escape their current unstable orbit. They should also consider developing new business models that increase their inside-out transactions to recover their investment or generate new revenue. As such, it is also necessary to share their risk with other players because volatility is a business risk factor. It is dangerous to adhere to the strategy of pursuing blockbuster drugs in a changing environment. Thus, implementing a business model that generates stable margins, but also stable profits through generics or improved drugs, could be a viable option.
Companies can grow by abandoning past rules and accepting new ones. The traditional pharmaceutical business model, which was effective until the 1980s, is now losing its importance. One proof of this paradigm shift is the continued underperformance of R&D efficiency. This will eventually make it increasingly difficult to export new drugs to the market using previously successful strategies. Success will be elusive if companies continue to focus on old rules, prestige, and reputation. Our study confirmed that the companies that achieve high efficiency and reliability are also the ones that have accepted new disciplines, leveraged new technologies, and experimented with new business models. The performance of the outside-in group shows that it is not enough to accept external research results, but companies must accumulate core competencies as well.
However, we suggest that companies avoid doing this alone. It is possible to seize opportunities by abandoning exclusive closures such as “not invented here” and communicating with the outside world. Innovation takes place in knowledge-rich environments, characterized by intense fusion of knowledge from the outside as well as from within the company. Even in the closed group, we found that companies actively accepted new opportunities for generic drugs and made use of them. Thus, efficiency increases when companies increase profits or reduce costs. As such pharmaceutical companies can pursue high added value, but can also increase efficiency through cost savings. Further, they must seek creative and collaborative options to the costly processes of clinical trials, marketing, and sales. Companies in the coupled group that can borrow resources from firms and minimize inefficiencies can thus achieve high efficiencies. Yesterday’s competitors can be today’s partners. Essentially, allowing all possible stakeholders to participate in the idea pool could help achieve higher efficiency.
6.2. Limitations
However, our study is also beset by certain limitations. First, there was a limitation in dividing the OI group. An analysis of 16-year contracts according to the proportion of OI types was conducted. However, we could not reflect how the change in management strategies reflected the changes in our analysis. It would thus be interesting to compare the historical changes in contract trends until the present day.
Furthermore, we note that a single analytical method can provide only one viewpoint. When diverse methods of analyses are used, the scope of a study can be understood with greater precision and insight. Thus, despite the abundant interpretations and insights provided in our study, we must conduct further analyses to better understand the industry. Efficiency and inefficiency are good references for building corporate management strategies, but they cannot be absolute. The efficiency of a company is measured only by the presence of a better performing company because efficiency is inevitably a relative concept.
Finally, we analyzed efficiency by each company and fiscal year. Our focus was on how management strategy and openness affect corporate efficiency. However, the point in time of the investment and when revenue was generated do not coincide, which can cause the efficiency value to fluctuate. However, we urge scholars to analyze efficiency at the project le vel within the enterprise, as we did not have access to the information from inside the company. Therefore, in-house information could help measure efficiency by project and product more accurately.
Author Contributions
Conceptualization, Kisoon Shin and E.K.; Methodology, D.L.; Software, D.L.; Validation, Kisoon Shin and E.K.; Resources, E.K.; Writing-Original Draft Preparation, Kisoon Shin; Writing-Review & Editing, Kwangsoo Shin and E.K.; Visualization, Kisoon Shin; Supervision, Kwangsoo Shin and E.K.; Funding Acquisition, E.K. All authors read and approved the final manuscript.
Funding
This paper received ‘best paper award’ at SOItmC 2018 conference. This research was supported by the International Science and Business Belt Program through the Ministry of Science, ICT and Future Planning (2016K000282), Republic of Korea. This research was supported by a grant of the Medical Research Information Center of the National Research Foundation through the Ministry of Science and ICT (2018R1A6A6040880), Republic of Korea.
Acknowledgments
The authors thank JH.Lee. (Chungbuk National University) and ES.Jung. of KISTI (Korea Institute of Science and Technology Information) The discussions and feedback from them were helpful. Because of their advice, we were able to attend the conference and receive the Best Paper Award. Also thanks to anonymous working group members of R&D Management Research Team, Chungbuk National University.
Conflicts of Interest
The authors declare no conflict of interest.
Appendix A
Figure A1.
SFA (stochastic frontier analysis).

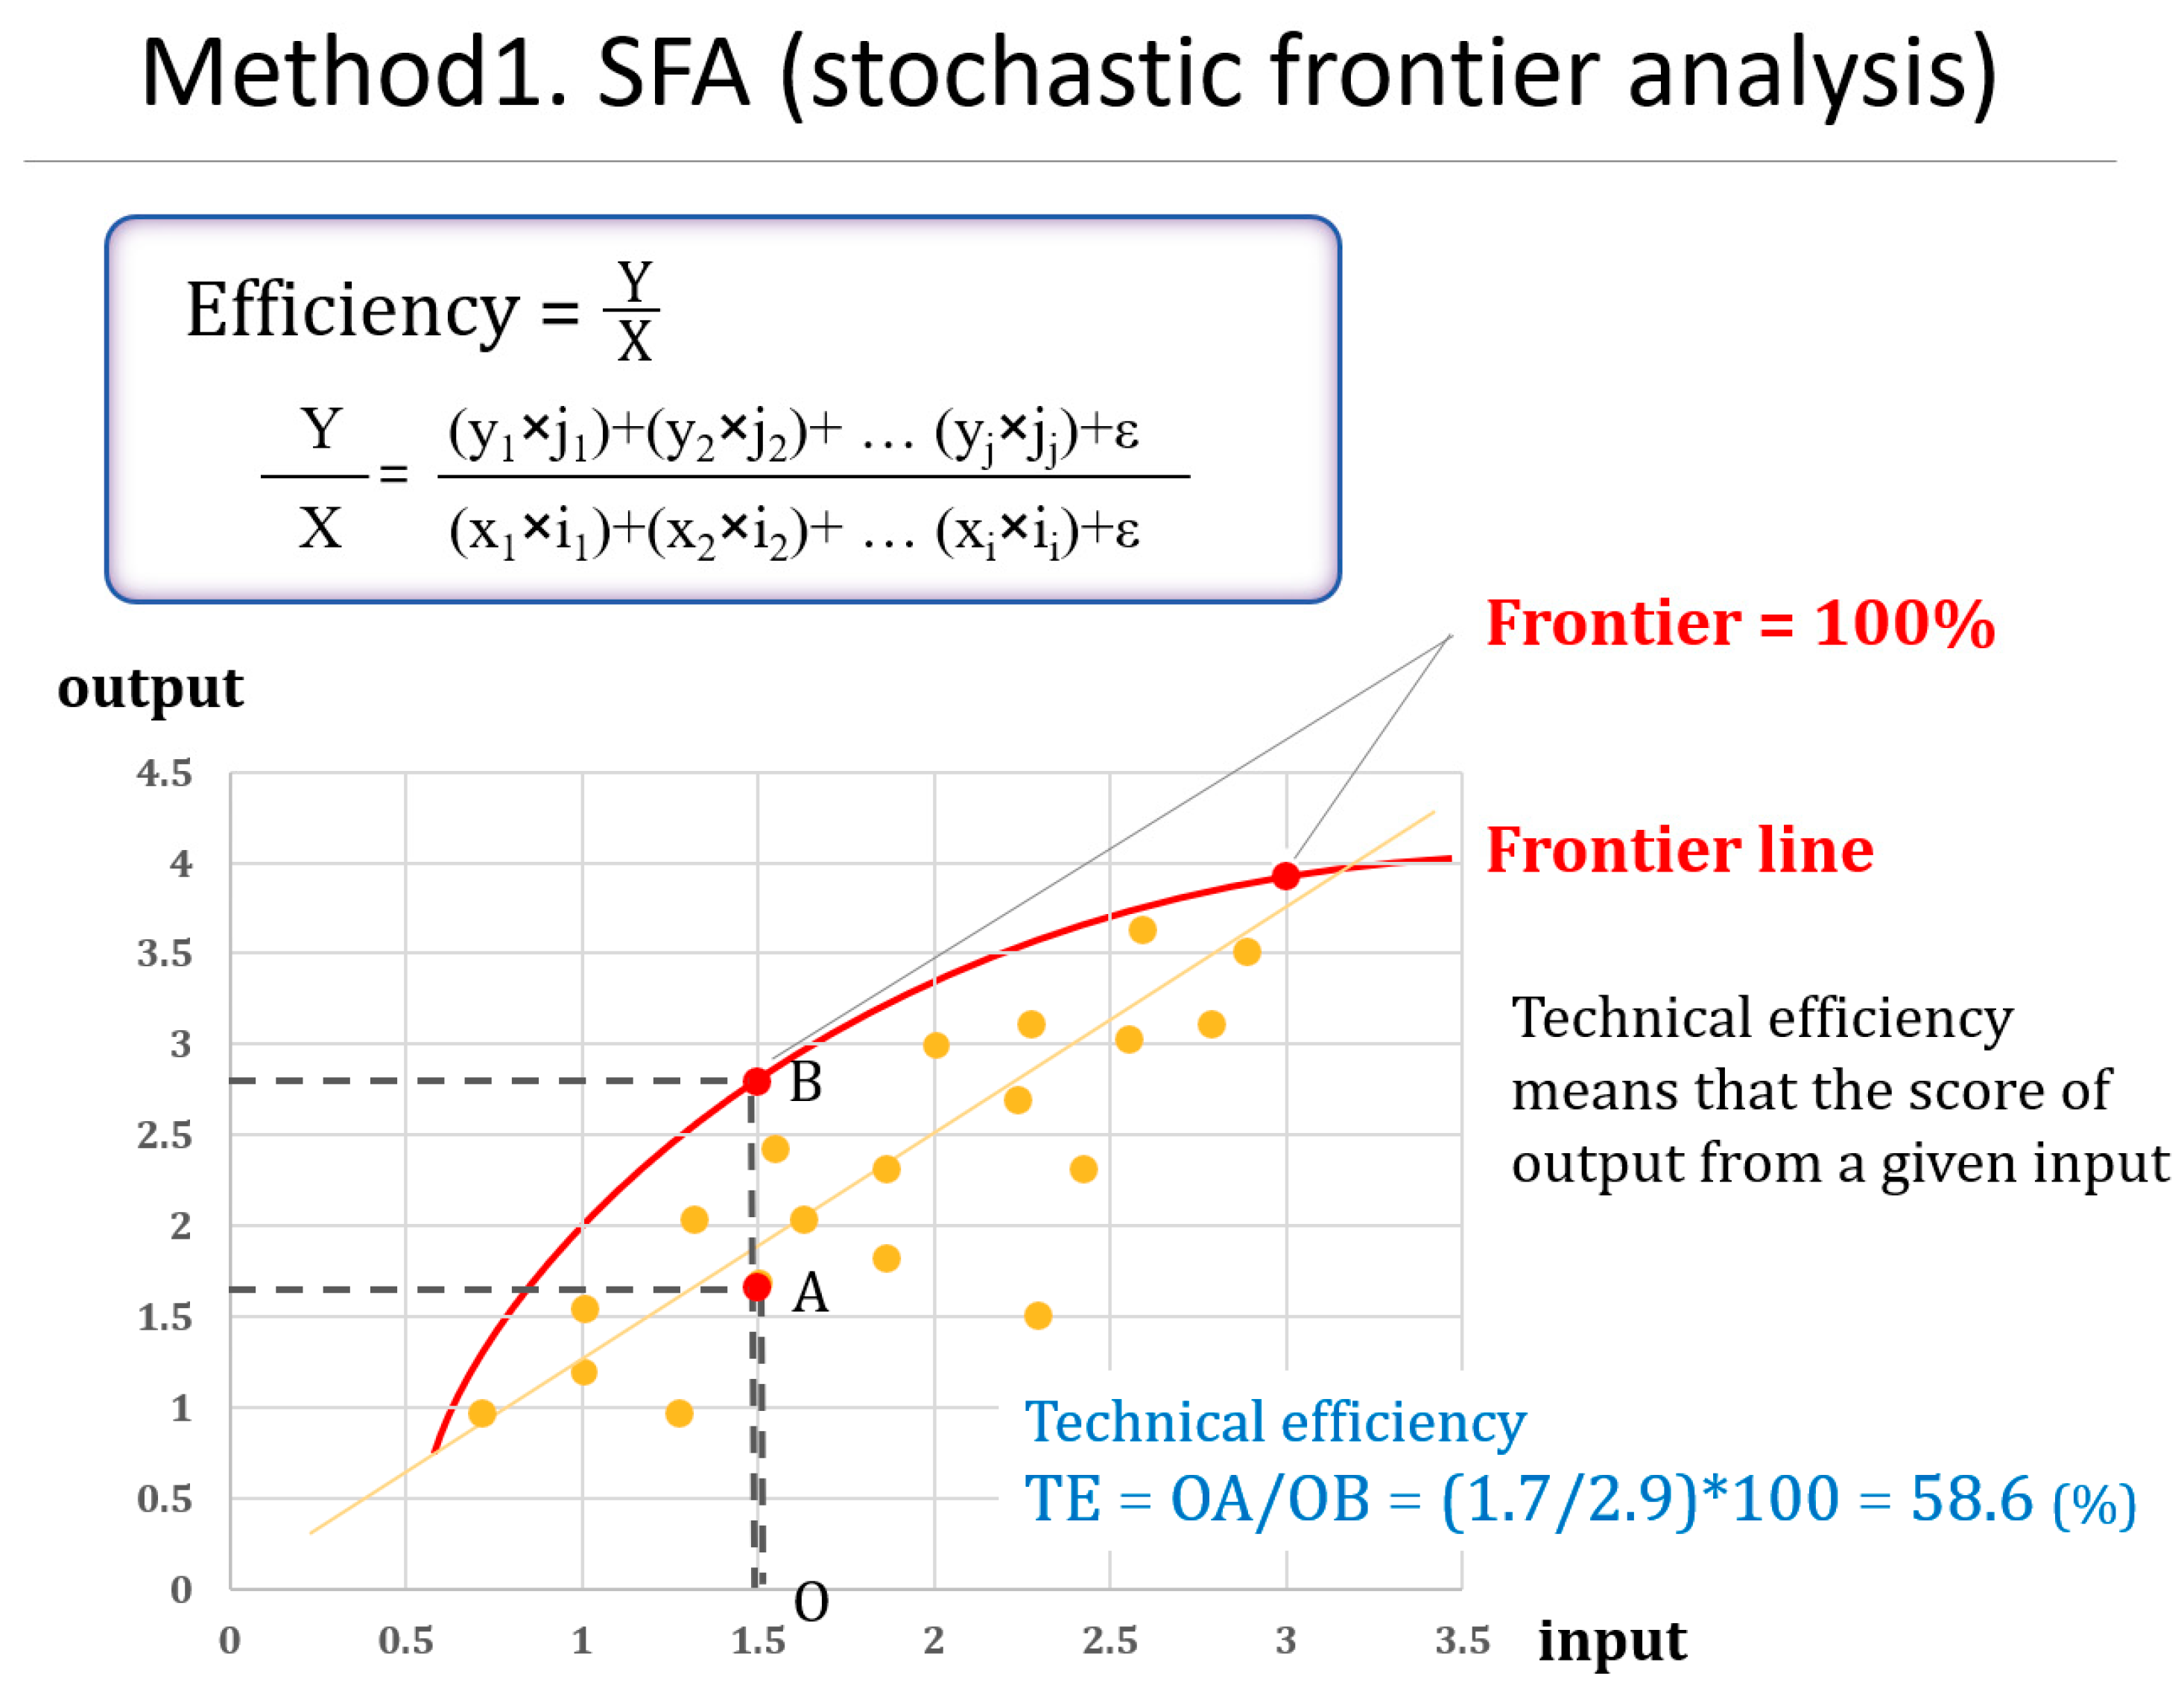
The basic concept of efficiency is the ratio of input to output (x division y). In a company, input and output do not have one-to-one correspondence, but rather various input elements to obtain the various output elements. Thus, a company’s input factors can be expressed as x1, x2, …, xi, and each of the output factors can be expressed as y1, y2, …, yj. Each company can organize the total input to total output in one formula, which is the same as in the purple box. If there are groups of the similar characteristics using the same technology, each company can display like the orange dot in the bottom graph through total input and total output. Through the value of a company with the highest efficiency in a group, the theoretical maximum possible production function can be expressed as the Frontier line (red line). This line assumes 100% efficiency. So the company (B) located on the frontier line has achieved 100% efficiency. Technical efficiency (TE) is the ratio of the value of the firm to the value of the frontier line with the same input (x). The frontier production function estimates the TE using the maximum output of a given input. The TE value of the A company has the same x value, and becomes the y value ratio with B on the frontier line (TE of A = OA/OB).
Figure A2.
Meta-frontier analysis.

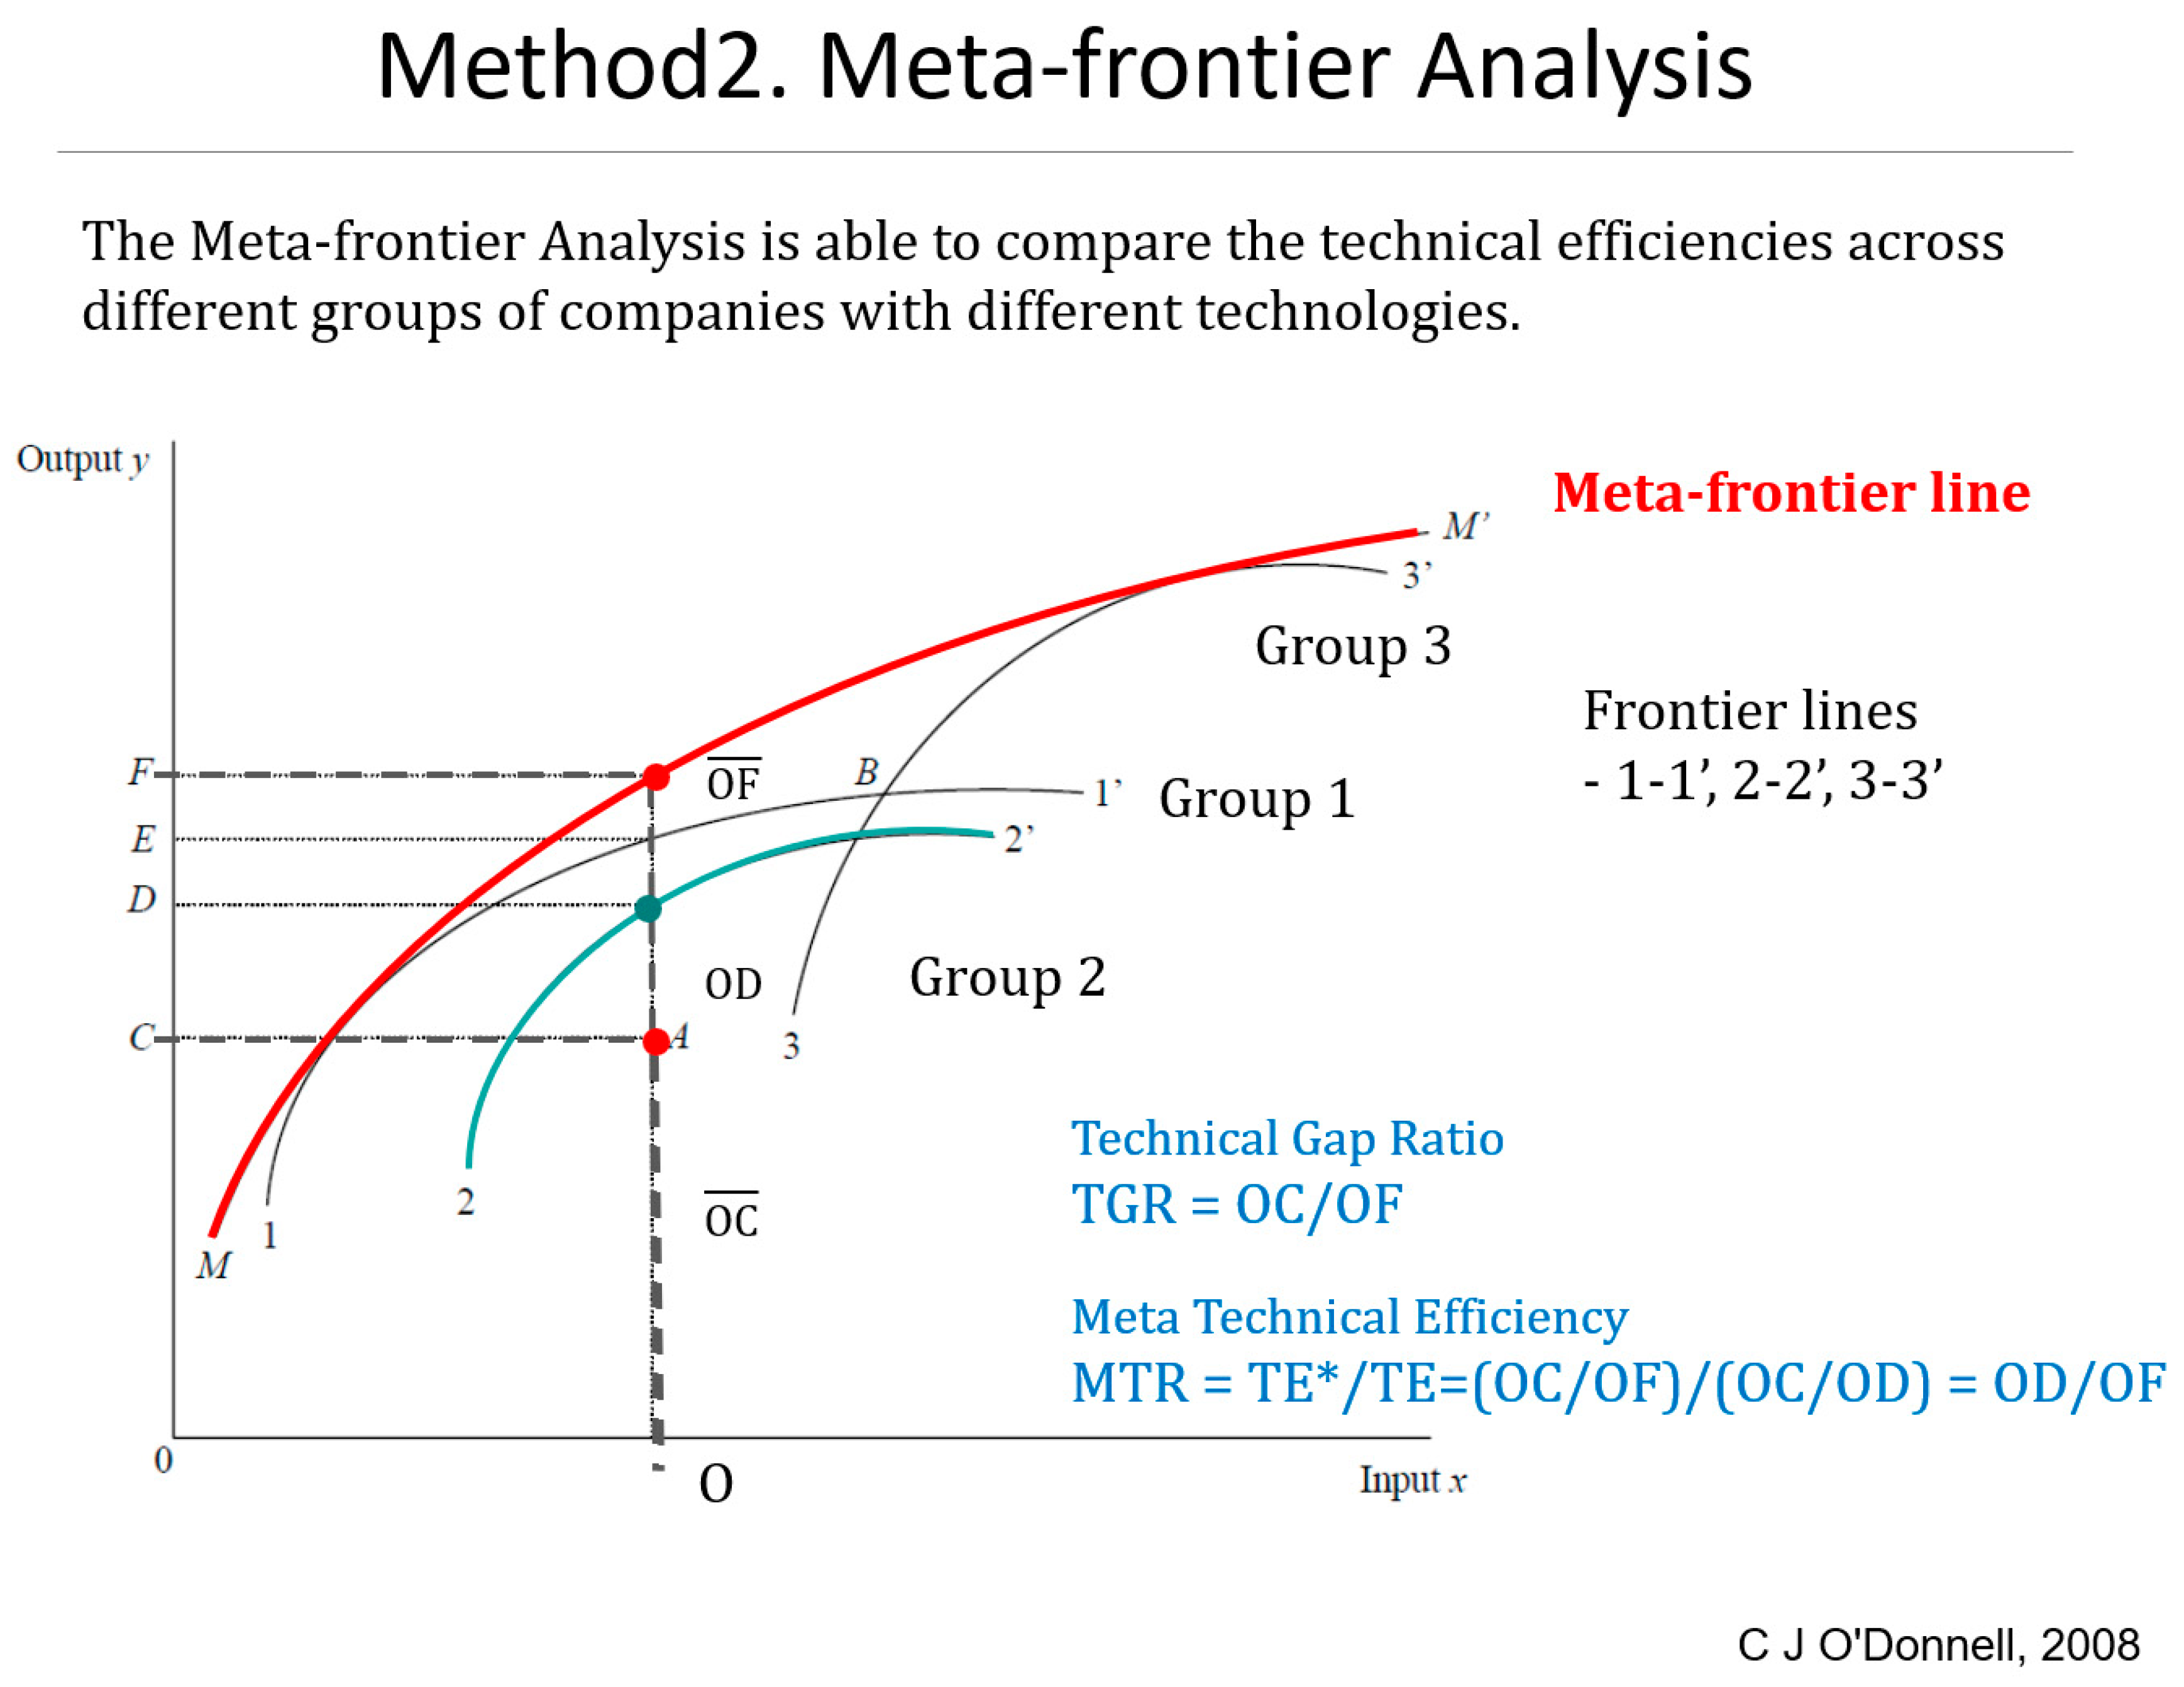
In the real world, there are few uniform groups using the same technology. It is much more common to compare and analyze companies and industries with different characteristics. Therefore, in order to compare different groups of characters, a method of deriving the meta-frontier line by calculating the productivity function involving each group and analyzing how efficient each group is was developed. As a result of calculating the meta-productivity function, a meta-frontier line (red line) is derived, and a technical gap ratio is produced to determine the position of each group or to verify the meta-efficiency of the affiliated company. This line assumes 100% efficiency. So the group’s frontier-line located on the meta-frontier line has achieved 100% efficiency. This line assumes 100% efficiency. So the group's frontier-line located on the meta-frontier line has achieved 100% efficiency. TGR is the ratio of the distance between the frontier line and the frontier, such as the TE of the SFA.
References
- Grabowski, H.; Vernon, J. The Determinants of Pharmaceutical Research and Development Expenditures. J. Evol. Econ. 2000, 10, 201–215. [Google Scholar] [CrossRef]
- Morgan, S.; Grootendorst, P.; Lexchin, J.; Cunningham, C.; Greyson, D. The Cost of Drug Development: A Systematic Review. Health Policy 2011, 100, 4–17. [Google Scholar] [CrossRef] [PubMed]
- Joseph, A.D.; Henry, G.G.; Ronald, W.H. Innovation in the Pharmaceutical Industry: New Estimates of R&D Costs. J. Health Econ. 2016, 47, 20–33. [Google Scholar] [CrossRef]
- Schuhmacher, A.; Germann, P.-G.; Trill, H.; Gassmann, O. Models for Open Innovation in the Pharmaceutical Industry. Drug Discov. Today 2013, 18, 1133–1137. [Google Scholar] [CrossRef] [PubMed]
- Rafols, I.; Hopkins, M.M.; Hoekman, J.; Siepel, J.; O’Hare, A.; Perianes-Rodríguez, A.; Nightingale, P. Big Pharma, Little Science? A Bibliometric Perspective on Big Pharma’s R&D Decline. Technol. Forecast. Soc. Chang. 2014, 81, 22–38. [Google Scholar] [CrossRef]
- Munos, B. Lessons from 60 Years of Pharmaceutical Innovation. Nat. Rev. Drug Discov. 2009, 8, 959–968. [Google Scholar] [CrossRef] [PubMed]
- Carter, P.H.; Berndt, E.R.; DiMasi, J.A.; Trusheim, M. Investigating Investment in Biopharmaceutical R&D. Nat. Rev. Drug Discov. 2016, 15, 673–674. [Google Scholar] [CrossRef] [PubMed]
- Settanni, E.; Harrington, T.S.; Srai, J.S. Pharmaceutical Supply Chain Models: A Synthesis from a Systems View of Operations Research. Oper. Res. Perspect. 2017, 4, 74–95. [Google Scholar] [CrossRef]
- Moors, E.H.M.; Cohen, A.F.; Schellekens, H. Towards a Sustainable System of Drug Development. Drug Discov. Today 2014, 19, 1711–1720. [Google Scholar] [CrossRef] [PubMed]
- Gautam, A.; Pan, X. The Changing Model of Big Pharma: Impact of Key Trends. Drug Discov. Today 2016, 21, 379–384. [Google Scholar] [CrossRef] [PubMed]
- Segers, J.P. Towards a Typology of Business Models in the Biotechnology Industry. Ph.D. Thesis, University of Liège, Liège, Belgium, November 2017. [Google Scholar] [CrossRef]
- Schuhmacher, A.; Gassmann, O.; Hinder, M. Changing R&D Models in Research-Based Pharmaceutical Companies. J. Transl. Med. 2016, 14, 105. [Google Scholar] [CrossRef] [PubMed]
- Bogers, M.; West, J. Innovation Creation and Commercialization beyond the Firm: A Multi-Level Framework. In Proceedings of the DRUID Society Conference 2014, Copenhagen, Denmark, 16–18 June 2014; pp. 1–31. [Google Scholar]
- Grabowski, H. The Link between Gross Profitability and Pharmaceutical R&D Spending. Pharm. Res. 2001, 20, 216–220. [Google Scholar] [CrossRef]
- Schoar, A. Effects of Corporate Diversification on Productivity. J. Financ. 2002, 57, 2379–2403. [Google Scholar] [CrossRef] [Green Version]
- Wang, E.C.; Huang, W. Relative Efficiency of R&D Activities: A Cross-Country Study Accounting for Environmental Factors in the DEA Approach. Res. Policy 2007, 36, 260–273. [Google Scholar] [CrossRef]
- Jena, A.B.; Philipson, T.J. Cost-Effectiveness Analysis and Innovation. J. Health Econ. 2008, 27, 1224–1236. [Google Scholar] [CrossRef] [PubMed]
- Khanna, I. Drug Discovery in Pharmaceutical Industry: Productivity Challenges and Trends. Drug Discov. Today 2012, 17, 1088–1102. [Google Scholar] [CrossRef] [PubMed]
- Wu, Y. Low R&D efficiency in large pharmaceutical companies. Am. J. Med. Res. 2016, 3, 141–151. [Google Scholar]
- Ringel, M.S.; Choy, M.K. Do Large Mergers Increase or Decrease the Productivity of Pharmaceutical R&D? Drug Discov. Today 2017, 22, 1749–1753. [Google Scholar] [CrossRef] [PubMed]
- Kruse, S.; Slomiany, M.; Bitar, R.; Jeffers, S.; Hassan, M. Pharmaceutical R&D Productivity: The Role of Alliances. J. Commer. Biotechnol. 2014, 20, 11–20. [Google Scholar] [CrossRef]
- Carroll, G.P.; Srivastava, S.; Volini, A.S.; Piñeiro-Núñez, M.M.; Vetman, T. Measuring the Effectiveness and Impact of an Open Innovation Platform. Drug Discov. Today 2017, 22, 776–785. [Google Scholar] [CrossRef] [PubMed]
- Mohammadi, E. An Integrated DEA & Rundamental Analysis of Pharaceutical Industry a Case Study of Selected Indian Companies. Indian J. Fundam. Appl. Life Sci. 2016, 6, 326–333. [Google Scholar]
- Gascón, F.; Lozano, J.; Ponte, B.; de la Fuente, D. Measuring the Efficiency of Large Pharmaceutical Companies: An Industry Analysis. Eur. J. Health Econ. 2017, 18, 587–608. [Google Scholar] [CrossRef] [PubMed]
- Ku, M.S. Recent Trends in Specialty Pharma Business Model. J. Food Drug Anal. 2015, 23, 595–608. [Google Scholar] [CrossRef] [PubMed]
- Denoon, A.; Vollebregt, E. Can Regenerative Medicine Save Big Pharma’s Business Model from the Patent Cliff? Regen. Med. 2010, 5, 687–690. [Google Scholar] [CrossRef] [PubMed]
- Aitken, M. Medicines Use and Spending in the U.S. A Review of 2016 and Outlook to 2021. Available online: https://www.iqvia.com/institute/reports/medicines-use-and-spending-in-the-us-a-review-of-2016 (accessed on 4 May 2017).
- Chesbrough, H.W. The Era of Open Innovation. MIT Sloan Manag. Rev. 2004, 45, 26–32. [Google Scholar]
- Chesbrough, H. The Future of Open Innovation: IRI Medal AddressThe Future of Open Innovation Will Be More Extensive, More Collaborative, and More Engaged with a Wider Variety of Participants. Res. Technol. Manag. 2017, 60, 29–35. [Google Scholar] [CrossRef]
- Enkel, E.; Gassmann, O.; Chesbrough, H. Open R&D and Open Innovation: Exploring the Phenomenon. R&D Manag. 2009, 39, 311–316. [Google Scholar] [CrossRef]
- Veugelers, R.; Cassiman, B.; van de Vrande, V.; Vanhaverbeke, W.; Duysters, G.; Saebi, T.; Foss, N.J.; Fujiwara, T.; Lee, J.; Min, J.; et al. Open Innovation: The Role of Collective Research Centres in Stimulating. R&D Manag. 2009, 39, 1–49. [Google Scholar]
- West, J.; Bogers, M. Open Innovation: Current Status and Research Opportunities. Innovation 2017, 19, 43–50. [Google Scholar] [CrossRef]
- West, J.; Salter, A.; Vanhaverbeke, W.; Chesbrough, H. Open Innovation: The next Decade. Res. Policy 2014, 43, 805–811. [Google Scholar] [CrossRef]
- Gassmann, O.; Enkel, E. Towards a Theory of Open Innovation: Three Core Process Archetypes. R&D Manag. Conf. (RADMA) 2014, 1–18. Available online: https://www.alexandria.unisg.ch/274/ (accessed on 6 July 2004).
- Rangamiztousi, A.; Ismail, K. A Conceptual Framework for the Effect of Open Innovation Practices on Innovation Performance. J. Basic Appl. Sci. Res. 2015, 5, 16–29. [Google Scholar]
- Torres, L.T.R.; Ibarra, E.R.B.; Arenas, A.P.L. Open Innovation Practices: A Literature Review of Case Studies. J. Adv. Manag. Sci. 2015, 3, 362–367. [Google Scholar] [CrossRef]
- Koopmans, T. An Analysis of Production as an Efficient Combination of Activities; Wiley: Hoboken, NJ, USA, 1951; pp. 33–97. [Google Scholar]
- Debreu, G. The Coefficient of Resource Utilization. Econometrica 1951, 19, 273–292. [Google Scholar] [CrossRef]
- Farrell, M.J. The Measurement of Productive Efficiency. J. R. Stat. Soc. 1957, 120, 253–290. [Google Scholar] [CrossRef]
- Aigner, D.; Lovell, C.A.K.; Schmidt, P. Formulation and Estimation of Stochastic Frontier Production Function Models. J. Econom. 1977, 6, 21–37. [Google Scholar] [CrossRef]
- Meeusen, W.; van den Broeck, J. Technical Efficiency and Dimension of the Firm: Some Results on the Use of Frontier Production Functions. Empir. Econ. 1977, 2, 109–122. [Google Scholar] [CrossRef]
- Jondrow, J.; Knox Lovell, C.A.; Materov, I.S.; Schmidt, P. On the Estimation of Technical Inefficiency in the Stochastic Frontier Production Function Model. J. Econom. 1982, 19, 233–238. [Google Scholar] [CrossRef]
- Charnes, A.; Cooper, W.W.; Rhodes, E. Measuring the Efficiency of Decision Making Units. Eur. J. Oper. Res. 1978, 2, 429–444. [Google Scholar] [CrossRef]
- Battese, G.E.; Rao, D.S.P. Technology Gap, Efficiency, and a Stochastic Metafrontier Function. Int. J. Bus. Econ. 2002, 1, 87–93. [Google Scholar]
- Addai-asante, J.; Sekyi, S. Stochastic Frontier Analysis of Production Technology: An Application to the Pharmaceutical Manufacturing Firms in Ghana. World J. Curr. Econ. Res. 2016, 2, 1–20. [Google Scholar]
- Chen, C.-M.; Sheng, T.-C.; Yang, Y.-L. Cost Efficiency Analysis of Taiwan Biotech and Pharmaceutical Industry: The Application of Stochastic Meta Frontier Model. Int. J. Econ. Financ. 2014, 6, 131. [Google Scholar] [CrossRef]
- Huang, C.J.; Huang, T.-H.; Liu, N.-H. A New Approach to Estimating the Metafrontier Production Function Based on a Stochastic Frontier Framework. J. Product. Anal. 2014, 42, 241–254. [Google Scholar] [CrossRef]
- Rajeev, M.; Mainak, M. A Comparative Analysis of Efficiency and Productivity of the Indian Pharmaceutical Firms: A Malmquist-Meta-Frontier Approach; Institute for Social and Economic Change: Bangalore, India, 2009; Volume 223. [Google Scholar]
- Lee, C.; Lee, D.; Hwang, J. Platform Openness and the Productivity of Content Providers: A Meta-Frontier Analysis. Telecomm. Policy 2015, 39, 553–562. [Google Scholar] [CrossRef]
- Na, H.S.; Hwang, J.; Hong, J.Y.J.; Lee, D. Efficiency Comparison of Digital Content Providers with Different Pricing Strategies. Telemat. Inform. 2017, 34, 657–663. [Google Scholar] [CrossRef]
- Shin, J.; Ahn, J.; Lee, D. The Impact of Diversification with and without Commodity Bundling on Corporate Performance: An Empirical Analysis in Korea Telecommunication Markets. Technol. Forecast. Soc. Chang. 2015, 101, 314–319. [Google Scholar] [CrossRef]
- Battese, G.E.; Coelli, T. A Model for Technical Inefficiency Effects in a Stochastic Frontier Production Function. Empir. Econ. 1995, 20, 325–332. [Google Scholar] [CrossRef]
- Battese, G.E. Frontier Production Functions and Technical Efficiency: A Survey of Empirical Applications in Agricultural Economics. Agric. Econ. 1992, 7, 185–208. [Google Scholar] [CrossRef]
- Battese, G.E.; Prasada Rao, D.S.; O’Donnell, C.J. A Metafrontier Production Function for Estimation of Technical Efficiencies and Technology Gaps for Firms Operating under Different Technologies. J. Prod. Anal. 2004, 21, 91–103. [Google Scholar] [CrossRef]
- De Vrueh, R.L.A.; Crommelin, D.J.A. Reflections on the Future of Pharmaceutical Public-Private Partnerships: From Input to Impact. Pharm. Res. 2017, 34, 1985–1999. [Google Scholar] [CrossRef] [PubMed] [Green Version]
- Wang, L.; Plump, A.; Ringel, M. Racing to Define Pharmaceutical R&D External Innovation Models. Drug Discov. Today 2015, 20, 361–370. [Google Scholar] [CrossRef] [PubMed]
- Juliano, R.L. Pharmaceutical Innovation and Public Policy: The Case for a New Strategy for Drug Discovery and Development. Sci. Public Policy 2013, 40, 393–405. [Google Scholar] [CrossRef]
- Dierks, R.M.L.; Bruyère, O.; Reginster, J.Y. Critical Analysis of Valuation and Strategical Orientation of Merger and Acquisition Deals in the Pharmaceutical Industry. Expert Rev. Pharmacoecon. Outcomes Res. 2018, 18, 147–160. [Google Scholar] [CrossRef] [PubMed]
- Malik, N.N. Biotech Acquisitions by Big Pharma: Why and What Is Next. Drug Discov. Today 2009, 14, 818–821. [Google Scholar] [CrossRef] [PubMed]
- Park, J.H.; Shin, K. R&D Project Valuation Considering Changes of Economic Environment: A Case of a Pharmaceutical R&D Project. Sustainability 2018, 10, 933. [Google Scholar] [CrossRef]
- Chesbrough, H. Open Innovation: The New Imperative for Creating and Profiting from Technology; Harvard Business Press: Btighton, MA, USA, 2003; Volume 64. [Google Scholar]
- Hu, Y.; McNamara, P.; McLoughlin, D. Outbound Open Innovation in Bio-Pharmaceutical out-Licensing. Technovation 2015, 35, 46–58. [Google Scholar] [CrossRef]
- Dubickis, M.; Gaile-Sarkane, E. Transfer of Know-How Based on Learning Outcomes for Development of Open Innovation. J. Open Innov. Technol. Mark. Complex. 2017, 3, 4. [Google Scholar] [CrossRef]
- Ah Kim, S.; yun Ryoo, H.; joo Ahn, H. Student Customized Creative Education Model Based on Open Innovation. J. Open Innov. Technol. Mark. Complex. 2017, 3, 6. [Google Scholar] [CrossRef]
- Gambardella, A.; Panico, C. On the Management of Open Innovation. Res. Policy 2014, 43, 903–913. [Google Scholar] [CrossRef]
- Lee, S.; Park, G.; Yoon, B.; Park, J. Open Innovation in SMEs-An Intermediated Network Model. Res. Policy 2010, 39, 290–300. [Google Scholar] [CrossRef]
- Abramo, G.; Moro, P.A.; Ingegneria, F.; Tor, R.; Politecnico, V.; Politecnico, V.; Boehm, D.N.; Hogan, T.; Bradley, S.R.; Hayter, C.S.; et al. Leveraging External Sources of Innovation: A Review of Research on Open Innovation. Ind. Mark. Manag. 2013, 31, 814–831. [Google Scholar] [CrossRef] [Green Version]
- Antons, D.; Piller, F.T. Opening the Black Box of “Not Invented Here”: Attitudes, Decision Biases, and Behavioral Consequences. Acad. Manag. Perspect. 2015, 29, 193–217. [Google Scholar] [CrossRef]
- Dahlander, L.; Gann, D.M. How Open Is Innovation? Res. Policy 2010, 39, 699–709. [Google Scholar] [CrossRef]
- Michelino, F.; Lamberti, E.; Cammarano, A.; Caputo, M. Measuring Open Innovation in the Bio- Pharmaceutical Industry. Creat. Innov. Manag. 2015, 24, 4–28. [Google Scholar] [CrossRef]
- Yang, H.; Lee, H.J. Long-Term Collaboration Network Based on Clinicaltrials.Gov Database in the Pharmaceutical Industry. Sustainability 2018, 10, 322. [Google Scholar] [CrossRef]
Figure 1.
Research design. OI—open innovation.

Figure 2.
Averages in technical efficiency (TE) and technical gap ratio (TGR) values of each group by year. LP—linear programming; QP—quadratic programming. (A) inside-out group; (B) outside-in group; (C) coupled group; (D) closed group.
Figure 2.
Averages in technical efficiency (TE) and technical gap ratio (TGR) values of each group by year. LP—linear programming; QP—quadratic programming. (A) inside-out group; (B) outside-in group; (C) coupled group; (D) closed group.

Figure 3.
TGR values of companies by year.


Table 1.
List of open innovation (OI) activities by OI types. R&D—research and development.
| Inside-Out | Outside-In | Coupled |
|---|---|---|
|
|
|
Table 2.
Number of U.S. OI companies that match the results based on real data.
| All Deals | Deal Involving U.S. Companies | |||
|---|---|---|---|---|
| No. of Cases | Ratio | No. of Cases | Ratio | |
| Total | 267,853 | 100.0% | 22,776 | 100.0% |
| Inside-out | 48,013 | 17.9% | 5117 | 22.5% |
| Outside-in | 48,013 | 17.9% | 4488 | 19.7% |
| Coupled | 115,071 | 43.0% | 12,399 | 54.4% |
| Closed | 222 | 0.1% | 772 | 3.4% |
| Others | 56,534 | 21.1% | - | - |
Table 3.
Descriptive statistics.
| Inside-Out | Outside-In | Coupled | Closed | ||
|---|---|---|---|---|---|
| No. of firms | 112 | 52 | 485 | 52 | |
| No. of observations | 811 | 495 | 4761 | 407 | |
| Y: Revenue | Max | 37,429.00 | 77,567.50 | 2,104,430.00 | 51,035.00 |
| Min | −0.14 | 30.94 | −0.87 | 0.01 | |
| Average | 996.16 | 2665.93 | 24,202.25 | 1807.20 | |
| Median | 12.20 | 36.99 | 42.27 | 55.86 | |
| S.D. | 4264.38 | 10,106.68 | 182,384.37 | 6276.77 | |
| K: Assets | Max | 28,254.00 | 51,790.30 | 2,396,785.00 | 28,827.00 |
| Min | 0.10 | 0.00 | 0.02 | 0.16 | |
| Average | 892.57 | 2304.50 | 27,651.19 | 1729.99 | |
| Median | 47.11 | 14.10 | 101.37 | 77.96 | |
| S.D. | 3382.96 | 7445.09 | 203,254.75 | 5078.20 | |
| M: R&D expense | Max | 409.00 | 10,991.00 | 59,504.00 | 430.00 |
| Min | 0.01 | 0.00 | 0.00 | 0.00 | |
| Average | 25.02 | 239.31 | 896.21 | 28.47 | |
| Median | 6.99 | 4.88 | 16.60 | 3.78 | |
| S.D. | 49.02 | 1147.00 | 5694.22 | 64.40 | |
| L: Employees | Max | 20.40 | 112,089.00 | 128.10 | 62.00 |
| Min | 0.00 | 0.04 | 0.00 | 0.00 | |
| Average | 1.04 | 4047.89 | 4.15 | 3.19 | |
| Median | 0.09 | 50.19 | 0.20 | 0.30 | |
| S.D. | 2.99 | 14,960.71 | 13.61 | 8.62 |
Table 4.
SFA estimates of technical efficiencies and meta-technology gap ratios.
| Inside-Out | Outside-In | |||||
|---|---|---|---|---|---|---|
| TE | TGR_LP | TGR_QP | TE | TGR_LP | TGR_QP | |
| Mean | 0.425 | 0.748 | 0.727 | 0.487 | 0.665 | 0.649 |
| Median | 0.484 | 0.787 | 0.746 | 0.589 | 0.719 | 0.684 |
| St. dev. | 0.274 | 0.147 | 0.122 | 0.274 | 0.201 | 0.178 |
| Minimum | 0 | 0.067 | 0.086 | 0.001 | 0.012 | 0.024 |
| Maximum | 0.927 | 1 | 1 | 0.946 | 1 | 1 |
TE—technical efficiency; TGR—technical gap ratio; LP—linear programming; QP—quadratic programming.
Table 5.
SFA estimates of technical efficiencies and meta-technology gap ratios.
| Coupled | Closed | |||||
|---|---|---|---|---|---|---|
| TE | TGR_LP | TGR_QP | TE | TGR_LP | TGR_QP | |
| Mean | 0.519 | 0.704 | 0.676 | 0.587 | 0.654 | 0.643 |
| Median | 0.595 | 0.732 | 0.695 | 0.634 | 0.717 | 0.7 |
| St. dev. | 0.239 | 0.182 | 0.156 | 0.258 | 0.206 | 0.185 |
| Minimum | 0 | 0.042 | 0.041 | 0 | 0.003 | 0.004 |
| Maximum | 1 | 1 | 1 | 0.96 | 1 | 1 |
TE—technical efficiency; TGR—technical gap ratio; LP—linear programming; QP—quadratic programming.
Table 6.
Estimation results of group and meta-frontier production functions.
| Inside-Out | Outside-In | Coupled | Closed | |||||
|---|---|---|---|---|---|---|---|---|
| Coefficient | S.E. | Coefficient | S.E. | Coefficient | S.E. | Coefficient | S.E. | |
| Constant | 3.827 | 0.889 | 2.458 | 0.567 | 6.211 | 0.320 | 4.918 | 0.370 |
| lnx1 | −0.143 | 0.290 | 0.570 | 0.239 | −0.718 | 0.111 | −0.499 | 0.140 |
| lnx2 | 0.191 | 0.178 | 0.038 ** | 0.177 | 0.185 | 0.065 | 0.056 * | 0.100 |
| lnx3 | 0.602 | 0.329 | 0.313 | 0.211 | 1.343 | 0.112 | 0.931 | 0.109 |
| (lnx1)2 | 0.113 | 0.026 | 0.028 ** | 0.026 | 0.124 | 0.011 | 0.126 | 0.014 |
| (lnx2)2 | 0.003 *** | 0.011 | 0.025 ** | 0.024 | −0.015 ** | 0.005 | −0.014 ** | 0.005 |
| (lnx3)2 | 0.003 *** | 0.031 | −0.027 ** | 0.019 | 0.032 ** | 0.010 | 0.002 *** | 0.010 |
| (lnx1)(lnx2) | −0.080 * | 0.031 | −0.063 * | 0.042 | −0.034 ** | 0.014 | −0.015 ** | 0.019 |
| (lnx2)(lnx3) | 0.023 ** | 0.031 | 0.031 ** | 0.035 | 0.063 * | 0.011 | 0.029 ** | 0.018 |
| (lnx3)(lnx1) | −0.053 * | 0.052 | 0.009 * | 0.047 | −0.175 | 0.018 | −0.144 | 0.017 |
Notes: *, **, and *** denote p < 0.1, p < 0.05, and p < 0.01, respectively.
© 2018 by the authors. Licensee MDPI, Basel, Switzerland. This article is an open access article distributed under the terms and conditions of the Creative Commons Attribution (CC BY) license (http://creativecommons.org/licenses/by/4.0/).
Share and Cite
MDPI and ACS Style
Shin, K.; Lee, D.; Shin, K.; Kim, E. Measuring the Efficiency of U.S. Pharmaceutical Companies Based on Open Innovation Types. J. Open Innov. Technol. Mark. Complex. 2018, 4, 34. https://doi.org/10.3390/joitmc4030034
AMA Style
Shin K, Lee D, Shin K, Kim E. Measuring the Efficiency of U.S. Pharmaceutical Companies Based on Open Innovation Types. Journal of Open Innovation: Technology, Market, and Complexity. 2018; 4(3):34. https://doi.org/10.3390/joitmc4030034
Chicago/Turabian StyleShin, Kisoon, Daeho Lee, Kwangsoo Shin, and Eungdo Kim. 2018. "Measuring the Efficiency of U.S. Pharmaceutical Companies Based on Open Innovation Types" Journal of Open Innovation: Technology, Market, and Complexity 4, no. 3: 34. https://doi.org/10.3390/joitmc4030034