A Comparative Analysis of Corporate R&D Capability and Innovation: Focused on the Korean Manufacturing Industry


1
Department of Science and Technology Studies, Korea University, Seoul 02841, Korea
2
Department of Public Administration, Korea University, Seoul 02841, Korea
*
Author to whom correspondence should be addressed.
J. Open Innov. Technol. Mark. Complex. 2020, 6(4), 100; https://doi.org/10.3390/joitmc6040100
Submission received: 31 July 2020
/
Revised: 25 September 2020
/
Accepted: 27 September 2020
/
Published: 1 October 2020
(This article belongs to the Special Issue Ambidextrous Open Innovation: Technology, Market and Complexity)
Abstract
:In order to improve innovation performance, it is necessary to analyze a series of processes that are connected to innovation performance, as well as R&D input. Since industrial characteristics affect innovation performance, the differences between corporate R&D capabilities in the industrial sector should also be considered. This study verified the effect of R&D capabilities and absorptive capacities on innovation using a structural equation model for Korean manufacturing companies, and analyzed in-depth the relationship between capability and performance of high- and low-tech sectors through multi-group analysis. The results show that internal and external R&D capabilities had a positive effect on absorptive capacities, and potential absorptive capability had a positive effect on realized absorptive capacity. In addition, internal R&D capability and realized absorptive capacity had a positive effect on innovation, and the mediating effect of absorption capacities could be identified. As a result of industry sector-specific analysis, the latent mean of internal R&D capability and innovation of the high-tech sector were higher, and the path coefficient of the high-tech sector from the internal R&D capability to potential absorptive capacity and innovation performance was more strongly identified than those of the low-tech sector. Based on the results of this study, we would like to present policies for the development of firm’s R&D capabilities by the industry sector.
1. Introduction
This study seeks to examine the impact of corporate R&D capabilities on innovation. In particular, it aims to confirm that R&D capabilities can have different effects on innovation due to different R&D intensity and innovation patterns of industrial sectors using theoretical consideration and empirical analysis.
R&D is considered a key activity of a firm and is an important source of innovation. For firms to gain a long-term competitive advantage, they need to innovate through continuous R&D activities. In recent years, many researchers have conducted studies to identify the characteristics of firms that affect innovation. This research has focused on empirical analysis of specific functions and activities, such as external resource utilization and innovation, enterprise scale and innovation, market concentration and innovation, R&D intensity, and innovation [1,2,3,4]. However, to improve innovation performance, it is necessary to not only increase R&D activity, but also to analyze a series of processes that are connected to innovation performance, as well as the basic capabilities related to R&D input.
Another focus of this study is examination of the differences between corporate R&D capabilities by the industrial sector from the perspective that industrial characteristics affect innovation performance. Korea’s major industrial policies have been developed around high value-added and high-tech industries in the process of being implemented as a technology-intensive structure. In particular, because the main focus of technology-oriented R&D support is the promotion of industries, industrial policies that take into account the entire ecosystem of the industry have not been implemented because areas with low technology intensity have often been excluded. In the past, when the industrial base was vulnerable, Korea adopted a method of localizing advanced technologies that had already been developed and verified in advanced countries to promote industries. This method of securing growth engines based on technology development was an effective “catch-up growth” strategy. However, as the domestic technology level improves and economic output increases, a paradigm shift to a “leading growth” strategy is required, suggesting that the entire industry needs to become a growth engine [5]. To promote an industry in such an environment of heightened uncertainty, it is necessary to draw potential from various industries by securing various seeds. This approach is also suitable for mid- and low-tech industries. Mid- and low-tech industries are labor-intensive industries that led to Korea’s early industrialization. Although Korean industries have advanced significantly, mid- and low-tech industries continue to make a substantial contribution to domestic value-added production and employment. However, because domestic industrial policies are concentrated in high-tech industries and new technology development-oriented industrial policies, the mid- and low-tech industrial base is also the most vulnerable. Therefore, it is necessary to enhance Korea’s industrial stability to ensure that companies continue to contribute to domestic economic growth and that a natural process of industrial development, evolution, and self-sufficiency can be achieved by identifying the R&D capabilities of companies in the mid- and low-tech industry group. Most of the prior research related to R&D capability and innovation has been conducted on all or specific industries. However, there has not been sufficient empirical analysis and comparison at the industry group level, as undertaken in this study.
In conclusion, the main purpose of this study is to analyze the relationship between R&D capabilities and the firm’s innovation performance, and to identify the structural relationship between R&D capability components by dividing them into input–process–output. In particular, we would like to apply absorptive capacity to more specific analysis of the process from R&D capability to innovation performance. We also aim to analyze whether a difference exists in the structure of R&D capabilities between manufacturing industries of high and low technology groups, and whether there is a distinction between R&D capabilities and their relationship to innovation.
2. Literature Review and Research Framework
2.1. R&D Capability and Absorptive Capacity: Process-Based
A firm’s R&D can be seen as a series of organic systems to which input–process–output is connected [6]. When R&D resources are used as an input it results in improved performance through the process of transformation. Therefore, although it is important to invest in R&D to maximize R&D performance, it is also highly important to utilize input components through effective and efficient R&D processes. That is, the firm’s overall R&D capabilities must be sufficiently secured to link its R&D investment to performance.
A firm’s R&D capability can be defined as the firm’s ability to integrate R&D strategy, project execution, project portfolio management, R&D expenditure, etc. [7]. Specifically, R&D capabilities can be largely divided into internal and external capabilities. Internal R&D capabilities means the resources of the firm are established to develop R&D internally. This can be evaluated in terms of R&D intensity, human resources, etc. [8]. It has been found that direct investment, such as R&D spending on sales and the number of R&D workers among total employees, has a positive impact on innovation performance [9]. However, it is not possible for a company to perform all of the theoretical and technical demands required for innovation with its own internal capabilities, and external partners must be identified and specifically accessed to allow innovation [10]. Thus, external R&D capability can be defined as the formalized structure of linkage with the external environment for undertaking R&D, such as human and material networks for research and development, strategic alliances, etc. [6]. From the perspective of transaction cost theory, the network is considered important in that it is constitutes a strategy to reduce the firm’s costs, and from the perspective of strategic management theory, it is desirable to focus resources on specific sectors to enhance the firm’s competitiveness [11,12]. In other words, a firm’s R&D capabilities can be enhanced by combining its internal capabilities with external knowledge resources.
In addition to the above conceptual definition, Dutta et al. [13] argues that R&D capabilities in the new technology market are an essential component of a firm’s optimal performance, and that R&D capabilities can be understood as the dynamic means of enhancing a firm’s capabilities through knowledge creation and utilization, thereby maintaining or gaining a competitive advantage [14]. In this study, we identify R&D activities as a process of knowledge creation and introduce the concept of absorptive capacity based on dynamic capability theory.
Cohen and Levinthal [15], who first applied the concept of absorptive capacity at the firm level, argued that the most important capability for an entity to maximize its R&D effects is its absorptive capacity. In addition, the methods of obtaining technical knowledge were divided into methods of obtaining from the enterprise’s own R&D, acquiring knowledge generated from competing enterprises, or acquiring technologies developed outside of industry, such as government-funded institutions and universities. Furthermore, if a firm performs its own R&D, it can achieve more effective results by utilizing useful external information [16]. However, it is not easy to measure the concept of absorptive capacity empirically. In particular, Duchek [17] argued that different definitions of absorption capacity also result in different studies, which makes it impossible to present standard measurement methods, and that currently available measurement methods are diverse, but not clear and somewhat ambiguous. We analyzed the prior empirical studies based on quantitative analysis using the absorptive capacity concept by classifying them into input/output approaches and process approaches as shown in Table 1. We would like to analyze the process approach in-depth to examine the process of knowledge integration according to the purpose of this study.
Researchers who have studied the process approach, such as Zahra and George [14], measured absorptive capacity through cognitive processes to survey methodology. These researchers developed and measured a single question or a series of questionnaires that reflected absorptive capacity at the process level. The measurement of absorptive capacity by cognitive questionnaire is a useful measurement method in the sense that it demonstrates the complex concept of absorptive capacity. In addition, these survey measurements provide useful information about the degree of absorptive capacity by allowing them to be well aware of the entire process of knowledge acquisition, with no restrictions on input or output variables, contrary to proxy indicator [17].
Zahra and George [14] presented measurement items by classifying them as potential and realized absorptive capabilities, while Liao et al. [29] presented measurement items by classifying them as external knowledge acquisition and intrafirm knowledge dissemination similar to those of Zahra and George [14]. We will focus Zahra and George’s research [14] in detail in the next paragraph. Murovec and Prodan [31] divided absorptive capacity into “science-push absorptive capacity,” related to the acquisition of R&D knowledge, and “demand-pull absorptive capacity,” related to the acquisition of market knowledge. The study revealed that the two different absorptive capacities have a positive effect on product innovation and process innovation performance, respectively.
In this study, we believe that Zahra and George’s absorptive capacity model [14] is a useful theoretical framework because absorptive capacity acts as a process. Zahra and George [14] defined “potential absorptive capacity” as a process of exploration related to the acquisition and assimilation of knowledge and “realized absorptive capacity” as a learning process related to the transformation and exploitation of knowledge. The former was defined as a process of obtaining, analyzing, and understanding new technical knowledge from the outside and exploring the potential applicability of that knowledge, while the latter was defined as a utilization process of integrating knowledge acquired from the outside with internal existing knowledge and applying it to new product development [32]. Ref. [14] argued that the success of new product development, which is the result of absorption capacity, is determined by the efficiency (ratio) in which potential absorption capacity is converted to realized absorption capacity. That is, the process of absorptive capacity allows a firm to dynamically adjust and utilize its capabilities by obtaining, assimilating, and transforming external knowledge based on internal capabilities.
Based on this prior research, we hypothesized that R&D capabilities are determined by the internal capabilities built inside the firm and the external capabilities built by network activities, and that there will be a transition between the absorptive capacities produced within the entity.
Hypothesis 1.
The corporate R&D capabilities will have a positive effect on the absorptive capacities.
Hypothesis 1.1.
Internal R&D capability will have a positive effect on the potential absorptive capacity.
Hypothesis 1.2.
External R&D capability will have a positive effect on the potential absorptive capacity.
Hypothesis 1.3.
External R&D capability will have a positive effect on the realized absorptive capacity.
Hypothesis 2.
The potential absorptive capacity will have a positive effect on the realized absorptive capacity.
2.2. The Impact of R&D Capability and Absorptive Capacity on Innovation Performance: the Structural Model
Innovation refers to the implementation of new or significantly improved goods or services, production or delivery methods, new marketing methods, or new organizational methods in the course of business practices, workplace organization, or external relations [33]. According to previous research [34], innovation can be defined as a series of activities that creatively destroy existing methods, and produces, markets, and sells new products or services through new combinations of means of production, such as processes, markets, materials, and organizations.
Manufacturing industry-oriented technological innovation refers to the new invention or development of the process of introducing new products into the market, including new processes and services. The types of innovation are divided into product innovation and process innovation. Product innovation is the creation of new products and services to meet the needs of customers and markets. Process innovation refers to the production and service operation of an organization which, in the process of production, represents a change in equipment or work procedures to increase the level or efficiency of production [35]. Thus, product innovation creates revenue and margin by developing new products that are differentiated from original products [36], and process innovation is common in mass production because products are stabilized or standardized [37].
Innovation by enhancing the R&D capability enables the development of new products and the utilization of new processes, thus providing product differentiation and cost advantages, and providing a major source of competitive advantage for companies [38]. Reviewing the determinant factors of innovation performance, Souitariis [39] demonstrated that R&D intensity and R&D human resources are highly important factors in innovation activities in the Greek manufacturing industry. In addition, the resource-based view suggests that it is not only a firm’s own R&D that stimulates its innovation capabilities, but also the introduction or joint development of R&D from the external environment [40].
These previous studies were primarily aimed at identifying the quantity of resources a firm would devote to R&D and the quantity required to have a positive impact on its performance. However, new product development activities or acquisition of new technologies alone does not guarantee performance. Zahra and George [14] and Murobec and Prodan [31] identified absorptive capacity as a dynamic process of generating innovation and sought to identify the difference between the components and the causal relationship of the absorptive capacities, rather than R&D investment. In addition, empirical studies [41,42,43] argue that absorptive capacity can contribute not only to new product development but also to the quality improvement of existing products.
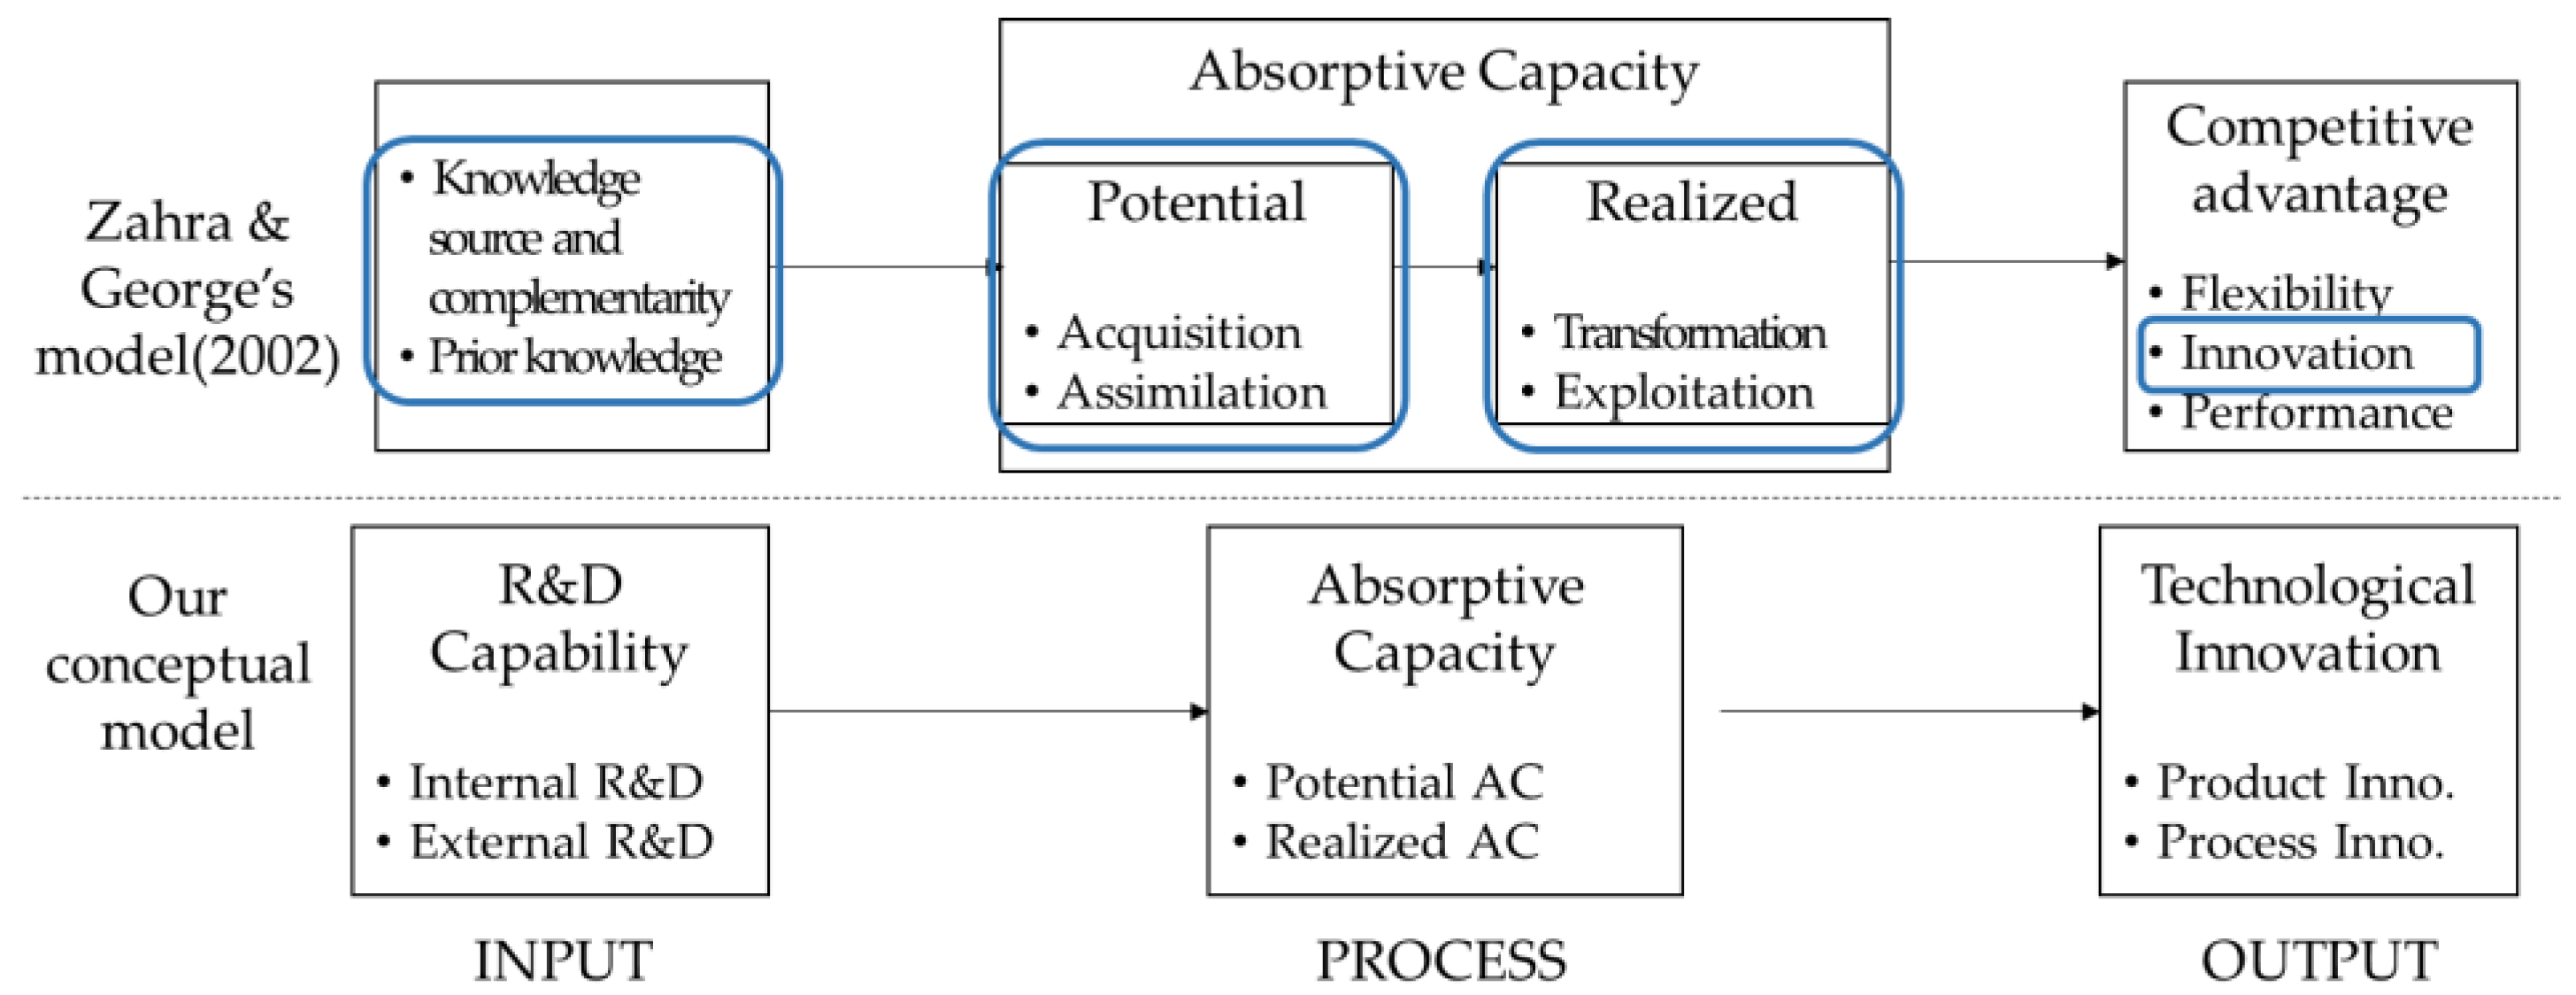
Based on this previous research, we presented a conceptual model as shown in Figure 1 and hypothesized that the R&D capabilities and absorptive capabilities possessed by a firm would affect technological innovation performance such as process innovation and product innovation as follows:
Hypothesis 3.
The corporate R&D capabilities will have a positive effect on technological innovation.
Hypothesis 3.1.
Internal R&D capability will have a positive effect on technological innovation.
Hypothesis 3.2.
External R&D capability will have a positive effect on technological innovation.
Hypothesis 4.
The absorptive capacities will have a positive effect on technological innovation.
Hypothesis 4.1.
The potential absorptive capacity will have a positive effect on technological innovation.
Hypothesis 4.2.
The realized absorptive capacity will have a positive effect on technological innovation.
2.3. Necessity of Research by Industrial Sector
A firm’s innovation activities emphasize cooperation and interaction between innovation actors in addition to research and development, and the process of path dependency between technology and knowledge represents the industry sectoral specificity to which the firm belongs and creates an industry-specific technical paradigm [44]. Since paradigm shift occurs due to the development of very radical technology development, firms need to absorb and innovate new technologies to cope with these changes.
A typical study of the technical characteristics of an industry can be cited as sectoral patterns of technological innovation in the industry. Malerba and Orsenigo [45] expanded on previous research of industry-specific innovation patterns to include the concept of a technological regime based on the empirical study of sectoral innovation patterns by Pavitt [46]. Since most previous studies of Korean industries are based on Pavitt’s industrial classification [46], a lack of research on sectoral technological innovation exists. The innovation pattern generally refers to the way in which innovation progresses in a particular industry and is determined by the technological opportunity, appropriability regime, and demand [47].
The technical characteristics of an industry are represented by the degree of technological opportunity presented by the firm dynamics. The degree of technological opportunity can be seen as a firm’s R&D efforts for innovation and technological progress that affect the performance of innovation. However, the factors mentioned previously that reflect the demand and technological characteristics of the industry are difficult to measure as theoretical concepts [48]. Therefore, this study used the “classification of industrial sectors” approach to apply the concept of industrial characteristics to the subsequent empirical analysis process, and “industrial sectors” were classified using R&D intensity.
To reflect “industrial sector” in the concept of “industrial characteristics”, we present theoretical evidence and empirical analysis cases that demonstrate the association between R&D intensity and industrial characteristics. The relevance of the connection between technological opportunity and an industry’s R&D intensity as an industrial characteristic is confirmed in prior studies on the concept of technological opportunity. Prior studies have defined technological opportunities as strengthening R&D investment activities for firms in the industry and sequentially improving the performance of technological innovation. Scherer [49] argued that differences in inter-industry R&D intensity reflect technical opportunities. Scherer [50] and Scott [51] demonstrated gaps between industries, such as R&D for innovation, through industry classifications that reflect technological opportunities. These studies classified petrochemical, electrical, and electronic industries as those with high technological opportunities. Mukhopadhyay [52] classified industry types using the concentration ratio of the industry’s R&D intensity. Hatzichronoglou [53] classified the manufacturing industry as high technology, medium and high technology, and medium and low technology according to R&D intensity, which is currently applied as the most general classification method. Whereas the chemical, electronics and telecommunications, automobile, medical, and semiconductor industries are generally classified as high-tech industries, the furniture, textile products, food, paper, printing, wood, metal casting, and plastic products industries are classified as medium and low-tech industries.
The high-tech category, also known as the cutting-edge, refers to very advanced and elaborate technology. New products and new processes generated by R&D conducted in high-tech industries have a spillover effect on other industries, which can help new products and productivity, expand business, and create high-wage jobs, enabling other commercial sectors to benefit [53,54]. Based on these prior studies, we hypothesized that the technical characteristics of the industry are related to corporate R&D activities and innovation performance, therefore, there will be gaps between industries.
Hypothesis 5.
Manufacturing firms in the high-tech sector will show higher R&D capabilities, absorptive capacities, and technological innovation than those in the low-tech sector.
Hypothesis 6.
The structural coefficient between R&D capabilities, absorptive capacities, and technological innovation will vary across firms in the high-tech sector and firms in the low-tech sector.
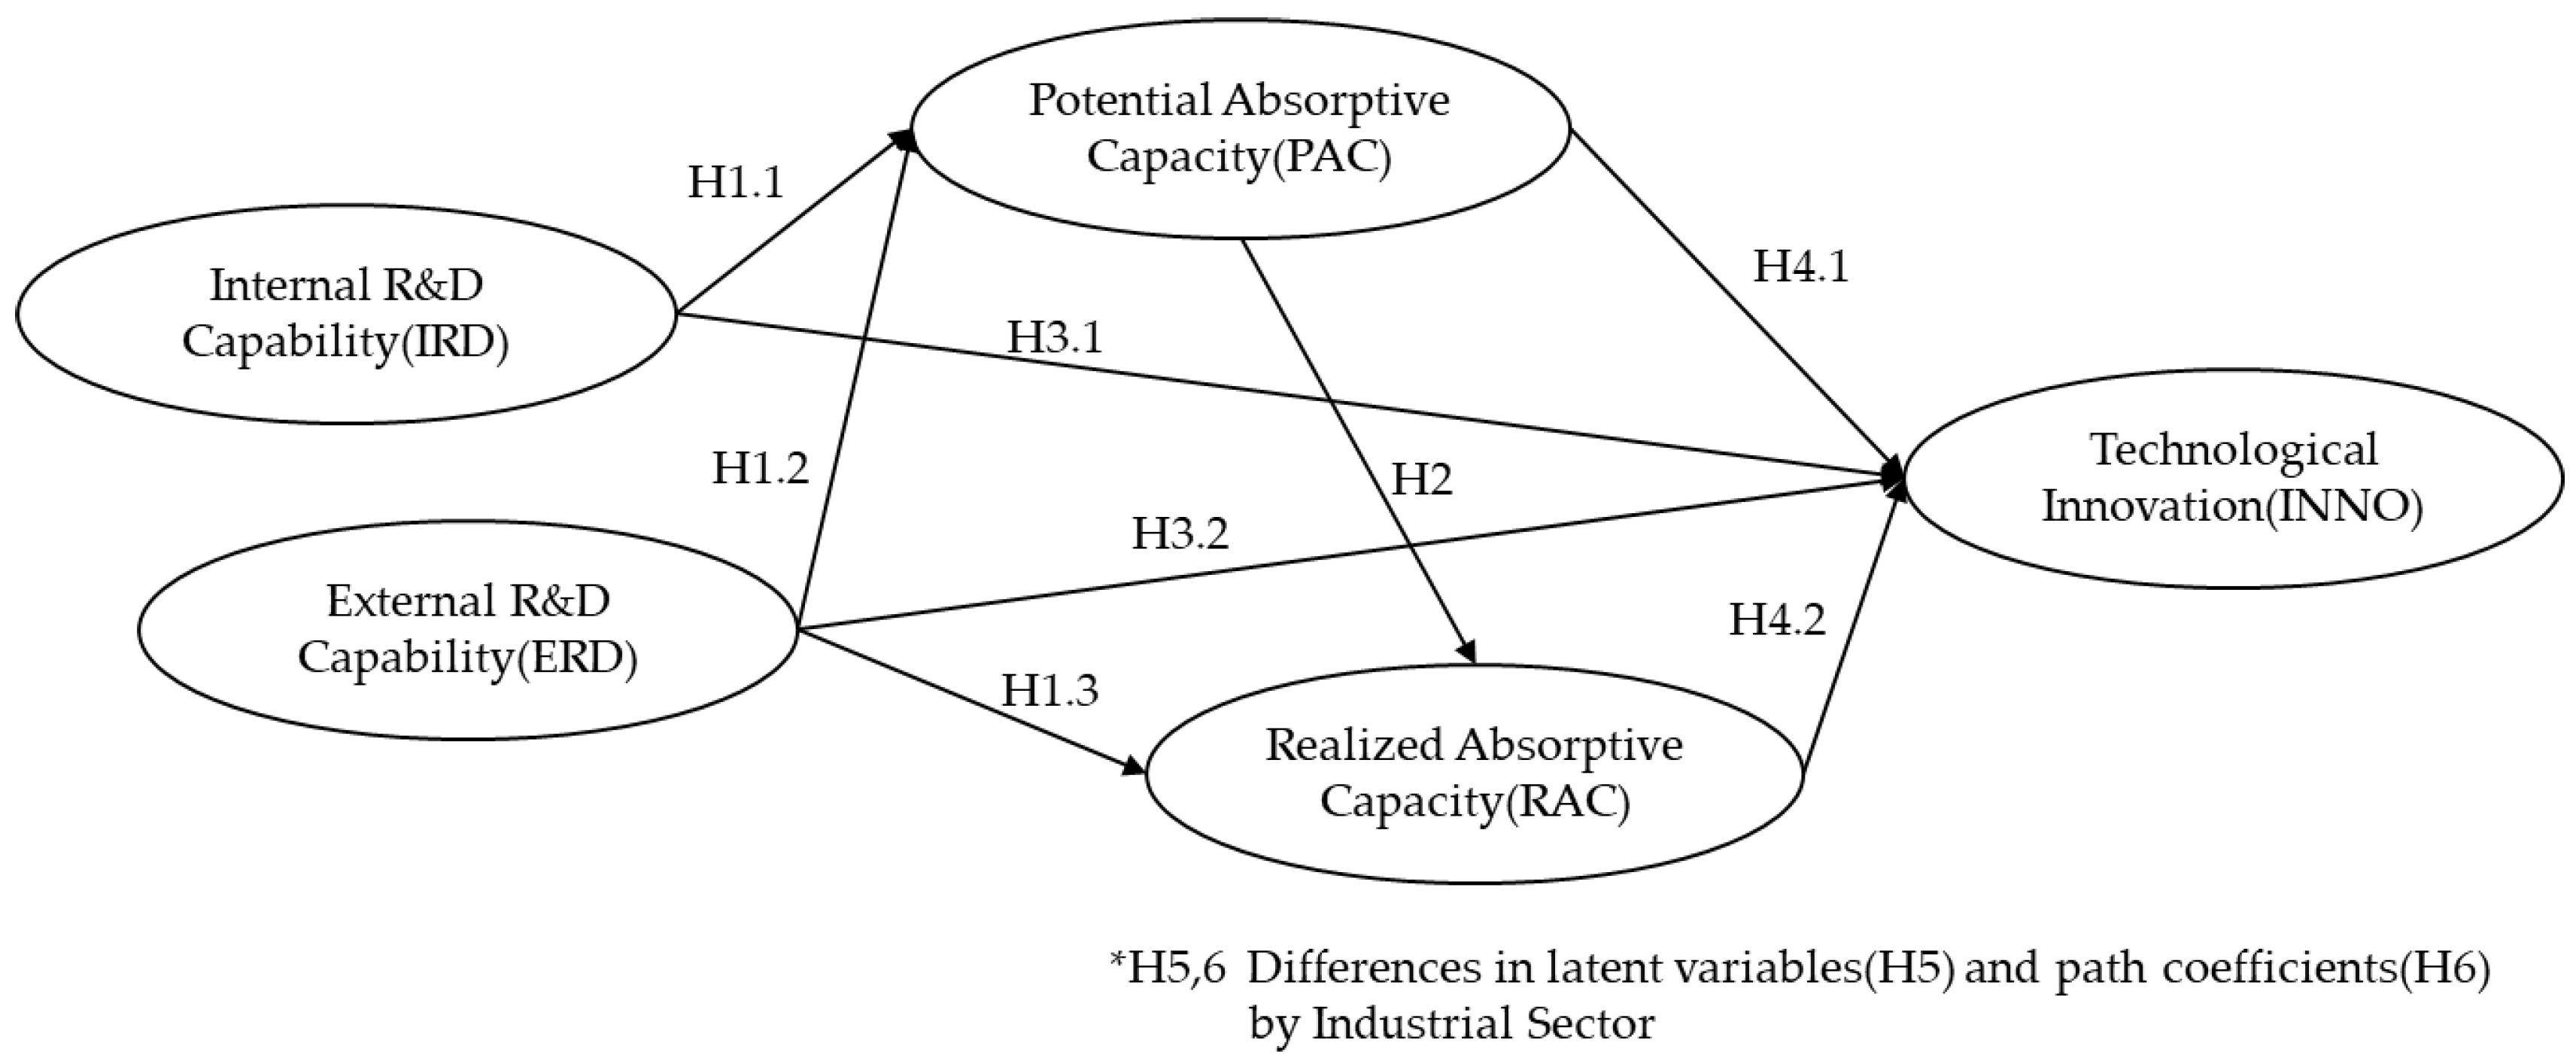
We presented a research model that reflects all hypotheses as shown in Figure 2.
3. Method
Based on the measurement and structural model analysis, latent mean analysis, and multi-group analysis, this study analyzed the structural relationship between R&D capabilities, absorptive capacities, and technological innovation in manufacturing firms, and verified the difference in the latent mean and the path coefficient of the structural model according to the industrial sector by technology level. For this analysis, the seventh survey (2017) of the Human Capital Corporate Panel (HCCP) Survey was used.
3.1. Sample Characteristics
In this study, the data used for the hypothesis verification was the Human Capital Corporate Panel (HCCP). HCCP is the only mid and long-term corporate panel survey in Korea that has been tracking and investigating companies every other year since 2005, and has the characteristic of extracting some employees (team leaders, team members, etc.) of the corporates in question in addition to the corporates in a multi-dimensional format. The HCCP corporate survey classifies overall industry into manufacturing, financial, and service industries, and covers the management, human resources status, human resource development, R&D, human resource management, etc., thereby reflecting the characteristics of each industry. We conducted data control with the aim of ensuring consistency of data and clearly distinguishing between the characteristics of the target corporates, and the firm-level and individual-level survey results. Although HCCP provides data on manufacturing, financial, and service industries, it was only used to examine the target of manufacturing in this study. The sampling population was comprised of corporates with at least 100 employees and a capital of 300,000 USD or more, and was extracted by size, industry, and type of corporate.
It was important for this study to classify industries so that different mechanisms could be explained by industry characteristics, which presupposes that R&D capabilities and innovation activities vary by industry characteristics. First of all, to group manufacturing industries according to R&D intensity, the first classification was applied to the OECD’s Industrial Classification [53], and a total of 348 firms were classified into 68 firms in three high-tech industries, 137 firms in five middle and low-tech industries, 80 firms in five low and middle-tech industries, and 63 firms in 10 low-tech industries. Additionally, based on sectoral innovation patterns studies—Pavitt [46], and Malerba and Orsenigo [45]—we added science-based industries and Schumpeter Mark II industries to the high-tech industry sector, highlighting the companies’ own R&D capabilities and the accumulation that companies were assumed to have in this study. In accordance with these two criteria, the automobile industry was added to the high-tech industry sector. The automobile industry is Korea’s main manufacturing industry, and is characterized by strong competition due to brisk exports and imports. In addition to the technology level, innovation activities in the automobile industry are active due to the large impact of the automobile industry on upstream and downstream industries [55]. Furthermore, in the Korean automobile industry, open innovation had a significant impact on the enhancement of the technical values of patents [56]. Although Hatzichronoglou [53] classified the automotive industry as a medium and high-tech industry, and Pavitt [46] also classified it as a production-intensive industry, the environment of the automotive industry has subsequently changed significantly. This process was summarized in Figure 3. And we classified the Korean manufacturing industry according to the previous description as shown in Table 2.
3.2. Measures
3.2.1. Internal R&D Capability
To measure the internal R&D capability level of the corporates, 6 items were selected based on the questions on the HCCP 7th survey and the associated financial and patent data. Using exploratory factor analysis, three items were used: R&D intensity, job proficiency level of researcher, and ratio of full-time researcher (excluding the number of patent applications, per capita education and training expenses, and ratio of master’s degree). The Cronbach’s alpha for checking internal consistency between questions was 0.635.
3.2.2. External R&D Capability
To measure the external R&D capability level of the corporates, 4 questions in the HCCP 7th survey were chosen to measure whether an external network was used. These excluded whether to inspect technical guidance from outside companies and whether to cooperate with suppliers through exploratory factor analysis. The question of whether to promote strategic alliances or to introduce relationships with external organizations was chosen. The Cronbach’s alpha for checking internal consistency between questions was 0.612.
3.2.3. Potential Absorptive Capacity
Potential absorption capacity is the ability to quickly understand, interpret, and explore the external environment and changes by acquiring diverse external information, knowledge, etc. [14,57]. To measure this, we used the HCCP 7th employee survey, expanded to organizational levels. The measurement questions included immediate response and understanding of customer demands, sufficient education and training, and management’s leadership in responding to changes in relation to knowledge acquisition and exploration.
Subsequently, to use individual level data as the organization level data, it was important to secure statistical validity. Verification is essential in determining whether the measurements presented by the combination of individual scores adequately reflect the characteristics of the organization. To sum up the individual-level data to determine whether it was suitable to be used as a higher-level organizational concept, the Interclass Correlation Coefficient was calculated and its values were reviewed. ICC (1) and ICC (2) are the most frequently used methods for verifying reliability in multi-level organizational studies [58], and the reliability described here is the assessment of the degree of consistency in responses [59]. ICC (1) indicates the extent to which an individual in a group can represent the group, and the larger the ICC (1), the more similar the individuals in the group [58]. ICC (2) represents the reliability of the group mean, which is usually interpreted to have an acceptable level of 0.5 or higher [59].
The ICC (1) value of this study variable was found to be 0.052, and the ICC (2) value of this study was found to be 0.618, thus exceeding the acceptance criteria. Therefore, it was found that it was reasonable to use data at the individual level to represent the organizational level.
3.2.4. Realized Absorptive Capacity
Realized absorptive capacity was measured based on the HCCP firm survey, unlike the potential absorptive capacity. In contrast to the potential absorption capacity at the individual level, the transformation and exploitation of knowledge are achieved through integration and institutionalization at the organizational level [57,60]. Four questions in the HCCP 7th survey were chosen to measure internalization, reconstruction, improvement, and transformation of acquired resources. The exploratory factor analysis excluded the implementation of learning organizations and used changes in organizational structure, knowledge management, and quality control methods. The Cronbach’s alpha for checking internal consistency between questions was 0.684.
3.2.5. Technological Innovation
To identify the level of technological innovation, 3 questions in the HCCP 7th survey related to manufacturing innovation were chosen. From a prior study [35,36] it was confirmed that product innovation and process innovation could be used as performance indicators, and the degree of technological changes, changes in lines or facilities at the workplace, and the degree of development and introduction of new products were used as measurement tools. The Cronbach’s alpha for checking internal consistency between questions was 0.711.
We presented variables and items for this study as shown in Table 3.
3.3. Analysis
The methodology we used is a structural estimation modelling-based multi-group analysis. The general structural equation model (SEM) is intended to verify causality embodied in the theoretical model and is appropriate for identifying causality that cannot be demonstrated through regression analysis. However, rather than simply verifying the validity and fit of the theoretical model and generalizing it in the population, this study focused on identifying how the same model appears among different populations and verifying significant differences between high and low-tech sectors. The analysis method for comparing and analyzing multiple groups to verify statistically whether the theoretically established structural equation model exhibits significant differences between groups is called multi-group analysis [61]. These multi-group analyses were carried out in the following order.
First, the structural equation model analysis to verify Hypotheses 1–4 used the 2-step method of interpreting the validity of the structural model and path coefficients after verifying the validity of the measurement model. Second, latent mean analysis for verifying Hypothesis 5 was conducted in the order of configural invariance, metric invariance, scalar invariance, and factor variance invariance. Third, the verification of the differences in the multi-group path coefficients for verifying Hypothesis 6 was carried out in the order of configural invariance, metric invariance, and structural invariance. Fourth, structural model analysis, latent mean analysis, and verification of the differences in the multi-group path coefficients were all used for maximum likelihood (ML) estimation, and the fit of the model was determined by Chi-square(χ2), Non-Normed Fit Index(NNFI), Comparative Fit Index(CFI), and Root Mean Square Error of Approximation(RMSEA). In addition, the χ2 difference test, NNFI, CFI, and RMSEA difference verification were used together to verify differences between models. In this study, firms with a large number of missing values were excluded from the list, and the analysis was performed by SPSS 25.0 and AMOS 21.0.
4. Results
4.1. General Characteristics of Firms
The following characteristics were identified in the firms in this study: In 23 manufacturing sectors, 348 firms were targeted, of which 138 (39.7%) were high-tech firms and 210 (60.3%) were low-tech firms. The size and age of the firms showed similar distributions in two industry sectors, with those with less than 300 employees and those with more than 30 years of age accounting for the largest distribution. We presented general characteristics of firms as shown in Table 4.
4.2. Descriptive Statistics and Correlation Verification
As a result of checking whether the measurement variables injected into the model meet the normality assumption for structural model analysis, latent mean analysis, and verification of the differences in the multi-group path coefficients, it was determined that the normality assumption was established because the total measurement variable did not exceed a skewness value of 3 and kurtosis value of 10. Analysis of the correlation patterns between the measurement variables of Table 5 found that there were generally positive correlation patterns between R&D capabilities and absorptive capacities, R&D capabilities and technological innovation, and absorptive capacities and technological innovation.
4.3. Measurement Model Verification
As a result of conducting confirmatory factor analysis to verify the validity of the measurement model, χ2 (df = 67, n = 348) = 97.851, p < 0.01, NNFI = 0.929, CFI = 0.948, RMSEA = 0.036 (0.019~0.051, 90% confidence interval), it was determined that the measurement model fitted. Based on the results of the confirmatory factor analysis (in Table 6), the convergent validity and discriminant validity were determined to be acceptable for AVE (Average Variance Extracted) and above 0.5 and CR (Composite Reliability) above 0.7.
4.4. Structural Model Verification
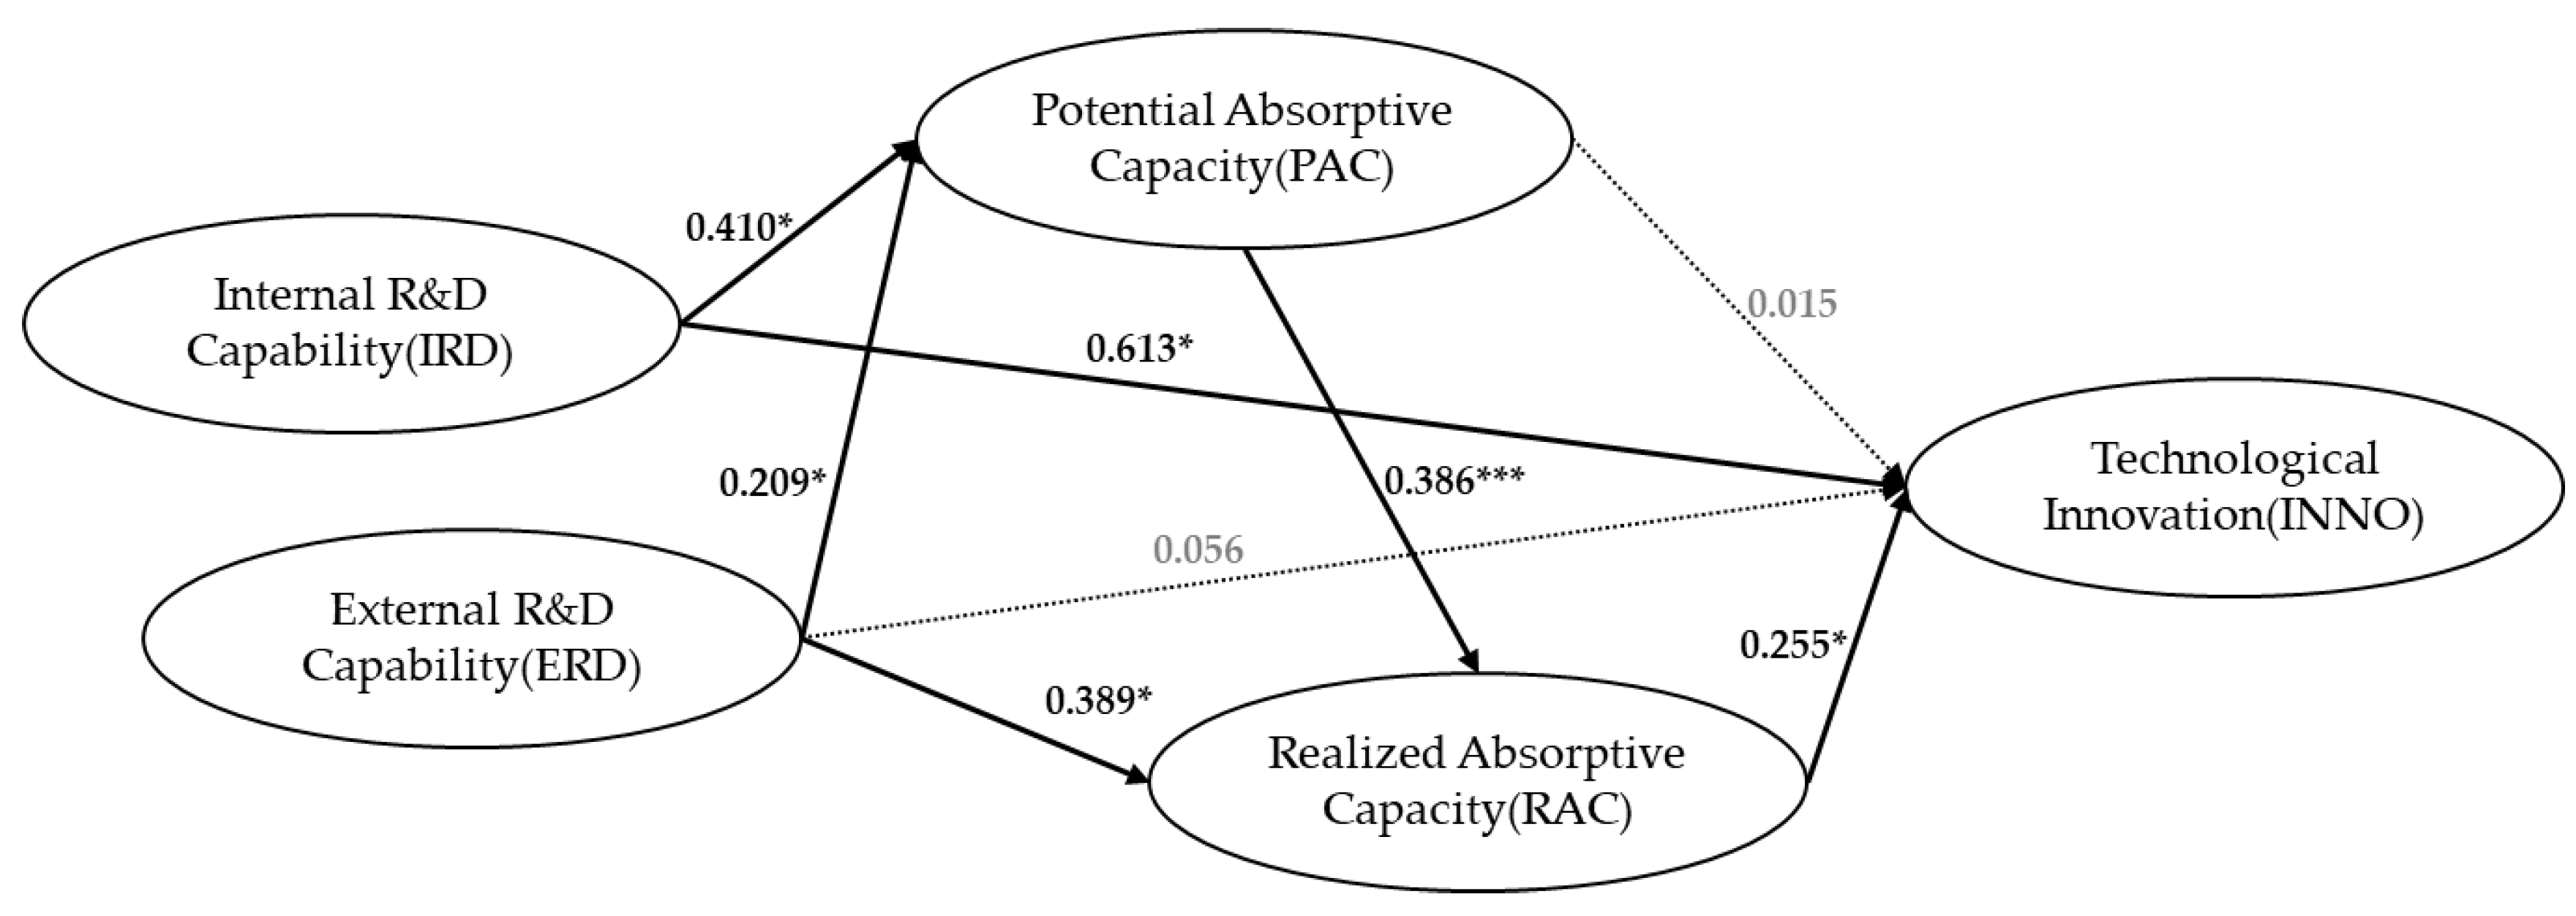
The structural relationships between R&D capabilities, absorption capacities, and technological innovation were analyzed based on Figure 4 As a result of verifying the measurement model, χ2 = 97.774, p < 0.05, df = 69, NNFI = 0.939, CFI = 0.954, RMSEA = 0.035 (0.017~0.050, 90% confidence interval), it was determined that the fit of the structural model was good. Based on the path coefficient estimates in Table 7, first, internal R&D capability was identified as having a direct positive effect on potential absorptive capacity (β = 0.410) and technological innovation (β = 0.613). Second, external R&D capability was found to have no direct effect on technological innovation, while direct effects on the potential (β = 0.209) and realized (β = 0.389) absorptive capacity were identified. Third, potential absorptive capacity was found to affect realized (β = 0.386) absorptive capacity. Fourth, it was found that realized absorptive capacity of the absorptive capacities had a direct effect on technological innovation (β = 0.255), whereas the potential absorptive capacity did not have a direct effect on technological innovation. Therefore Hypotheses 1 and 2 were accepted, and Hypotheses 3 and 4 were partially accepted.
As a result of conducting 5000 bootstraps to verify the indirect effects (in Table 8), the indirect path through which internal R&D capabilities affect realized absorptive capacity (β = 0.158) and the indirect path through which potential absorptive capacity affect technological innovation (β = 0.098) were found to be statistically significant.
4.5. Latent Mean Analysis
Latent mean analysis was conducted to identify the mean difference between corporate R&D capabilities, absorptive capacities, and technological innovation, depending on the industry sector. Latent mean analysis is a statistical method for comparing means using controlled latent variables for measurement errors to more accurately verify differences between groups than in traditional statistical techniques such as the t-test or MANOVA [61]. Latent mean analysis should satisfy valid configural invariance, metric invariance, and scalar invariance [61].
First, configural invariance verification was conducted. Configural invariance verification was measured to determine whether the factor structures of the group to be compared were the same, and the fit of the models for each high- and low-tech groups was checked. The high-tech industrial sector showed a reasonable fit of χ2(df = 67, n = 138) = 70.258, p < 0.05, NNFI = 0.981, CFI = 0.986, RMSEA = 0.019 (0.002~0.050, 90% confidence interval), and the low-tech industrial sector showed a reasonable fit of χ2 (df = 67, n = 210) = 92.826, p < 0.05, NNFI = 0.920, CFI = 0.941, RMSEA = 0.043 (0.018~0.063, 90% confidence interval). In addition, the results of verifying the high-tech and the low-tech sector firms together in one model also showed that χ2(df = 134, n = 438) =163.099, p < 0.05, NNFI = 0.941, CFI = 0.956, RMSEA = 0.025 (0.004~0.038, 90% confidence interval) was valid, which can be seen as configural invariance (baseline model, a in Table 9).
Second, to verify metric invariance, the factor pattern coefficients were constrained to be equal. These constraints increased the χ2 value from 163.099 to 175.863, gaining nine degrees of freedom. Since the metric invariance model (b in Table 9) is nested within the baseline model (a in Table 9), an χ2 difference test was performed. Since the χ2 difference was not statistically significant at p = 0.05 (Δχ2 (9) = 12.764), metric invariance was supported. In this study, NNFI (ΔNNFI = 0.004), CFI (ΔCFI = 0.005), and RMSEA (ΔRMSEA = 0.001) were also considered in addition to the χ2 difference test. Having considered the above evidence, metric invariance is supported for verifying high-tech and the low-tech sector firms.
Third, with the support of the metric invariance model (b in Table 9), scalar invariance was verified by constraining the intercepts so that they were same across the two sectors. An χ2 difference test was performed comparing the scalar invariance model (c in Table 9) and the metric invariance model (b in Table 9). Since the χ2 difference was statistically significant at p = 0.05 (Δχ2(14) = 41.271), scalar invariance was not supported. By constraining the intercepts to be equal, the NNFI, CFI, and RMSEA also deteriorated. Therefore, partial metric invariance verification was attempted using the modification indices. The logic of partial metric invariance is: “There may or may not support a constraint for several measurement variables across the population. In this case, releasing the constraint on invariance in variables where there are no constraints on invariance is partially a method to consider the partial measurement variance.” [62]. Since not all parameters should be equal in comparing a measurement structure between groups [63], partial invariance verification can be performed in multi-group analysis studies by releasing constraints on non-equal parameters. As a result of this prior study, the model (partial scalar invariance model, d in Table 9) with the unconstrained intercepts of ERC(1), ERC(2), and RAC(2) with large modification indices was evaluated against the metric invariance model (b in Table 9) using the χ2 difference test. Since the χ2 difference was not statistically significant at p = 0.05 (Δχ2 (10) = 16.430), partial scalar invariance was supported. Furthermore, partial scalar invariance also yielded a substantial improvement in RMSEA and NNFI compared to the full scalar invariance model, based on previous research [62,63] that recommends that full metric/scalar invariance is not necessary for further tests of invariance and substantive analysis (such as comparisons of latent means).
Fourth, with the partial scalar invariance model (d in Table 9), the factor variance invariance was verified in the potential mean analysis to yield the effect size. A χ2 difference test was performed comparing the factor variance invariance model (e in Table 9) and the partial scalar invariance model (d in Table 9). Since the χ2 difference was not statistically significant at p = 0.05 (Δχ2 (15) = 17.372), the factor variance invariance was supported. As a result of comparing the latent means by setting the high-tech sector as the reference group (the mean levels of five factors were fixed at zero), it was found that there were differences in latent means between sectors in internal R&D capability and technological innovation. Specifically, the firms in the high-tech industry sector have a higher level of internal R&D capability and technological innovation than those in the low-tech industry sector. Analysis of effect sizes in accordance with the criteria of Cohen [64] showed that the effect size was large, with the value of Cohen’s d all greater than 0.2, as shown in Table 10. Therefore, Hypothesis 5 was accepted.
4.6. Verification of Diffrence in the Multi-Group Path Coefficients
We conducted validation of configural, metric, and structural invariance to determine if there were differences in the path coefficients of the structural relationship between the corporate R&D capabilities, absorptive capacities, and technological innovation according to industrial sector. First, configural invariance verification results showed χ2(df = 154, n = 438) = 190.077, p < 0.05, NNFI = 0.912, CFI = 0.956, RMSEA = 0.026 (0.010~0.038, 90% confidence interval) and supported configural invariance. Next, with the support of configural invariance model (a in Table 11), metric invariance was verified. A χ2 difference test was performed comparing the metric invariance model (b in Table 11) and the configural invariance model (a in Table 11). Since the χ2 difference was not statistically significant at p = 0.05 (Δχ2(9) = 17.044), the metric invariance was supported. Finally, with the support of the metric invariance model (b in Table 11), structural invariance was verified by constraining the path coefficients to be the same across the two sectors. A χ2 difference test was performed comparing the structural invariance model (c in Table 11) and the metric invariance model (b in Table 11). Since the χ2 difference was statistically significant at p = 0.05 (Δχ2(4) = 11.059), structural invariance was not supported. These results indicate that differences exist between two sectors in this model and means there are differences in the path between two sectors. The difference in path coefficients for high and low-tech sectors estimated through structural invariance verification is shown in Table 11.
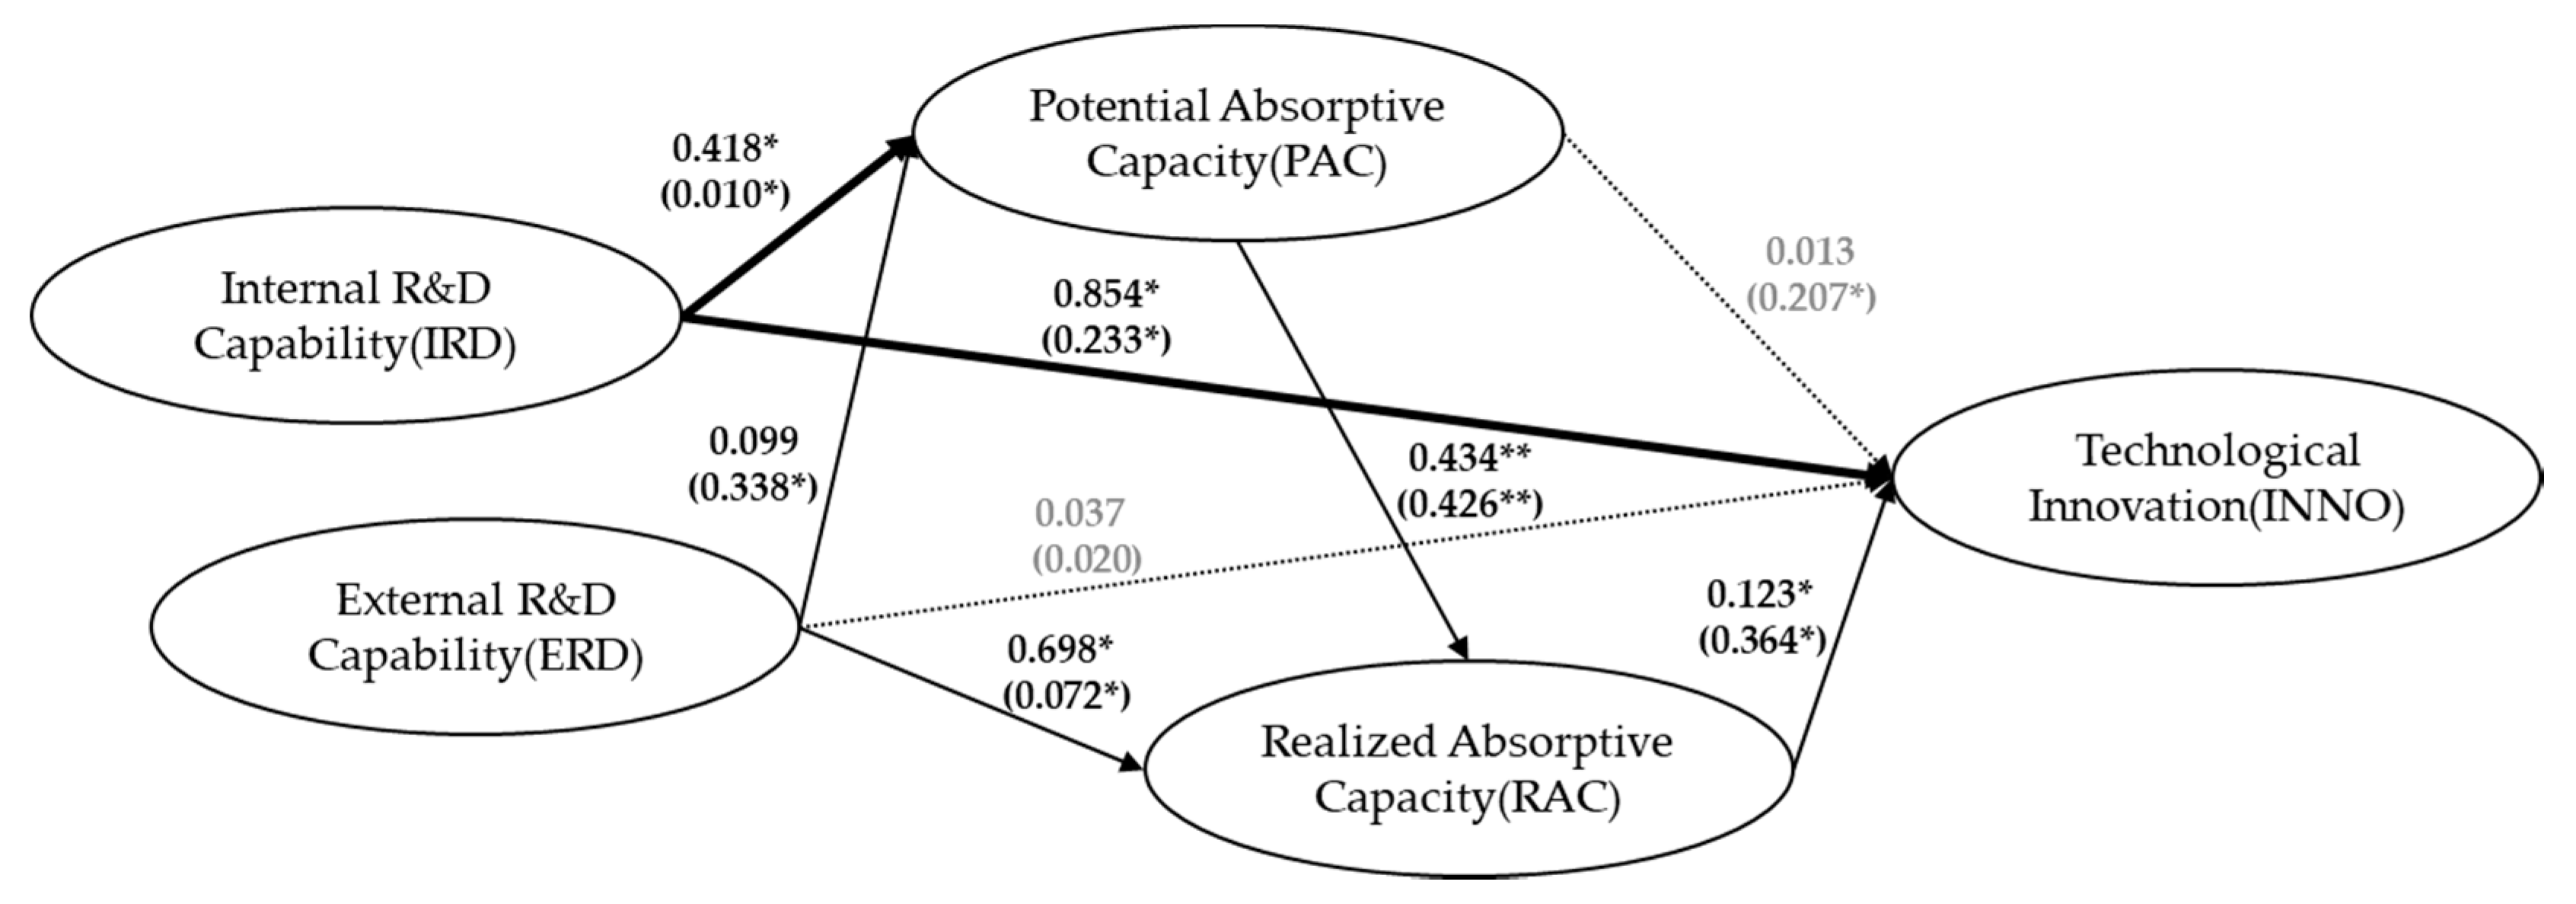
Additionally, to determine which paths differ between two sectors, the model that constrains each path coefficient was compared with the baseline model (b in Table 11). The least difference in path coefficients was verified sequentially. Table 12 shows an analysis result based on a cross-group equality constraint, indicating the difference in χ2 after the equality constraint was imposed on each path. Verification showed that the effect of internal R&D capability on potential absorptive capacity and technological innovation has a stronger positive effect on the high-tech sector than on the low-tech sector. The other paths were found to have no significant differences between the two sectors. Therefore Hypothesis 6 was accepted and the paths of the final model according to the industry sector are shown in Figure 5.
5. Discussion, Implications and Limitations
Based on the theory of dynamic capability [14,65], this study verified the process of R&D capabilities generating innovation using a structural equation model, and also conducted a multi-group analysis to verify differences according to technology level in the proven structural model.
First, the analysis of the structural model confirmed that the corporate R&D capability had a positive effect on the absorptive capacity. The internal use of a firm’s resources for R&D input and a formalized linkage structure with the external environment to secure deficient technology enhanced the potential absorptive capacity via acquisition and assimilation of knowledge. Thus, our results support previous research [41] that describes learning and utilization. Furthermore, because external technological knowledge is secured to save time and money, it is available immediately, meaning that it is used to transform and exploit knowledge as realized absorptive capacity. In addition, the indirect effect of an entity’s internal R&D capacity on its realized absorptive capacity, by mediating potential absorptive capacity, was also identified. Potential absorptive capacity was identified as having a positive effect on realized absorptive capacity, consistent with previous research [32] that found that internal R&D resources and the knowledge obtained by the external R&D linkage structure is a process of creating value that leads to R&D growth, including product development.
As a result of verifying the effect of R&D capabilities and absorptive capacities on firm’s technological innovation, the internal R&D capability and realized absorptive capacity were found to have a direct effect on technological innovation. In contrast, the external R&D capability and potential absorptive capacity were not found to have a direct effect on technological innovation. However, the indirect effect of potential absorptive capacity as a mediating role for the realized absorptive capacity was confirmed. This supports the results of studies in which R&D resources accumulated by the firm were found to be an important factor in innovation [39] and the realized absorptive capacity affected by the potential absorptive capacity was found to generate a firm’s performance [32]. Thus, this study suggests that R&D capabilities and absorptive capacities are significant factors in a firm’s innovation performance, especially when the internal R&D capability and the realized absorptive capacity are increased. In addition, from an open innovation perspective, the current results are consistent with a previous study [66] that found that external resources, knowledge, and technology do not directly affect innovation performance, but lead to performance through appropriate internal utilization.
Second, the latent mean analysis found that there was mean difference between industrial sectors in internal R&D capability and technological innovation. Specifically, both internal R&D capability and technological innovation are high in the high-tech sector. This supports the results of prior research that show that the high-tech industry has high R&D intensity [53] and innovative activities are undertaken in the science-based industry [46].
Third, verification of the difference of the multi-group path coefficient confirmed that there were differences in the path coefficients between sectors in the path in which the effect on the potential absorptive capacity and technological innovation of internal R&D capability was dependent on the technology level. Specifically, the internal R&D capability of the high-tech sector has a greater effect on potential absorptive capacity and technological innovation than that of the low-tech sector. This suggests that variation in the structure of the effect of R&D capabilities and absorptive capacities on firm’s innovation is dependent on the technology level.
Based on these results, this study is meaningful due to its implications for firms to enhance their R&D capabilities and support policies. First, because internal R&D capability was identified as a significant variable in the structural model for absorptive capacity and innovation, R&D capability development policies should be implemented in consideration of industry characteristics. This is particularly the case in the low-tech sector, in which support policies should aim at accumulating R&D resources, such as R&D human resources development and R&D funding. Second, firms in the low-tech sector are required to support policies related to learning and management of knowledge based on their own R&D capabilities, and to solve problems and provide institutional support for R&D implementation for product development and process innovation. In addition, from the corporate perspective, the difference of R&D capabilities and innovation pathways by the industrial sector is significant. Due to this difference, open innovation should consider the industrial characteristics and innovation systems, rather than being indiscriminate, thus helping enhance the usefulness of open innovation.
The limitations of this study and suggestions for future studies are as follows. First, the use of secondary data requires that careful attention is paid to the interpretation of research results based on conceptual and operational definitions of variables. Since the HCCP Survey is not an investigation aimed at measuring R&D activity, it is necessary to collect more variables for R&D capabilities. Second, various theories related to capability modeling in industry exist. Thus, comprehensive consideration of individual-level and organizational-level capabilities is required. A multi-level analysis must therefore be performed so that the individual’s job and basic capabilities associated with R&D can be linked to organizational capabilities. Third, this study attempted a cross-sectional approach; thus, it is necessary to examine using a longitudinal approach how R&D capabilities and absorptive capacities change and which variables affect that change process. Since the HCCP Survey used in this study comprises panel data, we would like to conduct further study using a research model design that reflects dynamic changes.
Author Contributions
Conceptualization, J.K.; data curation, J.K.; formal analysis, J.K.; investigation, J.K.; methodology, J.K.; visualization, J.K.; writing—original draft preparation, J.K.; writing—review and editing, S.O.C.; supervision, S.O.C.; validation, S.O.C. All authors have read and agreed to the published version of the manuscript.
Funding
This research received no external funding.
Acknowledgments
Special thanks is extended to the Society of Open Innovation: Technology, Market, and Complexity (SOItmC) and JinHyo Joseph Yun, the president of SOItmC, for supporting our research.
Conflicts of Interest
The authors declare no conflict of interest.
References
- Lichtenthaler, U.; Ernst, H. External technology commercialization in large firm; result if a quantitative benchmarking study. RD Manag. 2007, 37, 383–397. [Google Scholar] [CrossRef]
- Tsai, K.H.; Wang, J.C. External technology acquisition and firm performance; a longitudinal study. J. Bus. Ventur. 2008, 23, 91–112. [Google Scholar] [CrossRef]
- Tsai, K.H.; Wang, J.C. Does R&D Performance decline with firm size?—A re-examination in terms of elasticity. Res. Policy 2005, 34, 966–976. [Google Scholar]
- Lin, B.W.; Lee, Y.K.; Hung, S.H. R&D intensity and commercialization orientation effect on financial performance. J. Bus. Res. 2006, 59, 679–685. [Google Scholar]
- Kim, S.; Park, C.; Kim, M. Analysis on Innovation Characteristics in Low and Medium Technology Industry. Stepi Policy Res. 2015, 15, 1–105. [Google Scholar]
- Song, H. Comparative Analysis and Implications of R&D Capability of Local Enterprises. Kiet Induatrial Econ. 2009, 10, 50–60. [Google Scholar]
- Yam, R.C.; Guan, J.C.; Pun, K.F.; Tang, E.P. An audit of technological innovation capabilities in Chinese firms: some empirical findings in Beijing, China. Res. Policy 2004, 33, 1123–1140. [Google Scholar] [CrossRef]
- Schoenecker, T.; Swanson, L. Indicators of firm technological capability: validity and performance implications. IEEE Trans. Eng. Manag. 2002, 49, 36–44. [Google Scholar] [CrossRef]
- Romijn, H.; Albaladejo, M. Determinants of innovation capability in small electronics and software firms in southeast England. Res. Policy 2002, 31, 1053–1067. [Google Scholar] [CrossRef]
- Rothwell, R.; Dodgson, M. External linkages and innovation in small and medium-sized enterprises. RD Manag. 1991, 21, 125–138. [Google Scholar] [CrossRef]
- Hagedoorn, J. Trends and patterns in strategic technology partnering since the early seventies. Rev. Ind. Organ. 1996, 11, 601–616. [Google Scholar] [CrossRef]
- Tajudeen, F.P.; Jaafar, N.I.; Sulaiman, A. External Technology Acquisition and External Technology Exploitation: The Difference of Open Innovation Effects. J. Open Innov. Technol. Mark. Complex. 2019, 5, 97. [Google Scholar] [CrossRef] [Green Version]
- Dutta, S.; Narasimhan, O.; Rajiv, S. Success in high-technology markets: Is marketing capability critical? Mark. Sci. 1999, 18, 547–568. [Google Scholar] [CrossRef] [Green Version]
- Zahra, S.A.; George, G. Absorptive capacity: A review, reconceptualization, and extension. Acad. Manag. Rev. 2002, 27, 185–203. [Google Scholar] [CrossRef] [Green Version]
- Cohen, W.M.; Levinthal, D.A. Absorptive capacity: A new perspective on learning and innovation. Adm. Sci. Q. 1990, 35, 128–152. [Google Scholar] [CrossRef]
- Cassiman, B.; Veugelers, R. In search of complementarity in innovation strategy: Internal R&D and external knowledge acquisition. Manag. Sci. 2006, 52, 68–82. [Google Scholar]
- Duchek, S. Capturing absorptive capacity: A critical review and future prospects. Schmalenbach Bus. Rev. 2013, 65, 312–329. [Google Scholar] [CrossRef]
- Rocha, F. Inter-firm technological cooperation: effects of absorptive capacity, firm-size and specialization. Econ. Innov. New Technol. 1999, 8, 253–271. [Google Scholar] [CrossRef]
- Mowery, D.C.; Oxley, J.E.; Silverman, B.S. Strategic alliances and interfirm knowledge transfer. Strateg. Manag. J. 1996, 17, 77–91. [Google Scholar] [CrossRef] [Green Version]
- Stock, G.N.; Greis, N.P.; Fischer, W.A. Absorptive capacity and new product development. J. High Technol. Manag. Res. 2001, 12, 77–91. [Google Scholar] [CrossRef]
- Veugelers, R. Internal R & D expenditures and external technology rcing. Res. Policy 1997, 26, 303–315. [Google Scholar]
- Becker, W.; Peters, J. Technological Opportunities, Absorptive Capacities, and Innovation. 2000. Available online: http://citeseerx.ist.psu.edu/viewdoc/download?doi=10.1.1.196.3245&rep=rep1&type=pdf (accessed on 28 September 2020).
- Keller, W. Absorptive capacity: On the creation and acquisition of technology in development. J. Dev. Econ. 1996, 49, 199–227. [Google Scholar] [CrossRef]
- Gao, S.; Xu, K.; Yang, J. Managerial ties, absorptive capacity, and innovation. Asia Pac. J. Manag. 2008, 25, 395–412. [Google Scholar] [CrossRef]
- Cockburn, I.M.; Henderson, R.M. Absorptive capacity, coauthoring behavior, and the organization of research in drug discovery. J. Ind. Econ. 1998, 46, 157–182. [Google Scholar] [CrossRef]
- George, G.; Zahra, S.A.; Wheatley, K.K.; Khan, R. The effects of alliance portfolio characteristics and absorptive capacity on performance: A study of biotechnology firms. J. High Technol. Manag. Res. 2001, 12, 205–226. [Google Scholar] [CrossRef]
- Fosfuri, A.; Tribó, J.A. Exploring the antecedents of potential absorptive capacity and its impact on innovation performance. Omega 2008, 36, 173–187. [Google Scholar] [CrossRef] [Green Version]
- Szulanski, G. Exploring internal stickiness: Impediments to the transfer of best practice within the firm. Strateg. Manag. J. 1996, 17, 27–43. [Google Scholar] [CrossRef]
- Liao, J.; Welsch, H.; Stoica, M. Organizational absorptive capacity and responsiveness: An empirical investigation of growth–oriented SMEs. Entrep. Theory Pract. 2003, 28, 63–86. [Google Scholar] [CrossRef]
- Jansen, J.J.; Van Den Bosch, F.A.; Volberda, H.W. Managing potential and realized absorptive capacity: how do organizational antecedents matter? Acad. Manag. J. 2005, 48, 999–1015. [Google Scholar] [CrossRef] [Green Version]
- Murovec, N.; Prodan, I. Absorptive capacity, its determinants, and influence on innovation output: Cross-cultural validation of the structural model. Technovation 2009, 29, 859–872. [Google Scholar] [CrossRef]
- Leal-Rodríguez, A.L.; Roldán, J.L.; Ariza-Montes, J.A.; Leal-Millán, A. From potential absorptive capacity to innovation outcomes in project teams: The conditional mediating role of the realized absorptive capacity in a relational learning context. Int. J. Proj. Manag. 2014, 32, 894–907. [Google Scholar] [CrossRef]
- Organization for Economic Cooperation and Development. The OECD Innovation Strategy: Getting a Head Start on Tomorrow; Organization for Economic Cooperation and Development: Paris, France, 2010. [Google Scholar]
- Schumpeter, J. Creative destruction. Cap. Soc. Democr. 1942, 825, 82–85. [Google Scholar]
- Yam, R.C.; Lo, W.; Tang, E.P.; Lau, K. Technological innovation capabilities and firm performance. Int. J. Econ. Manag. Eng. 2010, 4, 1056–1064. [Google Scholar]
- Damanpour, F. Organizational innovation: A meta-analysis of effects of determinants and moderators. Acad. Manag. J. 1991, 34, 555–590. [Google Scholar]
- Utterback, J.M.; Abernathy, W.J. A dynamic model of process and product innovation. Omega 1975, 3, 639–656. [Google Scholar] [CrossRef]
- Tidd, J.; Trewhella, M.J. Organizational and technological antecedents for knowledge acquisition and learning. RD Manag. 1997, 27, 359–375. [Google Scholar] [CrossRef]
- Souitaris, V. Firm–specific competencies determining technological innovation: A survey in Greece. RD Manag. 2002, 32, 61–77. [Google Scholar] [CrossRef]
- Burgelman, R.A.; Christensen, C.M.; Wheelwright, S.C. Strategic Management of Technology and Innovation; McGraw-Hill: New York, NY, USA, 2008. [Google Scholar]
- March, J.G. Exploration and exploitation in organizational learning. Organ. Sci. 1991, 2, 71–87. [Google Scholar] [CrossRef]
- Todorova, G.; Durisin, B. Absorptive capacity: Valuing a reconceptualization. Acad. Manag. Rev. 2007, 32, 774–786. [Google Scholar] [CrossRef]
- Chen, Y.-S.; Lin, M.-J.J.; Chang, C.-H. The positive effects of relationship learning and absorptive capacity on innovation performance and competitive advantage in industrial markets. Ind. Mark. Manag. 2009, 38, 152–158. [Google Scholar] [CrossRef]
- Kim, Y. A Study on the Determinants of Technological Innovation in the Korean Manufacturing Firms-Focusing on Technological Regime. J. Ind. Econ. Bus. 2011, 24, 1451–1478. [Google Scholar]
- Malerba, F.; Orsenigo, L. Technological regimes and sectoral patterns of innovative activities. Ind. Corp. Chang. 1997, 6, 83–118. [Google Scholar] [CrossRef]
- Pavitt, K. Sectoral patterns of technical change: towards a taxonomy and a theory. Technol. Manag. Syst. Innov. 1984, 13, 343–373. [Google Scholar] [CrossRef]
- Song, W. Comparative analysis of sectoral innovation pattern. Sci. Technol. Policy 2000, 6, 176–190. [Google Scholar]
- Son, M. A Study on The Role of Competitive. In Strategical Advertisement and R&D in Determining the Market Structure; Yonsei Graduate Scool: Seoul, Korea, 2002. [Google Scholar]
- Scherer, F.M. Industrial Market Structure and Economic Performance, 2nd ed; Rand Mcnally College: Chicago, IL, USA, 1980. [Google Scholar]
- Scherer, F.M. Demand-pull and technological invention: Schmookler revisted. J. Ind. Econ. 1982, 30, 225–237. [Google Scholar] [CrossRef]
- Scott, J. Firm versus industry variability in R&D intensity. In R&D, Patents, and Productivity; University of Chicago Press: Chicago, IL, USA, 1984; pp. 233–248. [Google Scholar]
- Mukhopadhyay, A.K. Technological progress and change in market concentration in the US, 1963–1977. South. Econ. J. 1985, 52, 141–149. [Google Scholar] [CrossRef]
- Hatzichronoglou, T. Revision of the High-Technology Sector and Product Classification. In OECD Science, Technology and Industry Working Papers, No. 1997/02; OECD Publishing: Paris, France, 1997. [Google Scholar]
- Lawrence, M. High-tech industries drive global economic activity. Natl. Sci. Found. 1998, 7, 319–322. [Google Scholar]
- Jang, W.; Jeon, H.; Ahn, J.; Choi, S.; Lee, J.; Lee, J. Measures to Improve the Competitiveness of the Domestic Automobile Industry. VIP Rep. 2018, 722, 1–12. [Google Scholar]
- Yun, J.J.; Jeong, E.; Lee, Y.; Kim, K. The Effect of Open Innovation on Technology Value and Technology Transfer: A Comparative Analysis of the Automotive, Robotics, and Aviation Industries of Korea. Sustainability 2018, 10, 2459. [Google Scholar] [CrossRef] [Green Version]
- Avalos-Quispe, G.A.; Hernández-Simón, L.M. Open Innovation in SMEs: Potential and Realized Absorptive Capacity for Interorganizational Learning in Dyad Collaborations with Academia. J. Open Innov. Technol. Mark. Complex. 2019, 5, 72. [Google Scholar] [CrossRef] [Green Version]
- James, L.R. Aggregation bias in estimates of perceptual agreement. J. Appl. Psychol. 1982, 67, 219. [Google Scholar] [CrossRef]
- Bliese, P.D. Within-group agreement, non-independence, and reliability: Implications for data aggregation and analysis. In Multilevel Theory, Research, and Methods in Organizations: Foundations, Extensions, and New Directions; John Wiley and Sons: Hoboken, NJ, USA, 2000. [Google Scholar]
- Sun, P.Y.; Anderson, M.H. An examination of the relationship between absorptive capacity and organizational learning, and a proposed integration. Int. J. Manag. Rev. 2010, 12, 130–150. [Google Scholar] [CrossRef]
- Kim, M.; Kim, J.; Hong, S. Writing a Dissertation with a Structural Equation Model; Communication Books: Seoul, Korea, 2009. [Google Scholar]
- Vandenberg, R.J.; Lance, C.E. A review and synthesis of the measurement invariance literature: Suggestions, practices, and recommendations for organizational research. Organ. Res. Methods 2000, 3, 4–70. [Google Scholar] [CrossRef]
- Byrne, B.M.; Shavelson, R.J.; Muthén, B. Testing for the equivalence of factor covariance and mean structures: the issue of partial measurement invariance. Psychol. Bull. 1989, 105, 456. [Google Scholar] [CrossRef]
- Cohen, J. Statistical Power Analysis for the Behavioral Sciences; Lawrence Earlbam Associates: Hillsdale, NJ, USA, 1988. [Google Scholar]
- Teece, D.; Pisano, G. The dynamic capabilities of firms: an introduction. Ind. Corp. Chang. 1994, 3, 537–556. [Google Scholar] [CrossRef] [Green Version]
- Kim, S.; Kim, J. An Exploratory Study on the Performance of Open Product Innovation: Product Innovation Strategy, Source and Partner Contribution Perspectives. Korean J. Bus. Adm. 2011, 24, 685–703. [Google Scholar]
Figure 1.
Conceptual model

Figure 2.
Research model.

Figure 3.
Chart of determination for research target.
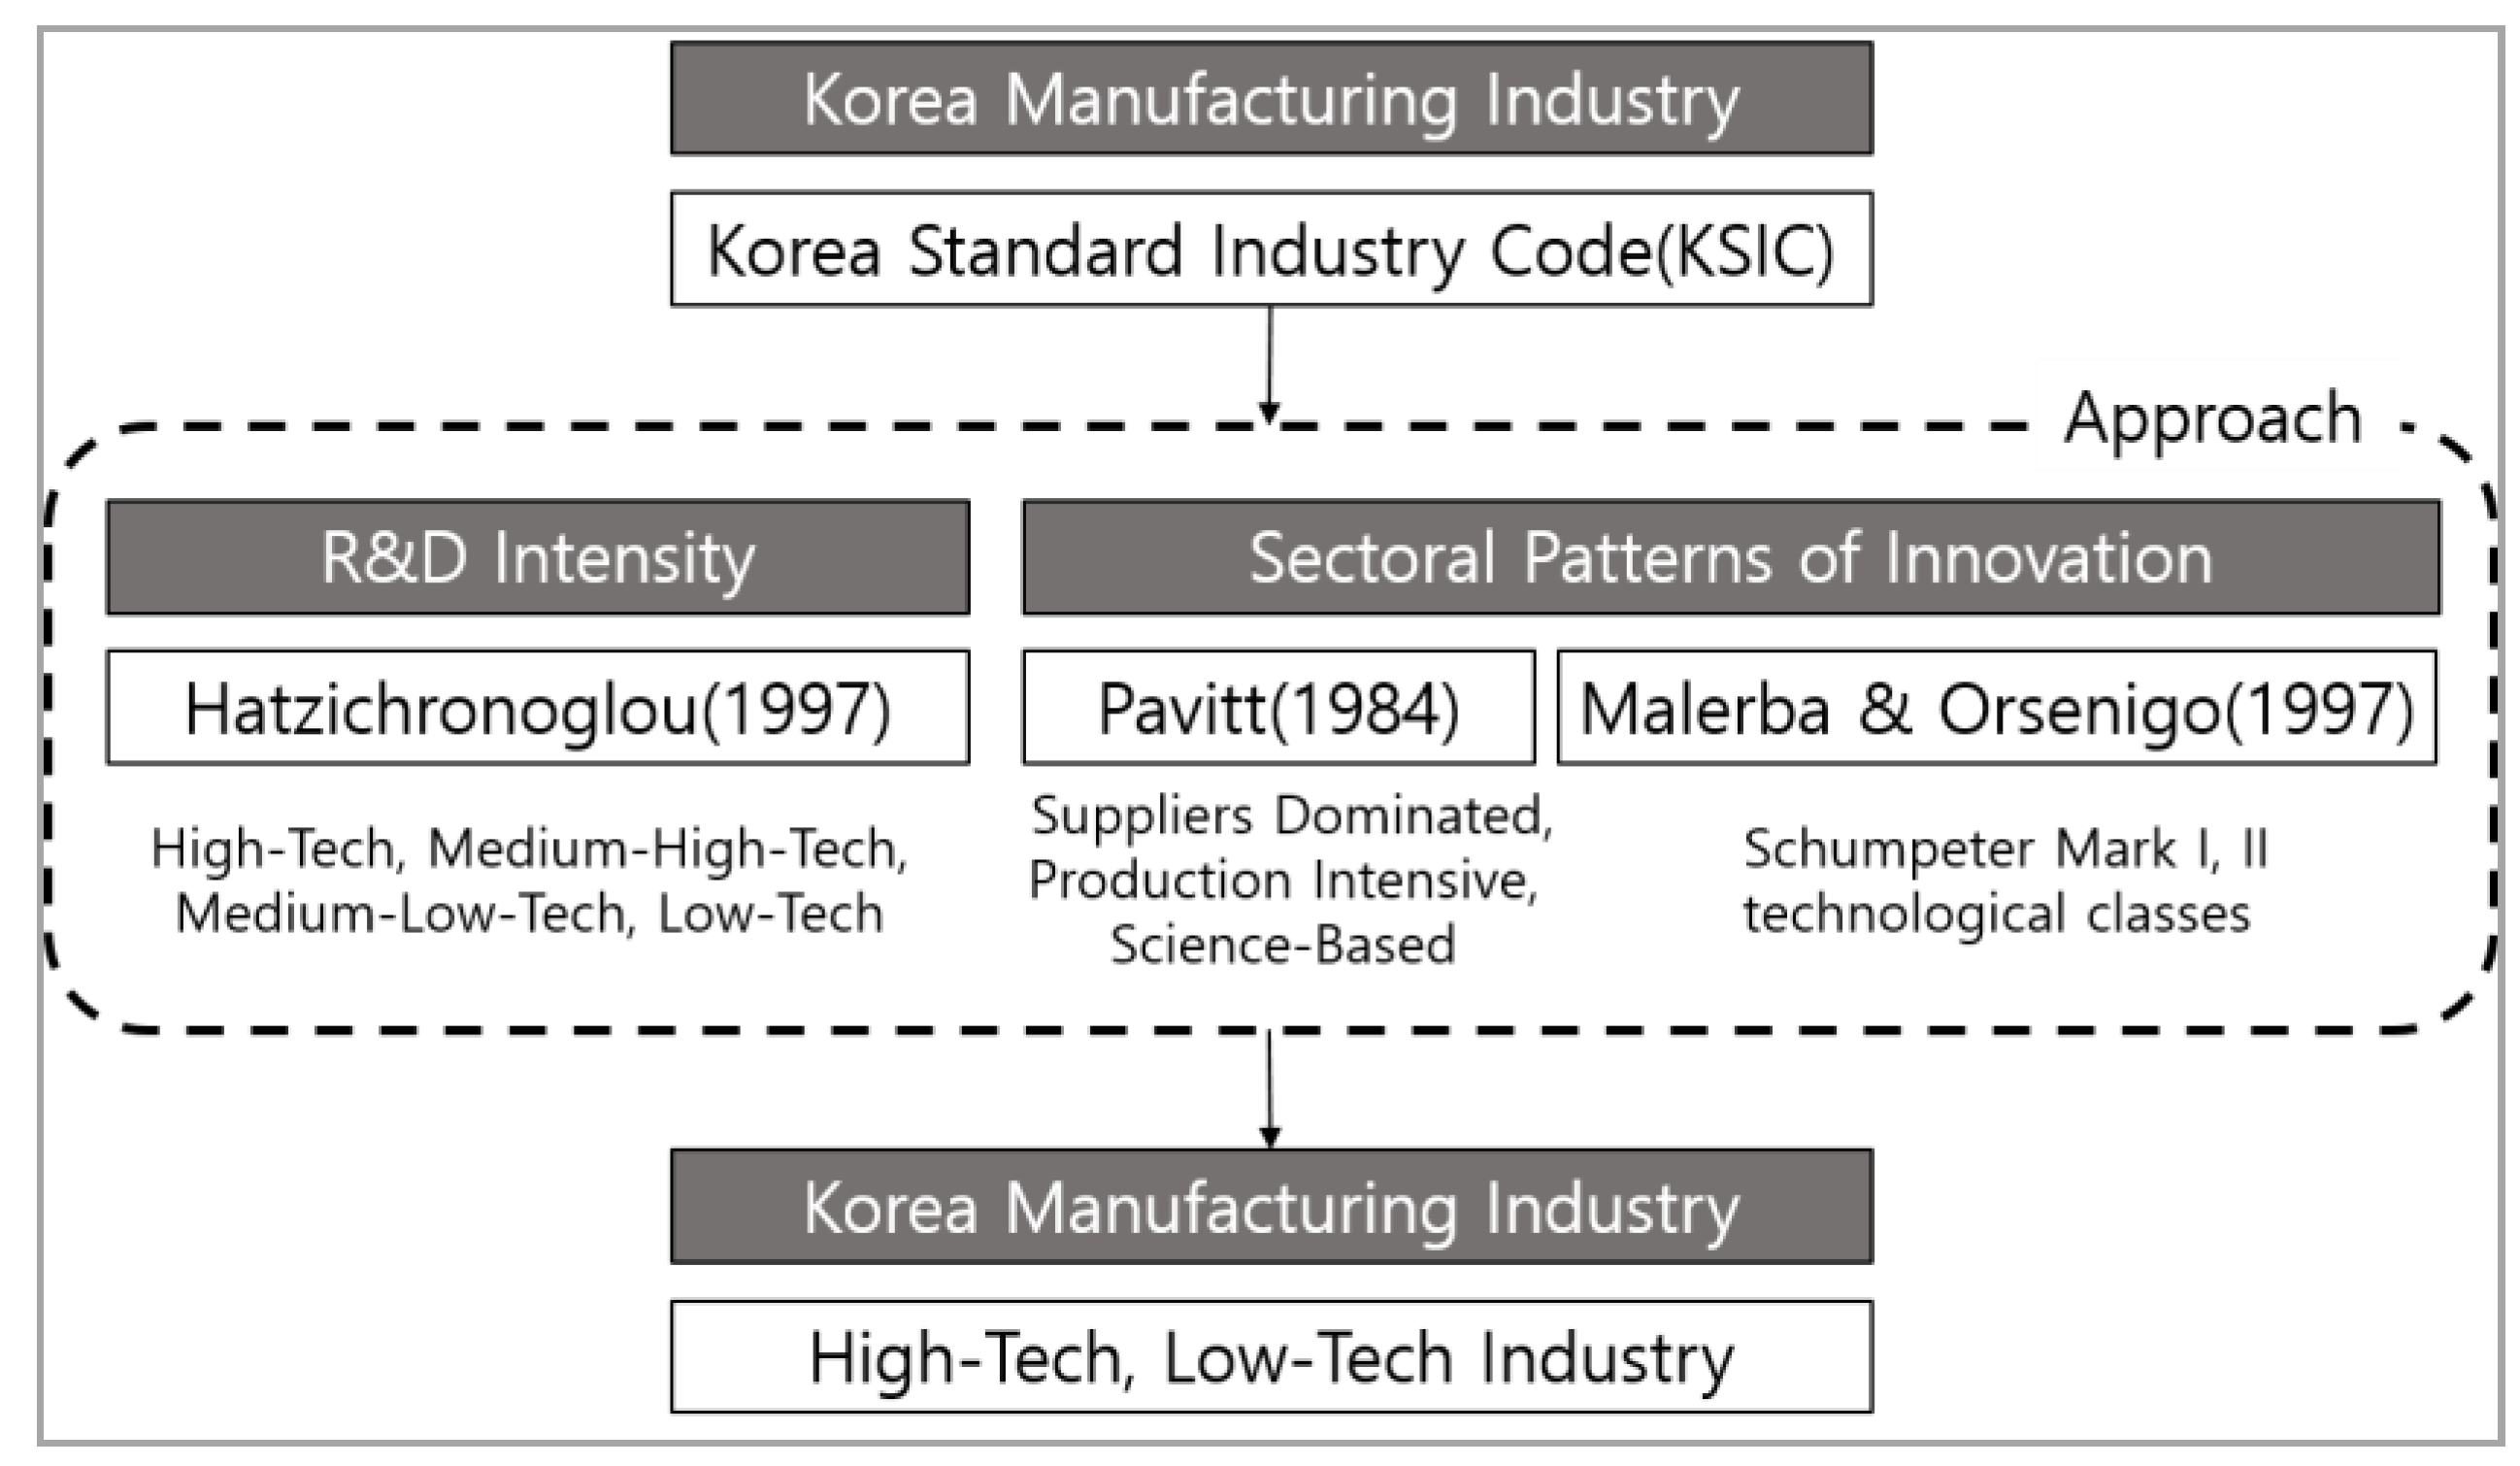
Figure 4.
Structural Model. * p < 0.05, **p < 0.01, *** p < 0.001.

Figure 5.
Structural model according to the high-tech and low-tech sectors. High-tech (Low-tech), * p < 0.05, ** p < 0.01, *** p < 0.001. Bold Line: Paths that differ in path coefficients between two sectors, Normal Line: significant path, Dotted Line: non-significant path.
Figure 5.
Structural model according to the high-tech and low-tech sectors. High-tech (Low-tech), * p < 0.05, ** p < 0.01, *** p < 0.001. Bold Line: Paths that differ in path coefficients between two sectors, Normal Line: significant path, Dotted Line: non-significant path.


Table 1.
Measurement approach of absorptive capacity.
| Category | Measurement | Research | |
|---|---|---|---|
| Input/Output approach | Input | R&D Investment | R&D expenditure(Rocha [18]) R&D Intensity (Cohen and Levinthal [15]; Mowery et al. [19]; Stock et al. [20]) Own R&D department (Veugelers [21]; Becker and Peters [22]) |
| R&D Human Capital | R&D personnel with a doctorate degree (Veugelers [21]) R&D employee divided by total employee (Keller [23]; Gao et al. [24]) | ||
| Output | Patent, Publication | Total publications (Cockburn and Henderson [25]) Patents (George et al. [26]) Cross-citation rate (Mowery et al. [19]) | |
| Process approach | Unidime-nsional | Operating Level | External knowledge to innovation outcomes (Fosfuri and Tribo [27]) Lacks absorptive capacity to internal stickiness (Szulanski [28]) |
| Multidim-ensional | Multidimensional Measurement | Exploration and exploitation of knowledge (Zahra and George [14]; Liao et al. [29], Jansen et al. [30]) Based on scientific /Market information (Murovec and Prodan [31]) | |
Table 2.
Classification of manufacturing industry in Korea.
| Category | Industry Sector (KSIC* 9th Code) |
|---|---|
| High-tech Industry | chemicals and chemicals (20), medical materials and medicines (21), electronic components, computers, images, acoustics and telecommunications equipment (26), medical, precision, optical instruments and watches (27), automobiles and trailers (30). |
| Low-tech Industry | grocery (10), beverage (11), tobacco (12), textile products: garment products (13), clothing, clothing accessories and fur products (14), leather, bag and shoe (15) wood and wood products: furniture manufacturing (16) pulp, paper and paper (17), printing and recording media reproduction (18) coke, briquettes and non-oil products (29) Rubber and plastic product (22), non-metallic mineral product (23), primary non-ferrous metal (24), metal processing: machinery and furniture exclusion (25), electrical equipment (28), other mechanical equipment (29), transportation equipment (31), furniture (32), other product (33) |
* KSIC: Korea Standard Industry Code.
Table 3.
Variables and items.
| Latent Variable | Measurement Variable | Items |
|---|---|---|
| Internal R&D Capability | IRC(1) | R&D intensity |
| IRC(2) | Job proficiency level of researcher | |
| IRC(3) | Ratio of full-time researcher | |
| External R&D Capability | ERC(1) | Promote strategic alliances |
| ERC(2) | Introduce relationships with external organizations | |
| Potential Absorptive Capacity | PAC(1) | Immediate response and understanding of customer demands |
| PAC(2) | Sufficient education and training | |
| PAC(3) | Management’s leadership in responding to changes in relation to knowledge exploration | |
| Realized Absorptive Capacity | RAC(1) | Implement in organizational structure, |
| RAC(2) | Use in knowledge management | |
| RAC(3) | Change in quality control methods | |
| Technological Innovation | INNO(1) | Degree of technological changes, |
| INNO(2) | Changes in lines or facilities at the workplace | |
| INNO(3) | Degree of development and introduction of new products |
Table 4.
General characteristics of firms (n = 348).
| Category | Sum (n, %) | Scale (n, %) | Age (n, %) | ||||||
|---|---|---|---|---|---|---|---|---|---|
| ~299 | 300~999 | 1000~1999 | 2000~ | ~10 Yrs | 11~20 Yrs | 20~30 Yrs | 30 Yrs~ | ||
| High-Tech | 138 (39.7) | 70 (50.7) | 56 (40.6) | 9 (6.5) | 3 (2.2) | 1 (0.7) | 24 (17.4) | 35 (25.4) | 86 (62.3) |
| Low-Tech | 210 (60.3) | 106 (50.5) | 76 (36.2) | 13 (6.2) | 15 (7.1) | 1 (0.5) | 27 (12.9) | 32 (15.2) | 157 (74.8) |
Table 5.
Mean, standard deviation, and correlation matrix (n = 348).
| 1 | 2 | 3 | 4 | 5 | 6 | 7 | 8 | 9 | 10 | 11 | 12 | 13 | 14 | |
|---|---|---|---|---|---|---|---|---|---|---|---|---|---|---|
| 1 | 1 | |||||||||||||
| 2 | 0.300 ** | 1 | ||||||||||||
| 3 | 0.217 ** | 0.434 ** | 1 | |||||||||||
| 4 | −0.016 | 0.001 | 0.050 | 1 | ||||||||||
| 5 | 0.101 | 0.018 | −0.017 | 0.246 ** | 1 | |||||||||
| 6 | 0.045 * | 0.039 | 0.071 | 0.146 ** | 0.058 | 1 | ||||||||
| 7 | 0.025 * | 0.021 | 0.104 | 0.073 | −0.017 | 0.409 ** | 1 | |||||||
| 8 | 0.031 * | 0.037 | 0.155 ** | 0.089 | −0.002 | 0.309 ** | 0.321 ** | 1 | ||||||
| 9 | 0.033 * | 0.010 | 0.041 | 0.159 ** | 0.085 | 0.234 ** | 0.172 ** | 0.140 ** | 1 | |||||
| 10 | 0.024 | 0.011 | 0.148 ** | 0.190 ** | 0.121 * | 0.126* | 0.087 | 0.194 ** | 0.310 ** | 1 | ||||
| 11 | 0.015 | 0.014 | 0.119 * | 0.126* | 0.139 ** | 0.041 * | 0.089 * | 0.055 * | 0.222 ** | 0.166 ** | 1 | |||
| 12 | 0.117 * | 0.174 ** | 0.179 ** | 0.087 | 0.025 | 0.176 ** | 0.213 ** | 0.267 ** | 0.201 ** | 0.214 ** | 0.122 * | 1 | ||
| 13 | 0.106 * | 0.192 ** | 0.165 ** | 0.194 ** | 0.124* | 0.178 ** | 0.122 * | 0.202 ** | 0.183 ** | 0.149 ** | 0.084 | 0.628 ** | 1 | |
| 14 | 0.036 | 0.143 ** | 0.131 * | 0.112 * | 0.031 | 0.052 | 0.105 | 0.162** | 0.206 ** | 0.189 ** | 0.056 | 0.468 ** | 0.300 ** | 1 |
| M | 1.29 | 2.96 | 0.08 | 0.28 | 0.08 | 3.65 | 3.13 | 3.61 | 0.33 | 0.11 | 0.52 | 2.27 | 2.03 | 2.28 |
| SD | 1.48 | 0.58 | 0.09 | 0.45 | 0.27 | 0.51 | 0.53 | 0.53 | 0.47 | 0.31 | 0.50 | 0.75 | 0.88 | 0.90 |
| SK | −1.68 | −0.09 | 1.92 | 0.96 | 3.17 | −0.14 | −0.12 | −0.05 | 0.72 | 2.57 | −0.08 | −0.07 | 0.22 | 0.13 |
| KU | 3.72 | 1.53 | 3.93 | −1.09 | 8.11 | 0.33 | 0.75 | 0.20 | −1.48 | 4.61 | −2.00 | −0.56 | −1.08 | −0.81 |
* p < 0.05, ** p < 0.01, *** p < 0.001. 1: Internal R&D Capability(1), 2: Internal R&D Capability(2), 3: Internal R&D Capability(3), 4: External R&D Capability(1), 5: External R&D Capability(2), 6: Potential Absorptive Capacity(1), 7: Potential Absorptive Capacity(2), 8: Potential Absorptive Capacity(3), 9: Realized Absorptive Capacity(1), 10: Realized Absorptive Capacity(2), 11: Realized Absorptive Capacity(3), 12: Technological Innovation(1), 13: Technological Innovation(2), 14: Technological Innovation(3).
Table 6.
Results of measurement model testing.
| Latent Variable | Measurement Variable | b | S.E | C.R. | β | AVE | CR |
|---|---|---|---|---|---|---|---|
| Internal R&D Capability | IRC(1) | 1.00 | 0.40 | 0.53 | 0.76 | ||
| IRC(2) | 0.51 * | 0.02 | 4.831 | 0.74 | |||
| IRC(3) | 0.35 * | 0.01 | 5.217 | 0.59 | |||
| External R&D Capability | ERC(1) | 1 | 0.66 | 0.67 | 0.79 | ||
| ERC(2) | 0.34 * | 0.13 | 2.530 | 0.38 | |||
| Potential Absorptive Capacity | PAC(1) | 1 | 0.62 | 0.67 | 0.86 | ||
| PAC(2) | 0.96 *** | 0.15 | 6.493 | 0.62 | |||
| PAC(3) | 0.86 *** | 0.14 | 6.283 | 0.54 | |||
| Realized Absorptive Capacity | RAC(1) | 1 | 0.59 | 0.60 | 0.81 | ||
| RAC(2) | 0.79 *** | 0.15 | 5.279 | 0.53 | |||
| RAC(3) | 0.55 ** | 0.13 | 4.228 | 0.34 | |||
| Technological Innovation | INNO(1) | 1 | 0.91 | 0.59 | 0.80 | ||
| INNO(2) | 0.89 *** | 0.09 | 10.108 | 0.69 | |||
| INNO(3) | 0.67 *** | 0.08 | 8.213 | 0.51 |
* p < 0.05, ** p < 0.01, *** p < 0.001.
Table 7.
Direct effects in the model.
| Paths | b | β | SE | CR |
|---|---|---|---|---|
| IRD→PAC | 4.847 * | 0.410 | 2.126 | 2.281 |
| IRD→INNO | 15.052 * | 0.613 | 6.024 | 2.498 |
| ERD→PAC | 0.220 * | 0.209 | 0.133 | 2.052 |
| ERD→RAC | 0.375 * | 0.389 | 0.175 | 2.146 |
| ERD→INNO | 0.122 | 0.056 | 0.259 | 0.471 |
| PAC→RAC | 0.354 *** | 0.386 | 0.102 | 3.473 |
| PAC→INNO | 0.031 | 0.015 | 0.306 | 0.103 |
| RAC→INNO | 0.578 * | 0.255 | 0.273 | 2.114 |
* p < 0.05, ** p < 0.01, *** p < 0.001.
Table 8.
Indirect effects in the model.
| Paths | b | β |
|---|---|---|
| IRD→INNO | 1.143 | 0.047 |
| IRD→RAC | 1.716 * | 0.158 |
| ERD→INNO | 0.268 | 0.123 |
| ERD→RAC | 0.078 | 0.081 |
| PAC→INNO | 0.204 * | 0.098 |
* p < 0.05, ** p < 0.01, *** p < 0.001.
Table 9.
Fit indices for invariance verification.
| Model | χ2 | df | χ2/df | NNFI | CFI | RMSEA (90% CI) | Diff. Test | |
|---|---|---|---|---|---|---|---|---|
| Δχ2 | p-Value | |||||||
| Configural invariance (a) | 163.099 * | 134 | 1.217 | 0.941 | 0.956 | 0.025 (0.004~0.038) | ||
| Full Metric invariance (b) | 175.863 * | 143 | 1.230 | 0.937 | 0.951 | 0.026 (0.008~0.038) | 12.764 (b − a) | 0.174 |
| Full Metric and Scalar invariance (c) | 217.134 ** | 157 | 1.383 | 0.895 | 0.910 | 0.033 (0.022~0.044) | 41.271 (c − b) | 0.004 |
| Full Metric and Partial Scalar invariance (d) | 192.266 * | 153 | 1.257 | 0.930 | 0.941 | 0.027 (0.012~0.039) | 16.403 (d − b) | 0.089 |
| Full Metric, Partial Scalar and Full Factor Variance invariance (e) | 209.638 * | 168 | 1.248 | 0.932 | 0.937 | 0.027 (0.012~0.038) | 17.372 (e − d) | 0.297 |
* p < 0.05, ** p < 0.01, *** p < 0.001.
Table 10.
Difference analysis of latent mean variables.
| Latent Variable | High-Tech | Low-Tech | Effect Size(d) | Total M | ||
|---|---|---|---|---|---|---|
| Latent M | M | Latent M | M | |||
| IRD | 0 | 1.55 | −0.186 * | 1.29 | −0.939 | 1.39 |
| ERD | 0 | 0.16 | 0.021 | 0.19 | 0.226 | 0.18 |
| PAC | 0 | 3.45 | 0.014 | 3.47 | 0.122 | 3.46 |
| RAC | 0 | 0.31 | 0.047 | 0.33 | 0.588 | 0.32 |
| INNO | 0 | 2.22 | −0.217 * | 2.16 | −0.493 | 2.19 |
* p < 0.05, ** p < 0.01, *** p < 0.001.
Table 11.
Fit indices for invariance verification.
| Model | χ2 | df | χ2/df | NNFI | CFI | RMSEA (90% CI) | Diff. Test | |
|---|---|---|---|---|---|---|---|---|
| Δχ2 | p-Value | |||||||
| Configural invariance (a) | 190.077 ** | 154 | 1.234 | 0.912 | 0.923 | 0.026 (0.010~0.038) | ||
| Full metric invariance (b) | 207.121 ** | 163 | 1.271 | 0.909 | 0.920 | 0.030 (0.016~0.040) | 17.044 | 0.071 |
| Structural invariance (c) | 218.181 ** | 167 | 1.306 | 0.906 | 0.913 | 0.030 (0.018~0.040) | 11.059 | 0.019 |
* p < 0.05, ** p < 0.01, *** p < 0.001.
Table 12.
Result of multi-group comparison.
| Paths | High-Tech | Low-Tech | Δχ2 | Δdf | ||
|---|---|---|---|---|---|---|
| b | β | b | β | |||
| IRD→INNO | 12.125 * | 0.854 | 3.288 * | 0.233 | 4.108 * | 1 |
| PAC→RAC | 0.341 ** | 0.434 | 0.433 ** | 0.426 | 0.227 | 1 |
| PAC→INNO | 0.023 | 0.013 | 0.451 * | 0.207 | 0.260 | 1 |
| ERD→PAC | 0.133 | 0.099 | 0.283 * | 0.338 | 1.175 | 1 |
| IRD→PAC | 3.351 * | 0.418 | 0.063 * | 0.010 | 4.833 * | 1 |
| ERD→INNO | 0.088 | 0.037 | −0.051 | −0.028 | 0.020 | 1 |
| RAC→INNO | 0.279 * | 0.123 | 0.779 * | 0.364 | 0.207 | 1 |
| ERD→RAC | 0.733 * | 0.698 | 0.178 * | 0.209 | 1.229 | 1 |
| All strains | 12.059 | 8 | ||||
* p < 0.05, ** p < 0.01, *** p < 0.001.
© 2020 by the authors. Licensee MDPI, Basel, Switzerland. This article is an open access article distributed under the terms and conditions of the Creative Commons Attribution (CC BY) license (http://creativecommons.org/licenses/by/4.0/).
Share and Cite
MDPI and ACS Style
Kim, J.; Choi, S.O. A Comparative Analysis of Corporate R&D Capability and Innovation: Focused on the Korean Manufacturing Industry. J. Open Innov. Technol. Mark. Complex. 2020, 6, 100. https://doi.org/10.3390/joitmc6040100
AMA Style
Kim J, Choi SO. A Comparative Analysis of Corporate R&D Capability and Innovation: Focused on the Korean Manufacturing Industry. Journal of Open Innovation: Technology, Market, and Complexity. 2020; 6(4):100. https://doi.org/10.3390/joitmc6040100
Chicago/Turabian StyleKim, Jaeseong, and Sang Ok Choi. 2020. "A Comparative Analysis of Corporate R&D Capability and Innovation: Focused on the Korean Manufacturing Industry" Journal of Open Innovation: Technology, Market, and Complexity 6, no. 4: 100. https://doi.org/10.3390/joitmc6040100