Readiness of Regions for Digitalization of the Construction Complex


1
Institute of Industrial Management, Economics and Trade, Peter the Great St. Petersburg Polytechnical University, 195251 St. Petersburg, Russia
2
Institute of Civil Engineering, Peter the Great St. Petersburg Polytechnical University, 195251 St. Petersburg, Russia
*
Author to whom correspondence should be addressed.
J. Open Innov. Technol. Mark. Complex. 2021, 7(1), 2; https://doi.org/10.3390/joitmc7010002
Submission received: 17 October 2020
/
Revised: 14 December 2020
/
Accepted: 19 December 2020
/
Published: 23 December 2020
(This article belongs to the Special Issue Technology Driven Innovation, Research Management and Policy Making)
Abstract
:The construction industry is high-tech and is one of the key areas for the strategic development of regions in terms of their digitalization. The construction complex provides regions with infrastructure of various levels from design documentation to commissioning, as well as reconstruction and major repairs of buildings. The article adopts an isolated regional approach, which is due to the need to assess specific territories by the level of readiness for digitalization of the construction complex. The purpose of the research is to determine the level of readiness of Russian regions for the digitalization of the construction complex by forming a rating of regions according to the indicator “the level of readiness of the region for digitalization of the construction complex”. To build the rating, the fuzzy sets method was applied using a triangular membership function, which allows to describe the influence of various processes on the formation of digitalization processes in the construction complex of the region. When forming the rating, a scale of fuzzy variable values is set which allows one to classify regions by levels, namely very low, low, medium, high, and very high. The generated rating is illustrated according to the specified scale. Based on the rating, the leading regions and outsider regions are identified by the formed indicator. It was determined that Moscow and Saint Petersburg are highly prepared for the digitalization of their construction complexes, and 53 regions of Russia are potentially prepared. In the future, it will be possible to create a rating of Russian regions on the level of readiness for digitalization of the construction complex with a two-year lag. Then, using the DEA shell analysis method, a quantitative assessment will be carried out that allows you to form performance boundaries and, against the background of four years, adjust the data to identify the most realistic picture. Also, the rating methodology considered by the authors allows us to scale this research to the international level, which will allow us to assess the level of digital development of construction complexes in other countries. The proposed rating algorithm is suitable for other sectors and complexes of the economy. It is enough to determine the main aggregate indicator and select groups of factors.
1. Introduction
The systematic development of Russian federal subjects can be ensured by developing the construction industry at the regional level, since this industry has a horizontal structure that ensures the operation of other sectors and complexes of the national economy. It is important to take into consideration the concept of the construction complex when studying the regional level of infrastructure development. To define the essence of the construction complex, which includes the construction companies and organizations of a specific region, it should be understood that it provides the region with infrastructure at various levels—from design documentation to commissioning, as well as reconstruction and the major renovation of buildings. The regional construction complex is oriented towards strategic, territorial, and systematic industrial development consistent with modern trends [1,2]. Note that the construction industry is high-tech [3,4,5], and therefore the digital development of the construction complex at the regional level is quite promising.
According to the current trends and state policy of the Russian Federation [6,7], the implementation of regional digital development at the industry level is quite relevant, including, for the purpose of this study, the digital processes of the regional construction complex. At the international level, a series of ISO 19650 standards has been adopted, which is the basis for BIM, but for the territory of the Russian Federation, ISO 19650 is not dominant. The regulatory framework for BIM in Russia is just beginning to take shape. Currently, the following regulatory and technical documents have been developed and approved on the territory of the Russian Federation to ensure the implementation of information modeling technologies in construction at the state level: (1) GOST R 57310-2016 (ISO 29481-1:2010); (2) GOST R 57563-2017 (ISO/TS 12911: 2012); (3) GOST R 57311-2016; (4) GOST R 57309-2016 (ISO 16354: 2013); (5) GOST R 12006-2-2017 (ISO 12006-2: 2015); (6) GOST R 12006-3-2017 (ISO 12006-3: 2007); (7) GOST R ISO 22263-2017 (ISO 22263:2008); (8) SP 301.1325800.2017; (9) SP 333; (10) SP 328; (11) SP 331, etc.
The development of digital processes in the construction complex can be analyzed through the degree of knowledge and application of building information modeling (BIM) technology. Currently, BIM is one of the leading methods of digitalization, which is reflected in the works of such researchers as: Heigermoser D., Oraee M., Al-Saeed Y., Chen K., Chan D. W., and others [8,9,10,11,12]. So, BIM is considered as an interconnected step-by-step basis for creating digital duplicates of constructed objects. Also, BIM can be included in the basis of digital development of the construction industry, when viewed through the prism of the construction complex. This approach will allow regulating the organization of construction production at the regional level and then at the Federal level, including upgrading the established management system. According to a 2017 survey of the level of BIM development in Russia conducted by Concurator [13] and involving 190 respondents, it was found out that 31% of respondents had been using BIM for more than five years, 17% for 3–5 years, 31% for 1–3 years, and 21% for less than a year.
The widespread implementation of new technologies is a process that allows new ideas, approaches, and practices to be transferred from the source of their initiation to the consumer, be it an individual user, a company, a city, or a region. The impact of digital evolution is also spreading at the industry level. Diffusion of innovations is a key theoretical paradigm that explains the complex process of gradual penetration and spread of innovations within industrial sectors and in the consumer market over time [14].
Construction is a complex process that can be represented as a function that depends on the influence of many variables. These can be various internal and external factors that affect the result and the final product to varying degrees [15]. Deviations from the specified parameters can lead to an increase in the cost and construction time. Therefore, it is necessary to apply such technology that would allow for the achievement of all the goals of the construction project within the established budget and on time. BIM is such a technology [8,9,10,11,12,16,17,18,19,20,21,22,23,24,25,26,27,28,29,30,31,32].
Thanks to the digital evolution approach, digital technologies provide the necessary development model and improved organizational changes in the construction industry, which is currently at the stage of automation, artificial intelligence, machine learning, and innovations [33,34]. The sharing of new technologies boosts decision-making, streamlines workflows, and helps to avoid repetitive tasks and errors. This fact is substantiated by a review of scientific works by Russian and foreign authors [16,17,18,19,20,21,22,23,24,25,26,27,28,29,30,31,32] who address different aspects of digital processes in construction operations and BIM technology. Aziz D. et al., Dinga L.Y. et al., Parka J.W. et al., Zoua Y. et al. in [16,17,18,19], much attention is paid to the development and implementation of BIM technology in investment and construction projects, as well as the development of BIM technology in alternative areas of everyday life. The authors of [20,21,22,23,24,25] consider different dangers in the construction industry and propose to evaluate various risks that are already at the design stage, using a 3D model of the future project, creating an algorithm that allows one to analyze new threats and warn participants of the future construction project. Zhang S. et al. and Vacharapoom Benjaoran et al. in [26,27], BIM technologies are considered in the process of urban planning, when the use of these technologies can stimulate the development of the city cadaster. Romanovich M.A. and Sakhtereva M.I. in [28], the authors discuss the use of BIM technology in the reconstruction of underground complexes, namely metro stations. The correct organization of all construction processes during the reconstruction of this type of structure is unique and complex in design, and reconstruction is one of the main tasks. Vakhrusheva S. et al. in [29], the issue of developing an information model for a cultural heritage object is considered. However, it should be noted that at present, BIM technologies are used much less in reconstruction projects than in the case of new construction. This is due, among other things, to the lack of the necessary experience in organizing work, the projects’ complexity, and the lack of methods and recommendations for planning work production processes using BIM technology. In joint international construction projects, the use of cloud platforms (CDE—common data environment) comes first [30]. BIM technology provides all the means to realize the possibility of collaboration. However, as a rule, before starting a joint international project, a number of important issues need to be resolved, such as the distribution of roles and responsibilities between the participants in the construction project, various forms of access and interaction with the BIM model, the delivery schedule, and coordination between various sections of the project, for example, identification of collisions between the architectural model and engineering networks. Achieving the maximum result for all participants in construction projects is possible in the case of an objective assessment of the capabilities and potential of the participants, identification of strengths and weaknesses, and the development of a general methodology for working on the project, including the establishment of specific links between the participants.
The analysis of scientific literature and publications on the implementation of BIM technologies shows the relevance of the development of this direction, as well as the positive economic effects. BIM implementation has been extensively researched by several international authors, namely Succar B. and Kassem M. [35,36]. These authors review the implementation of Marco BIM [35]. The article presents five conceptual models for evaluating the macro-implementation of BIM in all markets and informing the development of a BIM implementation policy. Kassem M. and Succar B. in [36], the authors consider: (1) how these models are tested by collecting data from 99 experts from 21 countries using the survey tool; (2) highlight commonalities and differences between sample countries regarding BIM implementation; (3) introduces examples of tools and templates for developing or calibrating a BIM implementation policy. In particular, Kassem M. and Succar B. in [36], Russia is one of the markets of the second study. Other authors emphasize the effectiveness of BIM in calendar planning [31], in the assessment of labor protection [32], and in the cost estimation of construction of buildings and structures.
The conducted analysis of scientific works showed a high level of coverage of digital processes in construction operations, with various aspects of BIM development and digital optimization of the construction process studied and examined. Taking into account the review of modern scientific works, including the Marco BIM methodology proposed by Succar B. and Kassem M., the authors of this study believe that the proposal of a slightly different methodology for ranking territories using a mathematical model based on the linguistic values of variables will make a significant contribution to the assessment of BIM development at the regional level. It will be possible to determine the level of readiness of regions for digitalization of the construction complex.
Determining an effective strategy and drafting a long-term plan for the development of the construction industry in a region is possible by formulating indicators for a comprehensive assessment of the level of digitalization according to different parameters. This paper aims to formulate an approach to the assessment of regions in terms of individual factors that form a single indicator. Thus, the purpose of this study was to determine the level of preparedness of Russian regions for the digitalization of the construction complex by ranking regions according to the indicator of “the level of preparedness of the region for the digitalization of the construction complex”. To this end, it is necessary: (1) to form groups included in the proposed indicator and to select indicators for these groups; (2) to calculate the proposed indicator through the example of Saint Petersburg; (3) to rank Russian regions using the proposed indicator, dividing the regions into groups according to their development level. Russian regions are the object of the study, and digitalization of the construction complex is the subject.
The article adopts an isolated regional approach, which is due to the need to assess specific territories by the level of readiness for digitalization of the construction complex. For a more accurate evaluation areas, the article examines the activities of business units, directly located on the particular subject that will allow to assess the current regional situation. Focusing on the Russian construction operation, we note that most enterprises are based in the territory of one region, sometimes the activity extends to adjacent regions, and less often to Federal districts and the country.
To systematize understanding about the readiness of territories to the digitalization of the construction complex, in this study it is necessary to analyze the components forming the digital potential of the building complex, and to form an aggregated index for its evaluation. The study attempts to form a universal methodology for rating industries and complexes, which will allow us to scale this research in the future. Investigating the digitalization of the construction complex in the regions of Russia, the authors raise the following questions: How prepared are Russian regions for the digital transformation of the construction sector? Which regions are potentially prepared for this transformation? Which regions are less prepared? Which regions are not prepared for industrial digitalization? It is assumed that the resulting rating of the level of preparedness of Russian regions for the digitalization of the construction complex will help to identify leaders and outsiders. To assess the impact of industry digitalization at the international level, this study will provide answers to such important questions as: will the results of this study be applicable to scale the methodology considered to other industries and complexes? Will it be possible to conduct similar studies to identify the level of digitalization of the construction complex in other countries?
2. Materials and Methods
2.1. Definitions and Research Methodology
In order to study the relevance of BIM technologies to the territory of the Russian Federation, we must first define the essence of the concept of BIM. BIM is a process that creates, develops, and improves a building’s information model at each stage design. BIM also provides information that is suitable for computer processing regarding a planned or already existing construction object, which: (1) is coordinated, interconnected, and consistent; (2) has a geometric reference; (3) allows for necessary updates; (4) can be used for calculation and analysis [37] (p. 76).
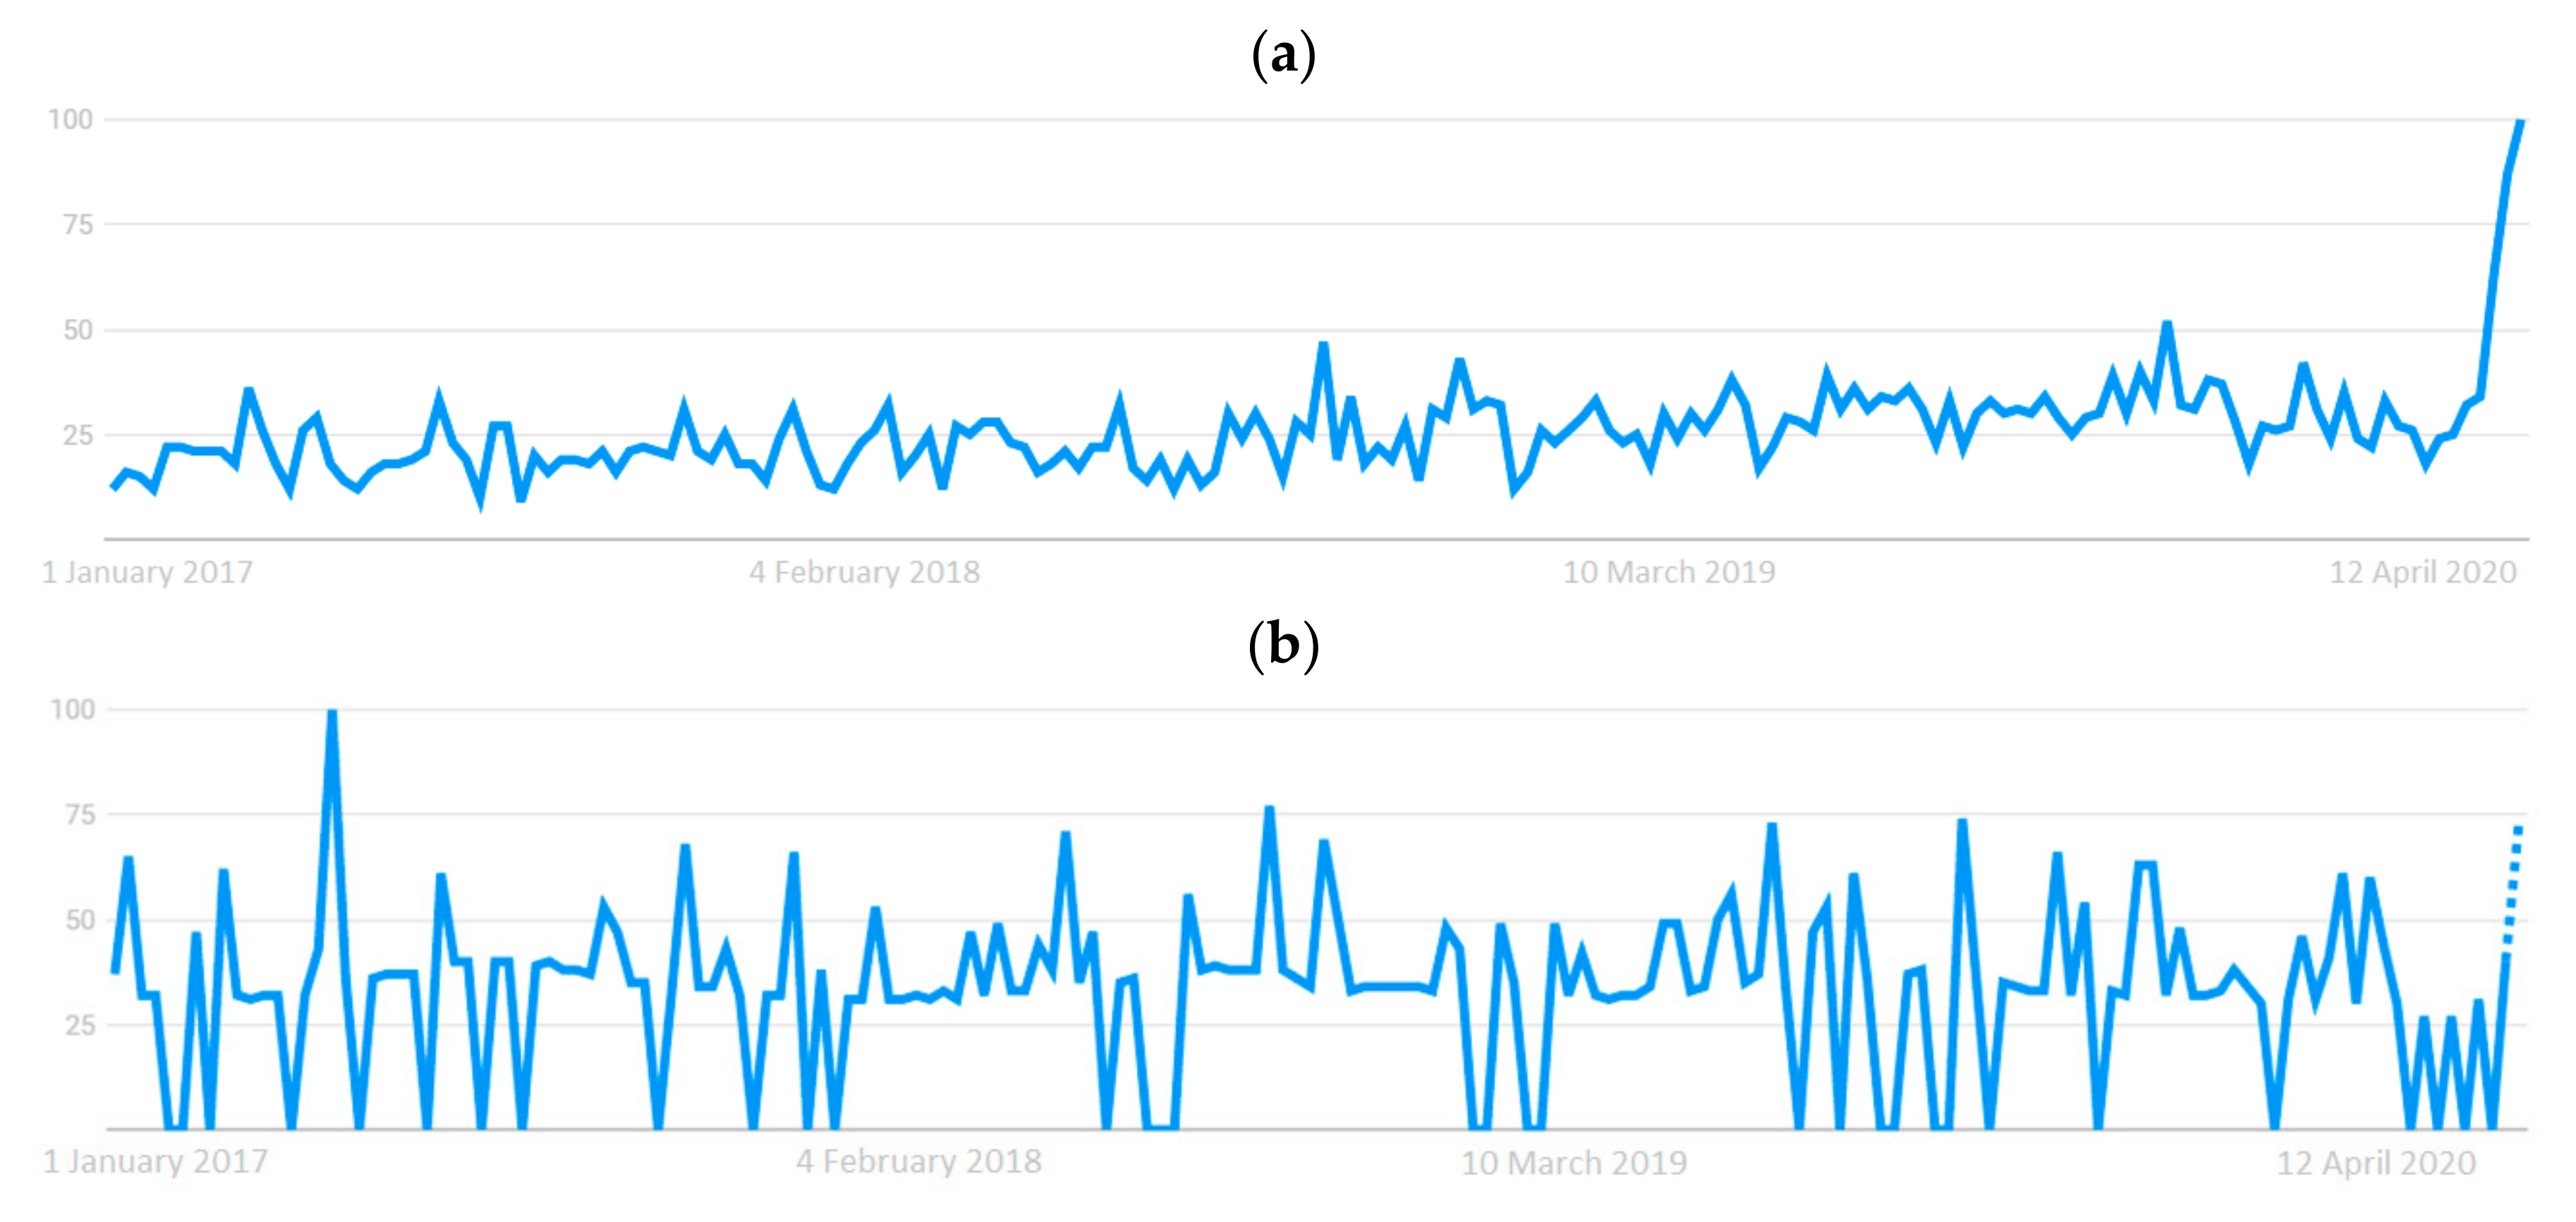
We analyzed data from the Google search engine for the search queries “BIM” and “BIM technologies” (hereafter, we consider these abbreviations as equivalent concepts) for the period from 1 January.2017 to 29 May 2020 and determined that they were, on average, popular and very popular, respectively (see Figure 1a,b) [38]. In Figure 1, the numbers indicate the level of interest in the topic relative to the highest value for the territory and the time period. One hundred points indicates the highest level of popularity of the query, 50 points stands for a level of popularity that is half as high, and 0 points marks an area with not enough data on the given query.
Popularity of the “BIM” query by region was distributed as follows: Moscow (100 points), Saint Petersburg (88 points), Tula region (52 points), Sverdlovsk region (52 points), and Tyumen region (49 points). For the search query “BIM technology”, high popularity was registered only in Moscow, with 100 points, while in other regions there were insufficient data for this query. Therefore, it is assumed that in these regions, the expected level of preparedness for the digitalization of the construction complex will be higher than in other federal subjects.
In accordance with the purpose of the study, it is necessary to determine the methodology for forming the rating of the subjects of the Russian Federation for the indicator “the level of readiness of regions for digitalization of the construction complex”. For example, the fuzzy set method can be used to rank regions. This method was first proposed in 1965 by Lotfi Zadeh in his article “Fuzzy sets” [39] and further elaborated by other authors in subsequent studies [40,41,42,43,44]. The fuzzy set method can be used to describe how variables take on linguistic values with a specific set of components , where: x is the variable name; T is the term set or set of values; D is the range of definition.
- The expert builds a linguistic variable with its own term set of values (T). For example, for school: very low, low, medium, high, very high.
- To structurally describe the linguistic variable, the expert chooses its corresponding quantitative feature.
- The expert compares the function of belonging to a particular fuzzy subset for each value of a linguistic variable. Membership functions can be represented as piecewise linear functions, which are convenient to apply in practice since they have an analytical representation in the form of a mathematical function. These membership functions include triangular functions (I), trapezoidal functions (II), Z-shaped functions (III), and S-shaped functions (IV) (Table 1).
If a linguistic variable is described in the way described earlier, it can be used in the appropriate methods and operations.
2.2. Method of Use
To solve the economic problem, this paper uses the triangular membership function, which makes it possible to describe how certain processes affect the formation of digitalization processes in the construction complex of a region. Triangular membership functions are sufficiently accurate in the description of economic processes. When describing processes, it is convenient to describe triangular membership functions using triangular numbers of the type , where: a1 and a3 are the abscissas of the lower base; a2 is the abscissa of the upper point of the triangle, which defines in the area with non-zero membership of support x to the corresponding fuzzy subset. When building the mathematical model, the authors followed the following logical steps:
- Introducing the developed linguistic variable designating the “level of preparedness of the Russian region for the digitalization of the construction complex (Y)”; developing a scale for the assessment of the level of the proposed indicator.
- Selecting Xi factors for Yi groups. You need to create groups (orientation blocks) that affect the aggregated indicator being formed (see step 1). Next, you need to make a selection of those factors that serve as the basis of the orientation blocks 1-n.
- Determining the range of definition for the factors, sets of values, and triangular numbers. This means that factors are ranked by a triangular function in a given range. For example, if the ranking is based on a factor that determines the level of Gross regional product (GRP), then the values of this factor are filtered from a lower value to a higher value in accordance with the territory of the subject of the Federation. Next is the minimum, maximum, and average value. In accordance with the specified number of rating ranks, on the scale of fuzzy values of variables Y, formed according to step 1, the factor is normalized within the rank by T numbers. Therefore, the domain of determining the set of values and triangular numbers for this factor is formed.
- Normalizing Xi factors by group using the formula:
- Building a matrix of Xi factors after normalization by determining the level of their importance. Factors are classified according to Table 2.
- Calculating the aggregate indicator within each group (Y1, Y2, Y3, Y4). This indicator for each group is necessary for factor convolution, which will allow you to form aggregated indicators for groups (Y1, Y2, Y3, Y4). To calculate this indicator, the following formula is needed:where λij is determined from the table-matrix of factor values (Stage 5); yj refers to nodal points of triangular numbers, which are calculated using the formula:where j is the number of the column λ.
- Forming a single Y indicator using the weighting factors (ri) assigned to the formed groups. For the classification of the aggregated indicator for the groups, Table 3 is needed.
The fuzzy set method makes it possible to evaluate models and can be applied to the formation of a consolidated aggregate indicator, “the level of readiness of the region for digitalization of the construction complex”, as well as to the formation of a rating for the subjects of the Russian Federation for this indicator.
3. Results and Discussion
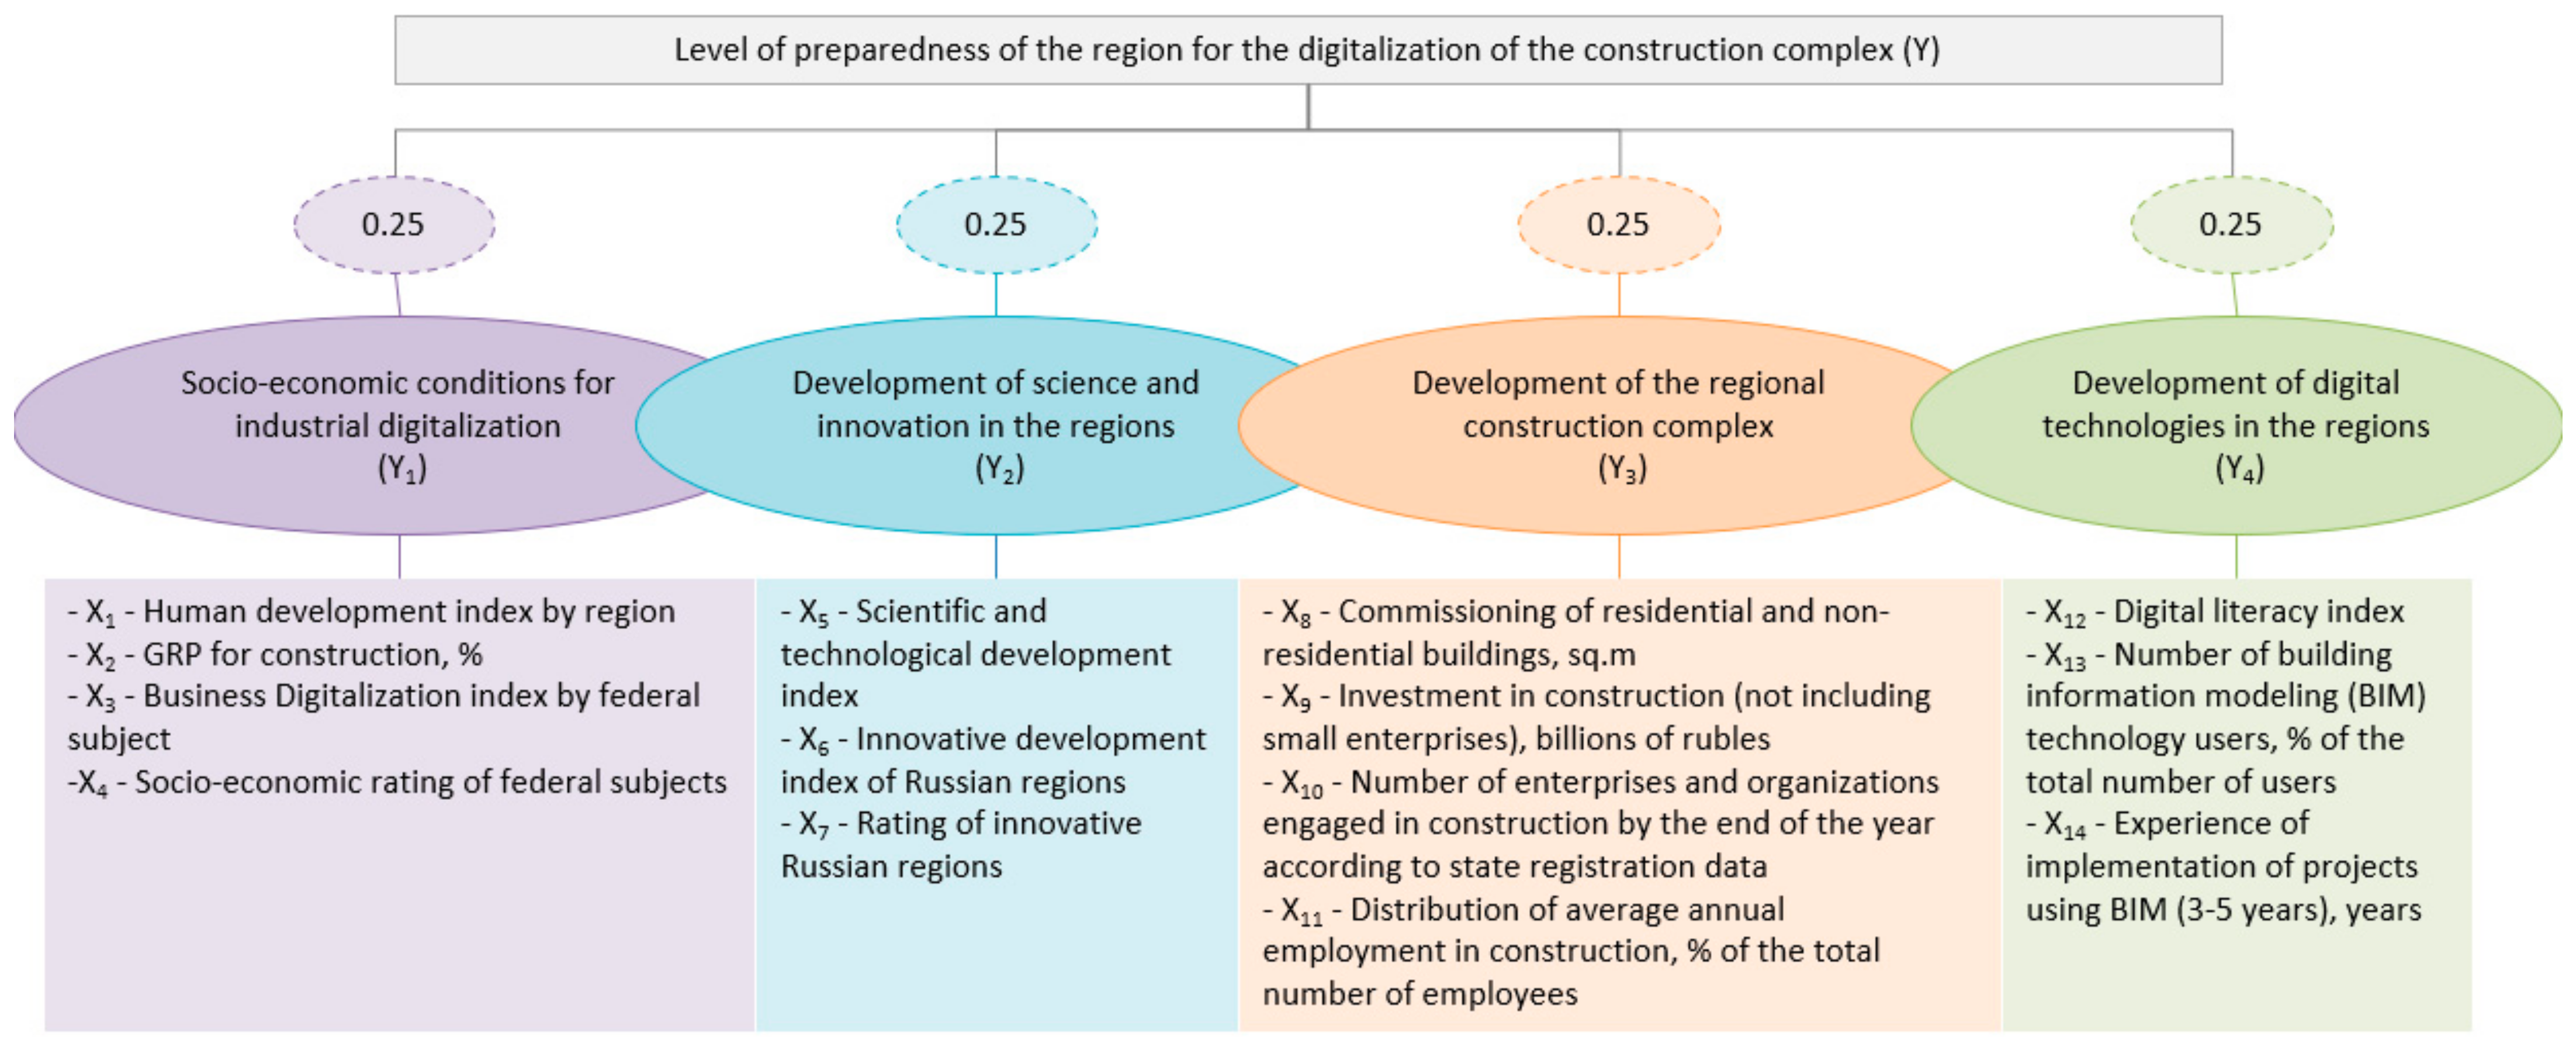
To assess the level of preparedness of regions for digitalization of the construction complex, it is necessary to select factors in accordance with the following groups: “Socio-economic conditions for industrial digitalization” (Y1); “Development of science and innovation in the regions” (Y2); “Development of the regional construction complex” (Y3); “Development of digital technologies in the regions” (Y4) (Figure 2). Quantitative and qualitative indicators were selected as factors for the model. These were obtained from the database of the Federal State Statistics Service [45], publications of rating agencies [46,47,48,49,50], and analytical centers and organizations [13,51,52]. Quantitative data were collected in the article for all indicators for 2017. The choice of the period is due to the fact that in official sources [45], such indicators as “Gross regional product (GRP) for construction, %” have not yet been updated. As the state statistics database is updated, the second iteration of this study will be carried out with a time lag of two years. The formation of the aggregate indicator (Y) by means of the formed groups is schematically presented in Figure 2, including the sample of factors. Each group (Y1, Y2, Y3, Y4) was assigned a weighting factor ri = 0.25, since the groups have the same effect on the developed indicator Y as this sample of factors.
To classify the developed aggregated indicator Y, the authors suggest using a 5-level scale, where level 1 stands for very low [0.000; 0.333] and level 5 for very high [0.667; 1.000] (Table 4).
The levels proposed in Table 4 can be described as follows:
First level: The level of socio-economic development in the examined region is low. Scientific, technological, and innovative development is practically absent; therefore, the basis for industrial digitalization has not been formed. The current state and level of the development of the construction complex in the region are considered a threat to its further socio-economic development. New construction works are practically non-existent, the flow of investment in the industry does not allow for proper development, and employment is low. Infrastructure development is virtually non-existent. BIM is not used. Regions in this group are not prepared for digitalization of the construction complex.
Second level: The level of socio-economic development in the examined region is below average compared to other Russian regions. Scientific, technological, and innovative development is present but weak. The current state and level of development of the construction complex in the region are considered satisfactory, which means that it is difficult to maintain the existing level of socio-economic development. New construction works are practically non-existent, the flow of investment in the industry does not allow for proper development, and employment is low. Infrastructure development is limited. BIM is practically not used. Regions in this group are not prepared for digitalization of the construction complex.
Third level: The level of socio-economic development in the examined region is average compared to other Russian regions. Scientific, technological, and innovative development in the region is present but average. The current state and level of development of the construction complex in the region are considered average. New construction works are present in the region, the flow of investment in the industry partially allows for industrial development, and employment is average. Infrastructure development remains at the same level. BIM is used by a minor number of construction organizations. Regions in this group can be considered as potentially prepared for digitalization of the construction complex.
Fourth level: The level of socio-economic development in the examined region is above average compared to other Russian regions. Scientific, technological, and innovative development in the region is rather high. The current state and level of development of the construction complex in the region are considered above average. New construction works are present in the region, the flow of investment in the industry allows for industrial development, and employment is above average. Infrastructure development is possible. BIM is used by a minor number of construction organizations. Regions in this group can be considered as potentially prepared for digitalization of the construction complex.
Fifth level: The level of socio-economic development in the examined region is high compared to other Russian regions. Scientific, technological, and innovative development in the region is high. The current state and level of development of the construction complex in the region are considered high. New construction works are present in the region, the flow of investment in the industry allows for industrial development, and employment is high. Infrastructure development is at a high level. BIM is used by many construction organizations. Regions in this group are considered as prepared for digitalization of the construction complex.
As an example, let us calculate the aggregate indicator Y for the city of Saint Petersburg, with a detailed algorithm for the group “Socio-economic conditions for industrial digitalization (Y1)”. We shall conduct an analysis that would allow us to form the Y1 indicator in accordance with the stages established by the methodology.
Stage 1: The linguistic variable Y1 “Socio-economic conditions for industrial digitalization in Saint Petersburg” was introduced. The resulting scale of fuzzy values of the introduced linguistic variable (Y1) was similar to the scale presented in Table 4.
Stage 2: During the calculation, we collected quantitative (statistical data [45]) and qualitative (ratings [46,51] and index [47]) factors X1…X4 for 2017, which were characterized by the following values: X1 = 0.936; X2 = 4.5%; X3 = 33; X4 = 2.
Stage 3: An interval selection from the minimum value to the maximum serves as a range of definition for the factors, sets of values, and triangular numbers of the linguistic variable (Y1) (Table 5). Note that for factor X4, the range of definition has an inverse interval, i.e., from the maximum value to the minimum, since this indicator is a rating and the maximum level of socio-economic development of the federal subject corresponds to a value of 1 and the minimum to 85.
Stage 4: When the factors were normalized using Formula (1), the following values were obtained: X1 = 0.630; X2 = −0.5; X3 = 0.245; X4 = 0.953. Table 6 contains a matrix of values for factors X1…X4 and their significance level riY1 = 0.25 (stage 5); the range of values is from −1.000 to 1.000 (see Table 5, T-numbers).
According to the aggregate indicator calculated using Formulas (2) and (3), the Y1 (Stage 6) of Saint Petersburg had a value of 0.581 in the group “Socio-economic conditions for industrial digitalization”. Comparing the obtained value with the scale presented in Table 4, it can be said that the socio-economic conditions for industrial digitalization in Saint Petersburg were at level 3 (51%) and level 4 (49%). In this regard, the resulting indicator value can be classified as approaching a confidently high level. In this study, the aggregated indicators for groups Y2, Y3, and Y4 were formed similarly to the Y1 indicator and amounted to 0.831, 0.551, and 0.760, respectively. The outcome aggregate indicator Y, which determines the level of the region’s preparedness for the digitalization of the construction complex, amounted to 0.681, making allowance for the weight coefficient ri = 0.25. Thus, according to the obtained indicator, Saint Petersburg was 91% prepared for digitalization of the construction complex at a high level and 9% prepared at a very high level.
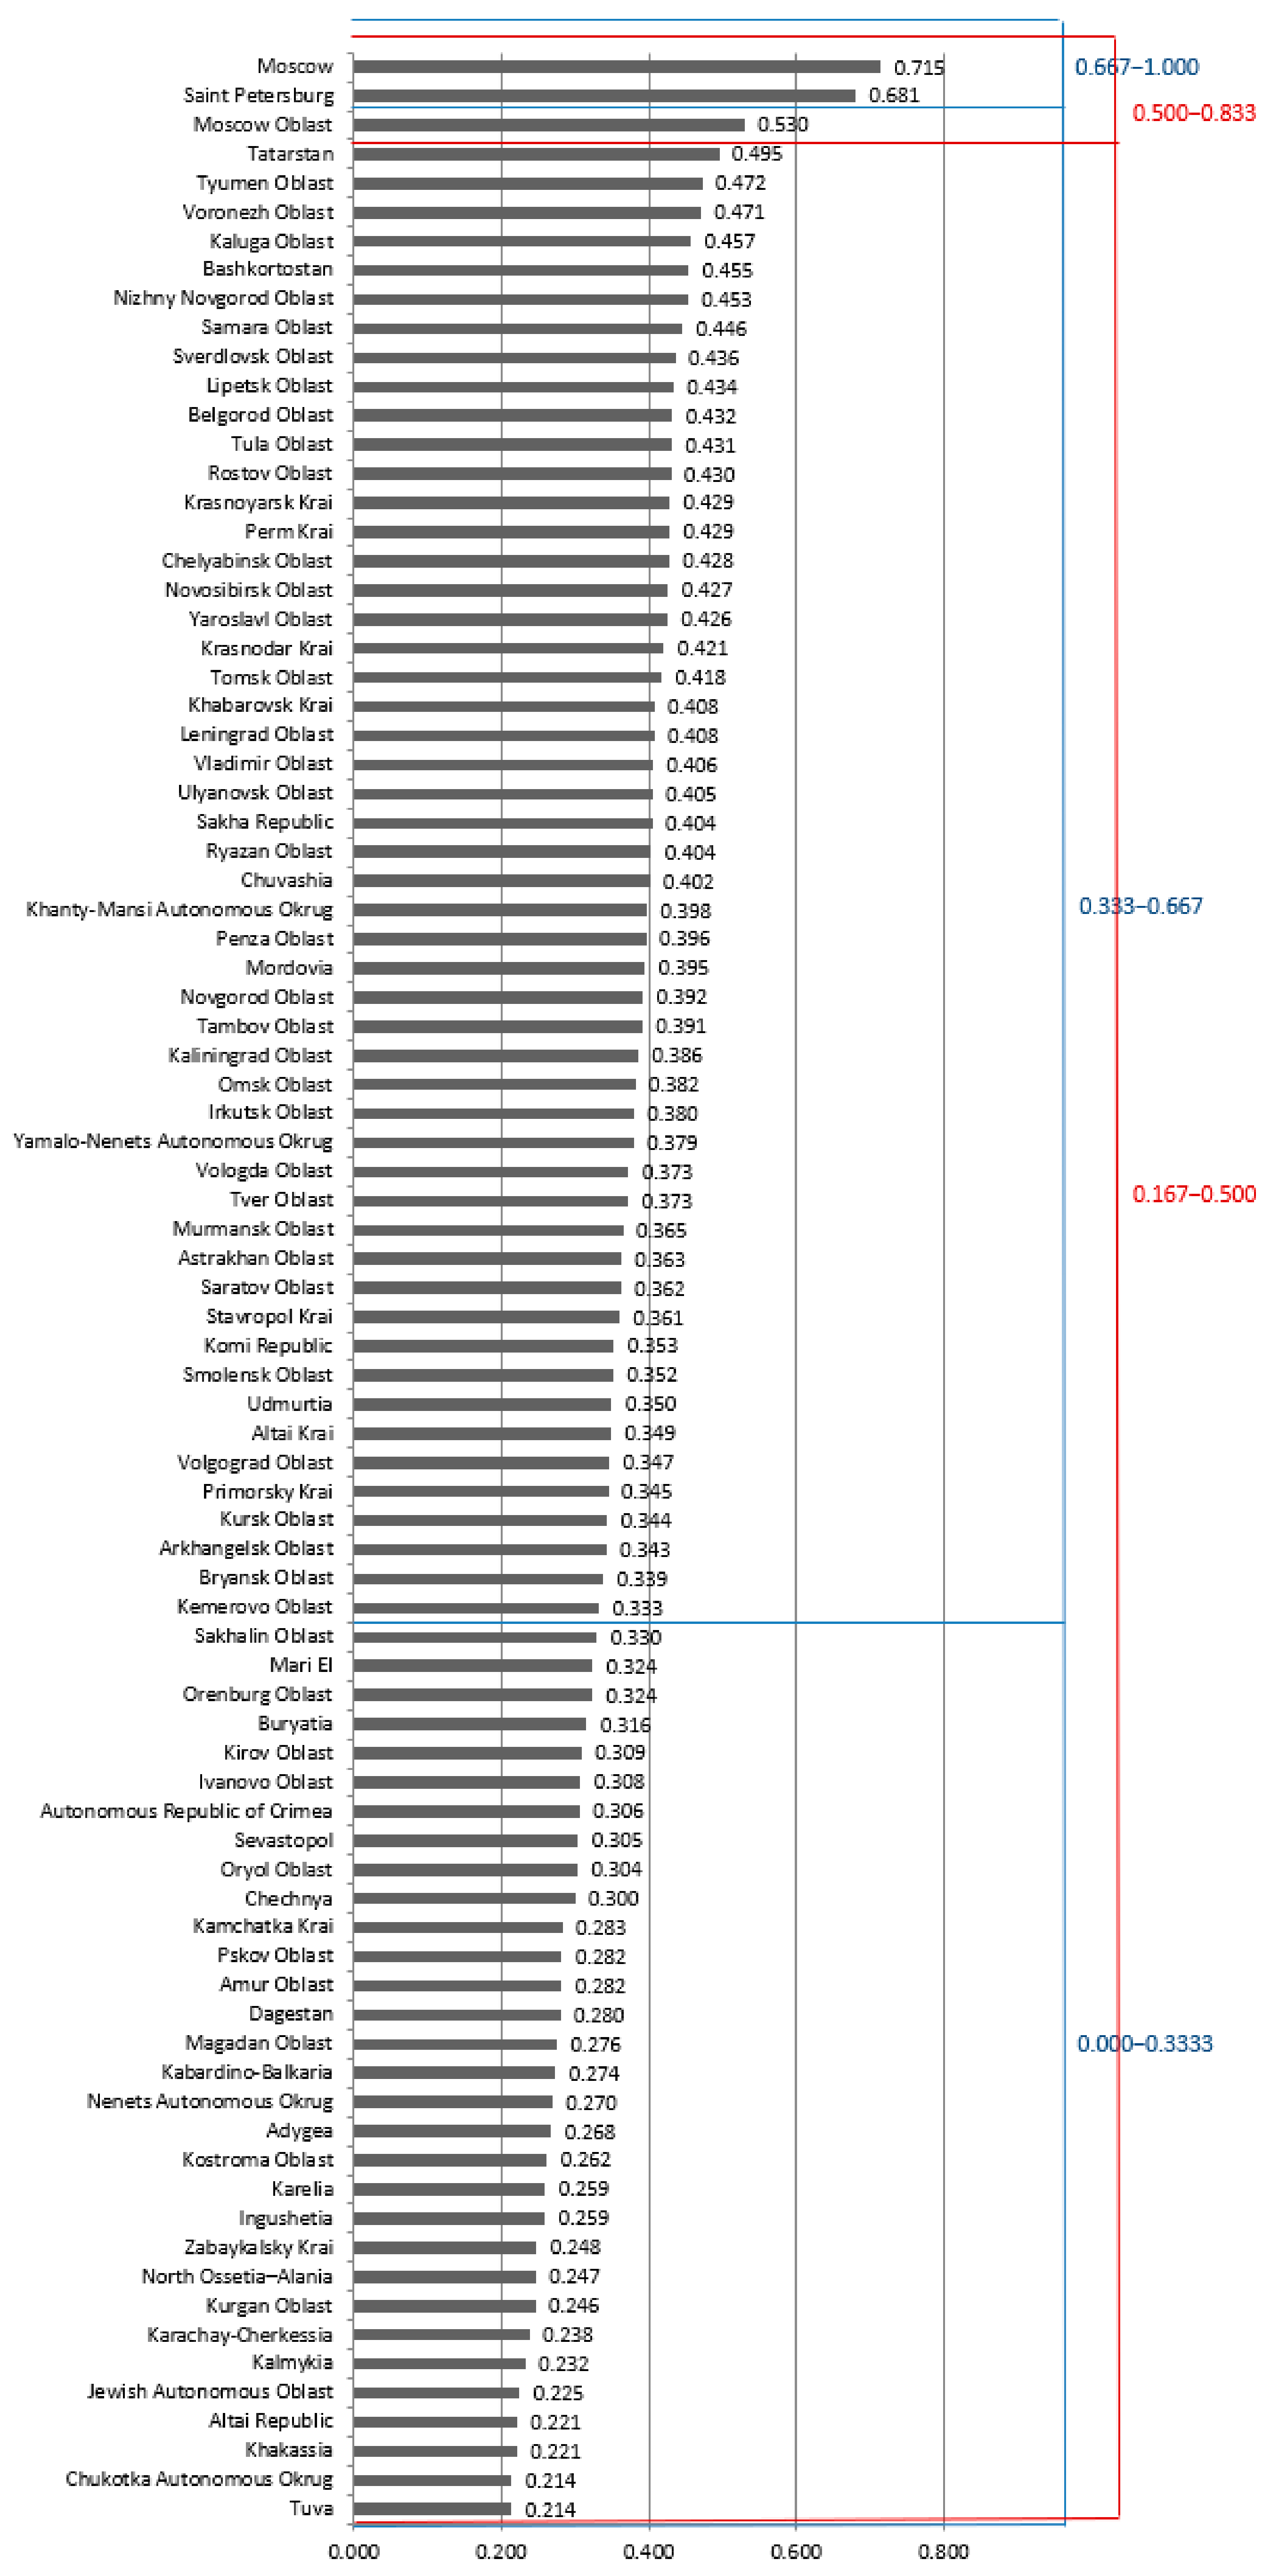
Using the above algorithm for Saint Petersburg, it is possible to obtain aggregate indicators for all Russian regions, reflecting the level of their preparedness for digitalization of the construction complex. The results can also be classified according to the given 5-level scale. Thus, let us rank Russian regions according to the indicator of “the level of preparedness for the digitalization of the construction complex” in 2017. The scale for determining the level of the indicator is presented in Figure 3 in the form of two scales—red (even levels) and blue (odd levels).
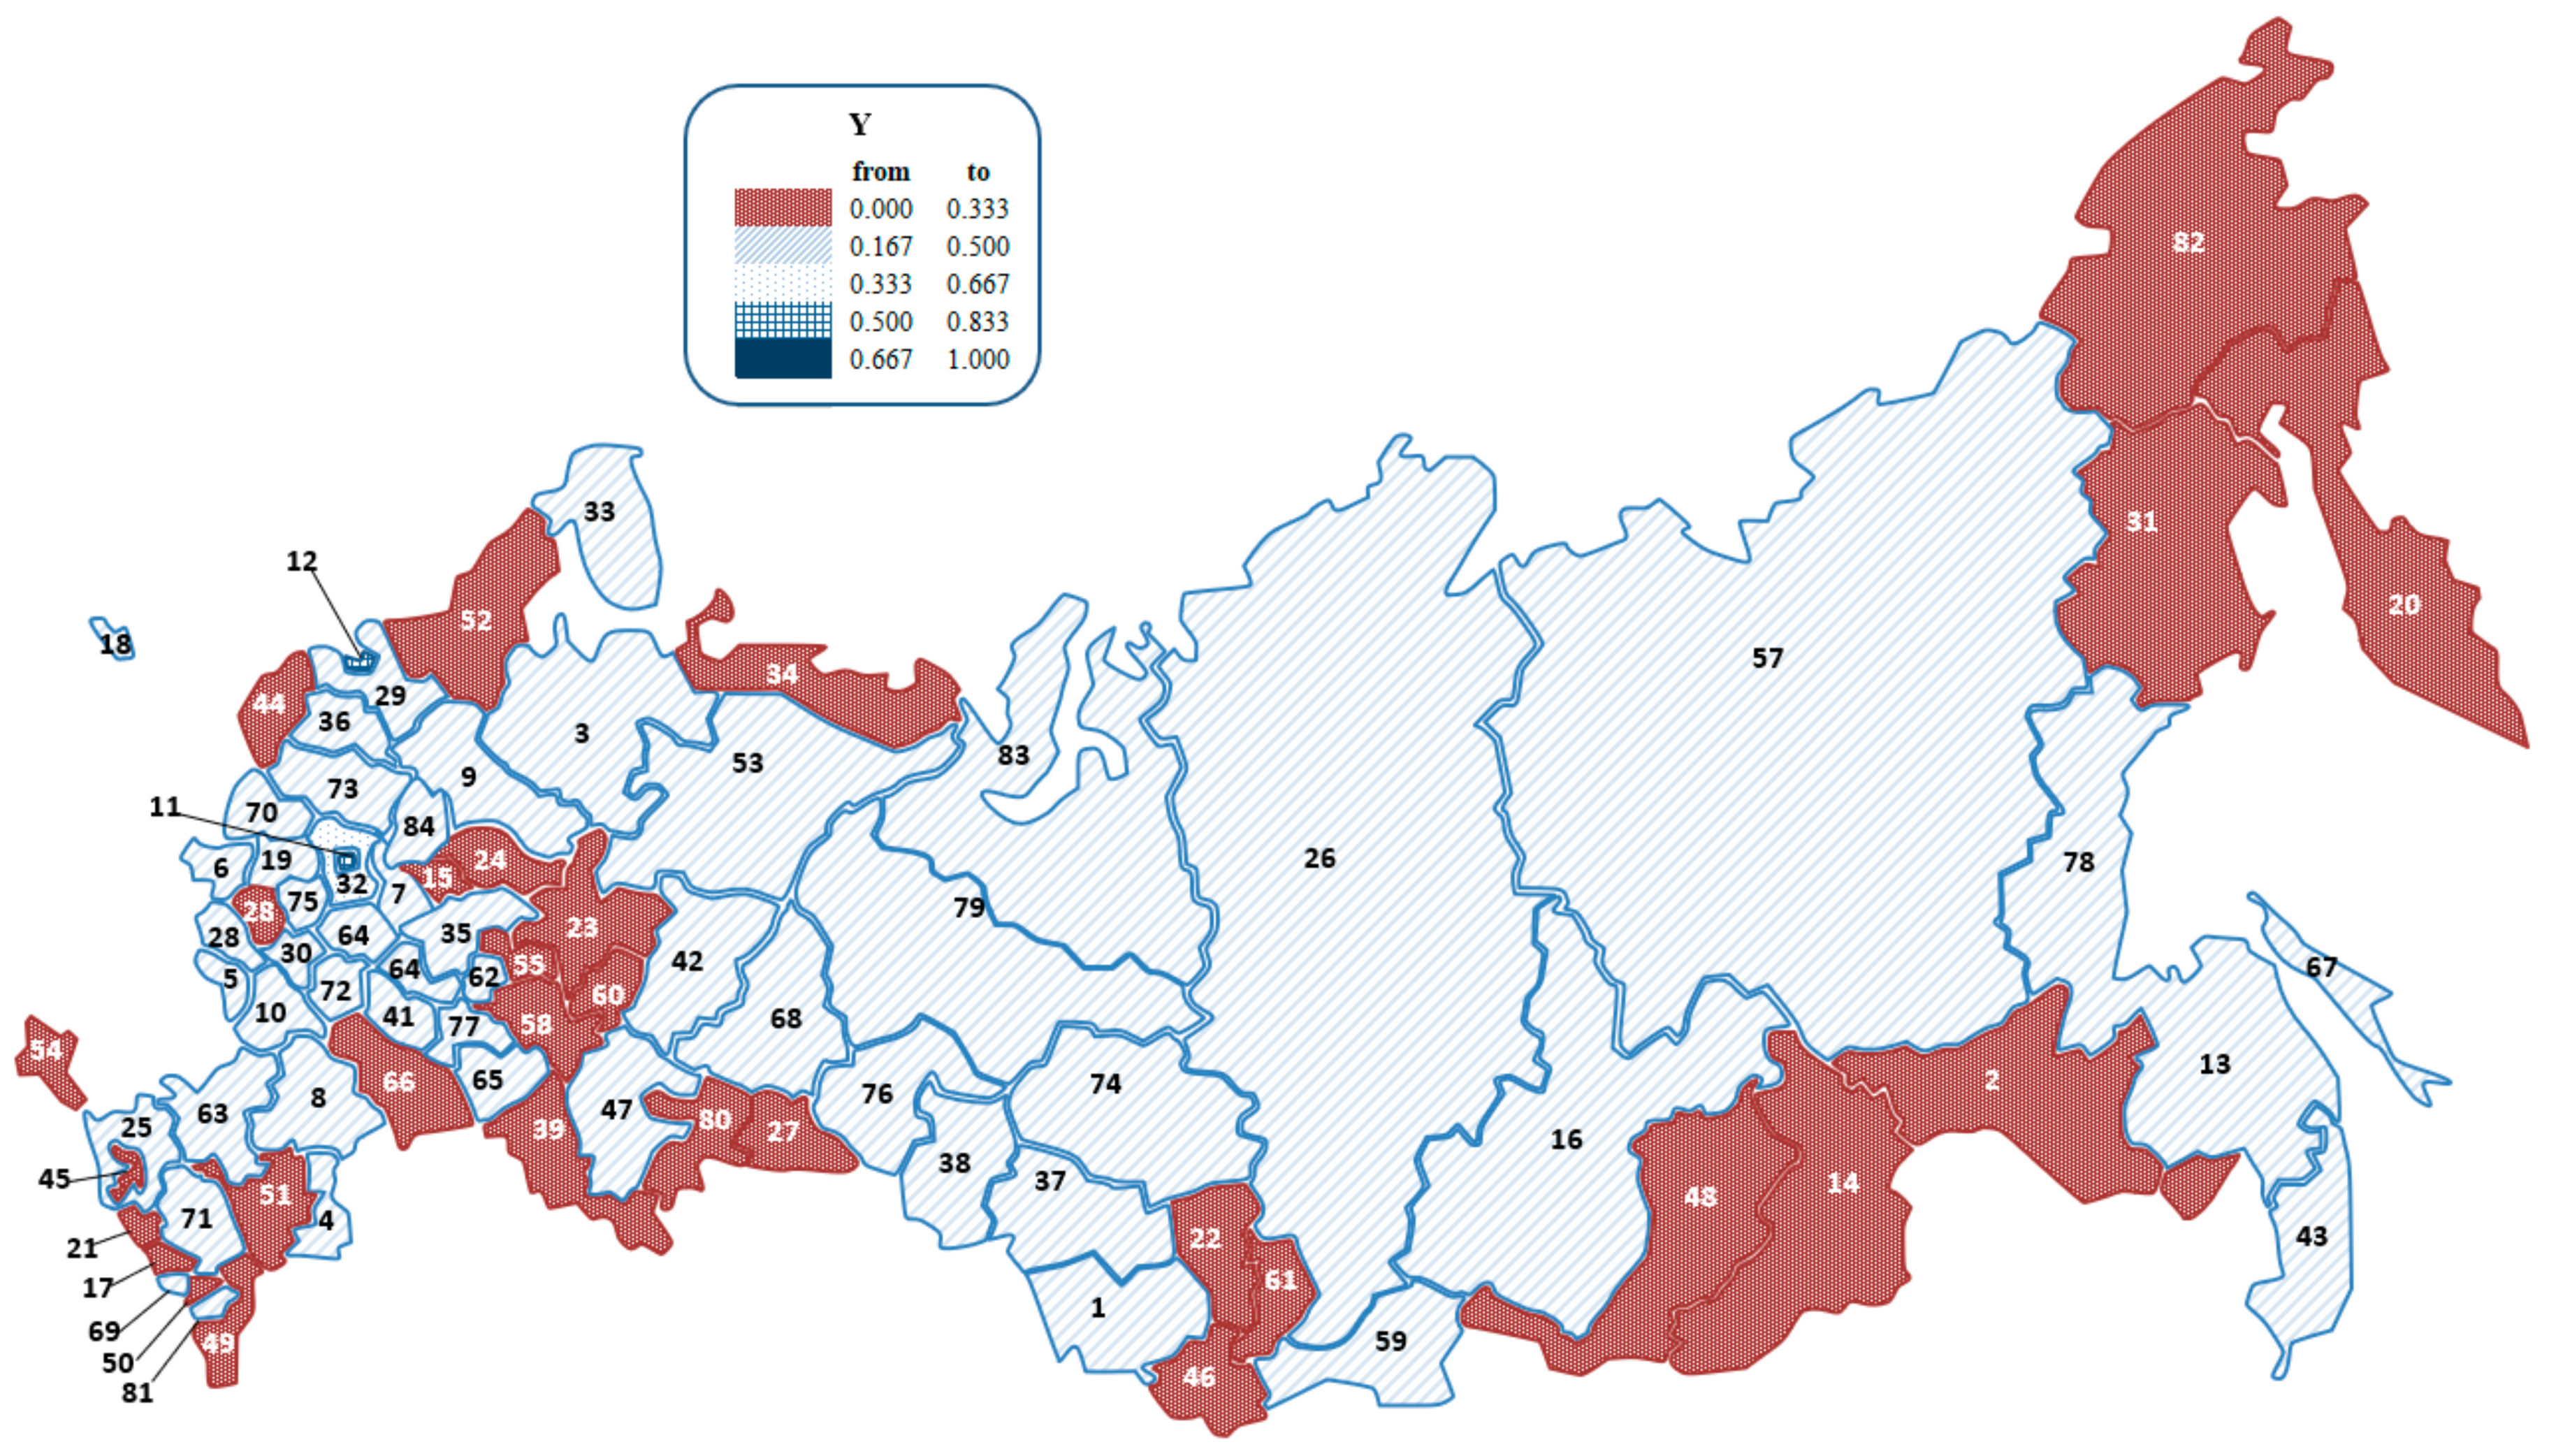
Let us now present the rating results on the map of Russia. This visualization will allow one to clearly determine the territorial distribution of regions’ readiness for digitalization of the construction complex in accordance with the specified scale of fuzzy values of the y variable. The designations of the numbering of regions for Figure 4 are presented in Appendix A.
The provided rating makes it possible to assess the degree of preparedness of a particular federal subject for industrial digitalization. After dividing Russian regions into groups, it can be seen that a very low level of preparedness was observed in 31 regions, a low level in 82 regions, an average level in 52 regions, a high level in three regions, and a very high level in two regions. As of 2017, Moscow (0.715) and Saint Petersburg (0.681) were potentially prepared for digitalization of the construction complex. The Moscow region (0.530) could also be considered as potentially prepared. All federal subjects included in the group with average development had a good potential for industrial digitalization. This includes the Republic of Tatarstan (0.495), Tyumen region (0.472), Voronezh region (0.471), Kaluga region (0.457), the Republic of Bashkortostan (0.455), Nizhny Novgorod region (0.453), Samara region (0.446), and others. Thus, two federal subjects were highly prepared for the digitalization of the construction complex, and 53 federal subjects were potentially prepared.
To assess the degree of development of a particular region according to a particular criterion, let us consider in detail the regions that were highly prepared and potentially prepared for digitalization of the construction complex in the context of the aggregate indicators of groups Y1, Y2, Y3, and Y4 (Figure 5).
According to Figure 5, the socio-economic conditions in the selected regions have a high potential for industrial digitalization and a high level of development of science and innovation. The development of the construction complex and digital technologies is mainly at an average or low level. However, given the equivalence of the examined groups, groups Y1 and Y2 complement groups Y3 and Y4.
4. Conclusions
This study on the preparedness of regions for digitalization of the construction complex is timely and important for the future development of the industry. In accordance with the Draft Decree of the Government of the Russian Federation, “On approval of the list of cases in which the formation and maintenance of an information model are mandatory”, the terms and construction projects for which the use of BIM models is mandatory are defined [53]. For example, in accordance with paragraph 1 of this document, the implementation of architectural and construction design, construction, reconstruction, major repairs, operation, and/or demolition of a health facility has an estimated cost of construction of more than 500 million rubles, financed with the involvement of the budget of the subject of the Russian Federation. An agreement on the preparation of project documentation for its construction is concluded after 1 January 2023. Based on the second paragraph of this document, the formation and maintenance of the information model of the capital construction object will become mandatory for capital construction objects of social infrastructure (objects of education and science, health, physical culture and mass sports, culture and art, social services) from 1 January 2024.
Thus, the preparation of Russian regions for the digitalization of the construction complex is approximately 2–3 years away.
It is also worth noting that such comprehensive studies on the digitalization of regions have not been conducted in Russia. However, in 2017 and 2018, the Concurator company researched the level of application of BIM technology in Russia. Although these studies are only part of the overall picture of digitalization of regions, they were also taken into account. In this regard, the study is unique for the territories of Russia and represents a significant contribution to the methodological assessment of the digital development of the construction complex of territories, research of this level is at an incipient level. The study reflects important data concerning the readiness of regions to digitalize the construction complex, focusing on which it will be possible to track the development of territories in this aspect at different levels of management.
The study conducted using the fuzzy set method made it possible to rank Russian regions, not only assessing their rank relative to other federal subjects, but also classifying regions according to the following levels: very low, low, medium, high, and very high. The hypothesis put forward by the authors was confirmed, since the study revealed both the leading regions and the outsider regions according to the formed indicator of “the level of preparedness for the digitalization of the construction complex”. It was established that Moscow and Saint Petersburg are highly prepared for the digitalization of the construction complex, and 53 Russian regions are potentially prepared. Therefore, in the future it will be possible to form a rating of Russian regions on the level of readiness for digitalization of the construction complex with a two-year lag. Further, using the Data Envelopment Analysis (DEA) shell analysis method, a quantitative assessment will be carried out to assess the quality of the constructed rating by forming the boundaries of efficiency and, against the background of four years, adjust the data to identify the most realistic picture of the development of digitalization of the construction complex in Russia.
From a practical standpoint, the examination and assessment of the preparedness of various Russian regions for digitalization of the construction industry make it possible to propose an efficient development strategy for a particular region and develop a long-term plan of measures aimed at strengthening the factors that affect the aggregate indicator with the lowest value in the sample. Systematic monitoring of changes in factors and indicators makes it possible to track deviations in parameter values and quickly respond to critical changes.
Note that the results of the study are of international interest. In the future, the proposed methodology can be shifted from the micro level to the macro level and countries can be compared. Therefore, in the near future it will be possible to form an international rating on the level of readiness of countries for digitalization of the construction complex. Based on the aspects of rating formation, the methodological approach has significant differences from Marco BIM, which emphasizes the relevance and scientific significance of the research at the international level.
Also, the rating methodology proposed by the authors is flexible. According to the proposed rating development algorithm, it is possible to rank by other aggregated indicators in accordance with the selection of groups of factors. In this connection, it will be possible to scale the methodology to other complexes and sectors of the economy.
The conclusions drawn in this study are not final. The next step in preparing regions for digitalization is a detailed study of each region, identifying weaknesses and strengths, and developing short-term and long-term development strategies, in accordance with the current legislation of the country.
Author Contributions
Conceptualization, E.T., M.R., and I.R.; methodology, E.T.; validation, E.T., M.R., and I.R.; formal analysis, E.T., M.R., and I.R.; investigation, E.T., M.R., and I.R.; writing—Original draft preparation, E.T., and M.R.; writing—Review and editing, E.T., M.R., and I.R.; visualization, E.T.; project administration, I.R.; funding acquisition, I.R. All authors have read and agreed to the published version of the manuscript.
Funding
This research work was supported by the Academic Excellence Project 5-100 proposed by Peter the Great St. Petersburg Polytechnic University.
Acknowledgments
The authors express their gratitude to Concurator for providing reports on the survey of the level of BIM application in Russia for 2017 and 2018. For assistance in the English-language editing of the MDPI article.
Conflicts of Interest
The authors declare no conflict of interest. The funders had no role in the design of the study; in the collection, analyses, or interpretation of data; in the writing of the manuscript, or in the decision to publish the results.
Appendix A
Region numbering for Figure 4: (1) Altai region; (2) Amur region; (3) Arkhangelsk region; (4) Astrakhan region; (5) Belgorod region; (6) Bryansk region; (7) Vladimir region; (8) Volgograd region; (9) Vologda region; (10) Voronezh region; (11) Moscow; (12) Saint Petersburg; (13) Jewish autonomous region; (14) Zabaikalsky region; (15) Ivanovo region; (16) Irkutsk region; (17) Kabardino-Balkarian Republic; (18) Kaliningrad region; (19) Kaluga region; (20) Kamchatka region; (21) Karachay-Cherkess Republic; (22) Kemerovo region; (23) Kirovsk region; (24) Kostroma region; (25) Krasnodar region; (26) Krasnoyarsk region; (27) Kurgan region; (28) Kursk region; (29) Leningrad region; (30) Lipetsk region; (31) Magadan region; (32) Moscow region; (33) Murmansk region; (34) Nenets autonomous district; (35) Nizhny Novgorod region; (36) Novgorod region; (37) Novosibirsk region; (38) Omsk region; (39) Orenburg region; (40) Oryol region; (41) Penza region; (42) Perm region; (43) Primorsky region; (44) Pskov region; (45) Republic of Adygea; (46) Altai Republic; (47) Republic of Bashkortostan; (48) Republic of Buryatia; (49) Republic of Dagestan; (50) Republic of Ingushetia; (51) Republic of Kalmykia; (52) Republic of Karelia; (53) Komi Republic; (54) Republic of Crimea; (55) Mari El Republic; (56) Republic of Mordovia; (57) Republic of Sakha (Yakutia); (58) Republic of Tatarstan; (59) Tyva Republic; (60) Udmurt Republic; (61) Republic of Khakassia; (62) Chuvash Republic; (63) Rostov region; (64) Ryazan region; (65) Samara region; (66) Saratov region; (67) Sakhalin region; (68) Sverdlovsk region; (69) Republic of North Ossetia—Alania; (70) Smolensk region; (71) Stavropol region; (72) Tambov region; (73) Tver region; (74) Tomsk region; (75) Tula region; (76) Tyumen region without autonomous districts; (77) Ulyanovsk region; (78) Khabarovsk region; (79) Khanty-Mansiysk autonomous district—Yugra; (80) Chelyabinsk region; (81) Chechen Republic; (82) Chukotka autonomous district; (83) Yamalo-Nenets autonomous district; (84) Yaroslavl region.
References
- Russian Architecture and Construction Encyclopedia. Available online: http://gosstroy-vniintpi.ru/rase.htm (accessed on 20 May 2020).
- Kozlov, A.; Gutman, S.; Tereshko, E. Analysis of the Industry and Entrepreneurship component of the Murmansk region construction complex strategic chart. In E3S Web Conference; EDP Sciences: Ulis, France, 2019; Volume 91, p. 05011. [Google Scholar]
- David, O.; Russotto, F.-X.; Simoes, M.D.S.; Measson, Y. Collision avoidance, virtual guides and advanced supervisory control teleoperation techniques for high-tech construction: Framework design. Autom. Constr. 2014, 8, 63–72. [Google Scholar] [CrossRef]
- Cai, S.; Ma, Z.; Skibniewski, M.J.; Bao, S. Construction automation and robotics for high-rise buildings over the past decades: A comprehensive review. Adv. Eng. Inform. 2019, 10, 100989. [Google Scholar] [CrossRef]
- Wu, P.; Wang, J.; Wang, X. A critical review of the use of 3-D printing in the construction industry. Autom. Constr. 2016, 8, 21–31. [Google Scholar] [CrossRef] [Green Version]
- Strategy for the Development of the Information Society in the Russian Federation for 2017–2030, Approved by Presidential Decree No. 203 of 9 May 2017. Available online: https://www.prlib.ru/en/node/681488 (accessed on 25 July 2020).
- Digital Economy of the Russian Federation–Program Approved by the Order of the Government of the Russian Federation of 28 July 2017 1632-r. Available online: http://static.government.ru/media/files/9gFM4FHj4PsB79I5v7yLVuPgu4bvR7M0.pdf (accessed on 25 July 2020).
- Heigermoser, D.; de Soto, B.G.; Abbott, E.L.S.; Chua, D.K.H. BIM-based Last Planner System tool for improving construction project management. Autom. Constr. 2019, 104, 246–254. [Google Scholar] [CrossRef]
- Oraee, M.; Hosseini, M.R.; Edwards, D.J.; Li, H.; Papadonikolaki, E.; Cao, D. Collaboration barriers in BIM-based construction networks: A conceptual model. Int. J. Proj. Manag. 2019, 37, 839–854. [Google Scholar] [CrossRef]
- Al-Saeed, Y.; Edwards, D.J.; Scaysbrook, S. Automating construction manufacturing procedures using BIM digital objects (BDOs). Constr. Innov. 2020, 3, 345–377. [Google Scholar] [CrossRef]
- Chen, K.; Lu, W. Bridging BIM and building (BBB) for information management in construction. Eng. Constr. Archit. Manag. 2019, 7, 1518–1532. [Google Scholar] [CrossRef]
- Chan, D.W.; Olawumi, T.O.; Ho, A.M. Perceived benefits of and barriers to Building Information Modelling (BIM) implementation in construction: The case of Hong Kong. J. Build. Eng. 2019, 25, 100764. [Google Scholar] [CrossRef]
- Level of BIM Application in Russia in 2017. Research Report. Available online: http://concurator.ru/information/bim_report/ (accessed on 25 May 2020).
- Glukhov, A.P. Influence of resistance to digitalization on the diffusion of digital platform solutions. Tomsk State Univ. J. Econ. 2019, 48, 57–82. [Google Scholar] [CrossRef] [PubMed]
- Romanovich, M.; Ermakov, A.; Mukhamedzhanova, O. Scheduling on the basis of the research of dependences among the construction process parameters. In IOP Conference Series: Earth and Environmental Science [Electronic Resource]; IOP Publishing Ltd.: Bristol, UK, 2017; p. 012212. [Google Scholar] [CrossRef]
- Aziz, D.; Nawawi, A.H.; Ariff, R.M. ICT Evolution in Facilities Management (FM): Building Information Modelling (BIM) as the Latest Technology. Procedia Soc. Behav. Sci. 2016, 234, 363–371. [Google Scholar] [CrossRef] [Green Version]
- Dinga, L.Y.; Zhonga, B.T.; Wub, S.; Luoa, H.B. Construction risk knowledge management in BIM using ontology and semantic web technology. Saf. Sci. 2016, 87, 202–213. [Google Scholar] [CrossRef] [Green Version]
- Parka, J.W.; Chenb, J.; Choa, Y.K. Self-corrective knowledge-based hybrid tracking system using BIM and multimodal sensors. Adv. Eng. Inform. 2017, 32, 126–138. [Google Scholar] [CrossRef] [Green Version]
- Zoua, Y.; Kiviniemib, A.; Jonesa, S.W. A review of risk management through BIM and BIM-related technologies. Saf. Sci. 2016, 81, 78–83. [Google Scholar] [CrossRef]
- Valitova, I.; Trofimova, T.; Simankina, T.; Stein, E. Risk assessment related to the choice of contractors performing the job. In MATEC Web of Conferences Cep; International Science Conference SPbWOSCE-2017 Business Technologies for Sustainable Urban Development; EDP Sciences: Ulis, France, 2018; p. 01068. [Google Scholar]
- Pykhtin, K.; Simankina, T.; Sharmanov, V.; Kopytova, A. Risk-based approach in valuation of workplace injury rate for transportation and construction industry. In IOP Conference Series: Earth and Environmental Science; IOP Publishing Ltd.: Bristol, UK, 2017; Volume 90, p. 012065. [Google Scholar] [CrossRef] [Green Version]
- Sigalov, K.; Konig, M. Recognition of process patterns for BIM-based construction schedules. Adv. Eng. Inform. 2017, 31, 45–48. [Google Scholar] [CrossRef]
- Bradley, H.; Lark, R.; Dunn, S. BIM for infrastructure: An overall review and constructor perspective. Autom. Constr. 2016, 71, 139–152. [Google Scholar] [CrossRef]
- Wetzel, E.M.; Thabet, W.Y. The use of a BIM-based framework to support safe facility management processes. Autom. Constr. 2015, 60, 12–24. [Google Scholar] [CrossRef] [Green Version]
- Kang, T.W.; Hong, C.H. A study on software architecture for effective BIM/GIS-based facility management data integration. Autom. Constr. 2015, 54, 25–38. [Google Scholar] [CrossRef]
- Zhang, S.; Teizer, J.; Lee, J.-K.; Eastman, C.M.; Venugopal, M. Building Information Modeling (BIM) and Safety: Automatic Safety Checking of Construction Models and Schedules. Autom. Constr. 2013, 29, 183–195. [Google Scholar] [CrossRef]
- Benjaoran, V.; Bhokha, S. An integrated safety management with construction management using 4D CAD model. Saf. Sci. 2010, 48, 395–403. [Google Scholar] [CrossRef]
- Romanovich, M.A.; Sakhtereva, M.I. Specifics of creating digital twins of underground complexes (metro stations). In Proceedings of the BIM in Construction & Architecture Proceedings of III International Conference BIMAC 2020, Saint Petersburg, Russia, 28–30 October 2020; pp. 152–160. [Google Scholar]
- Vakhrusheva, S.; Martynenko, E.; Braila, N.; Kisel, T. Development of a cultural heritage object BIM model. In IOP Conference Series: Earth and Environmental Science; IOP Publishing Ltd.: Bristol, UK, 2017; Volume 90. [Google Scholar] [CrossRef]
- Romanovich, M.A.; Vsevolozhskaya, V.G.; Kuzminykh, A.R.; Popova, E.M.; Pertseva, A.E. Experience in creating a digital model of a building as part of the international educational program on the BIM 360 platform. In Proceedings of the BIM in Construction & Architecture Proceedings of III International Conference BIMAC 2020, Saint Petersburg, Russia, 28–30 October 2020; pp. 362–371. [Google Scholar]
- Balakina, A.; Simankina, T.; Lukinov, V. 4D modeling in high-rise construction. In E3S Web of Conferences; EDP Sciences: Ulis, France, 2018; Volume 33, p. 03044. [Google Scholar] [CrossRef]
- Sharmanov, V.V.; Simankina, T.L.; Mamaev, A.E. BIM in the assessment of labor protection. Mag. Civ. Eng. 2017, 1, 77–88. [Google Scholar]
- Afonasova, M.A.; Panfilova, E.E.; Galichkina, M.A.; Ślusarczyk, B. Digitalization in economy and innovation: The effect on social and economic processes. Pol. J. Manag. Stud. 2019, 2, 22–32. [Google Scholar]
- Bejtkovský, J.; Rózsa, Z.; Mulyaningsih, H.D. A phenomenon of digitalization and e-recruitment in business environment. Pol. J. Manag. Stud. 2018, 18, 58–68. [Google Scholar] [CrossRef]
- Succar, B.; Kassem, M. Macro-BIM adoption: Conceptual structures. Autom. Constr. 2015, 57, 64–79. [Google Scholar] [CrossRef] [Green Version]
- Kassem, M.; Succar, B. Macro-BIM adoption: Comparative market analysis. Autom. Constr. 2017, 81, 286–299. [Google Scholar] [CrossRef]
- Talapov, V.V. BIM Technology: The Essence and Features of Building Information Modeling Implementation; DMK Press: Moscow, Russia, 2015; p. 410. [Google Scholar]
- Google Trends. Analysis. Available online: https://trends.google.com (accessed on 29 May 2020).
- Zadeh, L.A. Fuzzy sets. Inf. Control 1965, 8, 338–353. [Google Scholar] [CrossRef] [Green Version]
- Klir, G.J.; Yuan, B. Fuzzy sets and fuzzy logic. In Theory and Applications; Prentice Hall: New York, NY, USA, 1995; 574p. [Google Scholar]
- Lee, K.H. First Course on Fuzzy Theory and Applications and Developments were Proposed; Springer: Berlin/Heidelberg, Germany, 2005; p. 336. [Google Scholar]
- Weimin, H.; Leping, S. Analysis of the Factors Influencing the Development of Regional Economy Based on Research into Rough Set and Entropy Theory. In Proceedings of the International Conference on Wireless Communications, Networking and Mobile Computing, WiCOM, Dalian, China, 12–14 October 2008; pp. 1–4. [Google Scholar]
- Baruah, H.K. The Theory of Fuzzy Sets: Beliefs and Realities. Int. J. Energy Inf. Commun. 2011, 2, 1–22. [Google Scholar]
- Reyna, V.F. A new intuitionism: Meaning, memory, and development in Fuzzy–Trace Theory. Judgm. Decis. Mak. 2012, 7, 332–359. [Google Scholar]
- Federal State Statistics Service. Russian Regions. Socio-Economic Indicators for 2019. Available online: https://gks.ru/bgd/regl/b19_14p/Main.htm (accessed on 22 May 2020).
- Digital Economy Indicators 2019. Statistical Bulletin. Available online: https://www.hse.ru/data/2019/06/25/1490054019/ice20/19.pdf (accessed on 20 May 2020).
- RIA Rating. Rating of Socio-Economic Situation in Regions–2018. Available online: https://riarating.ru/infografika/20180523/630091878.html (accessed on 22 May 2020).
- RIA Rating. Level of Development of Science and Technology in Russian Regions–2018. Available online: https://riarating.ru/infografika/20181017/630109152.html (accessed on 22 May 2020).
- Russian Regional Innovation Scoreboard. Issue 6. Available online: https://issek.hse.ru/mirror/pubs/share/315338500 (accessed on 22 May 2020).
- Rating of Innovative Regions of Russia—2017. Available online: http://i-regions.org/images/files/airr17.pdf (accessed on 22 May 2020).
- Human Development Index 2017. Analytical Center for the Government of the Russian Federation. Available online: https://ac.gov.ru/uploads/2-Publications/karta_HDI_2017.pdf (accessed on 20 May 2020).
- All-Russian Research. Digital Literacy Index 2017. Available online: https://ict.moscow/static/digital_educ.pdf (accessed on 22 May 2020).
- On Approval of the List of Cases in Which the Formation and Maintenance of an Information Model are Mandatory. Available online: http://http://docs.cntd.ru/document/563787932/ (accessed on 13 September 2020).
Figure 1.
Relevance of Building Information Modeling (BIM) in Russia: (a) for the search query “BIM” in Google; (b) for the search query “BIM technology” in Google.
Figure 1.
Relevance of Building Information Modeling (BIM) in Russia: (a) for the search query “BIM” in Google; (b) for the search query “BIM technology” in Google.
Figure 2.
Formation of an aggregate indicator for assessing the level of preparedness of the region for digitalization of the construction complex.
Figure 2.
Formation of an aggregate indicator for assessing the level of preparedness of the region for digitalization of the construction complex.
Figure 3.
Rating of regions according to aggregate indicator Y “the level of preparedness of the region for digitalization of the construction complex”, 2017.
Figure 3.
Rating of regions according to aggregate indicator Y “the level of preparedness of the region for digitalization of the construction complex”, 2017.

Figure 4.
Distribution of the indicator “the level of readiness of the region for digitalization of the construction complex” on a geographical map of Russia, 2017.
Figure 4.
Distribution of the indicator “the level of readiness of the region for digitalization of the construction complex” on a geographical map of Russia, 2017.

Figure 5.
Russian regions according to the aggregate indicators of groups Y1, Y2, Y3, and Y4.


Table 1.
Piecewise linear membership functions using fuzzy set theory.
| Function Type | Function | Property |
|---|---|---|
| I | 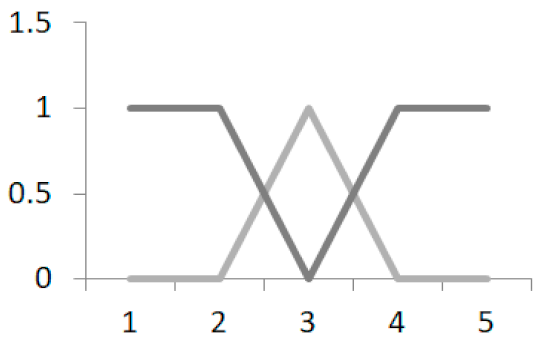 | where a, b, c are some numeric parameters that take arbitrary real values and are ordered by the relation . |
| II | 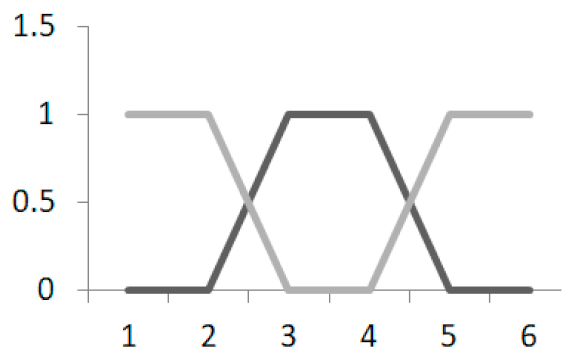 | where a, b, c, d are some numeric parameters that take arbitrary real values and are ordered by the relation . |
| III | 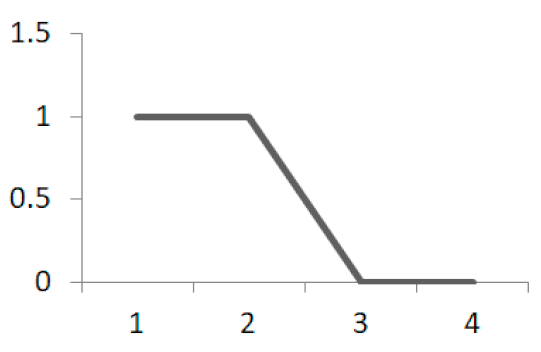 | where a and b are some numeric parameters that take arbitrary real values and are ordered by the relation . |
| IV | 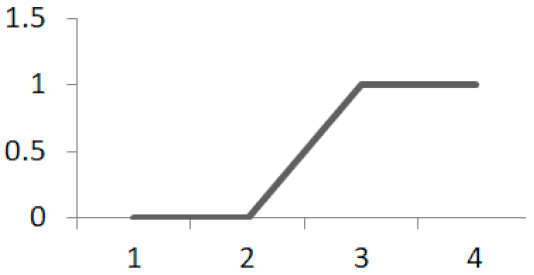 | where a and b are some numeric parameters that take arbitrary real values and are ordered by the relation . |
Notation: I—triangular membership function; II—trapezoidal membership function; III—Z-shaped membership function; IV—S-shaped membership function.
Table 2.
Classification of the level of factors.
| Range of Y Values | Level Classification | Membership Function |
|---|---|---|
| −1.000 ≤ Xn ≤ −0.667 | X1 (very low) | 1 |
| −0.667 < Xn < −0.333 | X1 (very low) | |
| X2 (low) | ||
| −0.333 ≤ Xn < 0.000 | X2 (low) | |
| X3 (average) | ||
| 0.000 ≤ Xn < 0.333 | X3 (average) | |
| X4 (high) | ||
| 0.333 ≤ Xn < 0.667 | X4 (high) | |
| X5 (very high) | ||
| 0.667 ≤ Xn ≤ 1.000 | X5 (very high) | 1 |
Table 3.
Classification of the risk profile level.
| Range of Y Values | Level Classification | Membership Function |
| 0.000 ≤ Y ≤ −0.167 | Y1 (very low) | 1 |
| 0.167 < Y < 0.333 | Y1 (very low) | |
| Y2 (low) | ||
| 0.333 ≤ Y < 0.500 | Y2 (low) | |
| Y3 (average) | ||
| 0.500 ≤ Y < 0.667 | Y3 (average) | |
| Y4 (high) | ||
| 0.667 ≤ Y < 0.833 | Y4 (high) | |
| Y5 (very high) | ||
| 0.833 ≤ Y ≤ 1.000 | Y5 (very high) | 1 |
Table 4.
Recommended fuzzy Y scale.
| No. | Set of Values | Level | Name |
|---|---|---|---|
| 1 | 0.000–0.333 | Very low | Weak preparedness of the region for digitalization of the construction complex, more than 50% lower than the Russian average. |
| 2 | 0.167–0.500 | Low | The region’s preparedness for digitalization of the construction complex is more than 25% lower than the Russian average. |
| 3 | 0.333–0.667 | Average | Average level of preparedness of the region for digitalization of the construction complex. |
| 4 | 0.500–0.833 | High | The region’s preparedness for digitalization of the construction complex is more than 25% higher than the Russian average. |
| 5 | 0.667–1.000 | Very high | High preparedness of the region for digitalization of the construction complex, more than 50% higher than the Russian average. |
Table 5.
Range of definition for the factors, sets of values, and triangular numbers of Y1 indicators for Saint Petersburg.
Table 5.
Range of definition for the factors, sets of values, and triangular numbers of Y1 indicators for Saint Petersburg.
| Scale | T Numbers | X1 | X2 | X3 | X4 |
|---|---|---|---|---|---|
| Very low | −1.000 | 0.80 | 1.90 | 18.00 | 85.00 |
| −0.667 | 0.83 | 4.27 | 20.83 | 71.00 | |
| −0.333 | 0.85 | 6.63 | 23.67 | 57.00 | |
| Low | −0.667 | 0.83 | 4.27 | 20.83 | 71.00 |
| −0.333 | 0.85 | 6.63 | 23.67 | 57.00 | |
| 0.000 | 0.88 | 9.00 | 26.50 | 43.00 | |
| Average | −0.333 | 0.85 | 6.63 | 23.67 | 57.00 |
| 0.000 | 0.88 | 9.00 | 26.50 | 43.00 | |
| 0.333 | 0.91 | 11.37 | 29.33 | 29.00 | |
| High | 0.000 | 0.88 | 9.00 | 26.50 | 43.00 |
| 0.333 | 0.91 | 11.37 | 29.33 | 29.00 | |
| 0.667 | 0.93 | 13.73 | 32.17 | 15.00 | |
| Very high | 0.333 | 0.91 | 11.37 | 29.33 | 29.00 |
| 0.667 | 0.93 | 13.73 | 32.17 | 15.00 | |
| 1.000 | 0.96 | 16.10 | 35.00 | 1.00 |
Table 6.
Matrix of values for the factors of linguistic variable Y1 for Saint Petersburg.
| Factor Name | Subset Scale | Level of Significance riY1 | ||||
|---|---|---|---|---|---|---|
| λ1(xi) | λ2(xi) | λ3(xi) | λ4(xi) | λ5(xi) | ||
| X1 | 0.405 | 0.595 | 0.250 | |||
| X2 | 0.250 | 0.750 | 0.250 | |||
| X3 | 0.132 | 0.868 | 0.250 | |||
| X4 | 1.000 | 0.250 | ||||
Publisher’s Note: MDPI stays neutral with regard to jurisdictional claims in published maps and institutional affiliations. |
© 2020 by the authors. Licensee MDPI, Basel, Switzerland. This article is an open access article distributed under the terms and conditions of the Creative Commons Attribution (CC BY) license (http://creativecommons.org/licenses/by/4.0/).
Share and Cite
MDPI and ACS Style
Tereshko, E.; Romanovich, M.; Rudskaya, I. Readiness of Regions for Digitalization of the Construction Complex. J. Open Innov. Technol. Mark. Complex. 2021, 7, 2. https://doi.org/10.3390/joitmc7010002
AMA Style
Tereshko E, Romanovich M, Rudskaya I. Readiness of Regions for Digitalization of the Construction Complex. Journal of Open Innovation: Technology, Market, and Complexity. 2021; 7(1):2. https://doi.org/10.3390/joitmc7010002
Chicago/Turabian StyleTereshko, Ekaterina, Marina Romanovich, and Irina Rudskaya. 2021. "Readiness of Regions for Digitalization of the Construction Complex" Journal of Open Innovation: Technology, Market, and Complexity 7, no. 1: 2. https://doi.org/10.3390/joitmc7010002