Management Practice in Small and Medium-Sized Enterprises: Problems and Solutions from the Perspective of Open Innovation


Abstract
:1. Introduction
2. Materials and Methodology
2.1. Development of the Governance Model for SME Self-Assessment
- Systematic approach: the governance model was based on a systemic approach, and contained a definite and finite number of interrelated elements that provided a holistic view of the company;
- The principle of causes and effects: the model reflected the relationship between the approach established in the company and the outcome;
- Simplicity and transparency: the model should be simple and transparent enough to be understandable by and relevant to people without a special management education;
- Quantifiable evaluation: the governance model should be designed so that each element of the model can be quantified, regardless of the industry and the business specifics of particular enterprise.
2.2. Self-Assessment Process
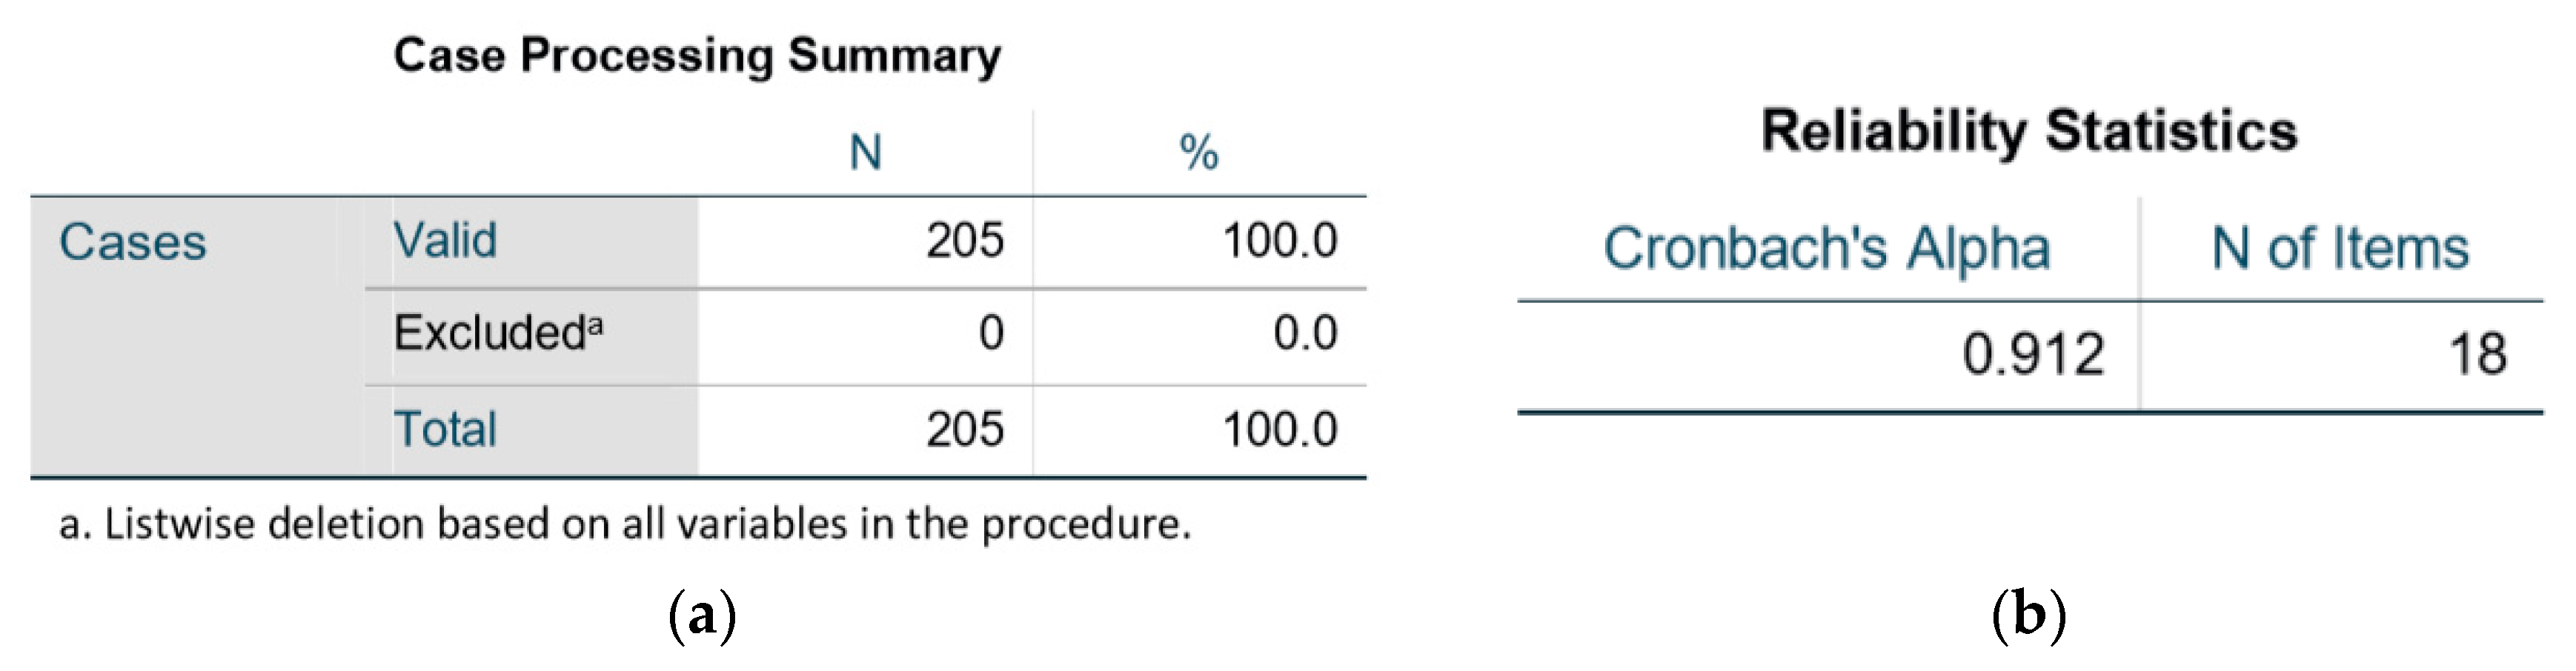
2.3. Data Analysis and Interpreation
3. Results
3.1. Distribution of Respondents by Company Size
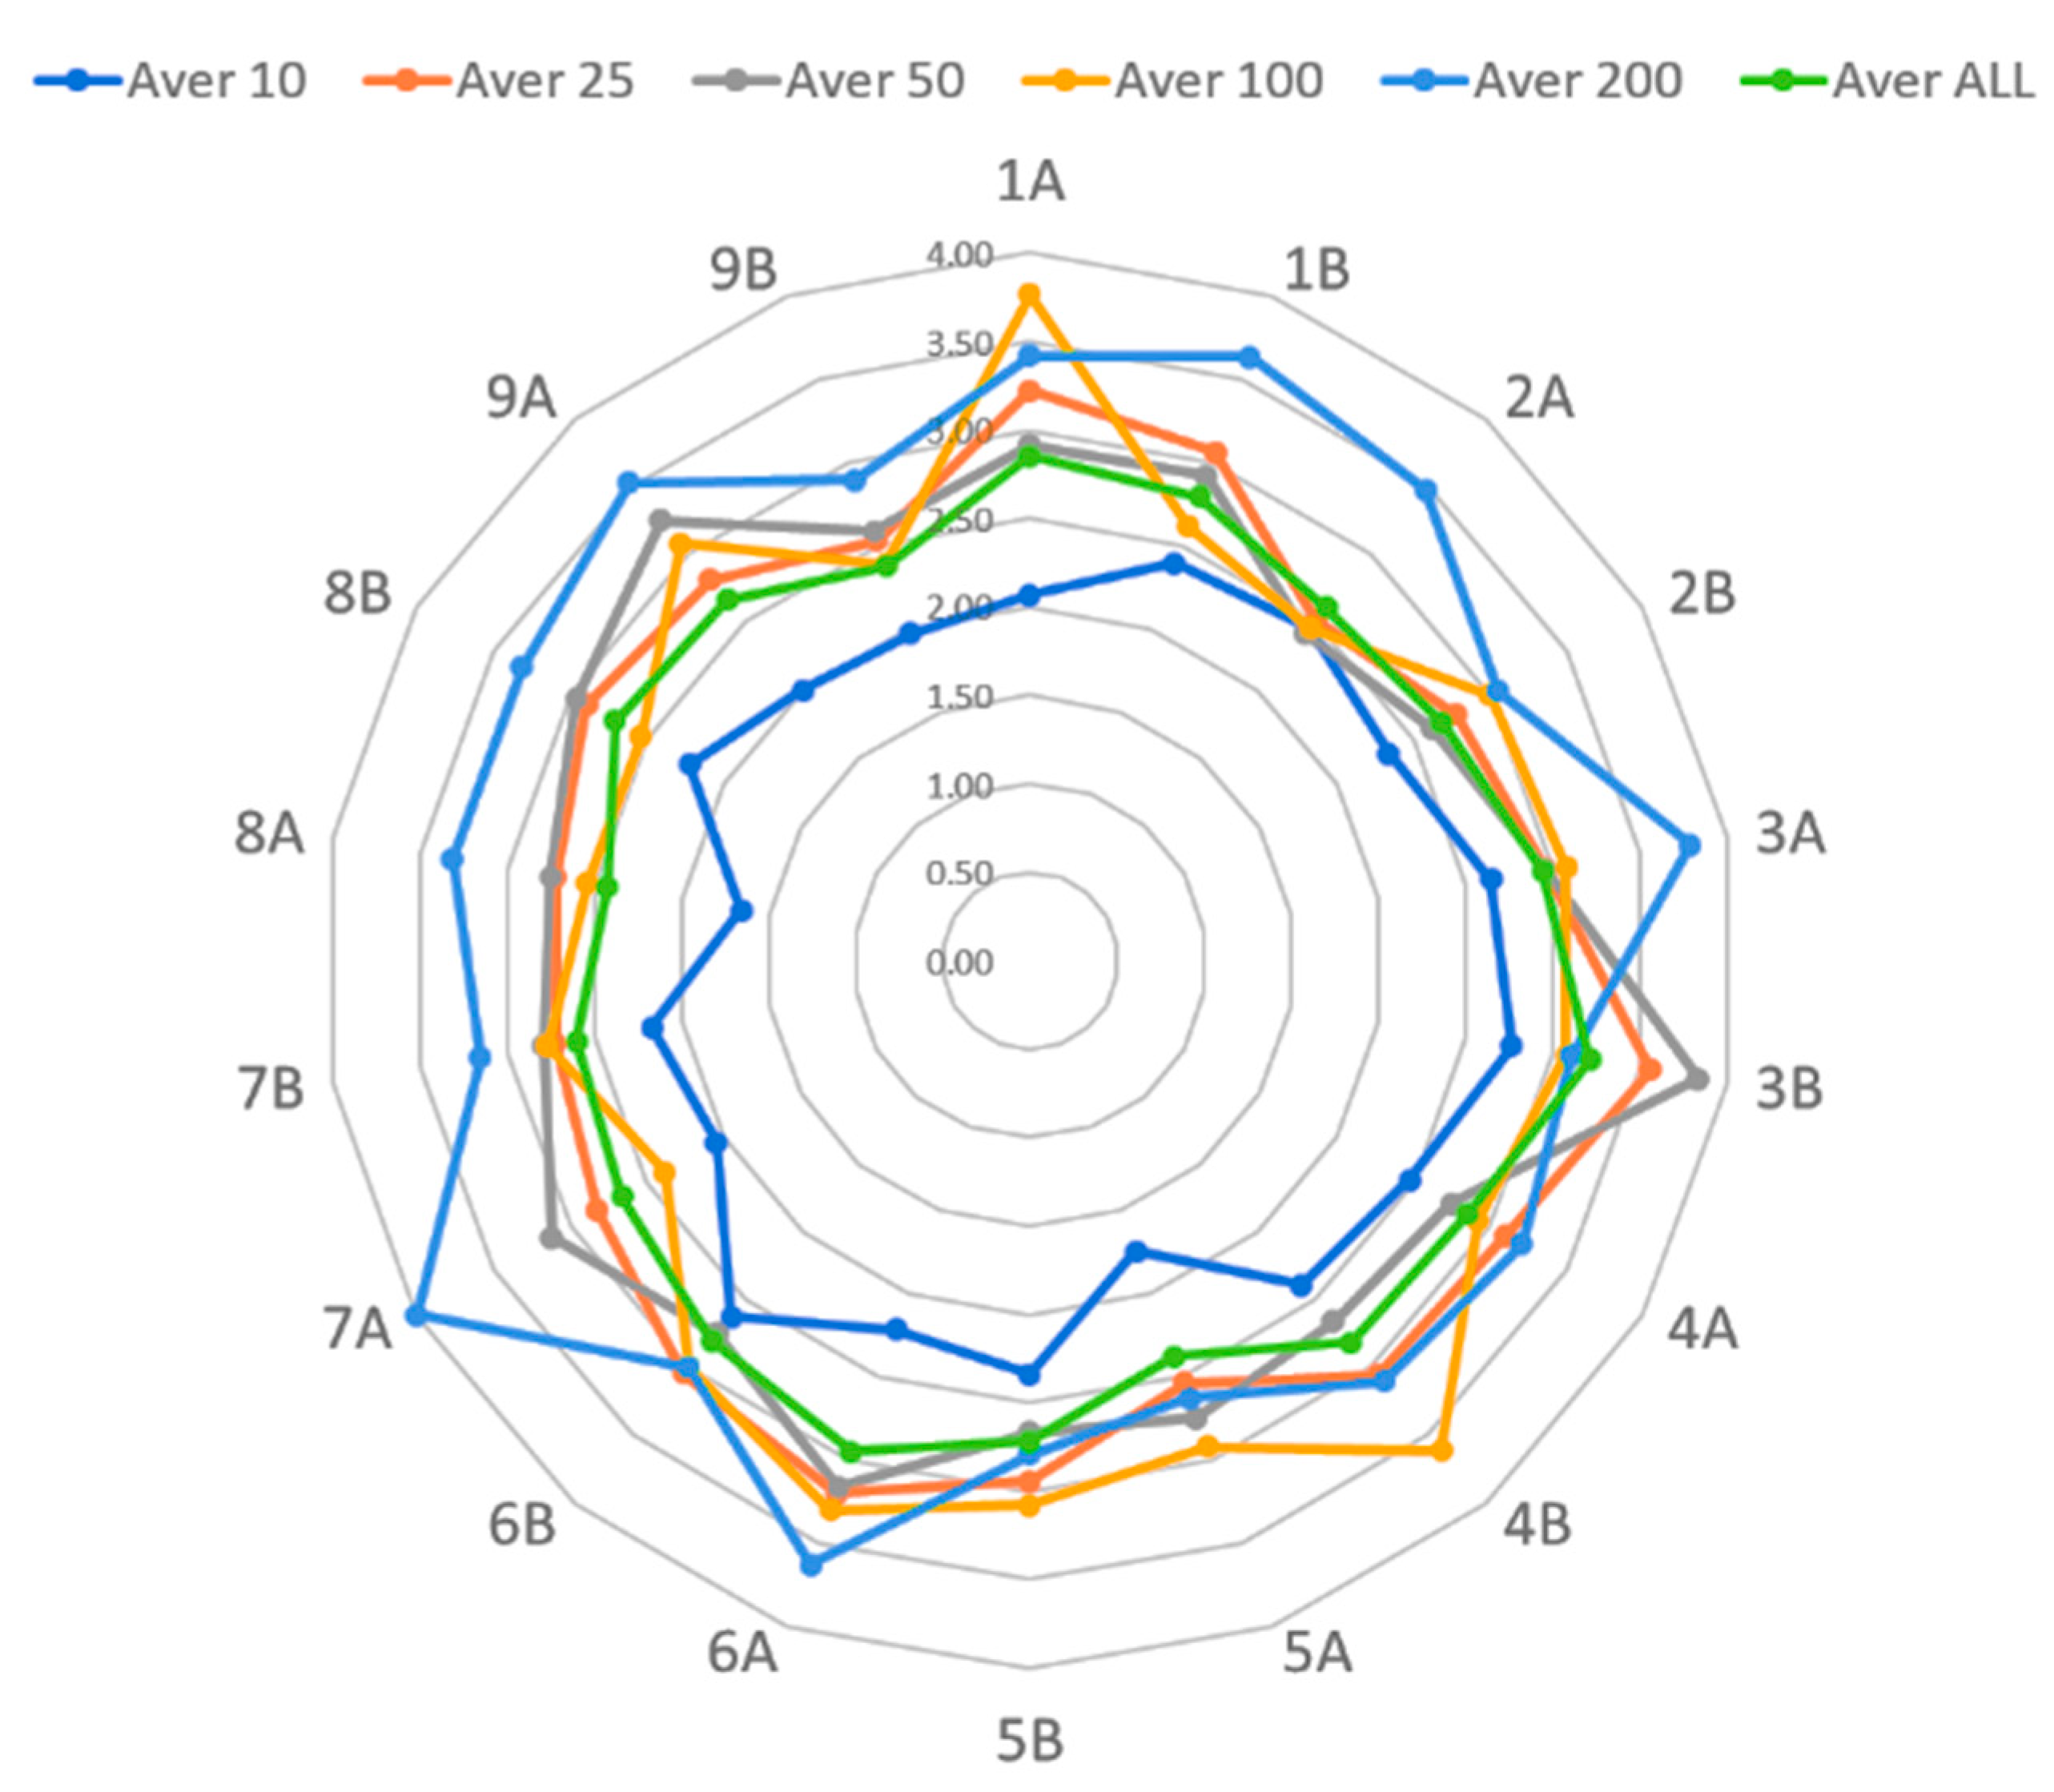
3.2. Self-Assessment Results by Company Size
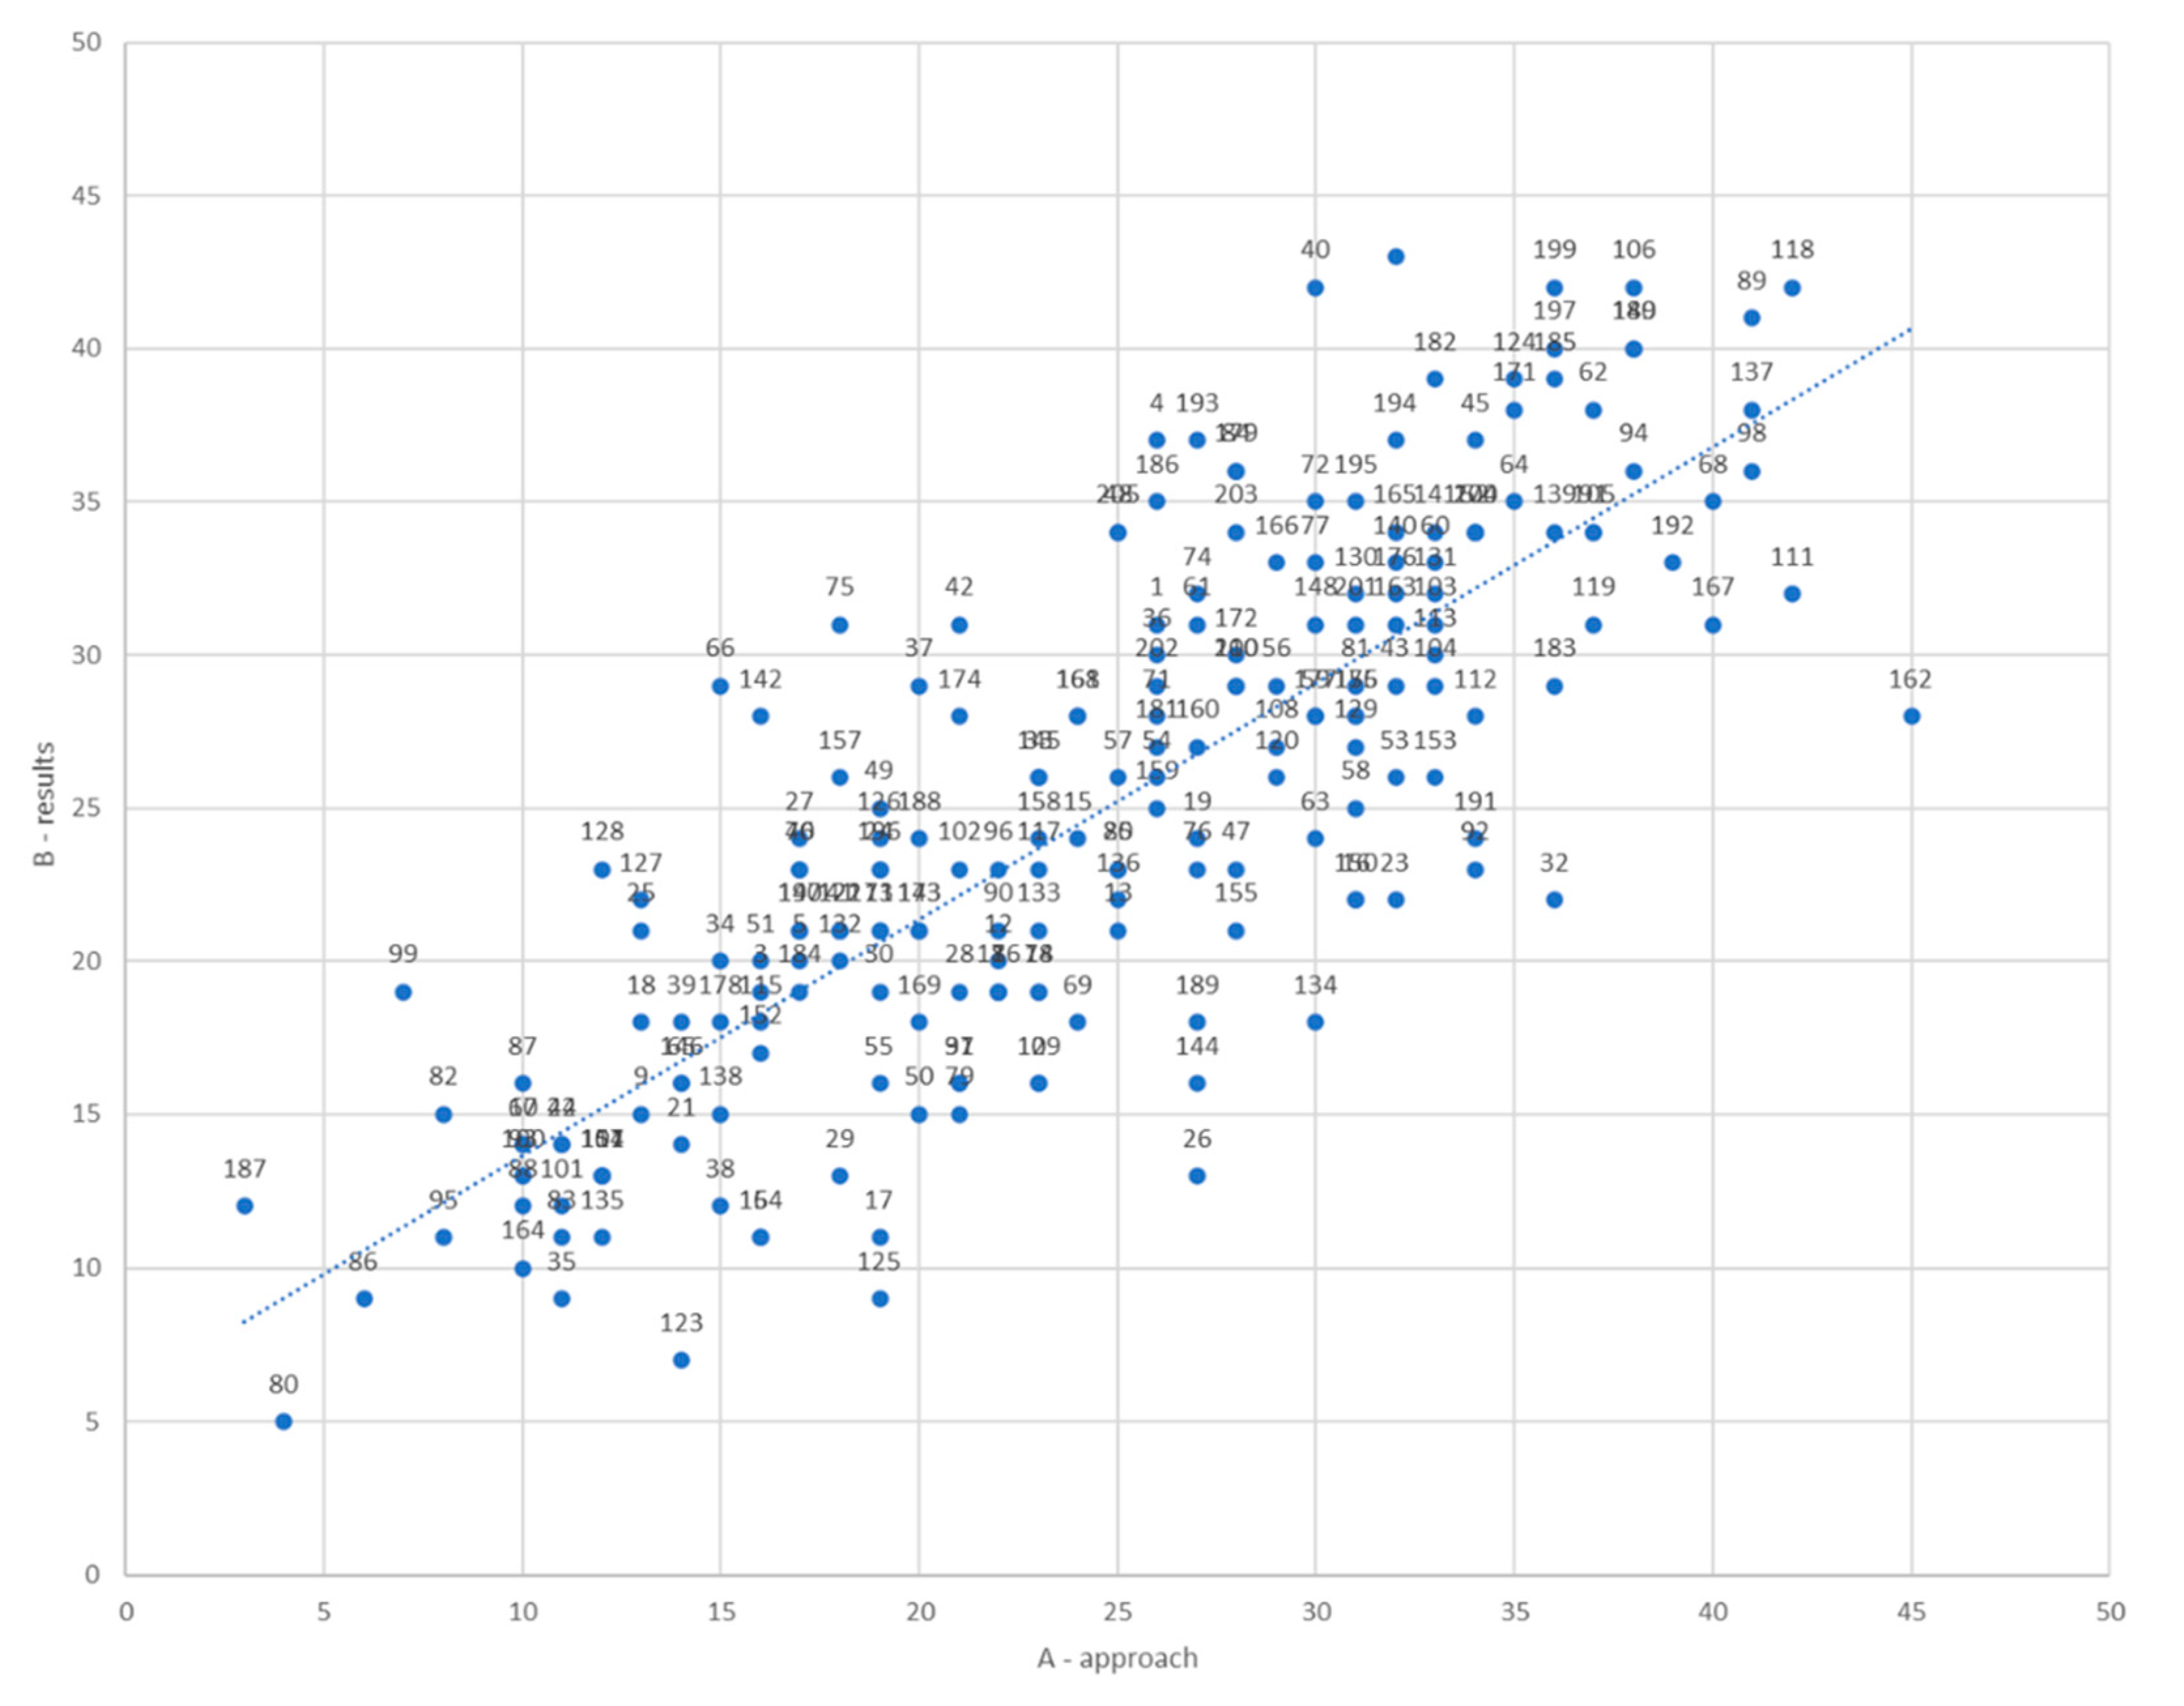
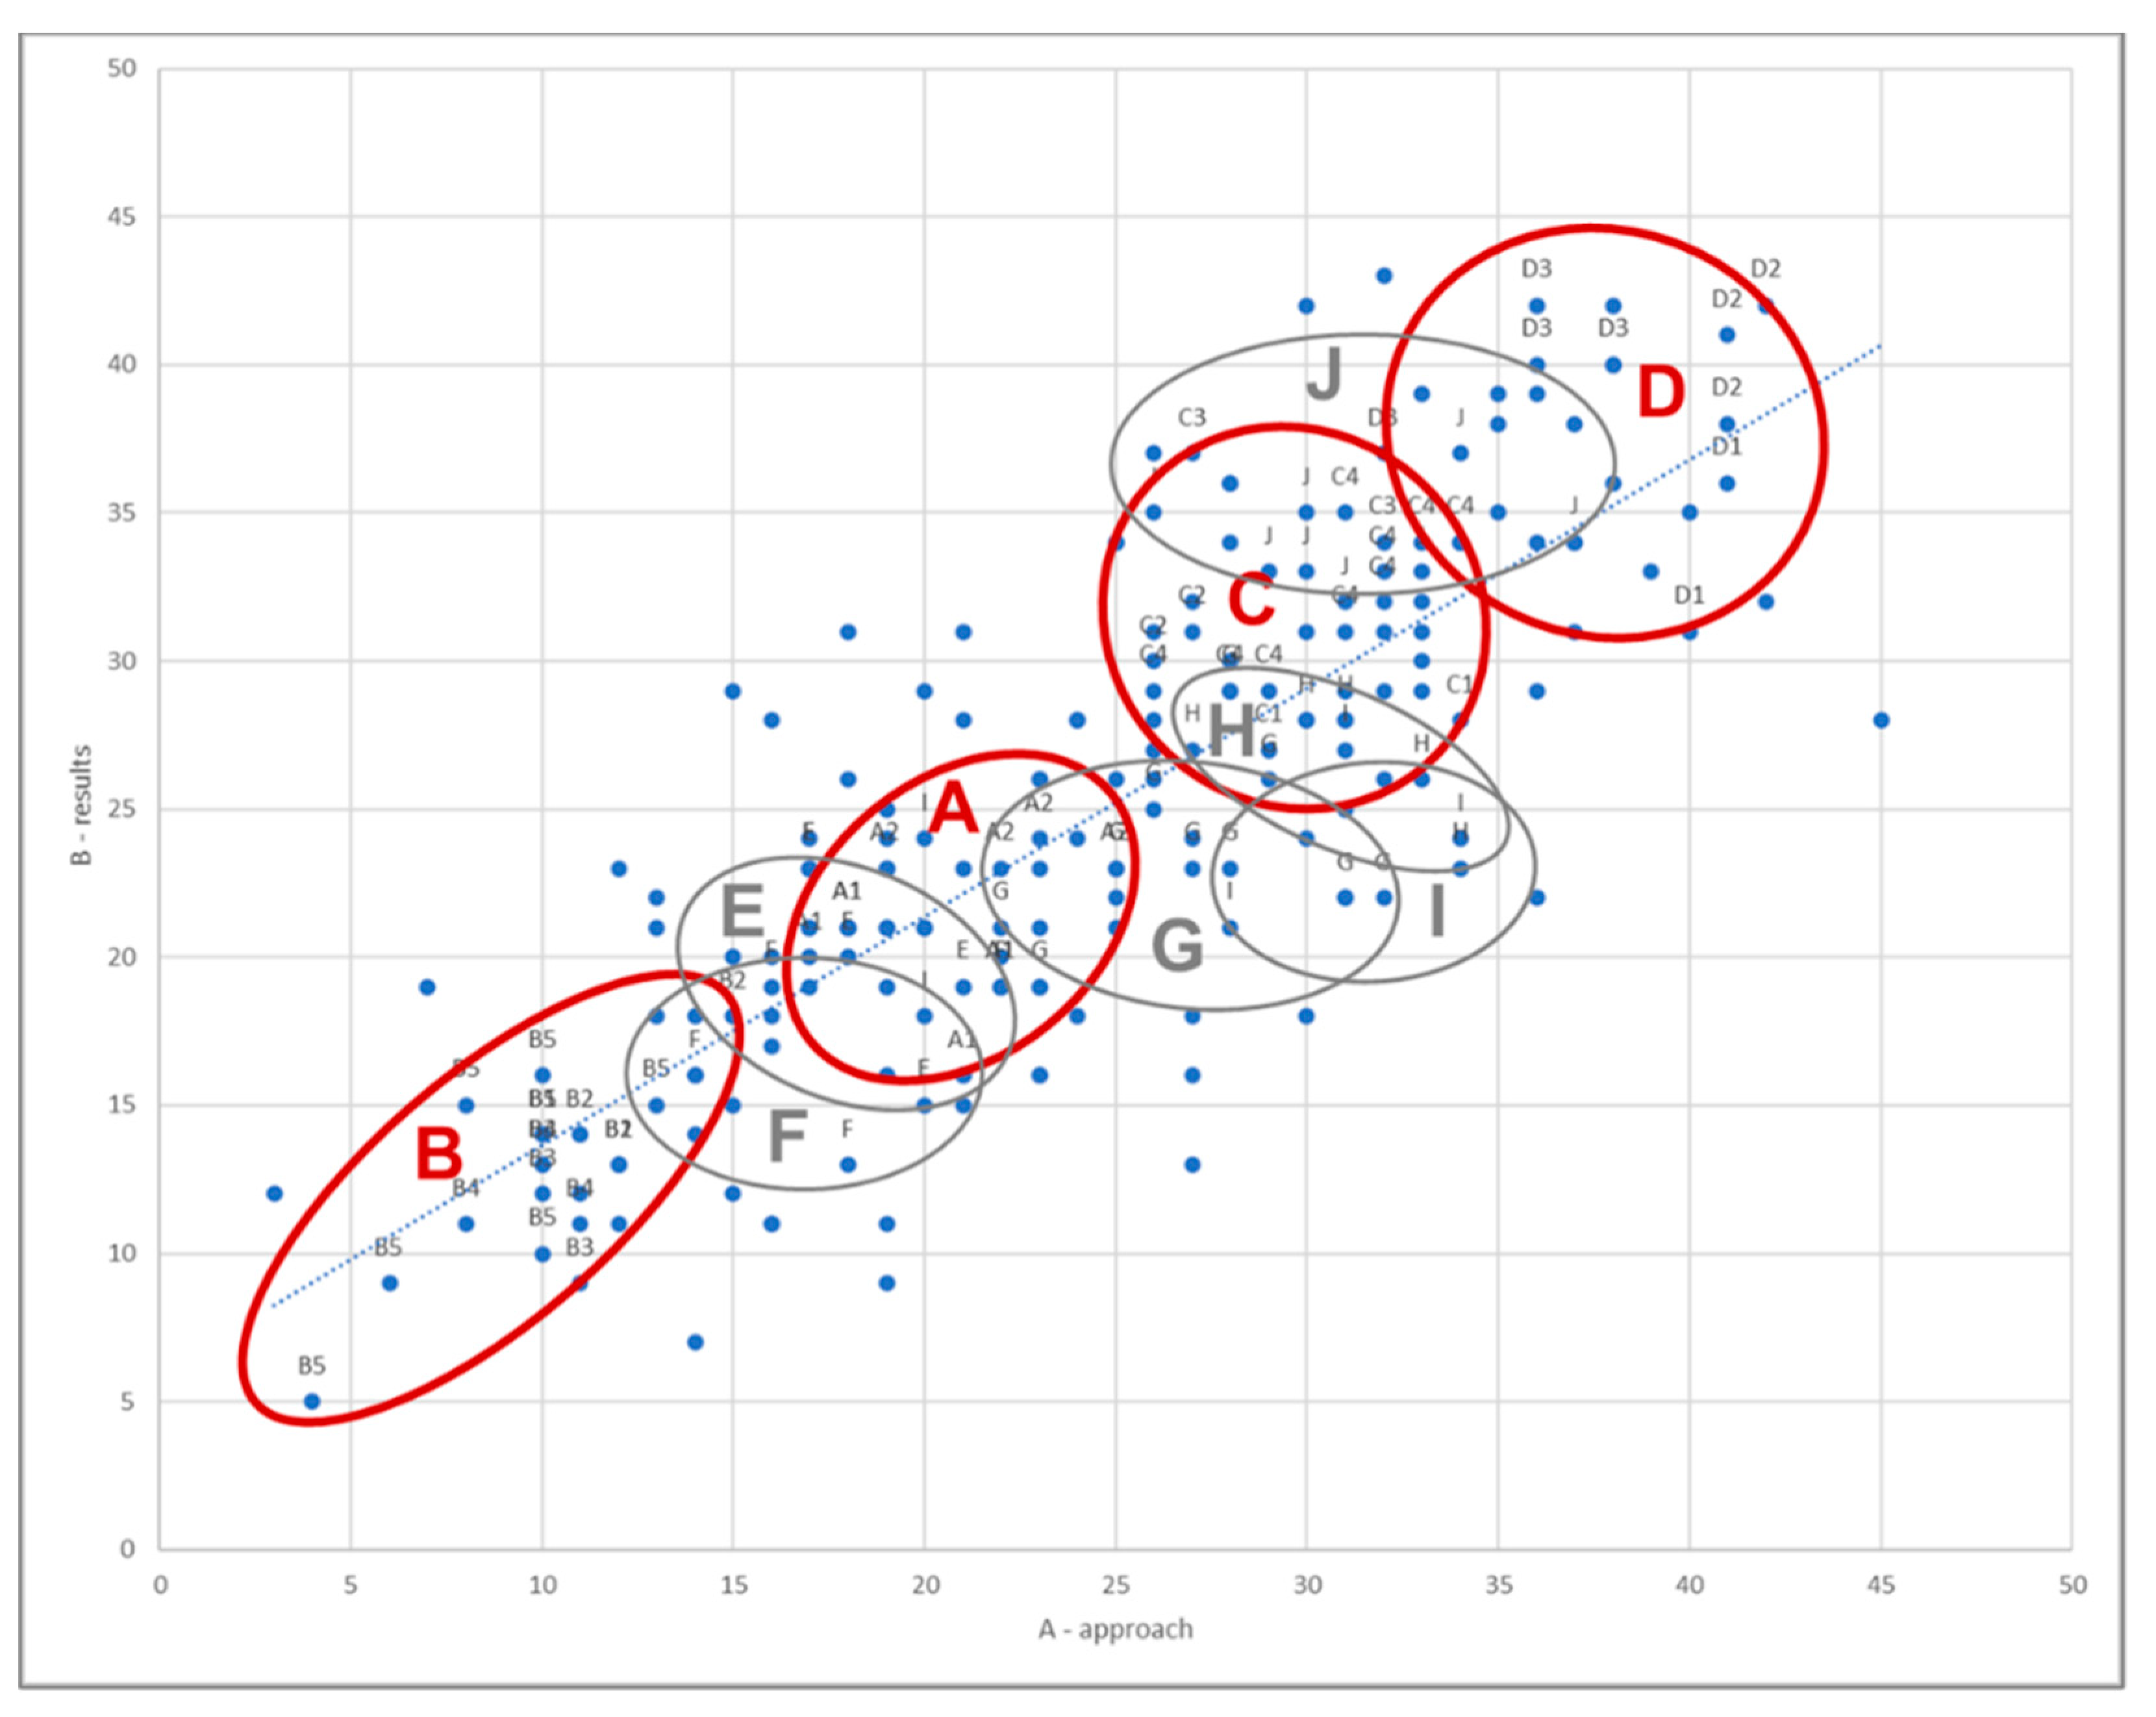
3.3. Corelation between Approach and Results
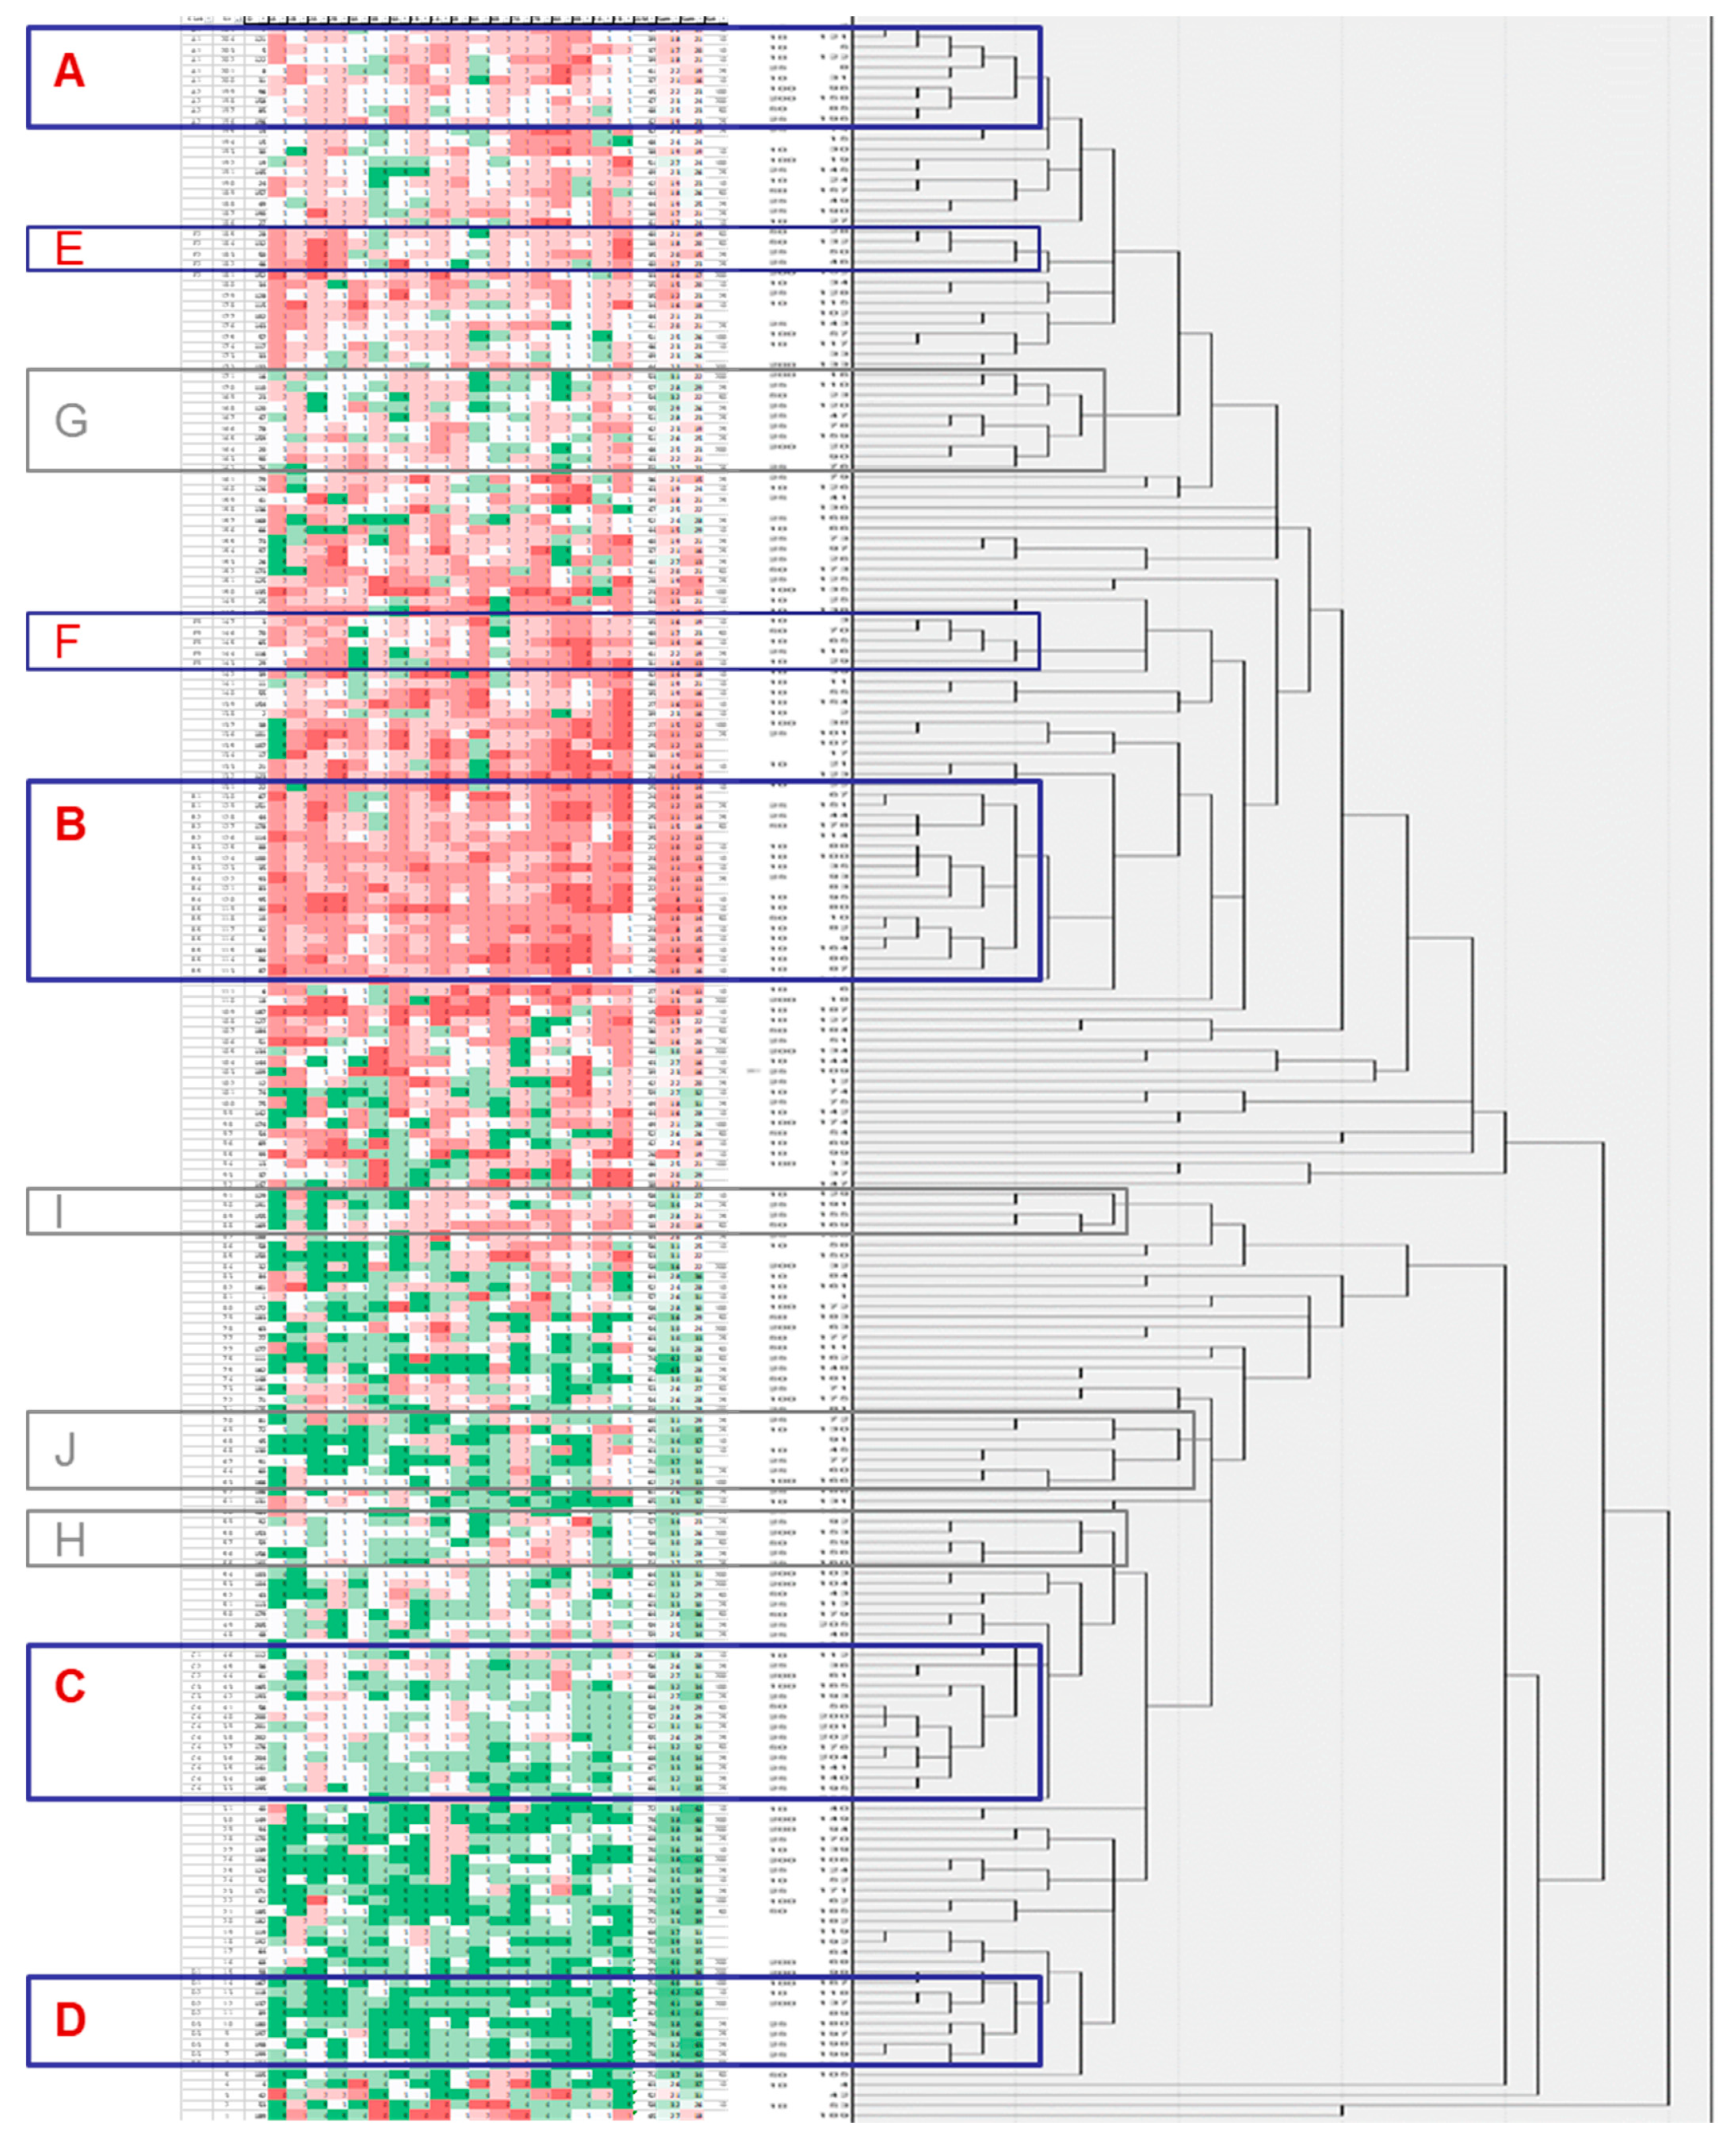
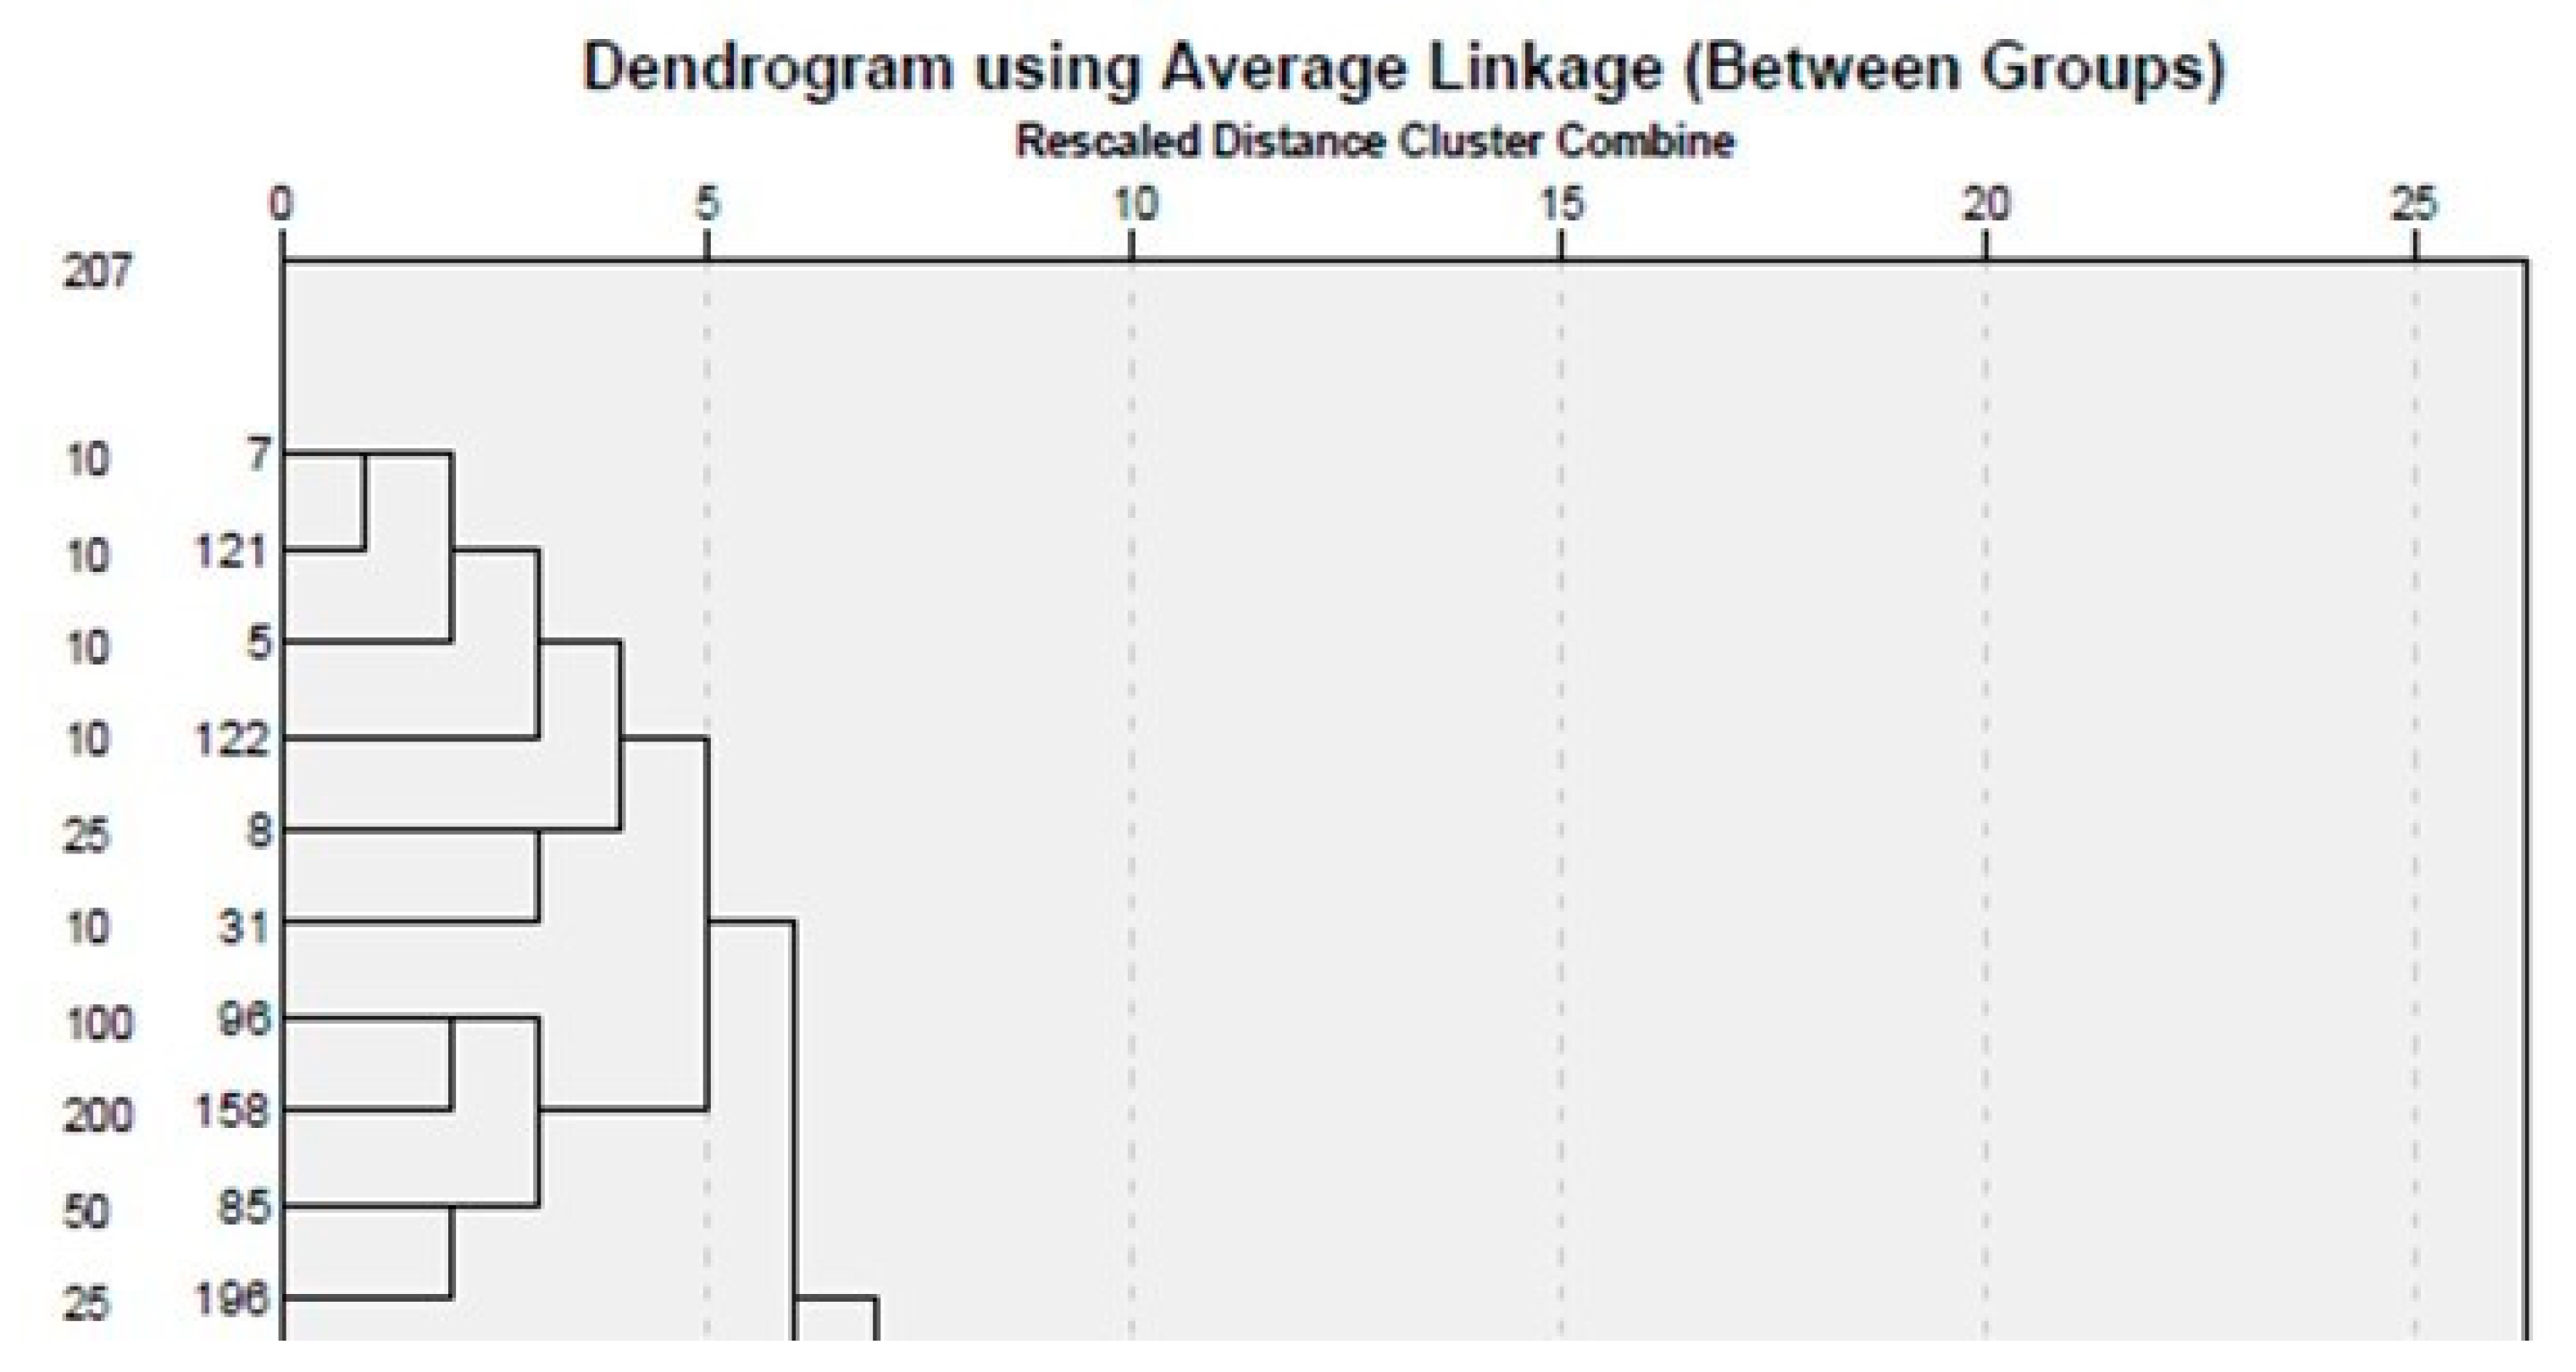
3.4. Cluster Analysis by Enterprises
4. Discussion
5. Conclusions
5.1. Implications
5.2. Limits and Future Research Topics
Author Contributions
Funding
Institutional Review Board Statement
Informed Consent Statement
Data Availability Statement
Conflicts of Interest
References
- European Commission. Annual Report on European SMEs 2018/2019. Annual Report. 2019. Available online: https://op.europa.eu/en/publication-detail/-/publication/cadb8188-35b4-11ea-ba6e-01aa75ed71a1/language-en (accessed on 4 March 2021).
- Hossain, M.; Kauranen, I. Open innovation in SMEs: A systematic literature review. J. Strategy Manag. 2016, 9, 58–73. [Google Scholar] [CrossRef]
- Almeida, F. Open-innovation practices: Diversity in portuguese smes. J. Open Innov. Technol. Mark. Complex. 2021, 7, 169. [Google Scholar] [CrossRef]
- European Commission. User Guide to the SME Definition; Publications Office of the European Union: Luxemburg, 2020; pp. 1–60. Available online: https://op.europa.eu/en/publication-detail/-/publication/756d9260-ee54-11ea-991b-01aa75ed71a1 (accessed on 10 September 2020).
- Jennings, P.L.; Beaver, G. The managerial dimension of small business failure. Strateg. Chang. 1995, 4, 185–200. [Google Scholar] [CrossRef]
- Kaplan, R.S.; Norton, D.P. Mastering the management system. Harv. Bus. Rev. 2008, 86, 62–77. [Google Scholar]
- Yusr, M.M. Innovation capability and its role in enhancing the relationship between TQM practices and innovation performance. J. Open Innov. Technol. Mark. Complex. 2016, 2, 6. [Google Scholar] [CrossRef] [Green Version]
- Brand, M.; Tiberius, V.; Bican, P.M.; Brem, A. Agility as an innovation driver: Towards an agile front end of innovation framework. Rev. Manag. Sci. 2021, 15, 157–187. [Google Scholar] [CrossRef]
- Žitkienė, R.; Deksnys, M. Organizational agility conceptual model. Montenegrin J. Econ. 2018, 14, 115–129. [Google Scholar] [CrossRef]
- Millers, M.; Gaile-Sarkane, E. Towards new typology of the owners-managers of the small and medium enterprises. In Proceedings of the International Scientific Conference Contemporary Issues in Business, Management and Economics Engineering, Vilnius, Lithuania, 11–12 May 2021. [Google Scholar] [CrossRef]
- Forth, J.; Bryson, A. Management practices and SME performance. Scott. J. Political Econ. 2019, 66, 527–558. [Google Scholar] [CrossRef]
- Chesbrough, H.W. Open Business Models: How to Thrive in the New Innovation Landscape. Res. Technol. Manag. 2006, 50, 256. [Google Scholar] [CrossRef]
- Gassmann, O.; Enkel, E.; Chesbrough, H. The future of open innovation. R D Manag. 2010, 40, 213–221. [Google Scholar] [CrossRef]
- Yun, J.J.; Won, D.; Park, K. Dynamics from open innovation to evolutionary change. J. Open Innov. Technol. Mark. Complex. 2016, 2, 7. [Google Scholar] [CrossRef] [Green Version]
- Svirina, A.; Zabbarova, A.; Oganisjana, K. Implementing open innovation concept in social business. J. Open Innov. 2016, 2, 20. [Google Scholar] [CrossRef] [Green Version]
- Dubickis, M.; Gaile-Sarkane, E. Transfer of know-how based on learning outcomes for development of open innovation. J. Open Innov. Technol. Mark. Complex. 2017, 3, 4. [Google Scholar] [CrossRef] [Green Version]
- Romero, M.C.; Lara, P.; Villalobos, J. Evolution of the Business Model: Arriving at Open Business Model Dynamics. J. Open Innov. Technol. Mark. Complex. 2021, 7, 86. [Google Scholar] [CrossRef]
- Hamel, G. Leading the Revolution: How to Thrive in Turbulent Times by Making Innovation a Way of Life; Plume/Penguin: New York, NY, USA, 2002. [Google Scholar]
- Osterwalder, A.; Pigneur, Y.; Tucci, C. Clarifying Business Models: Origins, Present, and Future of the Concept. Commun. Assoc. Inf. Syst. 2005, 16, 1. [Google Scholar] [CrossRef] [Green Version]
- Osterwalder, A.; Pigneur, Y. Business Model Generation—A Handbook for Visionaries, Game Changers and Challengers; John Wiley and Sons, Inc.: Hoboken, NJ, USA, 2010. [Google Scholar]
- Medne, A.; Lapiņa, I. Sustainability and Continuous Improvement of Organization: Review of Process-Oriented Performance Indicators. J. Open Innov. Technol. Mark. Complex. 2019, 5, 49. [Google Scholar] [CrossRef] [Green Version]
- Herrera, J.; de las Heras-Rosas, C. Economic, non-economic and critical factors for the sustainability of family firms. J. Open Innov. Technol. Mark. Complex. 2020, 6, 119. [Google Scholar] [CrossRef]
- Wijewardena, H.; Nanayakkara, G.; De Zoysa, A.D. The owner/manager’s mentality and the financial performance of SMEs. J. Small Bus. Enterp. Dev. 2008, 15, 150–161. [Google Scholar] [CrossRef]
- Belenzon, S.; Shamshur, A.; Zarutskie, R. CEO’s age and the performance of closely held firms. Strateg. Manag. J. 2019, 40, 917–944. [Google Scholar] [CrossRef]
- Jaouen, A.; Lasch, F. A new typology of micro-firm owner-managers. Int. Small Bus. J. 2015, 33, 397–421. [Google Scholar] [CrossRef]
- Wang, Y.; Poutziouris, P. Leadership Styles, Management Systems and Growth: Empirical Evidence from UK Owner-Managed SMEs. J. Enterp. Cult. 2010, 18, 331–354. [Google Scholar] [CrossRef]
- Porter, M.E. What is Strategy? Harv. Bus. Rev. 1996, 74, 61–78. [Google Scholar] [CrossRef] [Green Version]
- European Foundation for Quality Management. The EFQM Model. 2021. Available online: https://www.efqm.org/efqm-model (accessed on 7 June 2021).
- Miller, G.A. The magical number seven, plus or minus two: Some limits on our capacity for processing information. Psychol. Rev. 1956, 63, 81–97. [Google Scholar] [CrossRef] [PubMed] [Green Version]
- Baddeley, A. The Magical Number Seven: Still Magic After All These Years? Psychol. Rev. 1994, 101, 353–356. [Google Scholar] [CrossRef]
- Stehlik-Barry, K.; Babinec, A.J. Data analysis with IBM SPSS Statistics: Implementing data modeling, descriptive statistics and ANOVA. In Data Analysis with International Business Machines Statistical Package for the Social Sciences Statistics; Pact Publishing: Birmingham, UK, 2017. [Google Scholar]


| Level | No. | A-Approach | B-Results |
|---|---|---|---|
| Strategic | 1. | Business Model | Business Sustainability |
| 2. | Target Market and Customers | Customer Base | |
| 3. | Setting Goals and Strategy | Achieving Goals | |
| Organisational | 4. | Managing Products and Services | Product Portfolio |
| 5. | Process Management | Efficiency | |
| 6. | Personnel and Organization | Staff Competence and Loyalty | |
| Management and Control | 7. | Management Team | Leadership |
| 8. | Planning | Change Management | |
| 9. | Financial Management | Financial Results |
| Score | A-Approach | B-Results |
|---|---|---|
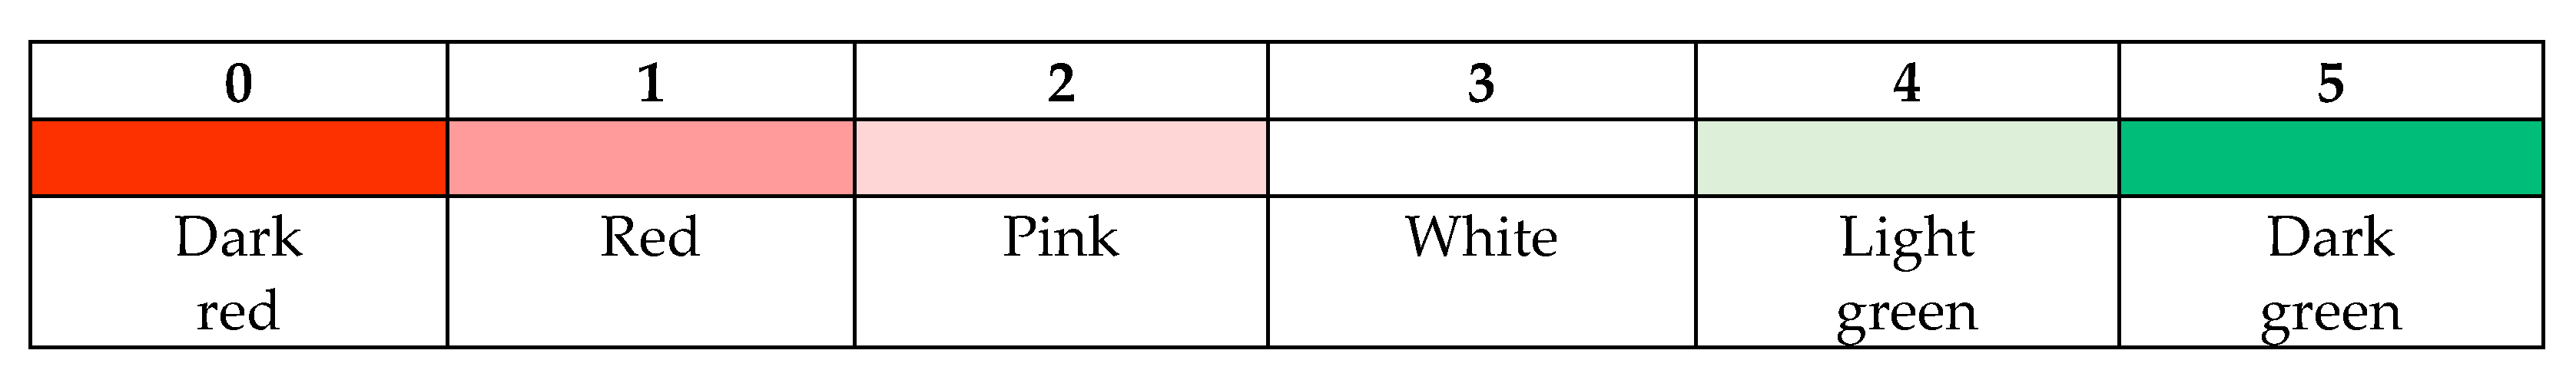
| 0 | No evidence of any system | Negative outcome or no evidence |
| 1 | Manager sets instructions | Evidence shows weak results |
| 2 | Beginning of systematic approach | Some positive trends |
| 3 | Key principles are defined | Stable, positive result |
| 4 | Systematic approach is in use | Long-lasting improvement |
| 5 | Solid, advanced approach | Best-in-class, leading results |
| No. | People Employed | Category | Number of Respondents | % |
|---|---|---|---|---|
| 1 | ~10–20 | 10 | 59 | 28.8 |
| 2 | ~20–40 | 25 | 68 | 33.2 |
| 3 | ~40–80 | 50 | 24 | 11.7 |
| 4 | ~80–160 | 100 | 13 | 6.3 |
| 5 | ~160–250 | 200 | 19 | 9.3 |
| 6 | Not identified | - | 22 | 10.7 |
| Total: | 205 | 100% |
| A | B | |||
|---|---|---|---|---|
| Spearman’s rho | A | Correlation coefficient | 1.000 | 0.808 ** |
| Sig. (two-tailed) | 0.000 | |||
| N | 205 | 205 | ||
| B | Correlation coefficient | 0.808 ** | 1.000 | |
| Sig. (2-tailed) | 0.000 | |||
| N | 205 | 205 |
| ID | 1A | 1B | 2A | 2B | 3A | 3B | 4A | 4B | 5A | 5B | 6A | 6B | 7A | 7B | 8A | 8B | 9A | 9B | SUM | Sum.A | Sum.B | Cat. |
|---|---|---|---|---|---|---|---|---|---|---|---|---|---|---|---|---|---|---|---|---|---|---|
| A1 | ||||||||||||||||||||||
| 7 | 2 | 3 | 2 | 2 | 4 | 3 | 3 | 2 | 2 | 2 | 3 | 2 | 2 | 1 | 1 | 1 | 3 | 3 | 41 | 22 | 19 | 10 |
| 121 | 1 | 3 | 2 | 2 | 3 | 3 | 2 | 3 | 2 | 2 | 2 | 2 | 2 | 2 | 1 | 1 | 3 | 3 | 39 | 18 | 21 | 10 |
| 5 | 1 | 2 | 3 | 3 | 3 | 3 | 2 | 2 | 1 | 2 | 3 | 2 | 2 | 2 | 1 | 2 | 1 | 2 | 37 | 17 | 20 | 10 |
| 122 | 1 | 3 | 3 | 3 | 3 | 4 | 1 | 2 | 1 | 2 | 4 | 3 | 1 | 1 | 1 | 0 | 3 | 3 | 39 | 18 | 21 | 10 |
| 8 | 3 | 1 | 2 | 2 | 4 | 4 | 2 | 1 | 3 | 2 | 4 | 3 | 2 | 2 | 0 | 1 | 2 | 3 | 41 | 22 | 19 | 25 |
| 31 | 2 | 1 | 3 | 2 | 2 | 3 | 2 | 1 | 2 | 2 | 5 | 1 | 2 | 1 | 0 | 2 | 3 | 3 | 37 | 21 | 16 | 10 |
| A2 | ||||||||||||||||||||||
| 96 | 2 | 3 | 2 | 2 | 3 | 3 | 3 | 2 | 1 | 3 | 3 | 2 | 2 | 3 | 3 | 2 | 3 | 3 | 45 | 22 | 23 | 100 |
| 158 | 3 | 3 | 2 | 2 | 3 | 3 | 3 | 2 | 3 | 3 | 3 | 2 | 3 | 3 | 1 | 3 | 2 | 3 | 47 | 23 | 24 | 200 |
| 85 | 3 | 2 | 2 | 2 | 3 | 4 | 1 | 2 | 4 | 3 | 3 | 2 | 3 | 3 | 2 | 2 | 4 | 3 | 48 | 25 | 23 | 50 |
| 196 | 3 | 3 | 2 | 2 | 1 | 3 | 1 | 2 | 3 | 2 | 2 | 3 | 3 | 3 | 2 | 2 | 2 | 3 | 42 | 19 | 23 | 25 |
Publisher’s Note: MDPI stays neutral with regard to jurisdictional claims in published maps and institutional affiliations. |
© 2021 by the authors. Licensee MDPI, Basel, Switzerland. This article is an open access article distributed under the terms and conditions of the Creative Commons Attribution (CC BY) license (https://creativecommons.org/licenses/by/4.0/).
Share and Cite
Millers, M.; Gaile-Sarkane, E. Management Practice in Small and Medium-Sized Enterprises: Problems and Solutions from the Perspective of Open Innovation. J. Open Innov. Technol. Mark. Complex. 2021, 7, 214. https://doi.org/10.3390/joitmc7040214
Millers M, Gaile-Sarkane E. Management Practice in Small and Medium-Sized Enterprises: Problems and Solutions from the Perspective of Open Innovation. Journal of Open Innovation: Technology, Market, and Complexity. 2021; 7(4):214. https://doi.org/10.3390/joitmc7040214
Chicago/Turabian StyleMillers, Maris, and Elina Gaile-Sarkane. 2021. "Management Practice in Small and Medium-Sized Enterprises: Problems and Solutions from the Perspective of Open Innovation" Journal of Open Innovation: Technology, Market, and Complexity 7, no. 4: 214. https://doi.org/10.3390/joitmc7040214