1. Introduction
The COVID-19 pandemic has changed significantly in industrial aspect and also tested economic systems. Hence, speeding up innovation is an essential task to financial recovery for every country. It can be said that Openness enhances human capital to overcome the panic situation in all sectors. People from different time zones and countries must co-create pandemic solutions and co-innovate all business processes impacted. Therefore, open innovation approach will be helpful in crisis management. By working with the global community, sharing problems on open platforms, managing intellectual properties, and evaluating previous technologies are ways to recover from the pandemic crisis [
1].
Digital transformation is about Information and Technology (IT) investment for operational changes to become more efficient. However, it can be difficult, expensive, and time-consuming to revitalize digital capabilities. Therefore, most companies are looking to source innovation from outside organizations. In addition, partnership assessment is a crucial problem since it is not easy to integrate internal and external capabilities. Generally, companies seek innovation from their existing partners in their value chains, such as customers or vendors. Recently, companies must widen their partnerships from existing ones to various sources such as universities, think tanks, consultants, crowdsourcing platforms, startups, and innovation labs [
2].
Moreover, companies today are attempting to use open innovation for internal innovative business actions and management operations. This means that organizational inertia is reduced, and setting adaptability is gained through open innovation, which is critical in this context. Companies with a lot of resources can use their strong technical capabilities to carry out creative internal operations. Business model innovation is the construction or reinvention of current business models through the development of novel value generation systems, distinct value propositions, and unique value capture methods. However, the inertia to change is a significant impediment to adopting the innovative business models in any firm, and its influence has not been well explored [
3].
Study conducted by Xie & Wang found that the concept of “open innovation” had become a popular way to encourage business innovation [
4]. Open innovation defines a new ecosystem. A loosely connected network of businesses and other organizations was described as an open innovation ecosystem, with a significant number of the supported activities categorized as open innovation ecosystem projects. Because interactions and coordination among niche participants are common aspects of an innovation ecosystem, an open innovation ecosystem may be thought of as a collection of innovation niches occupied by linked companies. The diversity of these niches and the competition for them are considered indications of an ecosystem’s health.
The basic construct of value is of considerable relevance since the notion of business models (BMs) is deeply embedded in the reasoning of how a company does business and how its structure produces, delivers, and captures value. Corporate sustainability researchers have become more interested in BMs for sustainability in the last decade, with international conferences and scientific journals fostering the development of discussion on their design, application, and innovation processes. BMs research has exploded in popularity, making it a trendy issue to explore the nexus of strategic management and entrepreneurship [
5].
Another study by Moellers et.al. found that business model innovation was a method for companies to gain and maintain competitive advantages [
6]. However, managers who rely on imperfect cognitive representations to grasp the environmental dynamics that affect a business model’s future success face significant problems. System dynamics is a computational method that has the potential to improve management knowledge and decision-making during business model innovation, but there isn’t enough data to back up its claims.
The emergence of new business activities encourages the spread of innovation, boosts employment, and generates many positive externalities that benefit the whole economic system, helping to enhance its efficiency. The low likelihood of a new firm surviving the startup phase has a detrimental impact on corporate birth and survival rates and negatively impacts entrepreneurial culture.
Although the new company may have a good innovation, several factors can negatively impact its operational condition during its startup phase. It includes a lack of revenue, a small number of customers with low fidelity levels, prototype products or services, and a lack of strategic partners who can help the company [
7]. However, partnerships become a critical issue for startups and corporates in the era of disruption to achieve sustainable growth.
Since there is a lack of study revealing how digital companies conduct partnerships, innovating business models using system dynamics might be helpful to describe the proper strategy of collaboration at the early stage. The business model simulates the number of partners, success rate, and fail rate to obtain the optimal effect of open innovation on companies’ business strategies. Thus, this study aims to define a business model innovation based on system dynamics with partnership scenarios. Some essential variables are derived from empirical studies involving four digital companies in Indonesia. The study attempts to link open innovation and business models and it is organized into sections. The structure of the paper is as follows: the first section is the Introduction, followed by Theoretical Background, Research Setting and Methods, Data analysis, Discussion, and finally, the Conclusions.
4. Data Analysis
4.1. OI Factors
From the literature study, some factors commonly mentioned to influence OI success are listed in
Table 2.
Table 3 shows OI factors that are validated by four experts and linked to their experiences as below:
4.2. System Dynamics (SD): Reinforcing Loop between Key Partners and IP-Share
This study chose IP-sharing and Key Partners as the biggest driving factors of OI that could become engine growth for digital companies. Key Partners and IP-sharing are concrete variables that display positive feedback loops in BMI. The positive feedback loop represents the company’s engine growth when implementing OI. Meanwhile, Revenue and Value Proposition are also positive feedback loops showing the traditional innovation without involving Key Partners and IP-Sharing intensively.
Since SD indicates the nonlinear functions, the stock variables are differential functions describing inflows and outflows. The following picture and equations depict the simple CLD and SD for one feedback loop:
From
Figure 3, the SD equations are derived as differential functions as follows:
= Join Rate ∗ KP In − Loss Rate ∗ KP Out
Since: Join Rate = alpha ∗ IP Sharing,
alpha is a constant representing
Join Rate, which links
IP Sharing and
Key Partners. In simulation software, the differential functions are changed into integral functions to show the accumulation during a certain period. The
Figure 4 below is the SD model involving Revenue, Value Propositions,
Key Partners, and
IP Sharing:
Figure 3.
Simple CLD and SD for Key Partners and IP Share.
Figure 3.
Simple CLD and SD for Key Partners and IP Share.
The study develops a BMI to show how OI variables significantly contribute to the engine of growth for digital companies.
The following
Table 4 describes SD variables with their equations and initial value if applicable.
Variables and dummy variables show the common business logic. All equations refer to the software standard—Vensim PLE ×64. The constants and initial values are changeable regarding the original character of each company’s business process. The following simulations indicate the impact of each variable to feed the top management level for early strategic decisions.
4.3. Scenario 1: BMI for OI Simulation
Figure 5 shows the simulation indicates how OI variables influence the company’s revenue by giving some initial values, as stated in
Table 4 The simulation result shows that the company’s revenue starts growing exponentially after twelve months if it implements OI by adding Key Partners and IP Sharing. It means that OI variables have a significant impact on companies, primarily digital enterprises. All parameters remain the same except Add OI, which equals one to differentiate from existing conditions (without OI).
4.4. Scenario 2: BMI for OI Variables (IP Sharing and Key Partners) Simulation
Figure 6 shows the simulation depicting how dynamic company revenue resulted from OI variables; IP-Sharing and Key Partners (KP). IP-Sharing is an activity that two digital enterprises co-innovate for some products, and it must be steep for the company that adopts OI. However, the situation runs for two years then the activity falls into an equilibrium state in the 30th month. After that, all IP activities (IP success and IP fail) raise incrementally. On the other side, KP starts growing at the same speed, and from the 30th month, the growth is incremental.
The above simulation runs with the ideal initial values, where alpha is 0.8, beta is 0.05, SR is 0.8, and LR is 0.01. The partnership success is much higher than the partnership loss, and IP success is much higher than IP failure for OI activities. The phenomenon reveals that OI adoption ideally takes a minimum of two years. Hence, as the ISM result, the co-creation becomes crucial to determine the OI success. The IP-Sharing and Key Partners represent the co-creation factors that lead to an OI process adoption.
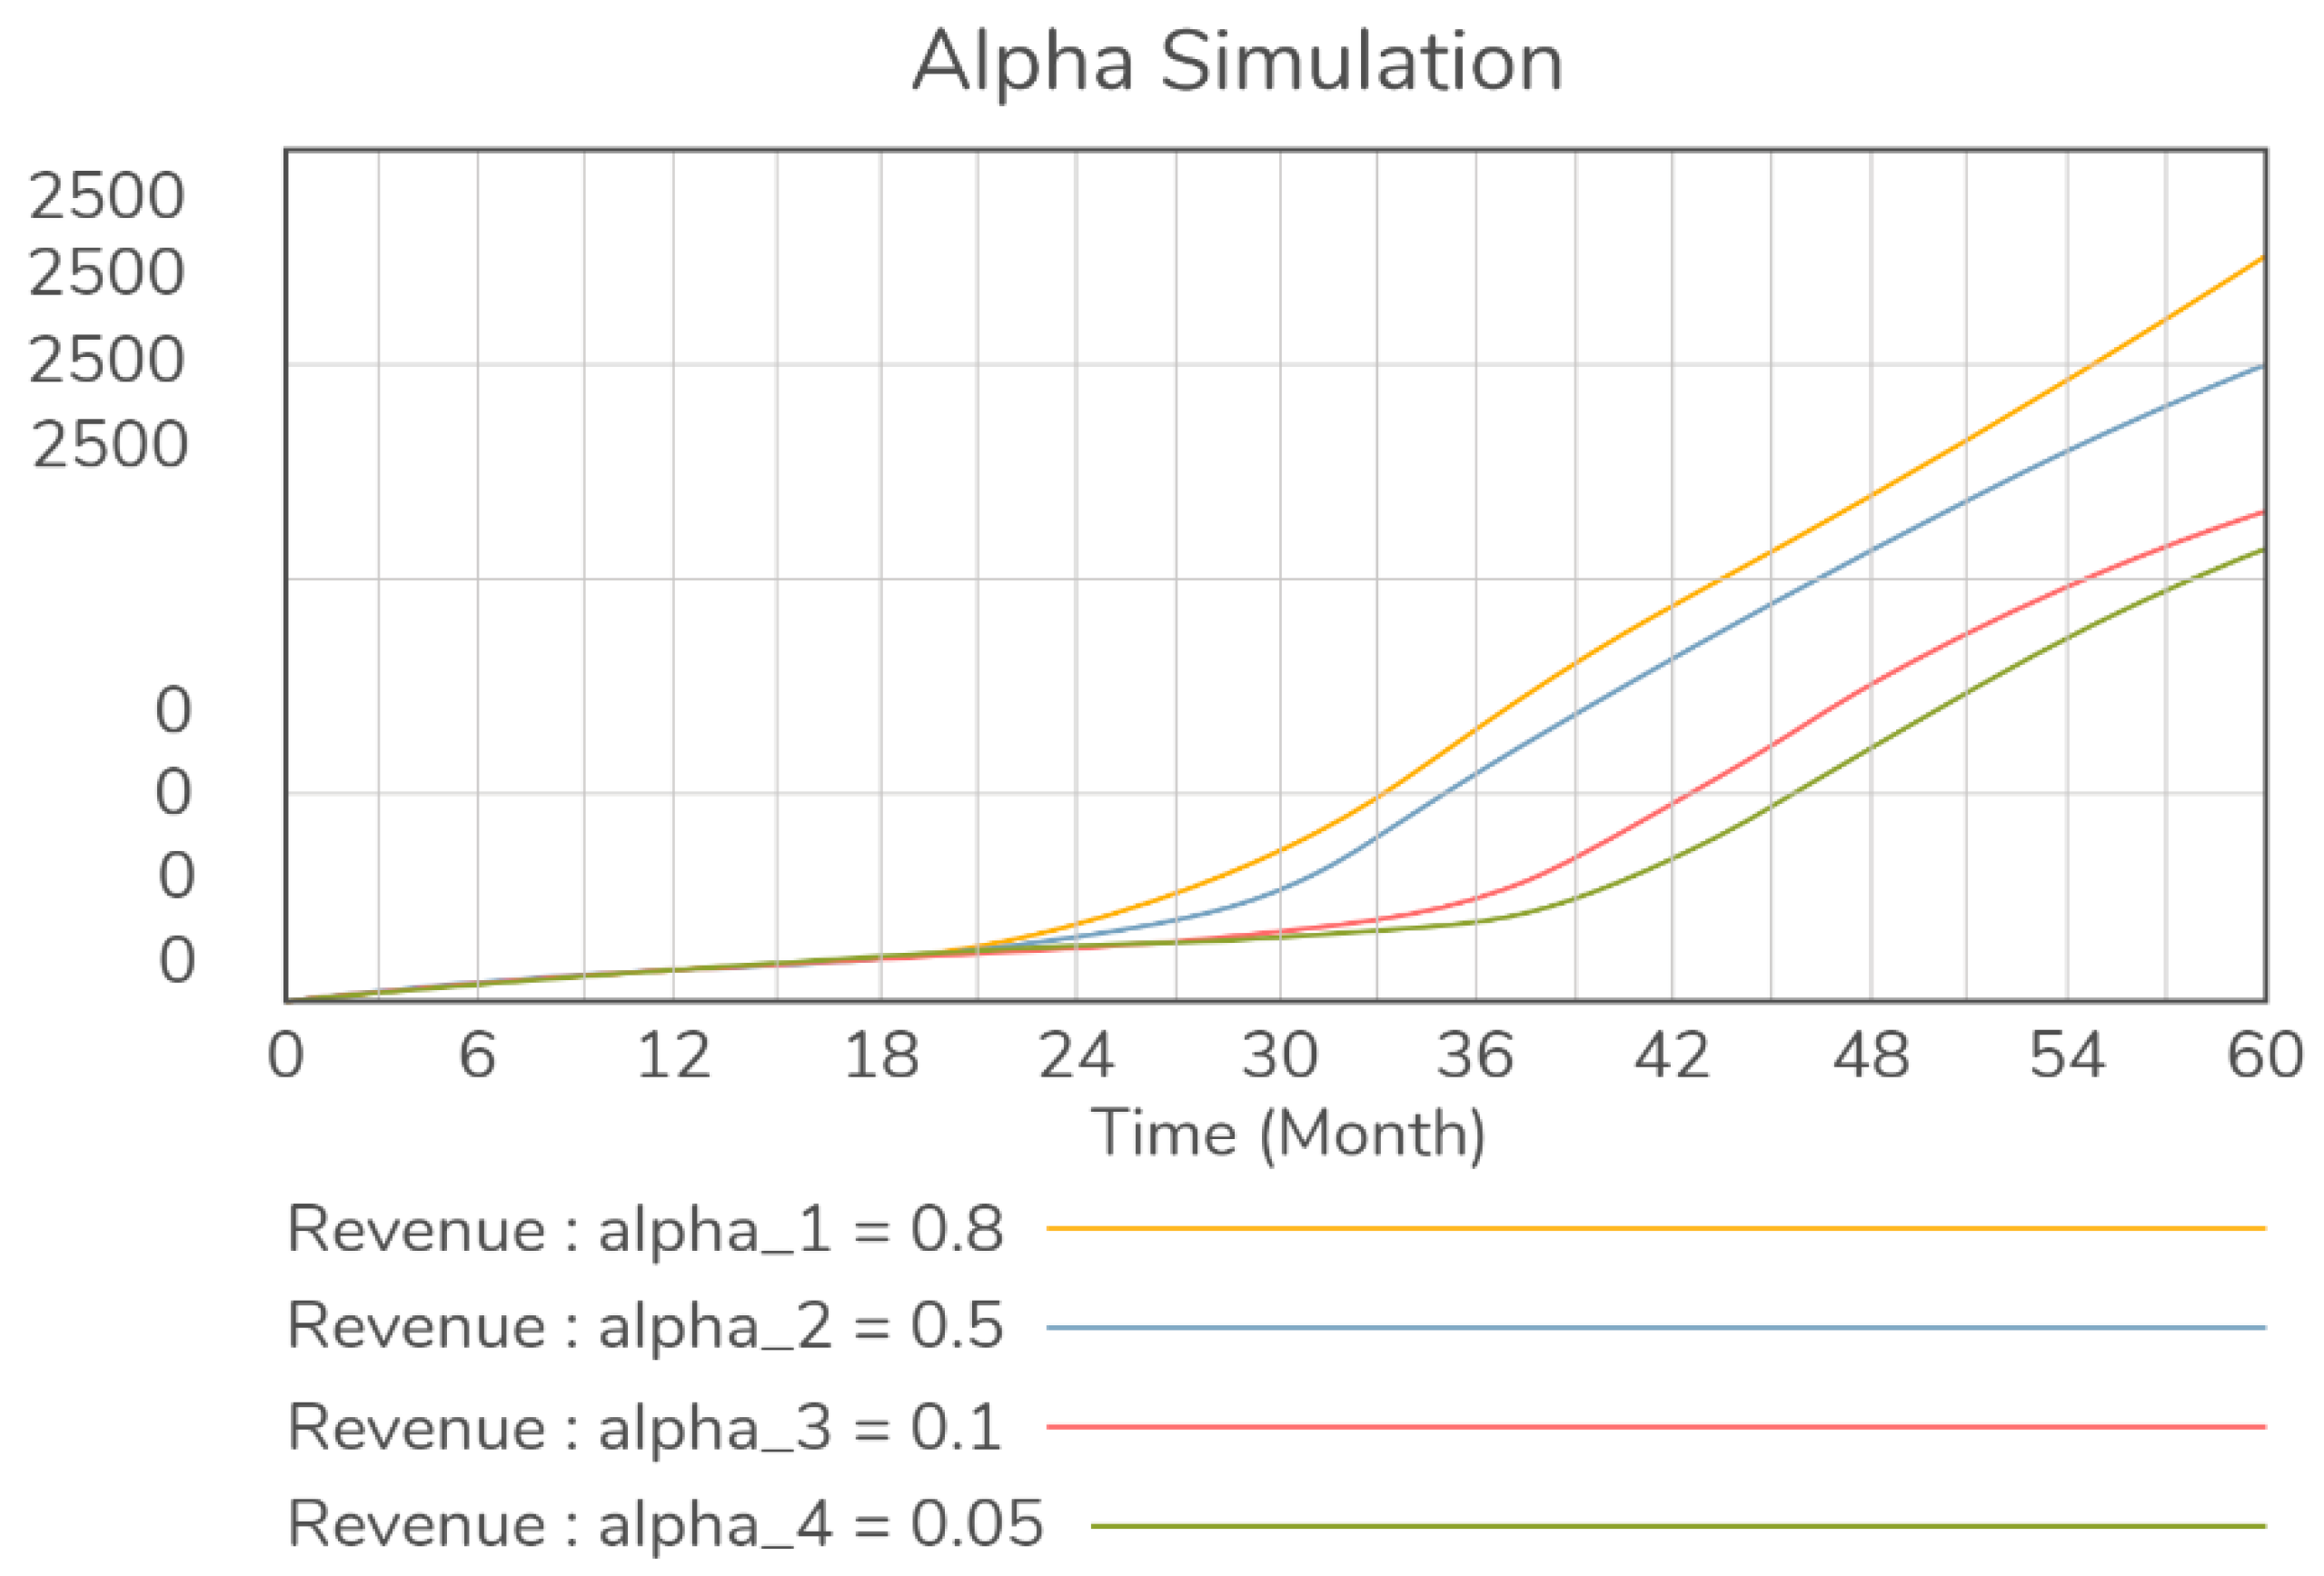
4.5. Scenario 3: BMI for Key Partners Simulation
The BMI simulates four different alphas, 0.8, 0.5, 0.1, and 0.05, and the following
Figure 7 clearly shows that a higher alpha will increase revenue. This is because alpha represents JoinRate, a dummy variable that links IP-Sharing and Key Partners. Therefore, the simulation is consistent with scenario 1, in which the OI adoption will positively impact the company’s performance.
After two years, the simulation indicates that JoinRate impacts significantly on the company’s revenue. Since the company’s revenue will be higher if alpha is larger, more partners will speed up the company’s innovation performance by being active IP sellers or buyers. For example, the company might sell its IP if it does not fit with the current strategy. In contrast, the company might buy IP from partners if it complies with the strategy to upsurge revenue.
In contrast, the dummy variable, Loss Rate, represents the company’s ability to maintain a partnership as shown in
Figure 8. The OI success depends on the company’s manager, who must have strong dynamic capabilities. Finally, the DC integration is the most significant variable to decide the partnership sustainability.
The LR values start from 0.01, 0.05, 0.08, and 0.1. The assumption is that 10% is the maximum Loss Rate since the OI strategy will usually preserve the partnership to step up the innovation performance. The intriguing phenomenon from
Figure 8 is that up to three years, different Loss Rate does not significantly impact the company’s revenue. It signifies that partnership is arduous at the beginning, and losing partners is a common practice. After three years, the company must find the appropriate strategy to cultivate partnerships since they influence revenue remarkably.
4.6. Scenario 4: BMI for IP-Sharing Simulation
Success Rate is a dummy variable depicting the percentage of IP partnership between digital enterprises.
Figure 9 indicates that if Success Rate is high, then the revenue is also increased after two years. However, the impressive phenomenon is that a lower Success Rate (any number below 0.1) has a minor impact on revenue or remains the same. The simulation was performed for 0.8 (SR_1), 0.5 (SR_2), 0.1(SR_3), and 0.05 (SR_4), as specified below.
In opposition, the dummy variable, beta, represents the failure rate with the same logic for the revenue as described in
Figure 10.
If Fail Rate is high, then the revenue is stagnant after two years. However, the impressive phenomenon is that a higher Fail Rate (any number above 0.5) leads to a minor impact on revenue. The simulation was performed for 0.05 (beta_1), 0.1 (beta_2), 0.5 (beta_3), and 0.8 (beta_4), as specified below.
5. Discussion
5.1. SD Scenario 1: BMI for OI Simulation
There is no difference between the company using OI and not at the early stage, up to one year. However, after two years, the OI adoption impacts the company’s performance significantly. The increased performance indicator is the exponential revenue growth.
The simulation reveals that OI has a significant effect on the company’s performance, indicated by significantly growing revenue. The previous study found the importance of innovation capacity in accomplishing organizational competitive advantages and performance. Commercialization of knowledge and technology become strategic chances contributing to the company’s revenue. Therefore, innovation is the key factor to business survival and the central driving force of sustainable business development [
3].
Without OI, all companies are doing business as usual, and the risk is more manageable. In fact, established companies are avoiding OI since the activity comes with some risks. There are two significant risks: collaborative risks and ambiguity risks. Assigning innovation tasks to partners is one of the collaborative risks. On the other hand, lack of knowledge leads to epistemic uncertainty, which is a kind of ambiguity risk [
33].
During the VUCA era, managing risks has become standard practice. As a result, companies must change the way of running business activities by enhancing the appropriate organizational culture. In a volatile digital business environment, strong cultures lead to the organizational capability to foster innovativeness and agility in the treatment of employees, customers, suppliers, and others. Hence, partnership and sharing IP are new indicators to measure OI success. An OI-oriented culture will enable digital enterprises to become game-changing innovators and achieve more sustainable growth in emerging markets [
43].
The fourth industrial revolution increased competitive and globalized conditions driven by innovation. Consequently, most companies find it challenging to implement innovation within an isolated organization. Innovation is changing to become a co-creative process with knowledge circulating within the economic and social environment. Organizations must prepare innovation units available to all involved parties inside and outside boundaries. Therefore, selecting key partners to share knowledge (IP) is critical [
44].
For Scenario 1, there is some empirical evidence coming from a digital corporation and a startup. As the most prominent ICT company in Indonesia, Company-B is the OI leader with many programs. The simulation is identical to the Amoeba program, one of the corporate strategies in OI adoption. However, the program took two years to prove that it contributes to the company’s revenue significantly (Company-B).
“As the digital business director of the big ICT company, followed by being CEO of the logistic company, this study found that OI impacts are remarkable” (Company-B). The fastest way to generate exponential growth is by opening the company’s innovation. It will be too late if the company still believes in its internal innovation strength. Digital companies are facing high turbulence, either in technology or business. Therefore, OI is the solution to keep up with changes and stay alive.
Startups adopting OI will bring faster product development and various accesses to the market. The OI strategy enables significant revenue growth after some time. One or two years are required to adopt an OI culture. The culture will lead to an innovation ecosystem in particular ways (Company-C).
5.2. SD Scenario 2: BMI for OI Variables (IP Sharing and Key Partners) Simulation
Collaboration with the trusted network is not OI but a normal way of business. Therefore, the OI challenge is developing interactions with people or organizations that are unfamiliar from the beginning. For example, they come from suppliers, customers, cross-industry companies, startups, universities, research centers, venture capital, etc. [
36]. At the early stage, the unleashed IP sharing indicates a crisis among parties involved in OI activities.
The simulation pinpoints a transition period to adopt OI culture for digital companies, either corporates or startups. Co-creation is the crucial driver fostering the OI ecosystem within the company’s network; two years is the primary expected time for organizational changes. However, the time period will be different for each enterprise, especially firms of different sizes. For example, big corporations will take longer, and the OI activity might be in parallel with a change in management activity or the business process re-engineering. Big corporations also take risks to adopt OI since they must have a strong DC, which is costly. In contrast, startups are more flexible, but it still takes time to obtain a stable partnership due to their distinctive characteristics in detail.
The adaptation period is a limitation of OI since OI activities enlarge process coordination and implementation costs, and faults in routine workflows. The significant dependence on external knowledge and the loss of crucial knowledge control become reasons companies drop OI activities within two years. They realize that creating a partnership and sharing IP should be controllable to generate engine growth. Besides, building a partnership and sharing IP also cause risks of leaks of the company’s confidential information [
33].
Co-creation, the major OI activity, generates partnerships by sharing IP. However, OI requires new open business models for sharing and licensing IP. Business co-creation requires external participation with high complexity. Therefore, the process will be more difficult for OI adaptation [
14].
The low adoption rate of OI comes from cultural barriers. Different culture implies different concerns about risk-sharing and different attitudes regarding IP-sharing. The different size of organizations that conduct OI is another issue. If a key partnership (KP) is steady, the company will create new revenue streams and face more sustainable growth [
33].
The IP share simulation is suitable to describe the incubation program at Company-B, Indigo. The program started ten years ago, and it took more than three years to find the proper pattern. There is still a lack of knowledge to run such programs. Eventually, there were too many partners involved bringing their ideas, and Company-B found them inappropriate to its core business. After three years, Indigo limited external ideas and built incremental partnerships with more related startups. It is called the 3C program: connect–create–commerce (Company-B). The external IP usually solves some customer’ problems at the beginning. After few years, there will be many companies or startups that duplicate it. Since IP is no longer unique, it will decrease dramatically to a point where few are sustained with a definite competitive advantage (Company-B).
Startups have limited resources to maintain knowledge flows to support their competitive advantages. They must employ a cooperation breadth with partners. It will help them to generate a capability to identify more opportunities and technologies. IP sharing and partnership are divided into two modes, exploration and exploitation. The knowledge exploration will lead to a dramatic change while the knowledge exploitation leads to monotonic changes as seen from incremental revenue after two years (Company-C).
5.3. SD Scenario 3: BMI for Key Partners Simulation
A partnership’s success must be high enough compared to its failure. Otherwise, the OI collaboration is not adequate. OI activity consists of networking, coordination, cooperation, and collaboration. Therefore, the company’s capability must cover the inter-organizational collaboration process, the overall innovation process, and new collaborative knowledge.
If digital companies adopt OI, cultivating partnerships is easy. The key activity of OI is engaging in collaborative network models with business partners, customers, inventors, public institutions, universities, R&D centers. In other words, the collaborative network model is a kind of trade-off partnership.
The partnership has its challenges, either for big corporations or startups. For big corporations, the collaborative risk is more considerable than for startups. There are four collaborative risks in common: behavioral risks, risks in assigning tasks to partners, risks in selecting critical partners, and inefficient organizational collaboration status. Therefore, companies conducting OI must have the skills to manage the inter-organizational collaboration process [
33]. The skills are highly correlated to the strength of dynamic capabilities.
The partnership success will depend on the IP differentiation from the company’s core business. Join Rate represents the corporate action of being an active IP buyer or seller. The strategic partnership will directly impact the company’s revenue. It will need a few years to find the right partners (Company-B).
During the disruption era, digital companies will shorten the evaluation period for partnership to six months. However, the digital product will need two years to achieve technology maturity, contributing to sustainable growth. The life cycle of a digital product is approximately three to six months, but it will be matured at the eighth cycle (Company-B).
IP sharing will contribute significantly to startups if the partner opens its IP in detail. Otherwise, IP sharing does not impact revenue significantly. Therefore, companies adopting OI partners will need one or two years to succeed in partnership, indicated by sustainable growth. Besides, since OI leads to a competitive advantage, it is essential to maintain alliances. (Company-C).
5.4. SD Scenario 4: BMI for IP-Sharing Simulation
IP sharing is the key activity in OI to create more revenue streams. Nowadays, startups tend to be IP sellers to the corporations. This allows knowledge flow, in and out between organizations. Big corporations in Indonesia mostly use intellectual non-owned property as their additional strategic assets. Therefore, IP sharing is creating new revenue streams and increasing the learning capacity, developing a higher pace of innovation activity, enabling easier market entry, and adding differentiation.
The culture transformation is still a significant barrier for IP sharing due to different attitudes regarding IP sharing, various concerns about risk-sharing, and “Not Invented Here” (NIH) syndromes. However, IP-sharing will succeed if companies in a collaborative network can create a new model to organize, manage documents, and make available critical information regarding the innovation process [
33].
All those activities are feasible with the help of information technology. The OI digital platform is one of the practical tools to support IP-sharing or knowledge co-creation through its processes. In addition, the tool will find the appropriate partners to increase companies’ innovation performance [
30].
IP sharing comes from the knowledge co-created by OI activities. Ideally, companies develop a digital platform to conduct all OI processes. Starting from problem definitions, finding participants, and leveraging the collaboration result [
45]. Defining a problem requires the company’s dynamic capability of sensing. The sensing capability monitors and evaluates external innovation. The evaluation result might lead to choosing the emerging technology that aids the firm’s innovation performance.
The assessment of partnerships is a critical phase. First, the management must use its seizing capability to ensure that external innovation might increase its performance. IP-sharing is not only about the appropriate technology or knowledge but also the right partner with conducive characteristics. The last stage is the collaboration process. Hence, the company must empower its integrating capability to combine external and internal knowledge.
Company-B has a subsidiary company, MDI that evaluates all partnerships. The evaluation period is two or three years. After passing the evaluation period, MDI will select partners that significantly contribute to the company and add ownership. If partners pass the evaluation period, MDI will maintain the partnership for sustainable growth (Company-B).
The simulation showing two years to achieve a stable condition for IP success is logical. At the early stage, patenting IP is not practical since the companies involved are unclear about the detailed IP. Therefore, the IP success rate or the partner failure rate does not affect revenue significantly. After two years, companies sharing IP will find the best way to benefit from it and lead to sustainable growth. If companies achieve their first tipping point, then the IP-sharing and partnership will grow incrementally (Company-B).
OI is a key strategy to determine how startups defeat their competitors, especially for knowledge-intensive startups. At the early stage, companies lose control of their R&D. Hence, IP share and partnership will face some barriers before contributing to their revenue. However, startups need a few years to achieve significant growth if knowledge exploration is going well with their partners (Company-C).
5.5. Benchmarking: Alibaba
Alibaba is one of the top global digital companies that implemented an open business model (OBM). The key to success in implementing the OBM is overcoming complexity and balancing the force between complexity and the open culture that could lead to the company’s breakdown if not properly managed. Therefore, Alibaba developed an OBM feedback loop platform as its core strategy for business expansion. Established in 1999, Alibaba is the major e-market in China with more than 60% of the market share [
46].
Alibaba became a top global e-commerce company quickly since it implemented an open innovation strategy that combines the markets and technologies to create new business models in an ecosystem. Implementing OI, Alibaba strengthens its dynamic capabilities to “sense” and “seize” outbound opportunities that are embedded into an open innovation strategy to obtain a self-sustainable dynamic business model. As a result, the business dynamic positive feedback loop will lead to sustainable growth, simulated by revenue growth.
Alibaba developed its culture and vision as a platform company to build the Chinese economy, create social values, and improve the global economy and society rather than just earning money. It re-utilizes and expands an OI culture with its feedback loop to balance the complexity of the openness culture. Alibaba generated many OI business models with system dynamics in a simple technology-market business model quickly. Therefore, increasing OI strategy could be a chance to expanding the firm’s performance. However, the dynamic OI will increase complexity, i.e., OI costs, and it should be balanced with developing the firm’s growth.
5.6. Managerial Implications
Our results show how OI has a significant chance of improving the firm’s performance or decreasing the startup mortality rate for digital enterprises. Some firms must build a collaborative network and develop strategic partnerships to share their intellectual property.
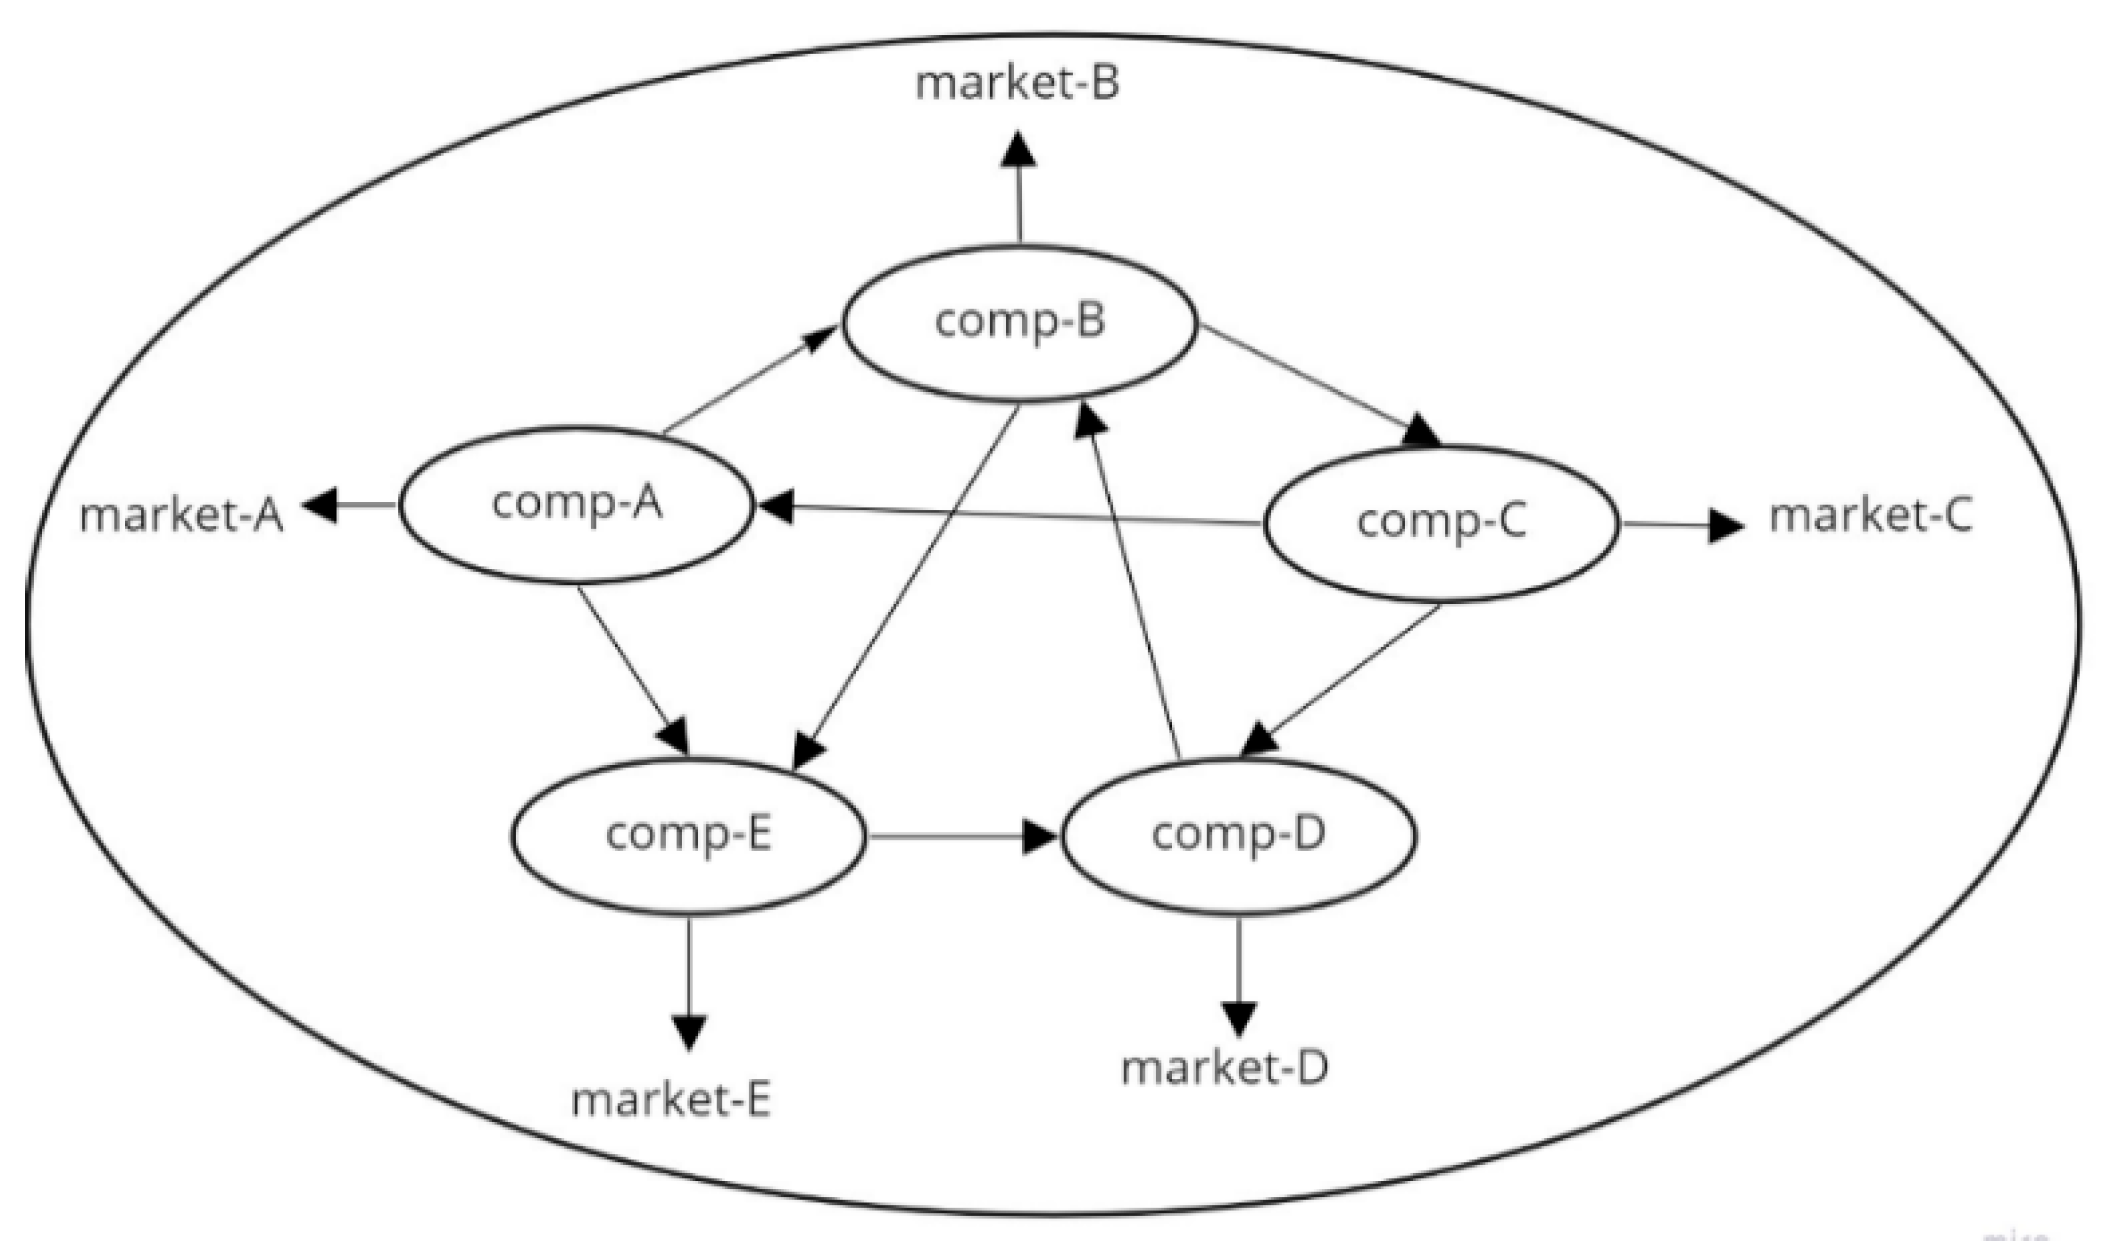
For instance,
Figure 11 displays a collaborative network consisting of five different companies in the OI ecosystem. All companies are co-innovating and running particular business models. Sometimes, they enter the same market, and other times they manage their market but involving other companies within the network. The following graphic depicts how the collaborative network contributes to a sustainable business for all companies.
Hence, any business transaction within a company will contribute to others. Therefore, each company within the network has a big chance to achieve sustainable growth.
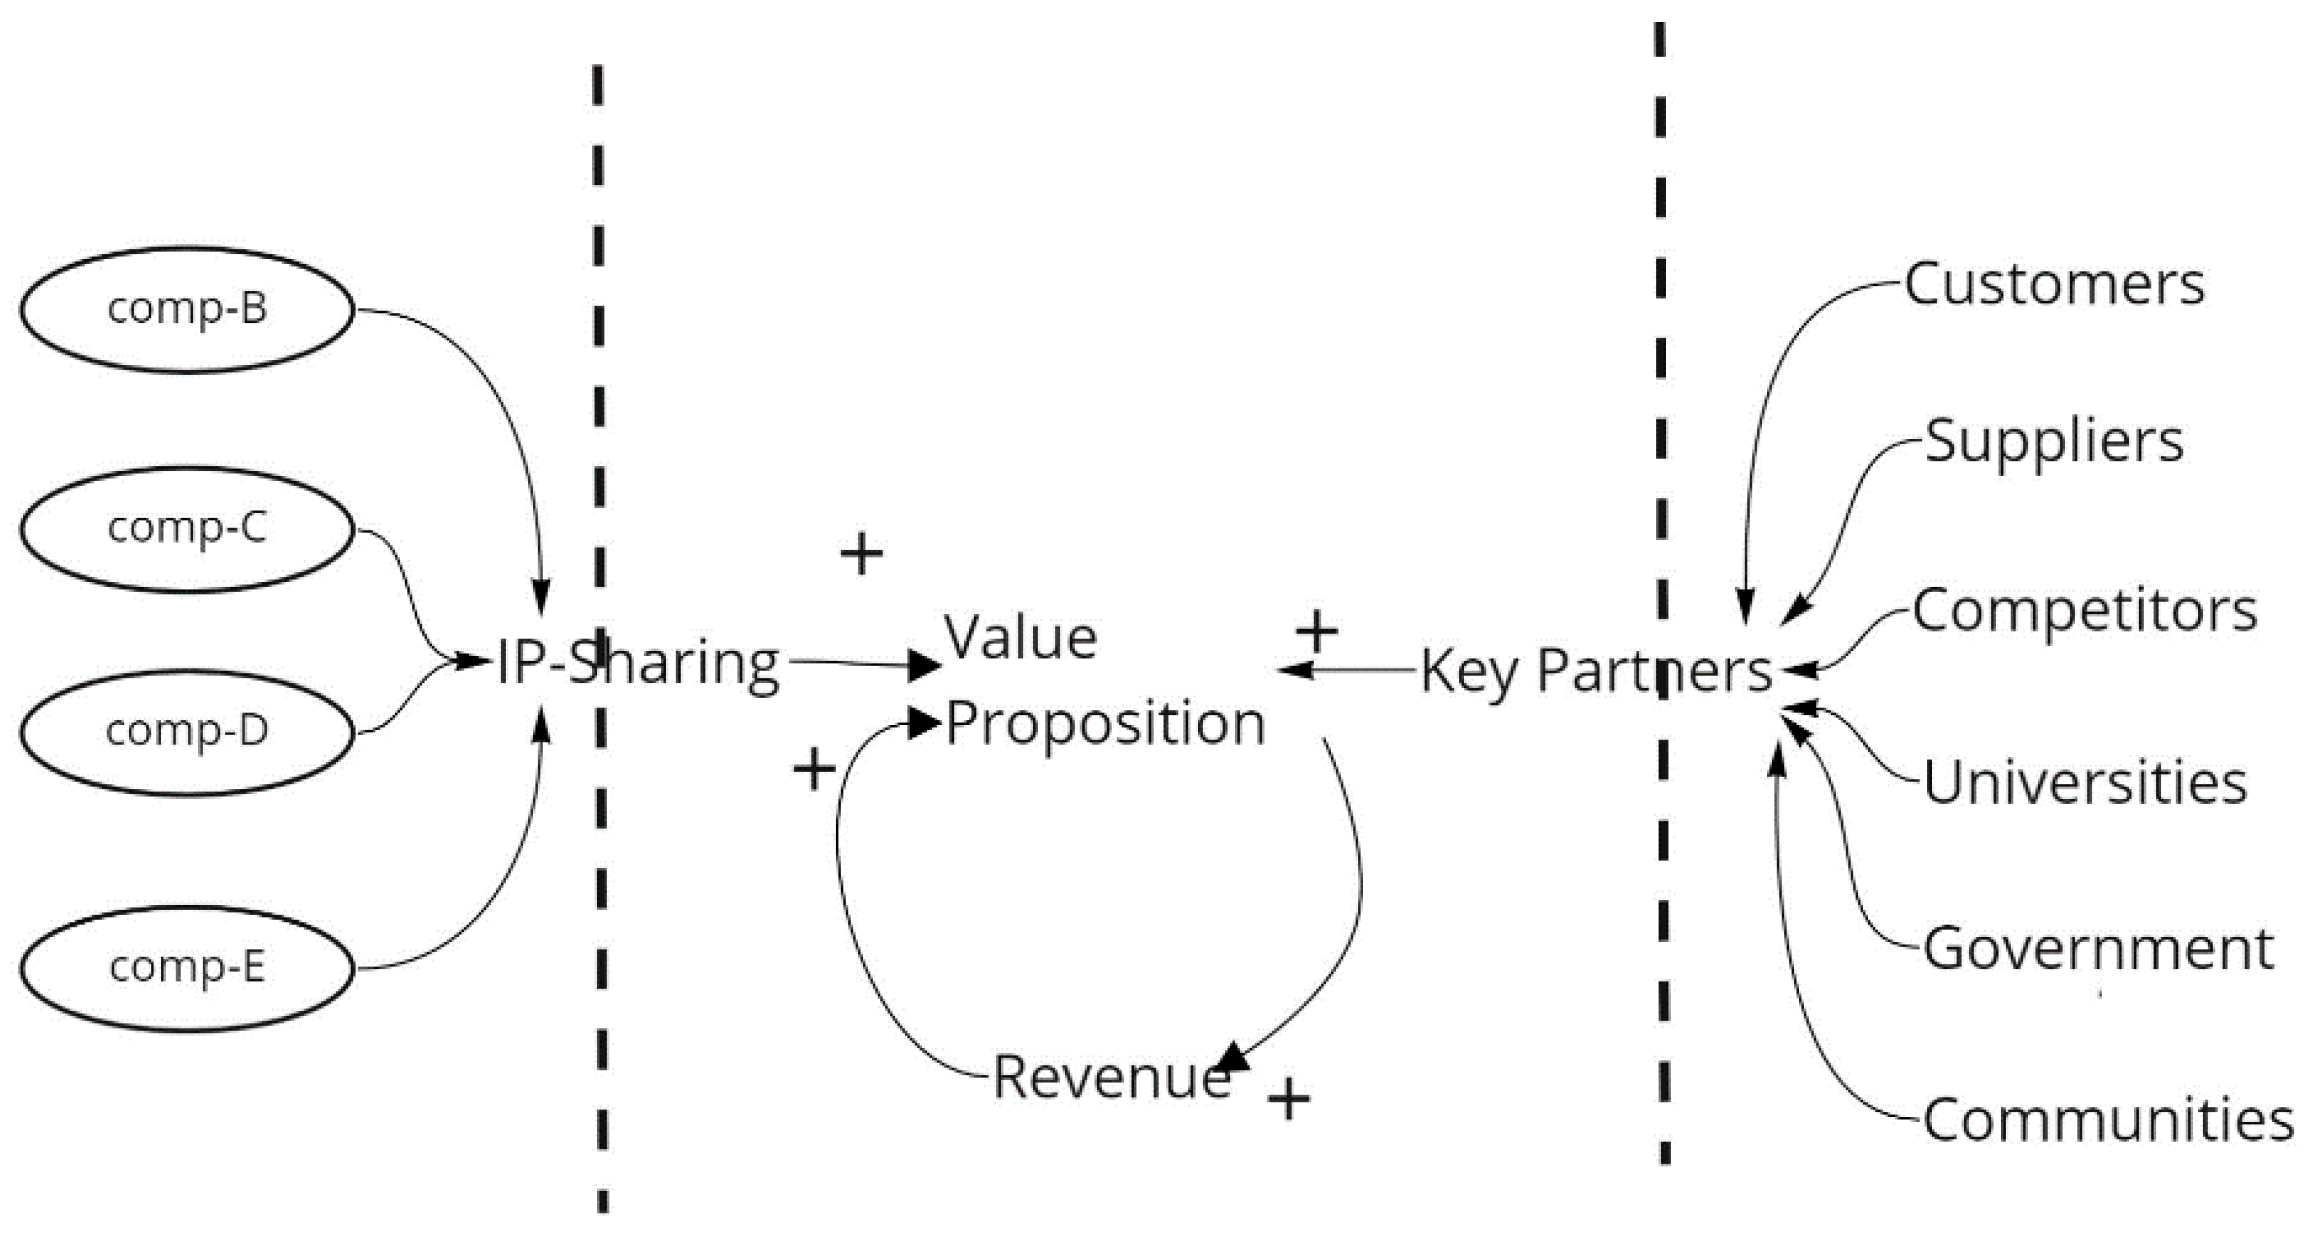
The causal model describing a suitable OI ecosystem might be fit for digital enterprises. From a business model perspective,
Figure 12 represents the business model platform that might display how partnership cultivates an OI ecosystem to achieve sustainable growth.
The business model platform describes how companies might increase their revenue as long as they adopt OI and remove barriers. Co-creation is the most important driving factor to achieve the OI goals. The causal model between revenue and value propositions displays a positive feedback loop, and becomes the company’s engine of growth.
6. Conclusions
Digital startups choose OI collaboration from an early stage to share risk and IP with other parties. The more parties involved, the lower capital investment is required. OI is implemented in the company’s strategy by collaborating with customers and suppliers. OI implementation speeds up the platform ecosystem by fostering the collaborative network effect to achieve sustainable growth.
The simulation reveals that OI has a significant effect on the company’s performance, indicated by significantly growing revenue. Startups adopting OI will bring about faster product development and various accesses to the market. The OI strategy enables considerable revenue growth after some time. One or two years are required to adopt an OI culture.
The external IP usually solves some customers’ problems at the beginning. After few years, there will be many companies or startups that duplicate it. Since IP is no longer unique, it will decrease dramatically to a point where a few are sustained with a strong competitive advantage. Startups have limited resources to maintain knowledge flows in supporting their competitive advantages. They must employ a cooperation breadth with partners. This will help them to generate the ability to identify more opportunities and technologies.
The partnership success will depend on the IP’s differentiation from the company’s core business. Join Rate represents the corporate action of being an active IP buyer or seller. The strategic partnership will directly impact the company’s revenue. It will need a few years to find the right partners. The partnership’s success must be high enough compared to its failure, otherwise the OI collaboration is not adequate. IP sharing will contribute significantly to startups if the partner opens its IP in detail. Otherwise, IP sharing does not impact revenue significantly. Therefore, companies adopting OI partners will need one or two years to succeed in partnership indicated by sustainable growth.
The study develops a BMI to show how OI variables significantly contribute to the engine of growth for digital companies. The simulation showing two years to achieve a stable condition for IP success is logical. At the early stage, patenting IP is not practical since the companies involved are unclear on the detailed IP. Therefore, the IP success rate or the partner failure rate does not affect revenue significantly. After two years, companies sharing IP will find the best way to benefit from it which leads to sustainable growth. OI is a key strategy to determine how startups defeat their competitors, especially for knowledge-intensive startups. At the early stage, companies lose control of their R&D. Hence, IP-sharing and partnership will face some barriers before contributing to their revenue.
The COVID-19 pandemic is still occurring at the time of this research. It is generating more challenges for Indonesian digital startups where the digital transformation gap is enormous. For digital companies, it would be better to operate in an OI ecosystem and a collaborative network. The more startups involved, the better the growth of the network. They must strengthen their dynamic capabilities to integrate OI into their business models.
The study contributes to OI and BM concepts in digital companies. The government, as a regulator, must pay attention to business actors by formulating regulations that provide full support for business progress and sustainability.


