Article

Exploring the Factors Affecting Technology Transfer in Government-Funded Research Institutes: The Korean Case

1
Cyber Security Team, Korea Institute of Science and Technology, Seoul 02792, Korea
2
Human Resources Management, Korea Institute of Science and Technology, Seoul 02792, Korea
3
Academic Support Team, Korea Institute for Advanced Study, Seoul 02445, Korea
*
Author to whom correspondence should be addressed.
J. Open Innov. Technol. Mark. Complex. 2021, 7(4), 228; https://doi.org/10.3390/joitmc7040228
Submission received: 25 July 2021 / Revised: 27 October 2021 / Accepted: 28 October 2021 / Published: 25 November 2021

Abstract

:
Based on the resource dependence theory and the resource-based view, this study examined the impact of the resources and capabilities of government-funded research institutes (GRIs) on technology transfer. Panel analysis was performed on 21 GRIs in South Korea representing three mission types—basic future leading, public infrastructure, and industrialization—for the 2015–2019 period. The analysis confirmed that the factors affecting technology transfer performance differed among GRIs depending on their mission type. For basic future leading GRIs, the number of technology transfer cases was strongly associated with the number of research personnel, while there was a negative relationship between technology transfer and the total budget, the number of research publications, and the number of patent registrations. None of the variables affected the revenue from technology fees. Researchers at these GRIs appear to have a strong motivation for technology transfer, but the priority for resource allocation at the institutional level is the production of papers and patents rather than technology transfer. For public infrastructure GRIs, the number of patents held and the number of technology licensing office (TLO) personnel had a positive impact on the number of technology transfer cases, while none of the variables affected the revenue from technology fees. Thus, the number of patents is more favorable for technology transfer at this type of GRI compared to those that pursue a mission of basic future leading, possibly because their research focus is more related to engineering than to basic science. For industrialization GRIs, the number of TLO personnel affected the number of cases of technology transfer, and the number of patent registrations and TLO personnel affected the revenue from technology fees. The speed of technology development and industrial application is thus much faster in industrialization GRIs than in the other GRI types. The results of this analysis show that mission attributes are important drivers of technology transfer performance. This study thus offers policy implications by illustrating those different resources should be provided to different types of GRI to optimize their technology transfer performance.

1. Introduction

Since the Bayh-Dole Act was enacted in 1980 in the United States, the perception that science and technology, specifically scientific knowledge and technological inventions, are resources owned by those who developed them has grown throughout the world. The economic value that these resources can generate has become particularly important, and accordingly, science and technology have emerged as one of the most important drivers of a country’s economy and development [1]. In this context, technology transfer activities are encouraged in order to implement innovations [2,3,4], and research and development bodies around the world have expanded their capabilities for technology commercialization, which accompanies technology transfers through licensing [5,6,7,8,9].
To facilitate a country’s innovation, it is important to analyze factors affecting technology transfer in its research and development organizations, and there is indeed a body of international literature on the subject. However, to the best of our knowledge, most research has been conducted with a focus on universities [8,10,11,12,13,14,15,16,17], and studies on factors affecting technology transfer in government-funded research institutes (GRIs) are rare. GRIs are an important subject to analyze in terms of technology transfer because they are dedicated to research on innovation, such as strategic technology development for economic growth and science and technology advancement [18,19]. To this end, it is important to identify how technology transfer operates in GRI settings, which is currently relatively unknown.
This study seeks to fill this research gap with empirical evidence on the contribution of resources and capabilities to GRIs’ technology transfer performance by analyzing panel data of 21 GRIs in South Korea (hereafter Korea) from 2015 to 2019. Based on the combined theoretical framework of resource dependence theory and the resource-based view, this paper identifies and defines variables—research resources, research capabilities, and performance diffusion capabilities, as well as technology transfer performance—by examining a novel dataset from Korea’s National Research Council of Science and Technology, whose mission is to support and manage GRIs in the field of science and technology. To prevent overgeneralization, GRIs are divided into three groups by their distinct mission types—basic future leading, public infrastructure, and industrialization. This paper answers specific research questions: Will there be differences in technology transfer performance over time for GRIs with different mission types? Will there be differences in the main factors that influence technology transfer performance depending on the GRI mission type?
As a result of the analysis, it was confirmed that the factors affecting technology transfer differed by mission type. In basic future leading GRIs, technology transfer was negatively related to the total budget, number of research publications, and number of patent registrations, while the number of technology transfer personnel and technology transfer cases had a strong positive relationship. No variables affected the technology fee revenue. Although researchers in these GRIs seem to have a strong motivation for technology transfer, the priority for resource allocation at the institutional level is the production of papers and patents rather than technology transfer. In public infrastructure GRIs, the number of patents held and the number of TLO personnel had a positive effect on the number of cases of technology transfer, and no variables affected the technology fee revenue. Thus, the number of patents is more advantageous for technology transfer in this type of GRI than in those pursuing a basic future leading mission, perhaps because their research focus is more related to engineering than to basic science. In industrialization GRIs, the number of TLO personnel affected the number of technology transfer cases, and the number of patent registrations and TLO personnel affected the technology fee revenue. Therefore, the speed of technology development and industry application is much faster than in other GRI types.
This paper adds to the existing literature not only by analyzing the factors affecting technology transfer in GRIs but also by expanding the current understanding of how influential factors differ by their mission attributes. This paper provides policy implications by suggesting that different resources should be provided to different types of GRIs to optimize their technology transfer performance.

2. Literature Review and Hypotheses

2.1. Resource Dependence Theory and Resource-Based View

Gray [20] defined cooperation as a process in which “stakeholders from different perspectives on the same problem explore each other’s differences and seek solutions beyond their limits.” Mayo [21] perceived it as “a process by which an individual or organization combines human, physical, and resources to achieve its objectives.” Similarly, Hagedoorn [22] defined research cooperation as the process of exploiting the resources and knowledge possessed by two or more different organizations. Although the values underlying industry-academic cooperation cannot be consistent with the goals pursued by companies, universities, and research institutes, industry-academic cooperation can be discussed from sociological and economic perspectives considering the common macroscopic objective of the creation of tangible and intangible socio-economic value [23].
A number of specific theories have been used to describe industry-academic cooperation, including the resource dependence theory (RDT) and the resource-based view (RBV). The RDT describes the cooperative and dependent relationship with external organizations from the perspective of organizational environmentalism, while the RBV describes organizational competitiveness in terms of comparative advantages [24]. Several prior studies, including Powers [25], Shin [26], and Jung [27], have attempted to interpret inter-organizational cooperation based on the RDT, whereas Landry [28], Harman [29], Powers [25], and Arya [30] utilized the RBV. The RBV has also been useful in explaining the cooperation between public organizations, such as universities, research institutes, and companies [25,30].
The RDT posits that organizations must acquire the necessary resources through appropriate decision-making processes to overcome environmental uncertainty [31]. These resources are the source of organizational performance and competitive advantages, and the ability to acquire critical resources has a significant influence on success in the market [32]. The RDT is also important with regard to cooperative industry–academic relationships involving companies, universities, and research institutes. This is because, if complementary resource relationships exist, cooperation can maximize the creation of new value by reducing costs and increasing efficiency through the shared use of resources [33]. Thus, from the perspective of the RDT, industry-academic cooperation actively responds to the environment through interaction via the industry-academic cooperative resources held by public organizations, such as universities and research institutes.
The RBV emphasizes the strategic resources and capabilities of an organization based on Penrose’s proposition [34] that a company’s resources should be viewed as a whole [35]. Differences in corporate performance can thus be attributed to the characteristics of the resources held by individual companies, and it is believed that continuous capacity building is achieved through the use of unique resources [35,36,37,38]. In particular, it is believed that valuable, rare, imperfectly imitative, and non-substitutable resources provide a sustainable competitive advantage for a firm [34,37].
Branco [39] studied the impact of university labs on the type of industry-academic cooperation and its productivity using the RBV and found that human resource capabilities in science and technology were a driver of industry-academic cooperation performance. In addition, Cho [40] approached the factors that encourage the establishment of university spin-offs in terms of “human competence” based on the RBV, while Kim [40] demonstrated the impact of four types of internal resources: material, financial, manpower, and organizational. In addition, Yun [41] empirically analyzed the technology transfer performance of GRIs in science and technology by investigating research resources, research capabilities, and performance capabilities.
In the present study, variables that have been identified as major influences on technology transfer performance in previous empirical studies, such as manpower, budget, the number of published papers, patent registration, the number of technology licensing office (TLO) employees, and the TLO budget, were grouped into (1) research resources, (2) research capabilities, or (3) performance diffusion capabilities based on the RDT and the RBV to identify the impact factors for the technology transfer performance of GRIs.

2.2. Hypotheses

This paper investigates all 21 GRIs related to science and technology in Korea to identify the factors that impact technology transfer performance using panel data over five years, from 2015 to 2019. In Korea, various studies have investigated the factors influencing technology transfer [42,43,44,45,46], but research on GRIs has only recently begun to draw attention [45,47], and there has been some ambiguity in the interpretation of the analysis results, as previous literature has reported that the quantitative input of organizational resources into GRIs is not proportional to their quantitative performance [48] and that GRI performance depends on the nature of the institution or its particular mission [49,50]. This may be because GRIs differ in their specific missions, but it could also be due to the budget structure, which is greatly influenced by changes in government and R & D policies. Based on an analysis of the technology change index of GRIs, Yoon [48] reported that no GRIs responded appropriately to external environmental changes. In 2017, the year that the Moon Jae-in government came into power, the Ministry of Science, ICT, and Future Planning became the Ministry of Science and ICT; the position of Science and Technology Advisor to the President was established, and the Science, Technology, and Innovation Office was created. In national R & D programs in Korea, individual ministries have strong control over subordinate planning/management agencies, and projects are created according to the situation and needs of individual departments, decreasing efficiency [47,51]. Based on this prior research, GRIs were classified into three mission types (Table 1) for this analysis: basic future leading, public infrastructure, and industrialization. Panel data analysis was conducted over the five years from 2015 to 2019, with 2017, the year when the government changed, as the mid-point.
The following hypotheses were developed for each GRI mission type:
Hypothesis 1.
There will be differences in technology transfer performance over time for GRIs with different mission types.
Hypothesis 1-1.
There will be differences in the number of technology transfer cases over time for GRIs with different mission types.
Hypothesis 1-2.
There will be differences in the revenue generated by technology transfer over time for GRIs with different mission types.
Hypothesis 2.
There will be a difference in the main factors that influence technology transfer performance depending on the GRI mission type.
Hypothesis 2-1.
There will be a difference in the main factors that influence the number of technology transfer cases depending on the GRI mission type.
Hypothesis 2-2.
There will be a difference in the main factors that influence the revenue generated by technology transfer depending on the GRI mission type.

3. Materials and Methods

3.1. The Context of Analysis

Korea is a country with world-class levels of R & D investment and with a high level of GDP [52]. According to government figures, Korea’s national research and development (R & D) budget for 2021 was KRW 27.4 trillion (approximately USD 24.7 billion). This represents an increase of about KRW 3.2 trillion from KRW 24.2 trillion in the previous year, accounting for 13.14% of the total. Given that Korea’s GDP growth rate in 2020 was −1.0% (Bank of Korea, 2021) due to the COVID-19 pandemic, the government’s commitment to fostering science and technology appears to be strong.
Government innovation support systems are considered an important factor in innovation performance [53]. The GRI is one of the main subjects of the national innovation system and is established and operated to promote the development of the national economy by innovating national science and technology and strengthening national competitiveness [54,55,56]. In Korea, there are 21 government-funded research institutes (GRIs) related to science and technology. Although the budget and the number of researchers in GRIs have continuously increased, it is difficult to draw a definitive conclusion judgment on public satisfaction with their performance [57]. The productivity of GRIs has faced constant criticism from academia and the media, and there have been calls for the restructuring or consolidation of these GRIs to reduce national spending. Thus, GRIs need to take on a new role that promotes efficiency and productivity because they benefit from public funding [58,59]. In particular, the government needs to identify GRIs that perform well and those that do not [58,60]. It is important to improve the efficiency and research performance of national research and development investment by efficiently managing and utilizing the research performance of GRIs through an optimal assessment system [54,61,62,63].
In this context, this study seeks to identify factors affecting technology transfer with a focus on Korea’s GRIs. A prior study that analyzed factors that affect technology transfer in GRIs based on the RDT had limitations, as it analyzed GRIs collectively [41]. In addition, some studies have analyzed R &D performance factors for GRIs by mission type, but research on the factors influencing technology transfer performance, which has become increasingly important, is insufficient [49]. Therefore, in this study, we analyzed factors affecting technology transfer in GRIs by their mission type. The factors affecting technology transfer performance were classified as research resources, research capacity resources, and performance diffusion capabilities based on the RDT and RBV.

3.2. Data Source

Korea’s National Council of Science and Technology has been providing detailed quarterly statistics on its 21 GRIs since 2009. Panel data were obtained from this institution to identify research resources, research capabilities, and performance diffusion capabilities from 2015 to 2019. Table 2 lists the descriptive statistics of the variables used for analysis.

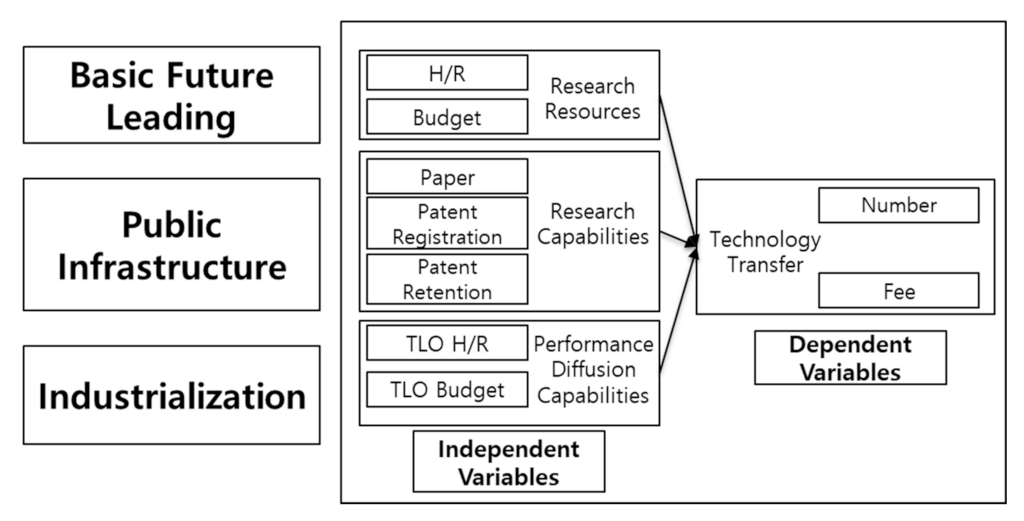
3.3. Dependent Variable

The legal definition of technology transfer is the transfer of a technology from the technology holder to another person or organization via direct transfer, permission to implement the technology, technical guidance, joint research, a joint venture, or a merger (Article 2 of the Act on the Promotion of Transfer of Technology Commercialization) [64]. Recently, technology transfer has been interpreted as the integrated transfer of techniques, knowledge, technology, production methods, and facilities [65]. Technology transfer is carried out in various ways, including formal technology transfer contracts, joint research, the dispatch of technical personnel, advisory meetings, and discussions [66]. Technology transfer can be the first step toward technology commercialization, which is a means to exploit technology resulting from research for either production or consumption activities so that the researcher can gain profit from the activity [67,68]. The dependent variable in the present study was technology transfer performance, which was measured using the number of cases of technology transfer and the revenue from technology fees.

3.4. Independent Variable

According to the RDT and RBV, improving technology transfer performance requires the maximization of resources and capabilities and the strategic use of internal and external resources. Various analyses have investigated the capabilities and available resources of universities and research institutes, and they can be classified into tangible and intangible resources. Tangible resources include financial assets, such as manpower, buildings, and land, and intellectual property, such as patents, copyrights, organizational structure, decision-making methods, policies, networks, and members’ experience, expertise, knowledge, and know-how [37,69,70,71,72]. These tangible and intangible resources can in turn be classified as research resources, research capabilities, and performance diffusion capabilities.

3.4.1. Research Resources

Research resources, such as the size of a university or research institute, the number of research personnel, and the size of the research budget, have generally been found to have a positive impact on technology transfer performance [15,17,73,74]. Studies have reported that research funds contribute to an increase in technology transfer and technology fees [75]. In general, large-scale organizations have a large number of professional personnel and a larger budget for R & D, resulting in more published papers, patents, and practical models [16,17,76,77]. However, Chung [78] showed that research funds can have a negative impact on technology transfer and that the number of researchers has no statistical significance. Yun [41] also found that research personnel and budget positively affected the number of papers and patents, which are the primary products of R & D, but that the direct impact on technology transfer and technology fees was limited. In the present study, the number of research personnel and the institutional budget were selected as influential research resources.

3.4.2. Research Capabilities

Past research on universities has reported that the number of research papers published has a positive relationship with technology transfer and technology fees [42,43,79]. However, a study of 50 universities and 34 government research institutes in Korea found no statistical significance in this relationship [78], and another study that analyzed 1222 national R & D projects reported that the number of research papers affects technology transfer but not technology fees. In addition, an analysis of research firms derived from GRIs showed that the number of research papers had a negative impact [73]. Patents have been found to have a positive impact on technology transfer performance [42,43,75,78,80]. However, Kim [43] found that the impact on technology transfer varies depending on the type of patent (domestic and international). In the present study, the number of papers, patent registrations, and patent retention were selected as influential research capabilities.

3.4.3. Performance Diffusion Capabilities

The organizational capabilities related to technology transfer include the TLO’s history and proficiency [81], the TLO’s size and staffing [43,82], and the expertise and experience of the dedicated workforce [82,83,84]. The TLO has been shown to have a positive impact on technology transfer [8,41,45,73,78,85], though this can depend on whether the number of licenses or fees are used to measure technology transfer. When technology transfer is measured by the number of licenses, the TLO appears to have a positive effect [10,11,17], but research based on technology fees has reported that TLO size has a negative effect [11]. The expertise of TLO personnel has been shown to have a positive impact on the number of cases of technology transfer, but there was no statistically significant relationship with technology fees [17]. So [45] found that the number of TLO professionals did not affect technology transfer but that the age of the TLO was significant. The age of the TLO, the specialties of TLO personnel, and the degree of utilization of technology transfer manuals have also been reported to affect technology transfer performance, and the actual performance of the TLO is also an important factor [44]. However, an analysis of GRIs found that TLO personnel and their budget only have a partial positive impact on technology transfer and that their statistical significance is not clear [41]. In the present study, the number of TLO employees and the TLO budget were utilized as variables to evaluate performance diffusion capabilities.

3.5. Methodology

In this study, the following research model was established according to the resource dependence theory (RDT) and the resource-based view (RBV) theory.
The technology transfer performance of GRIs was assessed to determine if there were any significant differences and implications according to the mission type. To achieve this, a research model was established to analyze the effects of research resources, research capabilities, and performance diffusion capabilities on the technology transfer performance of the GRIs (Figure 1).
In this study, changes in the technology transfer performance of GRIs with one of three mission types from 2015 to 2019 were then analyzed. Following this, panel data from 2015 to 2019 were analyzed using fixed- and random-effects models.
Panel data analysis was introduced in 1938 when Lazarsfeld and Fiske first used it in the field of social science. This panel data analysis method is a cross-sectional time-series model that complements and modifies the limitations of cross-sectional data in the process of quantitative analysis. Panel data analysis is effective in analyzing dynamic changes assuming the heterogeneity of data. In the process of analyzing quantitative data, cross-sectional analysis and time-series analysis have limitations in predicting dynamic changes in cross-sectional and time-series models caused by data heterogeneity. However, panel data analysis is effective in predicting dynamic changes in panel data models by controlling panel data heterogeneity [86].
Fixed-effects and random-effects models alleviate endogeneity problems that may arise by assuming unobserved characteristics and allow accurate parameter estimation. The Hausman test shows which of the two models is more suitable for analysis. The null hypothesis of the Hausman test is that ‘the random effect model is more suitable’; if rejected, the fixed-effects model is used, and if accepted, the random-effects model is used [87].
As a statistical analysis tool, STATA 14, which is widely used in quantitative analysis models with panel data, was used in the study.

4. Results

4.1. Analysis Method

4.1.1. Basic Statistical Analysis by Year

Changes in technology transfer performance, research resources, research capabilities, and performance diffusion capabilities for the 21 GRIs during the period 2015–2019 are summarized in Table 3. All the factors except for the TLO budget increased from 2015 to 2017, and all items except for the revenue from technology fees and the number of patents held decreased in 2018.

4.1.2. Statistical Analysis by Type

Annual statistical analysis was conducted to identify differences in the technology transfer performance for each mission type. The statistical analysis results for the number of technology transfer cases by mission type from 2015 to 2019 are presented in Table 4.
For basic future leading GRIs, the number of cases of technology transfer decreased over this period, while those in public infrastructure and industrialization GRIs decreased from 2018 to 2019. The statistical analysis results for technology fee revenue are displayed in Table 5. The revenue for basic future leading GRIs fell from 2018 to 2019, while public infrastructure and industrialization GRIs exhibited a steady increase from 2015 to 2019.

4.1.3. Panel Analysis

Basic Future Leading GRIs

For basic future leading GRIs, the model with the number of technology transfer cases as the dependent variable revealed that, of the research resource variables, the number of research personnel, the size of the institutional budget, and the number of patent registrations were significant (Table 6). In particular, the variables related to the research personnel had a strong positive impact, with an increase in the number of technology transfer cases of 11.06 when the number of research personnel increased by 1. In contrast, the institutional budget, number of research publications, and number of patent registrations had a negative impact on the number of technology transfer cases. When revenue from technology fees was used as the dependent variable in the model, the results were not significant. For basic future leading GRIs, variables other than research personnel had no or negative effects on technology transfer. This suggests that the research personnel in basic future leading GRIs have a strong fundamental motivation for technology transfer, but this does not generate revenue in the short term.
Basic future leading GRIs are established to create future growth engines by conducting research with high risk at the national level that typical companies cannot attempt. Thus, these GRIs generally carry out long-term and large-scale research projects. This means that even with technology transfer, they tend not to generate significant revenue in the short term.
The negative impacts of the size of the institutional budget, the number of research publications, and the number of patent registrations on the number of cases of technology transfer indicate that technology transfer is not a reliable indicator of the value of basic future leading GRIs. At the institutional level, resources are preferentially assigned to research publications and patent registration, which reduces the incentive for technology transfer. This also suggests that papers and patents are not linked to technology transfer in the short term. In addition, the fact that performance diffusion capabilities do not affect the number of technology transfer cases and revenue from technology fees suggests that the role of TLOs in basic future leading GRIs is not significant.
After Vannevar Bush famously said in Science the Endless Frontier that basic research is performed without thought of the practical end, the term “basic research” became widely used around the world. Basic science became a subject of policy interest when the Basic Science Research Promotion Act was enacted in 1989. However, unlike Bush’s definition, the draft of the promotion act in 1988 stated that the purpose of basic science is to develop industrial technology and promote science and culture. Korea had a tendency to recognize the purpose of fostering basic science as a means of economic development rather than academic development.
Thus, as implied by the name of the Korea Institute of Science and Technology, one of the basic future leading institutions, science has almost always been linked with technology, which implicitly gave rise to the perception that it supports industrial and economic development [88]. Researchers still display this tendency, even though the institutions to which they belong were classified as basic future leading organizations in 2014.
Korea’s per capita GDP growth rate fell rapidly from 7.2 percent annually in the 1990s to 4.6 percent annually in the 2000s, strengthening the national perception that it should pursue fundamental academic progress rather than short-term industrial advancement for national competitiveness. This led to the classification of some of the GRIs as basic future leading organizations in 2014. The government aimed to improve GRIs’ competitiveness by investing in activities for each purpose. Basic future leading GRIs had to focus on pure research, basic purpose research, and research based on source knowledge rather than applied research. Among the indicators defining research performance, the proportion of research papers and patents has naturally increased with the decrease in the amount of technology transfer through direct contact with the industry.

Public Infrastructure GRIs

For the model with the number of technology transfer cases as the dependent variable, the number of patents and the number of TLO personnel were found to be positively and significantly related in public infrastructure GRIs. In particular, when the number of patents owned by a GRI increased by 1, the number of technology transfer cases increased by 3.87, and when the number of TLO staff increased by 1, the number of cases increased by 4.22. However, for basic future leading GRIs, the model with revenue from technology fees as the dependent variable did not produce significant results for any of the variables (Table 7).
The positive impact of the number of patents and TLO personnel on the number of technology transfer cases suggests that the patents produced by public infrastructure GRIs are more practical than those developed by basic future leading GRIs. Public infrastructure GRIs are designed to produce public infrastructure, such as large-scale research equipment and facilities that can support R & D, rather than directly pursuing R & D and technology commercialization. Patents related to the development of equipment and facilities are more likely to be associated with engineering than basic science and thus may be more advantageous for technology transfer. On the other hand, none of the assessed variables affected the revenue from short-term technology fees due to the specificity of the public infrastructure GRIs and the lower importance of short-term profit seeking.
Technology readiness levels (TRLs) are a systematic metric/measurement system that supports assessments of the maturity of a particular technology and the standardized comparison of maturity between different types of technology [89]. TRLs were first defined in seven stages by NASA, which then expanded to nine in 1995. TRLs can be used to manage the risk of immature technology development, to have a common understanding of the current location of technology, or as a basis for chief executive officers’ decision making regarding technology investment [90].
Basic research corresponds to TRL 1, and research applying the developed technology is described as TRL 2. The demonstration of prototypes and their functionality in the laboratory and other environments can reach or exceed TRL 3. Thus, the field of applied research and actual facility construction is more in line with the technology required by the industry; one interpretation of this observation is that patents in public infrastructure research institutes that seek applied science and prototypes are more advantageous for technology transfer than patents in basic future leading research institutes that pursue basic science.

Industrialization GRIs

The model for the number of technology transfer cases revealed that the number of TLO personnel had a significant impact in industrialization GRIs (Table 8). The reason that the number of TLO personnel significantly affected the number of technology transfer cases is closely related to the mission of industrialization GRIs, which involves fractalization and support for small- and medium-sized enterprises. This means that their technology should be commercialized quickly to generate profit, and this is positively affected by the institution’s research resources and performance diffusion capabilities.
In addition, unlike basic future leading and public infrastructure GRIs, in the model with revenue from technology fees as the dependent variable, the number of patent registrations and the number of TLO personnel were found to have a significant positive impact. In industrialization GRIs, patent registrations are more closely related to technology transfer, which means that as technology advances, older or outdated patents are more likely to lose their competitiveness, and new patents can be applied directly to related industries, directly contributing to profit generation. The positive effect of TLO personnel on technology fees may be due to the nature of the technology possessed by industrialization GRIs, with technology transfer leading to increased technology fees in the short term.
Technological progress is rapidly developing at a rate that mankind has never experienced, and the entire industry is being drastically reorganized by disruptive technology [91]. Industrialization research institutes that need to keep track of the speed of development in these industries are faster in development and industrial application than basic future leading or public infrastructure research institutes, and the role of timely intermediation of technology, enabling the direct application of registered patents to the industry, can be an important factor in technology transfer. Thus, the role of TLO’s dedicated personnel as a technology trader is greater than that in other types of research institutes.

4.2. Hypothesis Testing

The number of technology transfer cases increased until 2017 in public infrastructure and industrialization GRI and then declined thereafter. The basic future leading GRIs show a continuous decline in the number of technology transfer cases from 2015 to 2019 (Table 9). For the public infrastructure and industrialization GRIs, this may be due to rapid changes in the domestic environment at the time due to the change in the government. All of the GRIs focused on short-term quantitative performance until 2017, but with the change in government, science- and technology-related institutions were reorganized, possibly encouraging GRIs to pursue their own qualitative goals in the longer term after 2017. Revenue from technology fees rose until 2017 in basic future leading GRIs and then declined, while that in public infrastructure and industrialization GRIs has grown since 2017. This indicates that basic future leading GRIs have focused on other achievements, such as papers and patents, not on technology fees, and public infrastructure and industrialization GRIs have concentrated more on technology fees than on the number of technology transfers. Therefore, hypothesis 1-1 was rejected, and hypothesis 1-2 was accepted.
When classifying GRIs according to their mission type, the factors that affected the actual number of technology transfer cases differed (Table 10). In the panel data analysis of the number of technology transfer cases for each mission type, research resources (i.e., the number of researchers and total budget) and research capabilities (i.e., the number of research papers and the number of patent registrations) affected the number of technology transfer cases for basic future leading GRIs. For public infrastructure GRIs, research capabilities (i.e., the number of patents held) and performance diffusion capabilities (i.e., the number of TLO personnel) affected the number of technology transfer cases. The number of technology transfer cases for industrialization GRIs was influenced by performance diffusion capability resources (i.e., the number of TLO personnel).
The factors that affected the revenue from technology fees also differed by the mission type (Table 10). The revenue from technology fees was not significant for the basic future leading and public infrastructure GRIs. However, research capabilities (i.e., the number of patent registrations) and performance diffusion capabilities (i.e., the number of TLO personnel) had a positive effect in industrialization GRIs. Therefore, both hypotheses 2-1 and 2-2 were accepted.
The results of the hypothesis test are as follows (Table 11).

5. Conclusions

5.1. Results

There is no doubt that the research productivity of GRIs should be enhanced to strengthen national R & D competitiveness and to meet public expectations. One of the key indicators of research productivity is technology transfer performance, and thus, strategies need to be developed to improve this factor. The first step is to objectively and scientifically analyze the factors that impact technology transfer in GRIs.
Based on the RDT and RBV, the present study examined the impact of GRI resources and capabilities on technology transfer by mission type using panel analysis. The research subjects were 21 science and technology GRIs (excluding affiliated institutes) under the administration of the National Council of Science and Technology. Given that individual GRIs have specific performance missions and roles and vary in their operational strategies to enhance their internal resources and capabilities, the GRIs were grouped into three mission types based on the classification by the Ministry of ICT and Future Planning in 2014: basic future leading, public infrastructure, and industrialization. The independent variables were grouped into research resources, research capabilities, and performance diffusion capabilities, and the dependent variables were the number of technology transfer cases and revenue from technology fees. The present study also conducted a panel analysis of data from 2015 to 2019, with this period selected because the government changed in 2017.
The analysis confirmed that the factors affecting the technology transfer performance of GRIs differed depending on their mission type. For basic future leading GRIs, the numbers of research personnel and technology transfer cases were strongly correlated, while the total budget, the number of research publications, and the number of patent registrations were all negatively correlated with the number of technology transfer cases. None of the assessed variables had an effect on the revenue from technology fees for this type of GRI. For public infrastructure GRIs, the number of patents and the number of TLO personnel had a positive impact on the number of technology transfer cases. As in basic future leading GRIs, no variables affected the revenue from technology fees. For industrialization GRIs, the number of TLO personnel positively affected the number of technology transfer cases, and the number of patent registrations and TLO personnel had a positive association with the revenue from technology fees.
This study confirmed that the Ministry of Science, ICT, and Future Planning’s criteria for the classification of GRI duties lead to significant differences in the economic performance of GRIs. For basic future leading GRIs, researchers are strongly motivated to participate in technology transfer, but the priorities for resource allocation at the institutional level are papers and patents rather than technology transfer. The number of patents is more important for technology transfer in public infrastructure GRIs than in basic future leading GRIs. This can be attributed to the fact that these GRIs are more strongly focused on engineering than basic science. The speed of technological development and industrial application is much faster in industrialization GRIs than in the other mission types.

5.2. Discussions

The policy implications of this study are as follows, presented by the type of institution. In order to promote technology transfer, basic future leading institutions should find ways to link researchers’ motivation for technology transfer or research papers and patents to technology transfer rather than expanding the size of TLO. Exceptional support should be provided for researchers’ technology start-ups, and more information on the technology possessed by institutions should be disclosed through the media or other means. In order to promote technology transfer, it seems important for public infrastructure institutions to increase the number of patents held through continuous application research rather than expanding the size of TLO. To this end, incentives should be concentrated on patent registration rather than thesis performance in evaluating affiliated researchers. Industrialization institutions should maximize the registration rate of new patents each year in line with the rapidly changing environment of external industries and focus on expanding TLO personnel specialized in technology trades.
This study limited its analysis of economic performance to technology transfer; thus, it is necessary to analyze whether companies that receive transferred technology exhibit higher sales or job creation. Open innovation is the use of purposive inflows and outflows of knowledge to accelerate internal innovation, and expand the markets for external use of innovation, respectively [92]. In terms of open innovation dynamics, it is possible to consider whether companies use the transferred knowledge to strengthen internal innovation engines or external innovation capabilities through commercialization [92]. In addition, the number of direct start-ups established based on new technology should be considered. Similarly, in addition to the seven independent variables selected as potential factors influencing GRI technology transfer performance, other factors should be considered. For example, a more comprehensive understanding of GRI performance can be achieved if technology transfer compensation schemes for researchers, the composition of technology transfer experts (patent attorneys, technology traders, Ph.D. holders, etc.), and the ratio of in-lab researchers to administrators are analyzed. Overall, the present study can be used as a foundation for further research with the aim to produce more strategic and practical suggestions to enhance the technology transfer performance of GRIs.

Author Contributions

Conceptualization, S.K., W.K. and K.L.; methodology, S.K., W.K. and K.L.; software, S.K. and K.L.; validation, S.K., W.K. and K.L.; formal analysis, W.K. and K.L.; investigation, S.K., W.K. and K.L.; resources, S.K. and W.K.; data curation, S.K. and K.L.; writing—original draft preparation, S.K. and W.K.; writing—review and editing, W.K. and K.L.; visualization, W.K.; supervision, K.L. All authors have read and agreed to the published version of the manuscript.

Funding

This research received no external funding.

Institutional Review Board Statement

Not applicable.

Informed Consent Statement

Not applicable.

Data Availability Statement

3rd Party Data, Restrictions apply to the availability of these data. Data was obtained from Korea’s National Council of Science and Technology.

Conflicts of Interest

The authors declare no conflict of interest.

References

  1. Zhang, J.L.; Xu, W.W.; Yang, T.; Lai, I.K.W.; Wong, L.P. Robots–Stimulating Interest and Motivating Learning in Science and Technology. In Proceedings of the 2018 International Symposium on Educational Technology (ISET), Osaka, Japan, 31 July–2 August 2018; pp. 226–229. [Google Scholar]
  2. Gabriel, V.; Sorin, A. Suport de Curs Instrumentele de Lucru Ale Managerului de Inovare, AROTT. 2012. Romanian Association for Technology Transfer and Innovation. Available online: http://www.arott.ro/ (accessed on 3 November 2021).
  3. Lobontiu, G.; Petrovan, A. Empirical Evidences of New Technologies Adoption in Romanian Industrial Firms. In Proceedings of the LIMEN 2015 (Leadership & Management: Government, Enterprise, Entrepreneur) Conference, Belgrade, Serbia, 10 December 2015; pp. 302–309. [Google Scholar]
  4. Mioriţa, U.; Nicolae, P.; Nicolae, U. Innovation and Technology Transfer for Business Development. Procedia Eng. 2016, 149, 495–500. [Google Scholar]
  5. Lach, S.; Schankerman, M. Royalty sharing and technology licensing in universities. J. Eur. Econ. Assoc. 2004, 2, 252–264. [Google Scholar] [CrossRef]
  6. Lee, K.; Jung, H.J. Does TTO capability matter in commercializing university technology? Evidence from longitudinal data in South Korea. Res. Policy 2021, 50, 104133. [Google Scholar] [CrossRef]
  7. Markman, G.D.; Gianiodis, P.T.; Phan, P.H.; Balkin, D.B. Innovation speed: Transferring university technology to market. Res. Policy 2005, 34, 1058–1075. [Google Scholar] [CrossRef]
  8. Siegel, D.S.; Waldman, D.; Link, A. Assessing the impact of organizational practices on the relative productivity of university technology transfer offices: An exploratory study. Res. Policy 2003, 32, 27–48. [Google Scholar] [CrossRef] [Green Version]
  9. Thursby, J.G.; Thursby, M.C. Who is selling the ivory tower? Sources of growth in university licensing. Manag. Sci. 2002, 48, 90–104. [Google Scholar] [CrossRef] [Green Version]
  10. Rogers, E.M.; Yin, J.; Hoffmann, J. Assessing the Effectiveness of Technology Transfer Offices at US Research Universities. J. Assoc. Univ. Technol. Manag. 2000, 12, 47–80. [Google Scholar]
  11. Thursby, J.G.; Jensen, R.; Thursby, M.C. Objectives, Characteristics and Outcomes of University Licensing: A Survey of Major U.S. Universities. J. Technol. Transf. 2001, 26, 59–72. [Google Scholar] [CrossRef]
  12. Gregorio, D.D.; Shane, S. Why Do Some Universities Generate More Start-ups Than Others? Res. Policy 2003, 32, 209–227. [Google Scholar] [CrossRef]
  13. Chapple, W.; Lockett, A.; Siegel, D.; Wright, M. Assessing the Relative Performance of U.K. University Technology Transfer Offices: Parametric and Nonparametric Evidence. Res. Policy 2005, 34, 369–384. [Google Scholar] [CrossRef]
  14. Chukumba, C.; Jensen, R. University Invention, Entrepreneurship, and Start-Ups; NBER Working Paper No. W11475; National Bureau of Economic Research: Cambridge, MA, USA, 2005. [Google Scholar]
  15. O’Shea, R.P.; Allen, T.J.; Chevalier, A.; Roche, F. Entrepreneurial Orientation, Technology Transfer and Spinoff Performance of U.S. Universities. Res. Policy 2005, 34, 994–1009. [Google Scholar] [CrossRef]
  16. Lach, S.; Schankerman, M. Incentives and Inventions in Universities; NBER Working Paper No.9727; National Bureau of Economic Research: Cambridge, MA, USA, 2003. [Google Scholar]
  17. Caldera, A.; Debande, O. Performance of Spanish Universities in Technology Transfer: An Empirical Analysis. Res. Policy 2010, 39, 1160–1173. [Google Scholar] [CrossRef]
  18. Donaldson, L. The Contingency Theory of Organizations; Sage: Thousand Oaks, CA, USA, 2001. [Google Scholar]
  19. Han, S.; Park, S.K.; Kwak, K.T. Workforce Composition of Public R&D and Performance: Evidence from Korean Government-Funded Research Institutes. Sustainability 2021, 13, 3789. [Google Scholar]
  20. Gray, B. Collaborating: Finding Common Ground for Multiparty Problems, 1st ed.; Jossey-Bass: San Francisco, CA, USA, 1981. [Google Scholar]
  21. Mayo, M. Partnerships for Regeneration and Community Development. Crit. Soc. Policy 1997, 17, 3–26. [Google Scholar] [CrossRef]
  22. Hagedoorn, J.; Roijakkers, N.; Van Krznenburg, H. Inter-Firm R&D Networks: The Importance of Strategic Network Capabilities for High-Tech Partnership Formation. Br. J. Manag. 2006, 17, 39–53. [Google Scholar]
  23. Kim, S.J.; Choi, S.-O.; Lee, H.K. Studies of the Mediating Effects of University R&D Funding Factors Shows an affect on University Technology Transfer Performance. Korean J. Public Adm. 2016, 25, 57–77. [Google Scholar]
  24. Song, K.S.; Kim, J.W.; Ryu, T.M.; Kim, D.C.; Jang, S.I.; Cha, Y.S. Organization Theory; Sidaegachi: Seoul, Korea, 2019. [Google Scholar]
  25. Powers, J.B. Commercializing academic research: Resource effects on performance of university technology Transfer. J. High. Educ. 2003, 74, 26–50. [Google Scholar] [CrossRef]
  26. Shin, J.-Y.; Cho, C.-G.; Koh, Y.-K. An Empirical Study on the Determinant Factors of Logistic Partnership of manufacturers in Gyeongbuk-do Province. Korea Assoc. Int. Commer. Inf. 2010, 12, 123–152. [Google Scholar]
  27. Jung, K.; Seo, I.; Jang, H.S. The Exploratory Research for the Sustainability of Social Enterprise: Focusing on the Resource Dependent Theory. Korean Assoc. Policy Stud. 2013, 22, 171–202. [Google Scholar]
  28. Landry, M.; Traore, N.; Godin, B. An Econometric Analysis of the Effect of Collaboration on Academic Research Productivity. High. Educ. 1996, 32, 283–301. [Google Scholar] [CrossRef]
  29. Harman, G. Australian Science and Technology Academics and University–Industry Research Links. High. Educ. 1999, 38, 83–103. [Google Scholar] [CrossRef]
  30. Arya, B.; Zhiang, L. Understanding Collaboration Outcomes from an Extended Resource-Based View Perspective: The Roles of Organizational Characteristics. Patner Attributes, and Network Structures. J. Manag. 2007, 33, 697–723. [Google Scholar] [CrossRef] [Green Version]
  31. Jeffrey, P.; Salancik, G.R. The External Control of Organizations: A Resource Dependence Perspective; Harper and Row: Manhattan, NY, USA, 1978. [Google Scholar]
  32. Conner, K.R. A Historical Comparison of Resource-Based Theory and Five Schools of Thought within Industrial Organization Economics: Do We have a New Theory of the Firm? J. Manag. 1991, 17, 121–154. [Google Scholar] [CrossRef]
  33. Barringer, B.R.; Harrison, J.S. Walking a tightrope: Creating Value through Interorganizational Relationps. J. Manag. 2000, 26, 367–403. [Google Scholar] [CrossRef]
  34. Penrose, E. The Theory of the Growth of the Firm; Oxford University Press: Oxford, NY, USA, 1995. [Google Scholar]
  35. Wernerfelt, B. A Resource-Based View of the Firm. Strateg. Manag. J. 1984, 5, 171–180. [Google Scholar] [CrossRef]
  36. Miller-Millesen, J.L. Understanding the Behavior of Nonprofit Boards of Directors: A Comparative Theory-based Approach. Nonprofit Volunt. Sect. Q. 2003, 32, 521–547. [Google Scholar] [CrossRef]
  37. Barney, J.B. Firm Resources and Sustained Competitive Advantage. J. Manag. 1991, 17, 99–120. [Google Scholar] [CrossRef]
  38. Peteraf, M.A.; Barney, J.B. Unraveling the resource-based tangle. Manag. Decis. Econ. 2003, 24, 309–323. [Google Scholar] [CrossRef]
  39. Ponomariov, B.L.; Boardman, P.C. Influencing Scientists’ Collaboration and Productivity Patterns through New Institutions: University Research Centers and Scientific and Technical Human Capital. Res. Policy 2010, 39, 613–624. [Google Scholar]
  40. Cho, S.; Kang, K.H.; Kang, J. How Do Research Capabilities and Financial Resources Affect Professors’ Entrepreneurship?: Using the Speed of University Spin-off Formations. J. Technol. Innov. 2011, 19, 99–128. [Google Scholar]
  41. Yun, J.-H. Factors Affecting Technology Transfer of Government-funded Research Institutes. J. Korea Technol. Innov. Soc. 2017, 20, 519–545. [Google Scholar]
  42. Kim, C.-H.; Park, H.-W. The Role of Technology Valuation in Technology Transfer of Universities. J. Korea Technol. Innocation Soc. 2013, 16, 754–783. [Google Scholar]
  43. Kim, C.H.; Lee, S.D. A Study on Relationships between Performance of University-Industry Cooperations and Competency Factors of University. J. Korea Technol. Innov. Soc. 2007, 10, 629–653. [Google Scholar]
  44. Kim, K.-H.; Hyun, S.-H. Effects of Institutional Environments and Strategic Resources of University TLOs on Technology Commercialization. J. Small Bus. Innov. 2006, 9, 87–109. [Google Scholar]
  45. So, B.-W.; Yang, D.-W. The Empirical Study on Relationship between Intellectual Property Management Activities and Technology Transfer Performance of the University. Korean J. Bus. Adm. 2009, 22, 889–912. [Google Scholar]
  46. Jin, S.; Lee, K. Factors Affecting Technology Transfer of Universities in the LINC (Leaders in Industry-University Cooperation) Program of Korea. Sustainability 2021, 13, 27. [Google Scholar] [CrossRef]
  47. Cho, H.D.; Yoon, M.S.; Kim, S.W.; Jeong, Y.S.; Son, S.H. An Analysis of Korea’s National Supporting System of Basic Research and Policy Recommendations for Leading Creative R&D. STEPI Policy Research 2014–23; STEPI: Seoul, Korea, 2014. [Google Scholar]
  48. Yoon, H.-Y.; Kim, W.; Choi, S.O.; Kim, B.J.; So, H.S. Efficiency analysis of Technology Licensing Office(TLO) using DEA-Malmquist Productivity Index. Innov. Stud. 2020, 15, 93–124. [Google Scholar] [CrossRef]
  49. Jung, S.H.; Kim, S.T.; Lee, K.J. A Study on Intrinsic Factors on Performance of GFRIs in Science and Technology Fields. Korean J. Policy Anal. Eval. 2016, 26, 1–27. [Google Scholar]
  50. Ahn, S.; Lee, J.Y. Macroscopic Research Topography and Level Analysis using Performance Data of Government Funded Institutes. J. Korea Technol. Innov. Soc. 2020, 23, 478–504. [Google Scholar] [CrossRef]
  51. Hwang, B.Y.; Jun, H.J.; Chang, M.H.; Kim, D.C. A case study on the improvement of institution of “High-Risk High-Return R&D” in Korea. J. Open Innov. Technol. Mark. Complex. 2017, 3, 19. [Google Scholar]
  52. Jin, S.; Lee, K. The Government R&D Funding and Management Performance: The Mediating Effect of Technology Innovation. J. Open Innov. Technol. Mark. Complex. 2020, 6, 9. [Google Scholar]
  53. Kim, S.-J.; Kim, E.-M.; Suh, Y.; Zheng, Z. The effect of service innovation on R&D activities and government support systems: The moderating role of government support systems in Korea. J. Open Innov. Technol. Mark. Complex. 2016, 2, 5. [Google Scholar]
  54. Cha, N.; Hwang, J. How to Improve Performance and Diversity of Government-Funded Research Institute Ecosystem? Focus on Result Sharing and Feedback Policy. J. Open Innov. Technol. Mark. Complex. 2019, 5, 66. [Google Scholar] [CrossRef] [Green Version]
  55. Pavitt, K. The Social Shaping of the National Science Base. Res. Policy. 1998, 27, 793–805. [Google Scholar] [CrossRef]
  56. Kim, E.; Lee, D.; Kim, J.H. How Collaboration Networks Affect Innovation in Korea’s Information and Communication Technology Industry in the Era of Internet of Things. Asian J. Technol. Innov. 2016, 24, 201–221. [Google Scholar] [CrossRef]
  57. Baek, S.; Yi, Y. The Analysis of The Factors Affecting The Research Outcomes of Government-funded Research Institutes in Science and Technology. J. Korea Acad.-Ind. Coop. Soc. 2020, 21, 170–177. [Google Scholar]
  58. Hong, J.-Y.; Park, K. A Study on the Improvement of Research Efficiency and Productivity of Government-funded Research Institutes: Using DEA/Malmquist Analysis and Quadrant Analysis. J. Korea Technol. Innov. Soc. 2021, 24, 75–98. [Google Scholar] [CrossRef]
  59. Senker, J. Changing Organisation of Public-Sector Research in Europe–Implications for Benchmarking Human Resources in RTD. Sci. Public Policy 2001, 28, 277–284. [Google Scholar] [CrossRef]
  60. Coccia, M. New Organizational Behaviour of Public Research Institutions: Lessons Learned from Italian Case Study. Int. J. Bus. Innov. Res. 2008, 2, 402–419. [Google Scholar] [CrossRef]
  61. Gang, K.W.; Abetti, P.A. The Global Competitiveness of South Korea: The Role of Government-Funded Research Institutes. World Rev. Sci. Technol. Sustain. Dev. 2010, 8, 1–28. [Google Scholar] [CrossRef]
  62. Bourgeois, I.; Whynot, J.; Thériault, É. Application of an Organizational Evaluation Capacity Self-Assessment Instrument to Different Organizations: Similarities and Lessons Learned. Eval. Progr. Plann. 2015, 50, 47–55. [Google Scholar] [CrossRef] [PubMed]
  63. Kim, E.; Kim, S.; Kim, H. Development of an Evaluation Framework for Publicly Funded R&D Projects: The Case of Korea’s Next Generation Network. Eval. Progr. Plann. 2017, 63, 18–28. [Google Scholar] [PubMed]
  64. Seaton, R.A.F.; Cordey-Hayes, M. The development and application of interactive models of industrial technology transfer. Technovation 1993, 13, 45–53. [Google Scholar] [CrossRef]
  65. Barakia, Y.A.; Brent, A.C. Technology Transfer of Hand Pumps in Rural Communities of Swaziland: Towards Sustainable Project Life Cycle Management. Technol. Soc. 2013, 35, 258–266. [Google Scholar] [CrossRef] [Green Version]
  66. Link, A.N.; Siegel, D.S. Generating Science-Based Growth: An Econometric Analysis of the Impact of Organizational Incentives on University–Industry Technology Transfer. Eur. J. Financ. 2006, 11, 169–181. [Google Scholar] [CrossRef]
  67. Wicaksana, D.E.P.; Yunaristanto, Y.; Sutopo, W. Identification of Incubation Scheme by Incubator in University Innovation Center to Develop Indonesian Economy. In Proceedings of the Joint International Conference on Electric Vehicular Technology and Industrial, Mechanical, Electrical and Chemical Engineering (ICEVT & IMECE), Surakarta, Indonesia, 4–5 November 2015. [Google Scholar]
  68. Sutopo, W.; Astuti, R.W.; Suryandari, R.T. Accelerating a Technology Commercialization; with a Discussion on the Relation between Technology Transfer Efficiency and Open Innovation. J. Open Innov. Technol. Mark. Complex. 2019, 5, 95. [Google Scholar] [CrossRef] [Green Version]
  69. Galbreath, J. Which Resources Matter the Most to Firm Success? An Explotory Study of Resource Based Theory. Technovation 2005, 25, 979–987. [Google Scholar] [CrossRef]
  70. Hall, R. The Strategic Analysis of Intangible Resources. Strateg. Manag. J. 1992, 13, 135–144. [Google Scholar] [CrossRef]
  71. Hall, R. A Framework Linking Intangible Resources and Capabilities to Sustainable Competitive Advantage. Strateg. Manag. J. 1993, 14, 607–618. [Google Scholar] [CrossRef]
  72. Kim, Y.S.; Song, J.H.; Lee, E.H. Internationalization Strategy and Performance Analyses of Korean Universities: Based on Resource-Based View. Korean Soc. Econ. Financ. Educ. 2011, 20, 69–97. [Google Scholar]
  73. Jung, H.-J. The Factors Affecting Technology Commercialization of Government Research Institutes: The Case of Research Institute Spin-offs. J. Korea Acad.-Ind. Coop. Soc. 2016, 17, 74–82. [Google Scholar]
  74. Ok, J.-Y.; Kim, B.-K. Measuring the Performance of Technology Transfer Activities of the Public Research Institutes in Korea. J. Technol. Innov. 2009, 17, 131–158. [Google Scholar]
  75. Kim, M.-S.; Yeon, S.-M.; Kim, J.-S.; Lee, B.-H. Analysis of Factors Influencing the Performance of Technology Transfer on National R&D by Research Actors. Korea J. Contents 2015, 15, 559–570. [Google Scholar]
  76. Cho, H. A Study on the Performance Factors of Technology Commercialization of Universities in Korea in Terms of the Resources-based View. J. Intellect. Prop. 2012, 7, 217–245. [Google Scholar] [CrossRef]
  77. Park, K. The Determinants of Technology Transfer of Output from National R&D Program. J. Intellect. Prop. 2012, 7, 187–215. [Google Scholar]
  78. Chung, D.-B.; Jung, D.-D. The Effects of Performance Management & Application Capabilities and Activities on Technology Transfer from Public Research Institutes in Korea. Korea Soc. Innov. Manag. Econ. 2013, 21, 199–223. [Google Scholar]
  79. Nam, G.M.; Kim, D.G.; Choi, S.O. How Resources of Universities influence Industry Cooperation. J. Open Innov. Technol. Mark. Complex. 2019, 5, 9. [Google Scholar] [CrossRef] [Green Version]
  80. Lee, Y.J. Strategies for the Successful Technology Transfer from Public Research Institutes in Korea. Korea Soc. Innov. Manag. Econ. 2008, 16, 141–163. [Google Scholar]
  81. Franz, B.; Es-Sadki, N.; Arundel, A. The Effectiveness of Policies for formal Knowledge Transfer from European Universities and Public Research Institutes to Firms. Res. Eval. 2015, 24, 4–18. [Google Scholar]
  82. Conti, A.; Gaule, P. Is the US Outperforming Europe in University Technology Licensing? A New Perspective on the European Paradox. Res. Policy 2011, 123, 35. [Google Scholar] [CrossRef]
  83. Macho-Stadler, I.; Perez Castrillo, J.D.; Veugelers, R. Designing Contracts for University Spinoffs. J. Econ. Manag. Strategy 2008, 17, 185–218. [Google Scholar] [CrossRef]
  84. Yim, E.; Kim, C.; Cho, K. Job Roles and Performances of Industry-Academic Cooperation Foundation focused on Technology Commercialization and Startup-supporting Officers. J. Technol. Innov. 2013, 21, 115–136. [Google Scholar]
  85. Lee, S.S.; Kim, Y.K.; Lee, S. Analysis of Efficiency of Universities and PRIs in Technology Transfer and Its Determinants. J. Intellect. Prop. 2012, 7, 163–185. [Google Scholar] [CrossRef]
  86. Ahn, J.S.; Lee, M.H. The Effect of Special Rights of Real Estate Buyer on the Price Ratio of Real Estate Auction Process. J. Korean Urban. Manag. Assoc. 2019, 32, 129–144. [Google Scholar] [CrossRef]
  87. Kim, S.-G.; Kim, S.-H. Examining the Investment Determinants on the Regional Tourism Performance Using Panel Data. J. Tour. Stud. 2018, 30, 23–44. [Google Scholar] [CrossRef]
  88. Shin, H.-S.; Moon, M.-Y. Between Basic Science and Basic Research: Basic Science Development Policy and the Emergence of Basic Science Research Promotion Act. Korean Hist. Sci. Soc. 2020, 42, 247–273. [Google Scholar]
  89. Mankins, J.C. Technology Readiness Levels: A White Paper; NASA: Washington, DC, USA, 1995. [Google Scholar]
  90. Seo, J.H.; Jeon, G.-Y.; Jeon, H.-S. A Study on TRL Application to the Materials and Components Development Program. J. Korea Technol. Innov. Soc. 2007, 10, 789–807. [Google Scholar]
  91. Schwab, K. The Global Competitiveness Report 2013–2014: Full Data Edition. Available online: https://www3.weforum.org/docs/WEF_GlobalCompetitivenessReport_2013-14.pdf (accessed on 3 November 2021.).
  92. Chesbrough, H. Open innovation: A new paradigm for understanding industrial innovation. In Open Innovation: Researching a New Paradigm; Oxford University Press: Oxford, UK, 2006; pp. 1–19. [Google Scholar]
Figure 1. Research model for the factors affecting technology transfer by GRI mission type.
Joitmc 07 00228 g001
Table 1. Three mission types of GRIs.
TypesMissionsGRIs
Basic Future LeadingTo create future growth engines Korea Institute of Science and Technology (KIST), Korea Astronomy and Space Science Institute (KASI)
Public InfrastructureTo build big and sound public infrastructureKorea Basic Science Institute (KBSI), National Fusion Research Institute (NFRI), Korea Research Institute of Bioscience and Biotechnology (KRIBB), Korea Institute of Science and Technology Information (KISTI), Korea Institute of Oriental Medicine (KIOM), Korea Institute of Civil Engineering and Building Technology (KICT), Korea Railroad Research Institute (KRRI), Korea Research Institute of Standards and Science (KRISS), Korea Food Research Institute (KFRI), Korea Institute of Geoscience and Mineral Resources (KIGAM), Korea Aerospace Research Institute (KARI), Korea Atomic Energy Research Institute (KAERI)
IndustrializationTo conduct research on commercialization and support for small and medium-sized enterprisesKorea Institute of Industrial Technology (KITECH), Electronics and Telecommunications Research Institute (ETRI), Korea Institute of Machinery and Materials (KIMM), Korea Institute of Materials Science (KIMS), Korea Institute of Energy Research (KIER), Korea Electrotechnology Research Institute (KERI), Korea Research Institute of Chemical Technology (KRICT)
Table 2. Descriptive statistics.
VariablesMinimumMaximumMeanS/D
Number of Technology Transfers03683208.95577.01
Technical Fee Income1857,2904620.038802.19
Number of Researchers1442088506.98438.53
Total Budget (mil. KRW)56,774685,000214,887.6171,341.3
Number of Thesis Publications (SCI)14908225.96191.92
Number of Patent Registrations61852244.16296.70
Number of Patents Held5013,3691995.322486.64
Number of TLO Personnel 25410.169.84
TLO Budget (mil. KRW)9039,9634856.686427.06
N = 105.
Table 3. Results of the basic statistical analysis by year.
Classifications20152016201720182019
Dependent VariablesNTT41374962552340463819
TFA85,54796,63196,18596,475116,010
Independent VariablesNR11,53611,63111,66710,90110,980
TB4,490,0534,636,6534,937,3904,764,0164,673,450
NTP44944558468744285131
NPR50644995562749635470
NPH40,24840,32342,28543,41644,840
NTP218228222210189
TLOB112,078106,616103,439102,77895,051
(Unit for TB and TLOB: Mil. KRW).
Table 4. Number of cases of technology transfer for each GRI mission type (2015–2019).
Classifications20152016201720182019
Basic Future Leading253205166162145
Public Infrastructure563743951807695
Industrialization32623713431429982852
Table 5. Revenue from technical fees by GRI mission type (2015–2019).
Types20152016201720182019
Basic Future Leading51646868896281336148
Public Infrastructure15,48816,65116,83816,38919,653
Industrialization64,32571,38869,44871,05888,592
Table 6. Analysis results for basic future leading GRIs.
Independent VariablesModel 1. Dependent Variable = Number of Technology Transfers (Random Effect)Model 2. Dependent Variable = Technology Fee Income
(Fixed Effect)
Research
Resources
Number
of Researchers
11.06 ***−4.66
Total Budget−3.49 ***4.15
Research
Capabilities
Number
of Thesis
Publications (SCI)
−2.86 **3.32
Number
of Patent
Registrations
−2.17 *4.29
Number
of Patents Held
1.44−3.58
Performance Diffusion
Capabilities
Number of TLO Personnel0.97−2.20
TLO Budget−0.111.92
Cons−3.484.36
N1010
R2 within0.99800.9947
* p < 0.05, ** p < 0.01, *** p < 0.001.
Table 7. Analysis results for public infrastructure GRIs.
Independent VariablesModel 1. Dependent Variable = Number of Technology Transfers (Random Effect)Model 2. Dependent Variable = Technology Fee Income
(Fixed Effect)
Research
Resources
Number of Researchers0.07−1.02
Total Budget−0.840.15
Research CapabilitiesNumber of Thesis
Publications (SCI)
−1.660.38
Number of Patent
Registrations
−0.85−1.40
Number of Patents Held3.87 ***−0.94
Performance Diffusion
Capabilities
Number of TLO
Personnel
4.22 ***−1.26
TLO Budget−1.78−0.48
Cons0.282.48
N6060
R2 within0.33380.1982
* p < 0.05, ** p < 0.01, *** p < 0.001.
Table 8. Analysis results for industrialization GRIs.
Independent VariablesModel 1. Dependent Variable = Number of Technology Transfers (Random Effect)Model 2. Dependent Variable = Technology Fee Income
(Fixed Effect)
Research
Resources
Number of Researchers0.520.99
Total Budget−1.04−1.21
Research
Capabilities
Number of Thesis
Publications (SCI)
0.20−0.86
Number of Patent
Registrations
0.653.78 ***
Number of Patents Held1.450.31
Performance Diffusion CapabilitiesNumber of TLO Personnel4.76 ***2.73 **
TLO Budget−0.120.25
Cons−2.99−0.56
N3535
R2 within0.28880.5215
* p < 0.05, ** p < 0.01, *** p < 0.001.
Table 9. The results of statistical analysis by GRI mission type (2015–2019).
TypesDependent Variables20152016201720182019
Basic Future LeadingNumber of Technology Transfers253205166162145
Technical Fee Income51646868896281336148
Public
Infrastructure
Number of Technology Transfers563743951807695
Technical Fee Income15,48816,65116,83816,38919,653
IndustrializationNumber of Technology Transfers32623713431429982852
Technical Fee Income64,32571,38869,44871,05888,592
Table 10. The results of panel analysis by GRI mission type (2015–2019).
Dependent VariablesIndependent Variable = Number of Technology TransfersIndependent Variable = Technical Fee Income
BFLPIIBFLPII
Research ResourcesNR11.06 ***0.070.52−4.66−1.020.99
TB−3.49 ***−0.84−1.044.150.15−1.21
Research CapabilitiesNTP−2.86 **−1.660.203.320.38−0.86
NPR−2.17 *−0.850.654.29−1.403.78 ***
NPH1.443.87 ***1.45−3.58−0.940.31
Performance Diffusion CapabilitiesNTP0.974.22 ***4.76 ***−2.20−1.262.73 **
TLOB−0.11−1.78−0.121.92−0.480.25
* p < 0.05, ** p < 0.01, *** p < 0.001.
Table 11. The results of the hypothesis test.
HypothesisResults
Hypothesis 1.Hypothesis 1-1.Accepted
Hypothesis 1-2.Accepted
Hypothesis 2.Hypothesis 2-1.Accepted
Hypothesis 2-2.Accepted
Publisher’s Note: MDPI stays neutral with regard to jurisdictional claims in published maps and institutional affiliations.

