E-Commerce Customers Behavior Research Using Cohort Analysis: A Case Study of COVID-19


Social Communication and Information Activity Department, Lviv Polytechnic National University, 79000 Lviv, Ukraine
*
Author to whom correspondence should be addressed.
J. Open Innov. Technol. Mark. Complex. 2022, 8(1), 12; https://doi.org/10.3390/joitmc8010012
Submission received: 24 November 2021
/
Revised: 23 December 2021
/
Accepted: 26 December 2021
/
Published: 6 January 2022
(This article belongs to the Special Issue Open Innovation and Business Model in the Global Economic Crisis Which is Triggered by the Pandemic of COVID-19)
Abstract
:Cohort analysis is a new practical method for e-commerce customers’ research, trends in their behavior, and experience during the COVID-19 crisis. The purpose of the research is to validate the efficiency of this method on the e-commerce records data set and find out the critical factors associated with customer awareness and loyalty levels. The cohort analysis features engineering, descriptive statistics, and exploratory data analysis are the main methods used to reach the study purpose. The research results showed that cohort analysis could answer various business questions and successfully solve real-world problems in e-commerce customer research. It could be extended to analyze user satisfaction with a platform’s technical performance and used for infrastructure monitoring. Obtained insights on e-commerce customers’ awareness and loyalty levels show the likeliness of a user to make a purchase or interact with the platform. Key e-business aspects from a customer point of view are analyzed and augment the user-experience understanding to strengthen customers’ relationships in e-commerce.
1. Introduction
The COVID-19 crisis has forced businesses to move to an online format, which has significantly affected the growth of the e-commerce segment. The most adapted to the lockdown were those market participants who had already successfully used e-commerce, including business informatics. The latter term refers to the discipline that combines information technology, computer science, and business management concepts. Business informatics focuses on developing frameworks for effective operations, equipment, and programs management and the usage of information technology for efficient business growth. This emerging field of science, which began to develop in Germany, is successfully spreading across Europe and is reflected in education with the rise of relevant specialties in higher education institutions globally.
However, the COVID-19 crisis has caused resource losses for many enterprises of various sizes, despite e-commerce or business digitalization. Nevertheless, successful management concepts developed using business informatics in the organization have allowed adapting faster and better to become a leader of change in times of uncertainty. The above reinforcements have created a gap between industry leaders, who boast the use of multifunctional IT and e-business technologies, and outsiders, less successful businesses, who for some reason do not use the above technologies.
Thus, the problem of practical business informatics usage, its adaptation to the specifics of the industry, and the feasibility of application remains open and requires further study. Its solution will allow one to better understand and apply the basic business informatics principles in practice and determine its prerequisites, which are necessary for a successful implementation.
Thus, in the short and long term, solving the problem will accelerate the representatives of e-business, identify gaps, and follow the approaches of business–informatics data-driven business.
According to the COVID-19 and E-Commerce: A Global Review by UNCTAD and eTrade, the global retail market share increased from 14% in 2019 to 17% in 2020 [1]. Digital marketplaces and e-commerce platforms report an increase in transactions from 5% to over 100% in 2020 compared to last year [1]. The emergence of new products, services, companies are also caused by the COVID-19 crisis. Therefore, the next problem is new types of consumers whose preferences remain completely/partially unexplored. To solve this, the consolidation of new data sets is necessary. Business informatics and its method have the potential to cover these primary aspects:
- Development of intelligent systems and data warehouses for Big Data analysis automation;
- Products/services recommendation;
- Forecasting market trends;
- Business operations frameworks to meet the needs of business and consumers.
However, the correlations between various technological and business factors are not always clear, and in lots of business informatics applications, they are missing [2].
Careful study of the above problems will improve the efficiency and flexibility of business informatics applications to help less developed representatives of e-business to embark on a rapid path of development. While those institutions in which digitalization is still absent, this study will understand the business informatics core functioning and its benefits.
The project goal is to identify business informatics success factors that are applied among e-commerce representatives; analyze differences between various cohorts, and find out the correlations between the gender distribution of e-business consumers, which will increase e-commerce awareness, efficiency, IT solutions usage, their monitoring, business informatics application, and related methods. We identify e-commerce customer awareness as knowledge skills and experience about the digital retail journey, brand, products, and services, and various aspects of online shopping.
According to the OECD Policy Responses to Coronavirus (COVID-19), the crisis has accelerated e-commerce development and long-term impacted the industry. At the same time, the emergence of a new consumer type has empowered new products and services expansion. Thus, the number of offers on the market for personal protective equipment, and daily necessity items has significantly increased. The report states that despite government agencies trying to promote e-commerce acceleration, not all participants were ready for this for various reasons.
Mainly because of the lack of digitalization and informatization strategies. These circumstances led to a digital divide. Cohort analysis of various business representatives with or without e-commerce availability in the pre- and post-COVID-19 crisis period is exceptionally relevant today. It will identify critical factors to determine e-business representative success factors during the crisis and minimize the inequality.
The presence of business informatics played a unique role as one of the enterprise’s primary means of digital development. An innovative business model is becoming increasingly crucial for successful institution improvement and should be encouraged by policymakers. It is worth noting that the authors have observed an inevitable reaction and behavioral change in consumers in addition to business representatives. The article considers several segments—the private sector, government services, and consumers. Among each of them, there is a different level of digitalization as well as its total absence. The article contains an analytical report on the course and COVID-19 crisis impact on e-commerce. The highlighted issues need further study and proper interpretations to facilitate innovative technological and economical solutions in Europe and the globe [3].
The e-commerce customers’ behavior during the COVID-19 crisis is an evolving field of research because of the specificity of this crisis type, mainly: lockdowns, constant market fluctuations, emerging new types of customer generations, interactions between users, and new e-commerce systems and applications. A recent study by Yuyang Zhao and Fernando Bacao shows insights on gender moderate clients’ shopping intention in live-streaming apps, which are becoming more and more popular and can replace onsite sales events, conventions during the COVID-19 crisis. This study allows e-business representatives to improve management and strategy development through customer understanding [4]. Considering clients’ personality traits can help make the e-commerce experience more personalized than before and increase overall customer satisfaction. A. Hermes’s study shows what types of customers are likely/unlikely to shop online and how personality-based interests affect the purchasing channel choice [5]. A customer behavior-based recommendation system that utilizes statistical methods and dynamic user preferences analysis shows improvements in performance metrics (F-function score, precision, recall, and root mean square error) and overall prediction results. This development can handle cold start problems and user interests variations over time [6]. H. Luo and others study the impact of online promotions on e-commerce customer behavior.
The researchers take into account sales decrease due to the epidemic. The employed statistical method show which factors influence customers’ willingness to shop online. Mainly, promotion events significantly impact the readiness for online shopping; however, it depends on the type of product promoted. The paper delivers new knowledge on coping with online promotions [7].
A methodology for data collection, integration, and processing for evaluating European e-commerce awareness and behavior is studied by I. D’Adamo and others. According to the researchers, this field has still not been explored enough and further data needs to be collected. In the analysis of European citizens’ e-commerce shopping behavior, the survey allowed the research team to identify valuable insights for e-business decision makers as well as find out problems European customers most frequently encounter during online purchase. The COVID-19 crisis has impacted e-commerce customers’ behavior, and significant concerns about online transactions security and sustainability have been raised. The researchers state that a gap in literature of e-commerce customers behavior and their awareness on various aspects needs to be filled [8]. It is required to address these issues, increase online shopping experience, and improve the loyalty to ensure high security and sustainability in this field.
This study is an urgent scientific problem to promote the fruitful development of e-commerce and an advanced approach to e-business products and services consumers in Europe and worldwide. According to the literature review in this section, our research on e-commerce customers’ behavior and awareness levels on different aspects during the COVID-19 crisis is critical, and have not yet been explored thoroughly enough. The main perception being, which e-commerce aspects help to improve managerial decisions and customer satisfaction. We identified those aspects that require improvements so that e-business platforms representatives can focus on them to ensure high loyalty levels.
A correlation between e-commerce awareness aspects perception and customers behavior augments the research and fills the gap in this field of study. We should mention that studying online customer behavior and their awareness level will help to develop a personalized shopping experience and avoid overwhelming users with irrelevant item recommendations.
2. Related Work
Business informatics is a robust area that helps manage resources and customer relationship. Business Intelligence (BI) is one of its aspects utilized to gain insights from large sets of data, including Big Data. BI principles define a general framework for business data collection and processing using statistical methods for quantitative and predictive modelling [9]. Nevertheless, new challenges arise and require extra features for customers understanding and behavior analysis. The usage of BI-based technologies on Big Data analysis for user segmentation is studied by X. Du and other researchers. The authors use the clustering analysis to create a personalized e-commerce marketing experience for various cohorts [10]. Cohort analysis is becoming an integral part of e-business; the application of this method can provide valuable insights: assess user response to marketing campaigns, observe customer behavior over time, correlate it with the business metrics, and test hypotheses. We refer to cohort analysis as a method to analyze the behavior and performance of a user group who share standard features over a specific period and are chosen within a defined customer journey.
Google Analytics is a multifunctional service developed by Google, and is employed by representatives from different domains. Researches and reports show that this tool is essential for e-commerce, mainly because it allows measurement of key performance indicators (KPIs) and improves the observability of operations and customer behavior [11,12]. Google Analytics offers a cohort analysis feature that is customizable and has the possibility to evaluate various metrics over time. Google defines cohort as a group of users who share common features and characteristics [13].
Cohort analysis has various applications in healthcare, pharmacology, and social and environmental sciences. Even though its usage in e-commerce is widespread, not all business representatives are able to interpret the results and do not pay enough attention to the provided analytics on user behavior. So, cohort analysis still has plenty of opportunities to enhance its usage, explainability, and exploration in the online retail industry.
Customer loyalty is correlated with trust in e-commerce representatives. It is identified as an emotional relationship between the business and the client. The higher the loyalty, the more likely a customer interacts with a specific e-business. Social commerce is closely related to the customer satisfaction, awareness, and loyalty to a specific e-business. It includes building trust in e-commerce, social media, social features, and consumers.
This concept of social commerce to develop trust between e-commerce platform and consumers is very critical, especially during the COVID-19 crisis, because people are concerned about reliability and security. A study by Lin X. on social commerce implementation provides knowledge on how to increase sales and build customers trust [14]. Understanding customers’ awareness of various e-commerce aspects can help build confidence between businesses and consumers and enhance the shopping experience, making it reliable [15].
The study of strategic e-commerce behavior from a customer’s perspective reveals new online shopping factors. In order to succeed in this competitive industry, e-business should analyze their user’s purchase patterns and develop a corresponding strategy. The research provides quality of online shopping factors according to a business size [16]. Cohort analysis is one of the methods that can be used along with statistical techniques to enhance customers behavior analytics, and find out and fill the gaps in e-business strategy. It is appropriate to study a customer’s life cycle and make corresponding business decisions. This topic has not been explored enough and can be enhanced using the method mentioned above. Multiple services that provide analytics on user behavior are starting to offer features on the customer life cycle and journey on a website [17,18,19].
In order to thoroughly analyze the subject area and understand the cohort analysis application to solve various applied problems in many fields of science, the authors propose a detailed analysis of the cohort analysis usage in one of the world’s largest research databases—Scopus.
The reasons for selecting Scopus database are the following:
- Daily content updates with the latest studies in the examined topic;
- Variety of researches on e-commerce and customer behavior;
- Research papers coverage, including e-commerce and customer behavior studies is broader and more accurate than the one of the competitors [20].
- User-friendly tool for research analytics;
- Automatic generation of statistics on the search results.
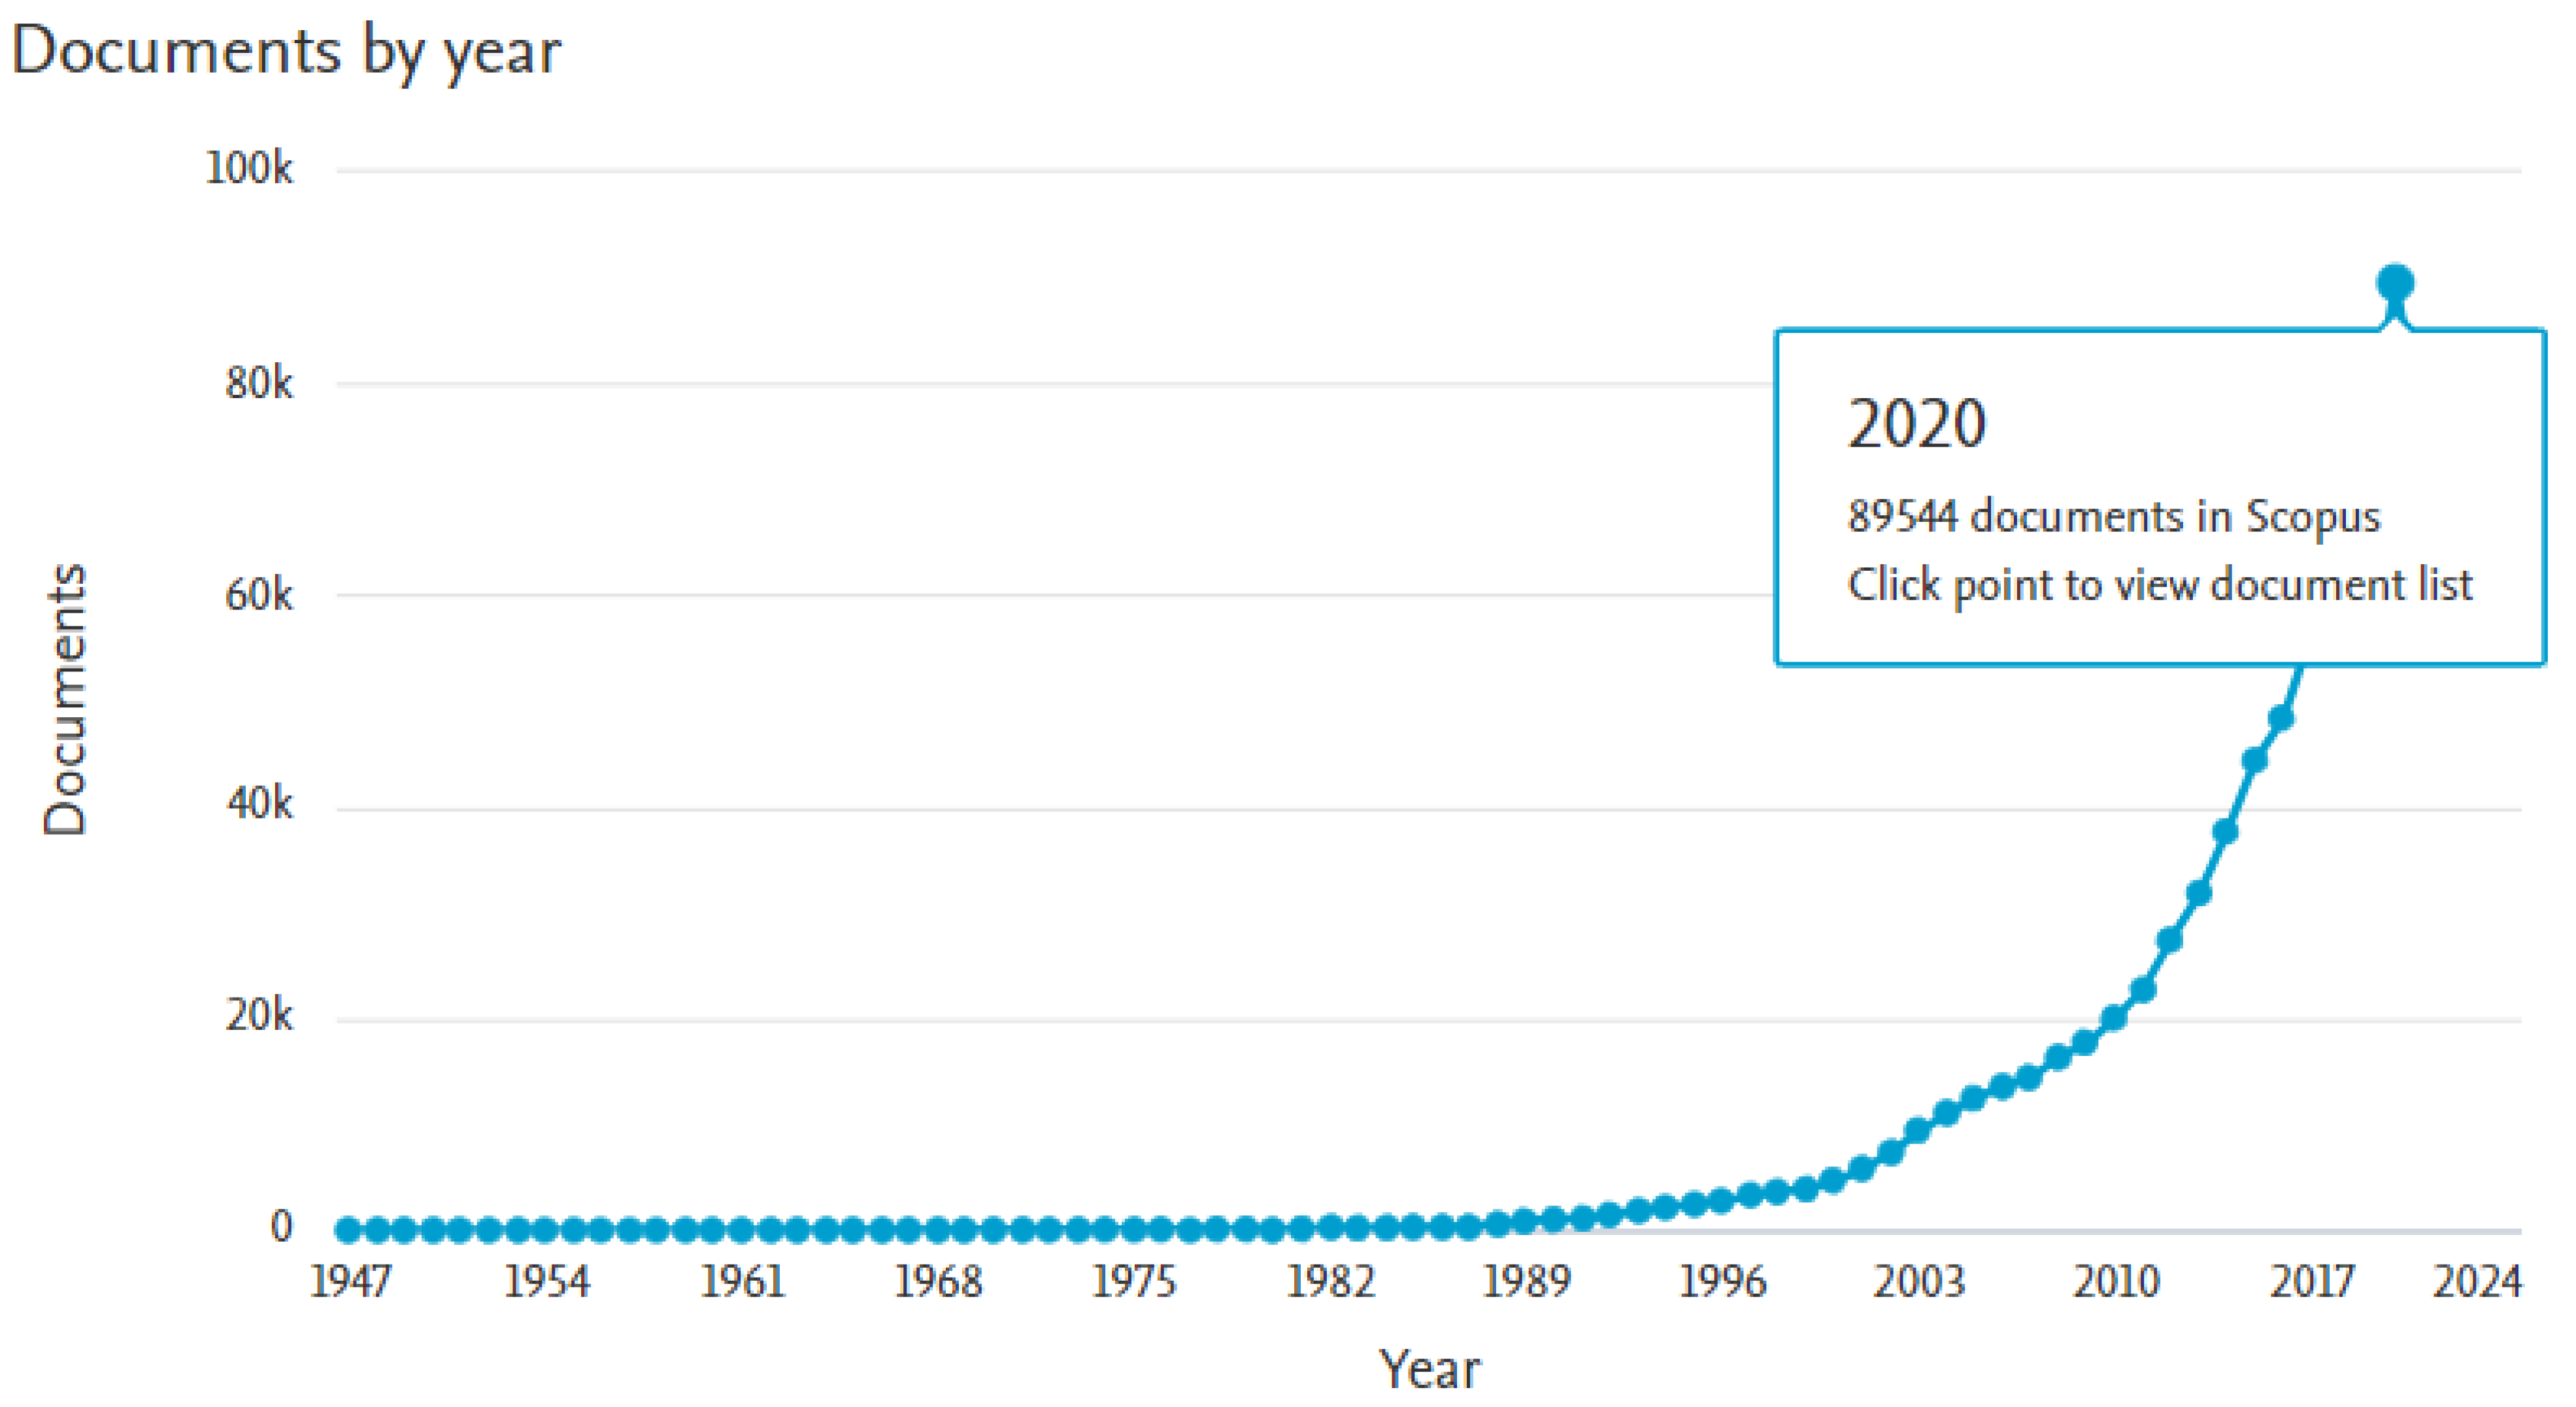
The search query TITLE-ABS-KEY (cohort AND analysis) in Scopus database returned 734,359 documents for the 1947–2021 period as of 20 October, 2021. Thus, in 2020 alone, scientists in 89,544 works used cohort analysis for their research (see Figure 1).
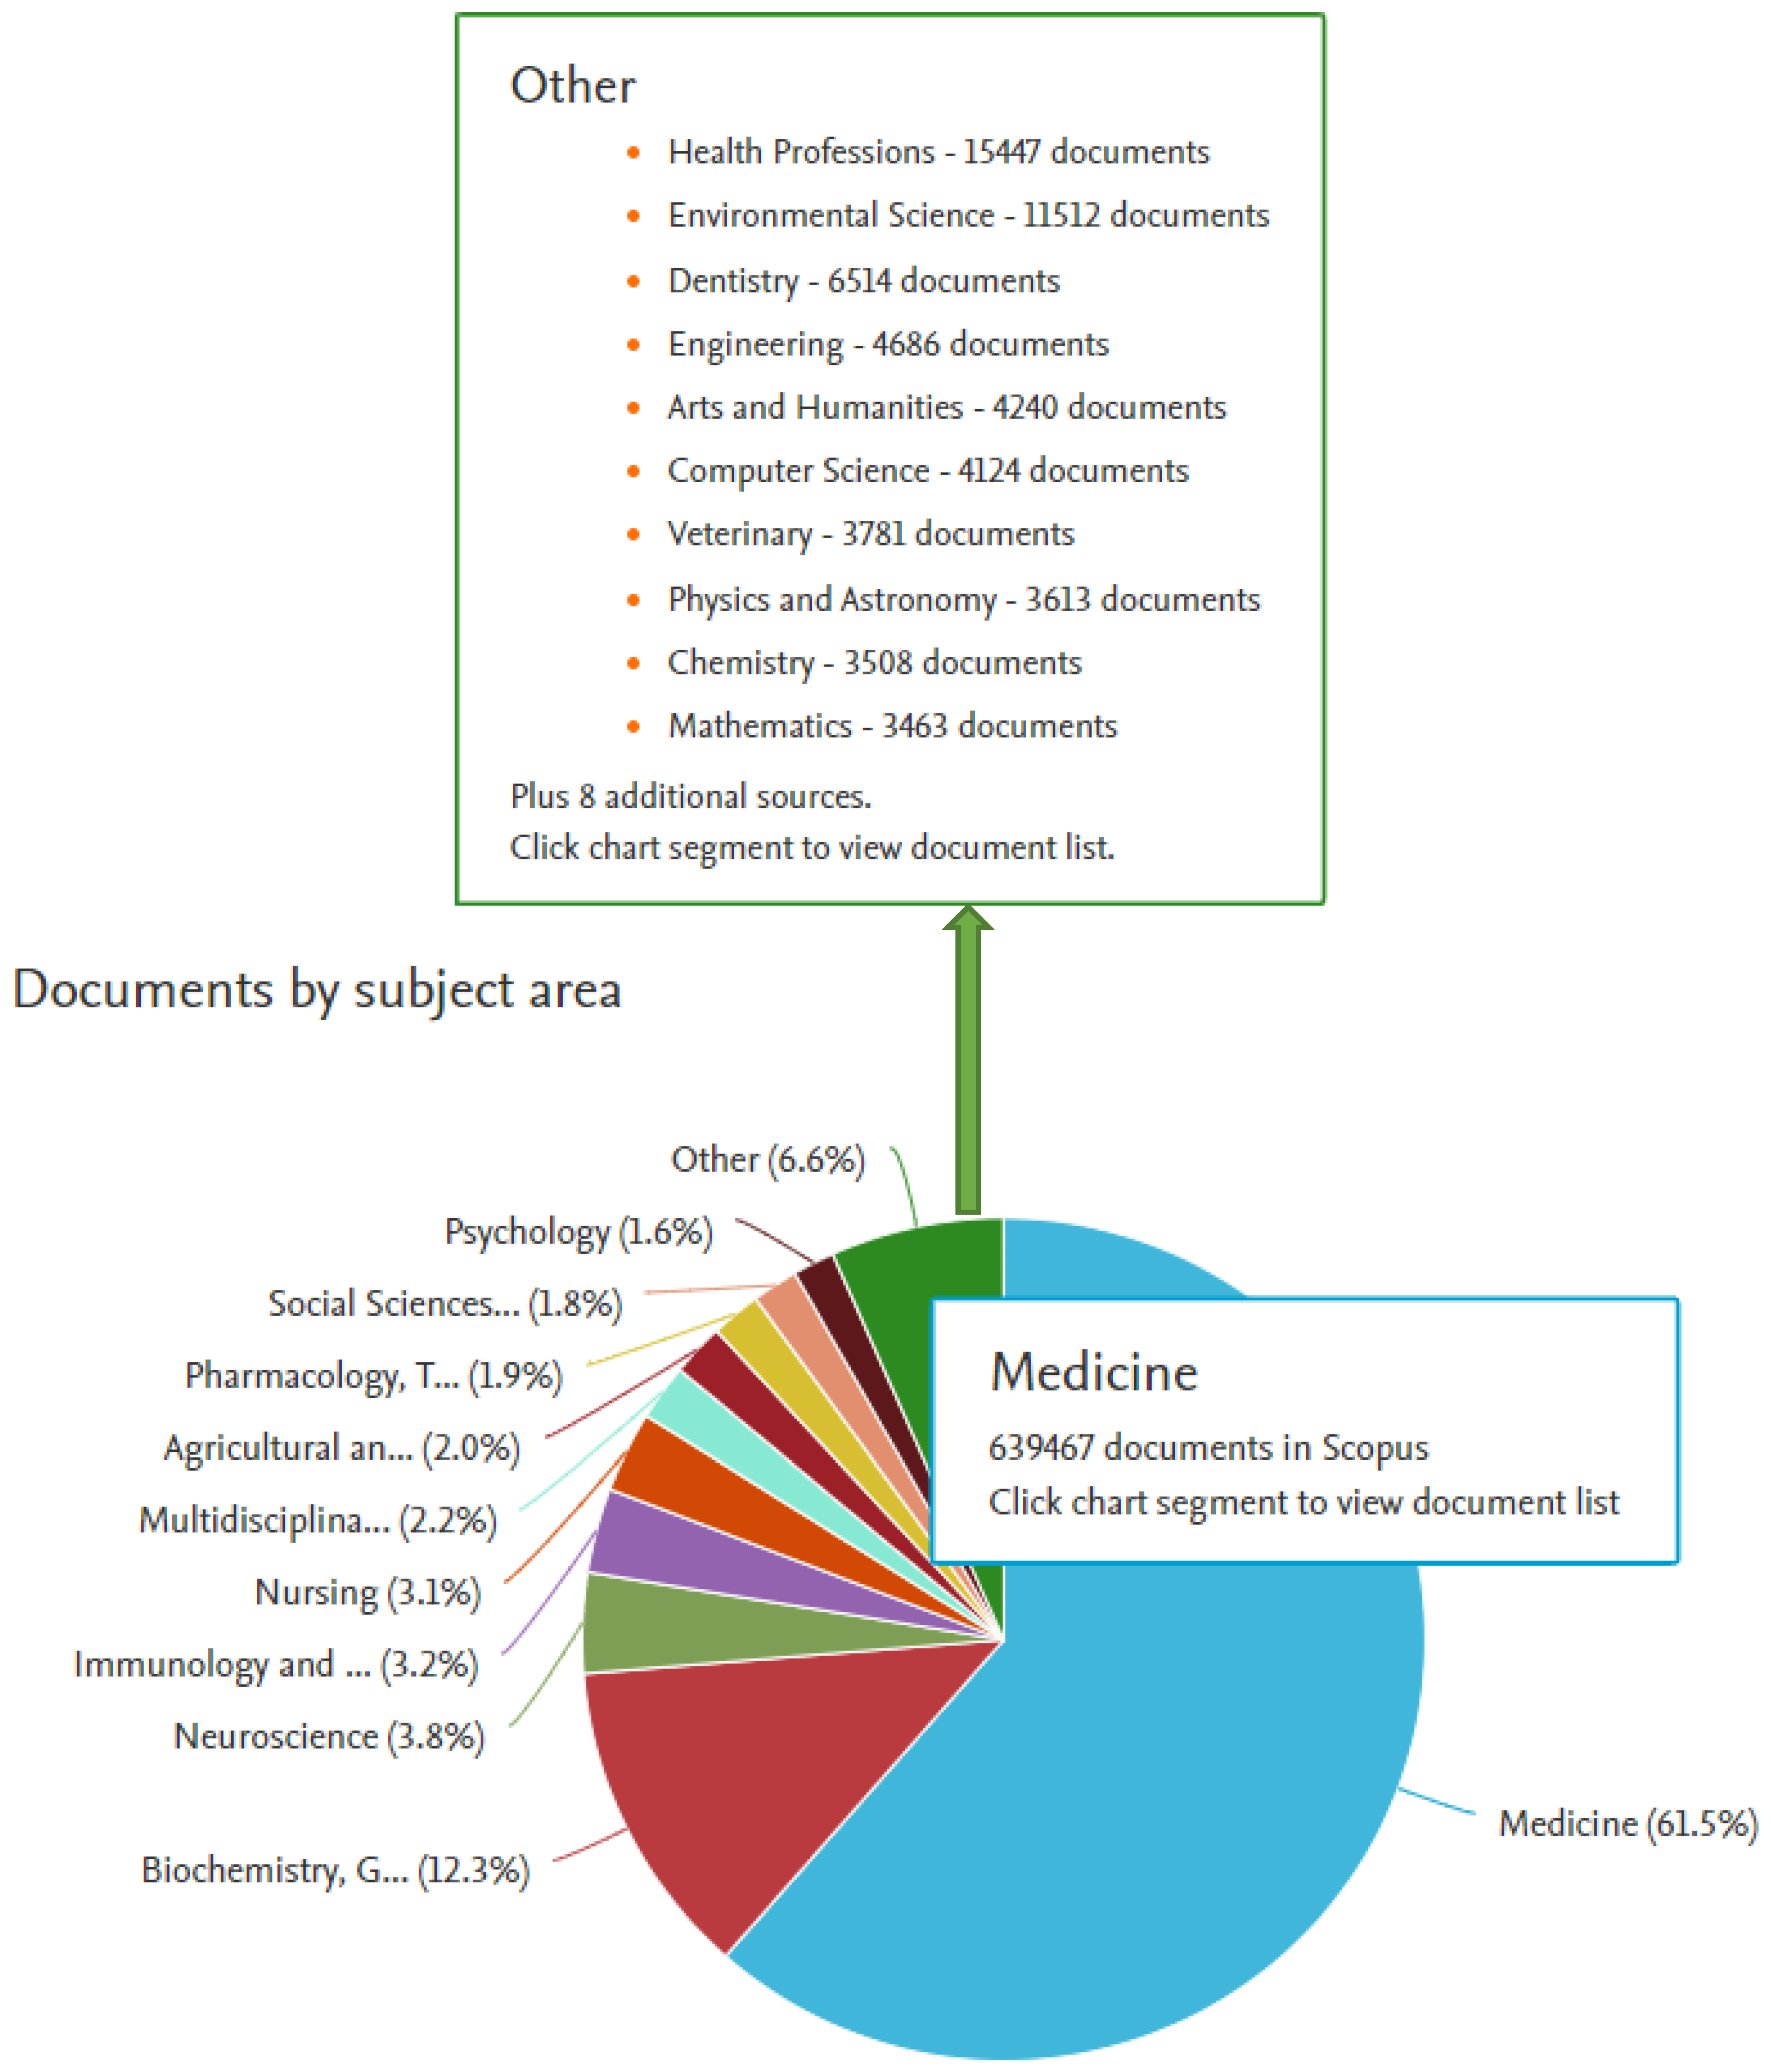
From the graphical representation of the statistics for the cohort analysis usage in scientific research by years (Figure 1), it is visible that the application of this research method is becoming increasingly popular with each passing year. However, overall, 87% of scientific papers that use Cohort analysis for research and solution of problems are from the field of medical sciences (Table 1 and Figure 2). As we can see from Table 1, the cohort analysis method was used in 1878 computer science and 4124 engineering research papers during the 1947–2021 period.
According to the search results for the query TITLE-ABS-KEY (cohort AND analysis) by year in the Scopus database for the 1947–2021 period as of 20 October 2021, 63 documents are classified as Undefined.
As we can see from Table 1, the cohort analysis method was used in 1878 computer science and 4124 engineering research papers during the 1947–2021 period.
According to the search results for the query TITLE-ABS-KEY (cohort AND analysis) by year in the Scopus database (Figure 3) for the 1947–2021 period as of 20 October 2021, 63 documents are classified as Undefined.
Business informatics has been the most popular direction for academic research for the last five years.
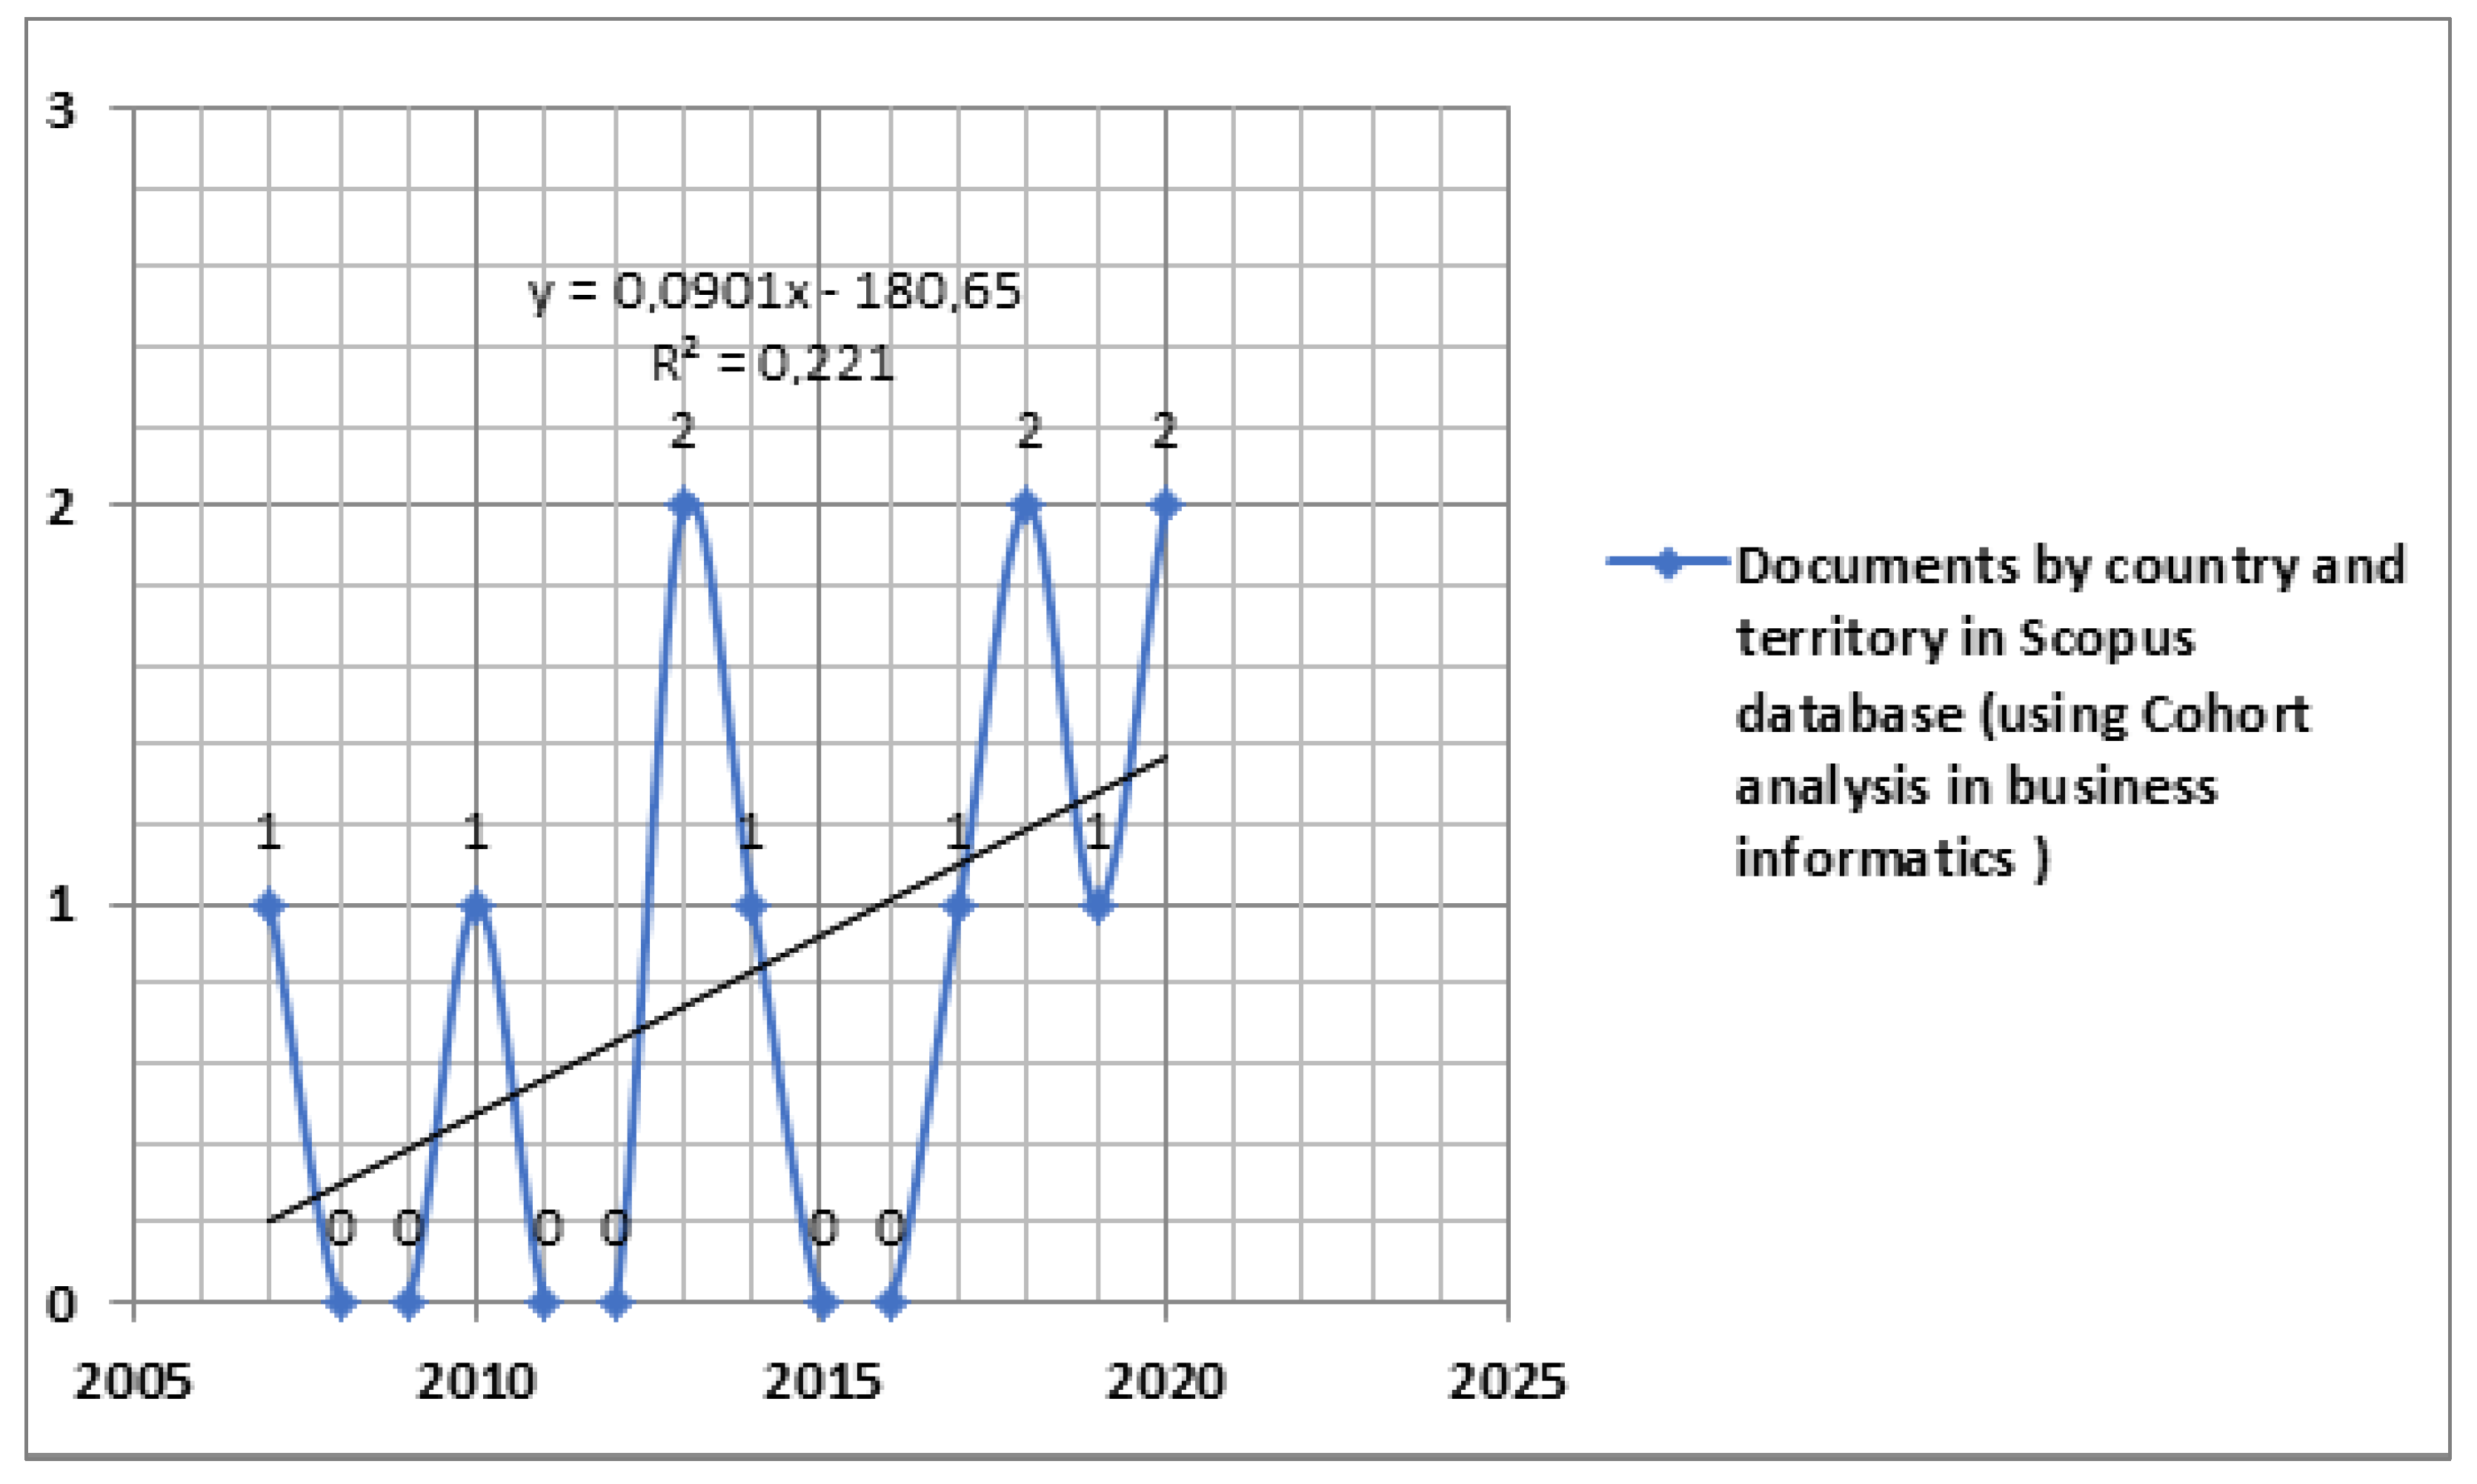
The query results in the Scopus database (Figure 2) are 11 documents that use cohort analysis in business informatics. Since 2007, scientists Ekman A., Litton J.-E. [55] from Sweden and other scientists from the United States, Germany, Netherlands, Italy, Sweden, and the United Kingdom studied business informatics (Figure 4 and Table 2).
The data in Table 2 show that organizations of only few countries explore cohort analysis usage in business informatics, and the numbers are drastically low. They have mostly the same number of papers published year by year. We should highlight that these countries (e.g., the United States, Germany, and the United Kingdom) are the leading ones in their regions at economic growth and development. So, building further research on cohort analysis in business informatics in other countries can lead to establishing best practices and new developments in these areas specific to particular country industries.
This method’s potential is not entirely used in business informatics tasks, but also in the cohort analysis of Web users’ development and relationships. Recent studies confirm that cohort analysis and efficient business informatics usage will improve the operational management of products and services. It might be applied to the IT components monitoring such as infrastructure, application performance, site reliability engineering, security operations, and more. Cohort analysis in Business informatics helps to identify the factors that drive Web usage among different enterprise scales. The application of this method can encourage the development of open innovation within a specific organization or industry and improve the dynamics. Correspondingly, adopting more and more open innovations results in entrepreneurship leading culture where experience is shared and best practices are accepted [56]. While the trends analysis of business informatics usage, in the long run, will identify critical factors in the development of specific representatives of e-business. Another significance of using cohort analysis in this field is the possibility of modeling customers’ behavior, providing personalized features, and making the overall user experience more attractive. Cohort analysis addresses the issue of constantly changing market demands and allows e-business representatives to develop a robust understanding of new emerging types of clients.
3. Materials and Methods
We applied cohort analysis as the critical method to gain insights from this research. Its usage allows efficient detection of the impact and changes in user behavior over time. The critical factors for cohorts’ selection are age and social status. We consider it appropriate to add a factor such as a gender distribution in e-commerce and apply some descriptive analytics to it. According to the latest research, the involvement of women in higher education will solve the global warming problem and thus create a more eco-aware society. So, the impact of gender distribution in e-business and business information remains unexplored. It can provide a large number of insights regarding consumer preferences and understand the changing market trends.
The following methods were used for conducting the research:
- Statistical and descriptive analysis of Web users’ e-commerce awareness;
- Time-series and cohort analysis;
- Correlation analysis of e-commerce aspects;
- Statistical hypothesis testing to study the difference between representatives of various e-commerce awareness levels and their perception of various e-business aspects from a customer point of view;
- Gender distribution and e-commerce awareness and loyalty levels;
- The dynamics and level of multifunctional IT solutions and business informatics usage;
- A qualitative and quantitative review of the target audience;
- Observation of the formed cohorts’ e-commerce customers.
Our target audience is web users who interact with e-commerce solutions. The beneficiaries are the subjects of IT solutions implementation, research institutions, business schools, and institutes.
We used the “Survey Data on E-commerce awareness” from the Kaggle Platform [57]. It contains 204 observations with 34 features that were used for analysis. The data set was pre-processed with the following changes applied: columns renaming, data cleaning, and categorizing features. We converted some categorical features into numerical according to the rules represented in Table 3. The assigned numerical values are based on the question context and response sentiment: positive/negative/neutral towards e-business receive the highest/median/lowest value correspondingly. It is worth pointing out that these values depend on customer awareness and loyalty, defined in previous sections of this research. The first group of questions with possible answers “Yes”, “Maybe”, or “No” are primarily focused on assessing customer’s awareness and more minor on loyalty. In contrast, the second and third groups with “Agree”, “Neutral”, or “Disagree” choice of answers consist of equal concentration on these two characteristics. For this reasons the assigned numerical values are different.
These features were summed up and the values were used as a score indicating engagement into e-commerce and the awareness and loyalty levels. The maximum possible score value might be 12, whereas the minimum can be −8. We applied data standardization to the score values to make them consistent and keep the outliers but reduce their impact on the calculated statistics. The mean and standard deviation values have changed to 0 and 1, respectively.
The data pre-processing part allowed us to simplify the exploratory data analysis and assign a score to each respondent based on the answers provided.
4. Results
The research analysis is based on data from e-commerce users’ surveys and online purchase history during the COVID-19 crisis. We have provided a specific data set description and references further on in this section. We conducted a quantitative analysis on a sample of e-commerce users from different locations and with a wide range of interests.
Descriptive statistics in this paper is generated using data wrangling and visualization techniques. The fetched information highlights differences among various user groups based on their e-commerce awareness and loyalty scores. The obtained insights are helpful for monitoring and evaluating consumers’ e-businesses perception, the likeliness of interacting with a platform, satisfaction rate. Moreover, this analysis leads to the development of multiple types of open innovation dynamics, which is critical for sustainability in e-commerce and e-business [58].
Engineering is required to solve various problems of open innovation, mainly the channels for knowledge sharing [59]. We recommend correlating the analyzed factors with business and performance metrics to evaluate and enhance customers’ shopping experience.
The analysis contributes to an overall improvement in consumers’ understanding, their perception of different e-business aspects, and helps adjust questions in further surveys on related topics.
4.1. An Introduction to Exploratory Data Analysis
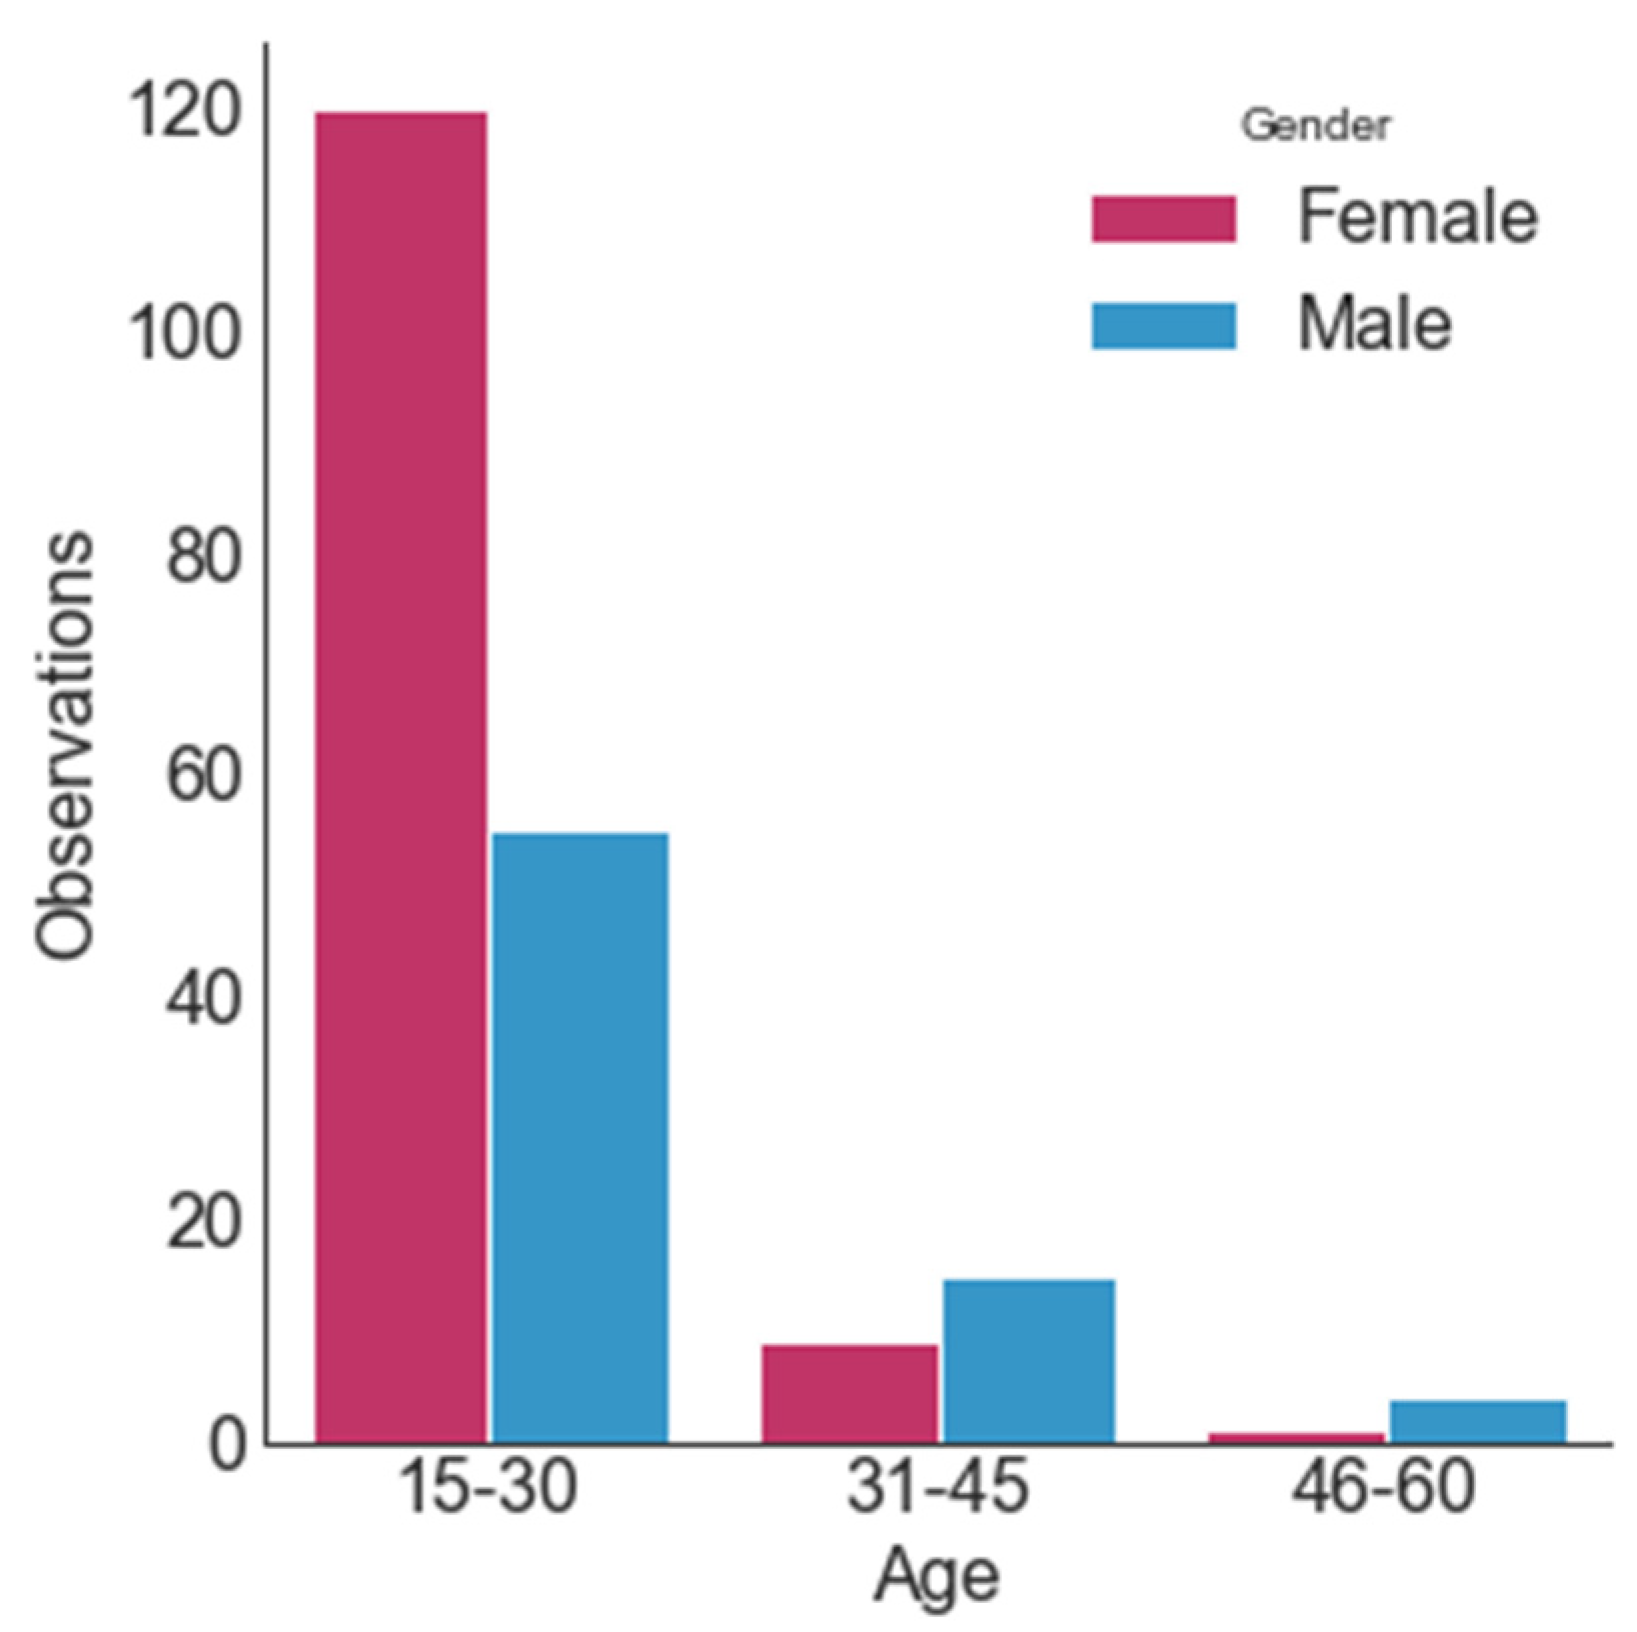
Our data contain both male (36%) and female (64%) responses. The age distribution is shown in Figure 5, where 85% has the population within the 15–30 age range, and 11% and 4% of the data are 31–45 and 46–60 age ranges, correspondingly.
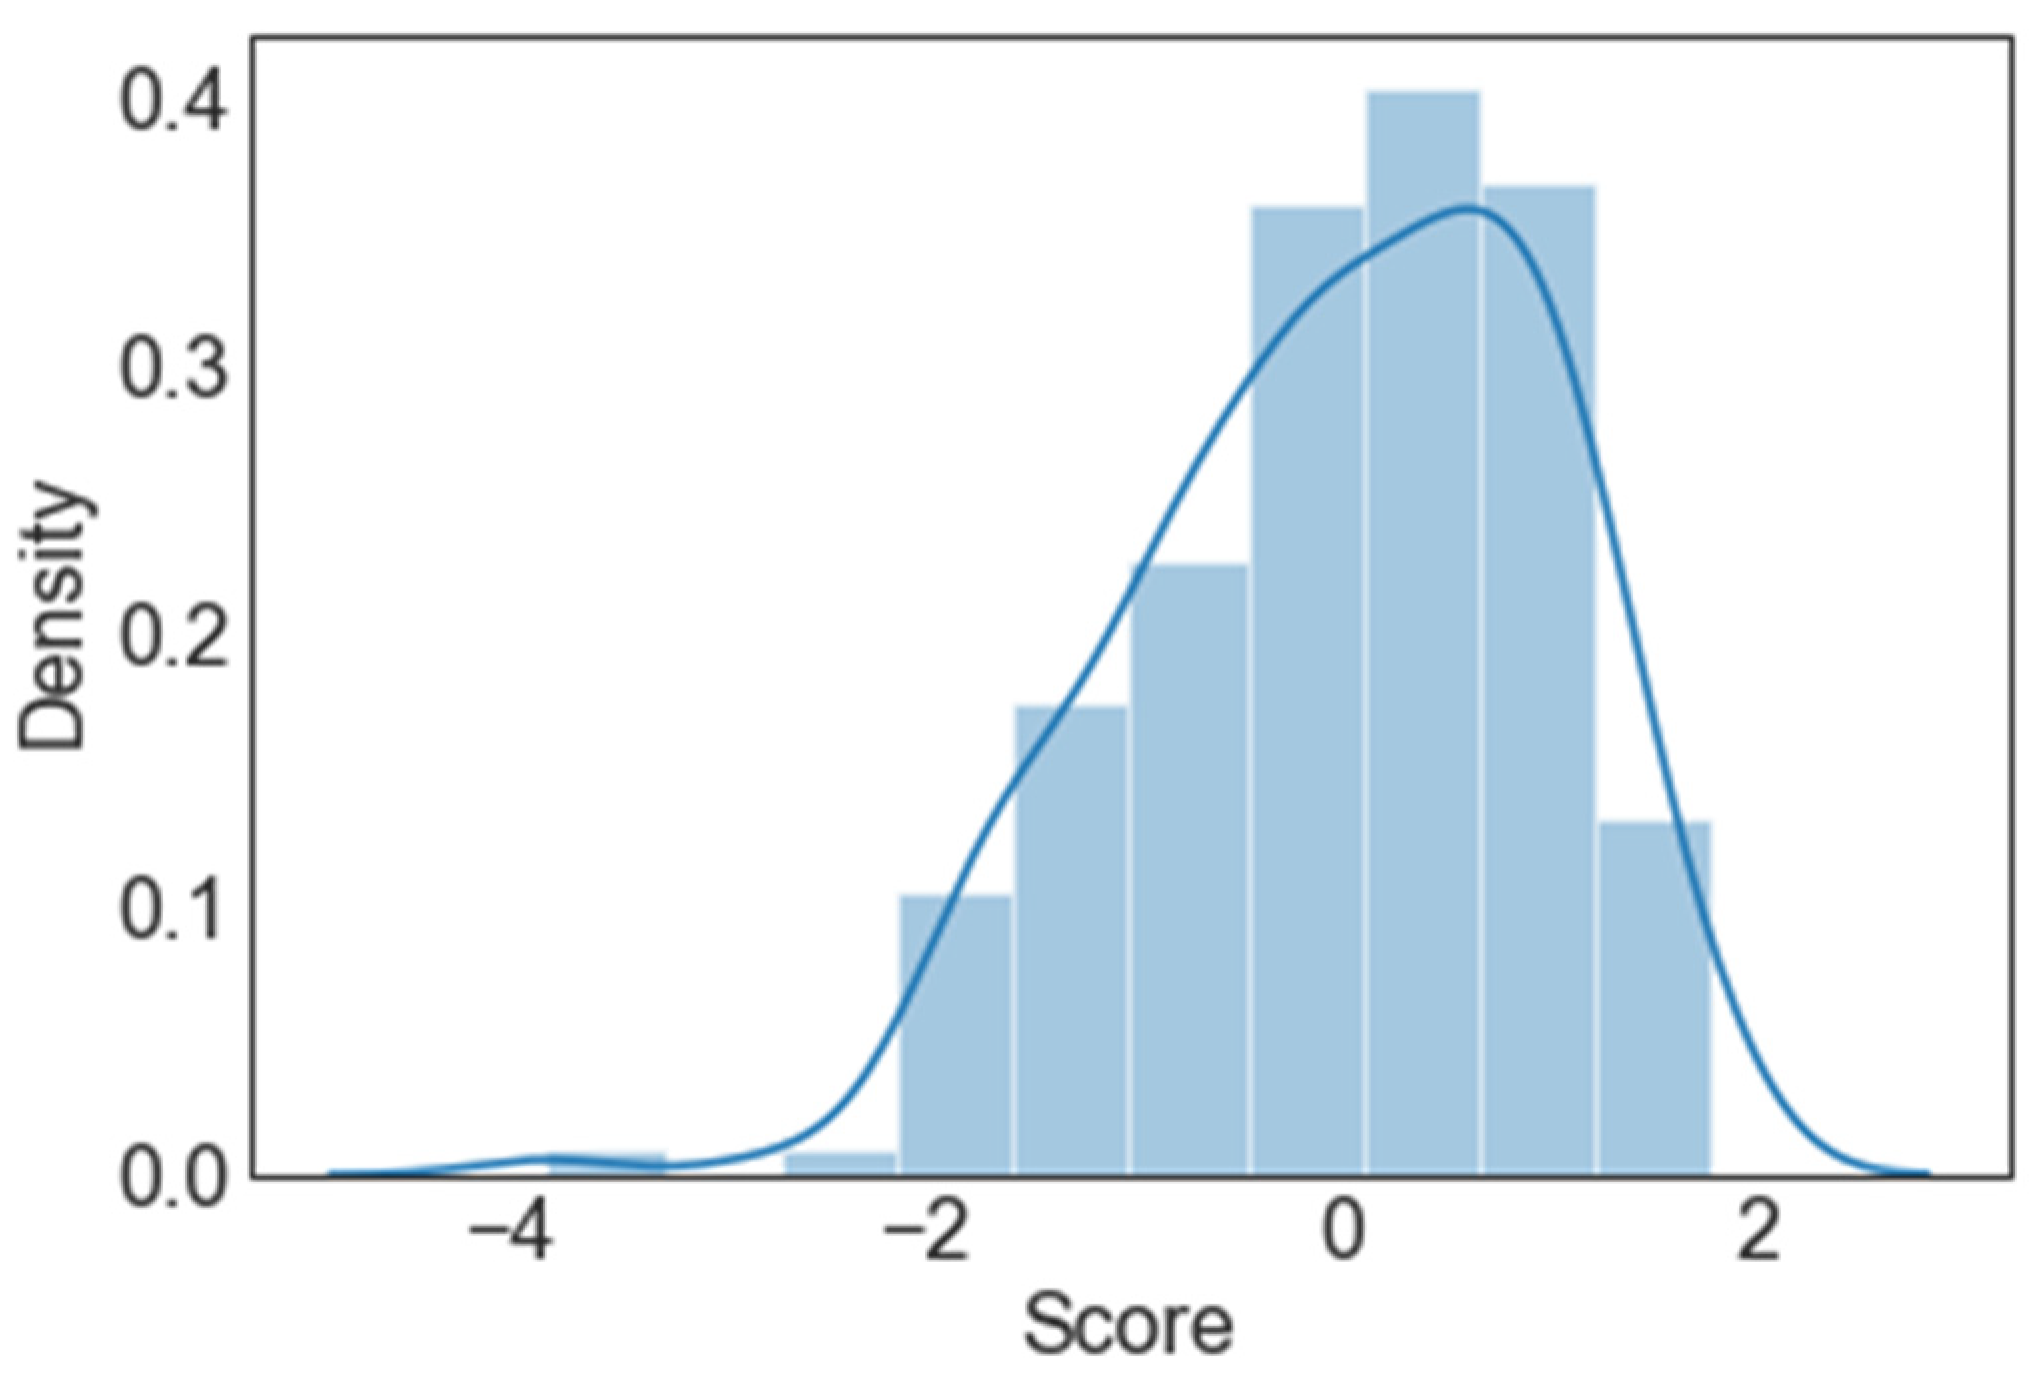
A histogram for the standardized score displayed in Figure 6 follows the Extreme Value Type I Distribution pattern, also known as the standard Gumbel distribution (minimum case). Few outliers are observed, which indicates poor e-commerce awareness levels.
We found out that 46% of the data points are less than 0; the excessive number of observations lie in the interval between 0 and 1 (37%); and the right tail of the data has the proportion of 17% with a maximum value of 1.77.
So, we infer that approximately 54% of the observations have a greater than average e-commerce awareness and loyalty score.
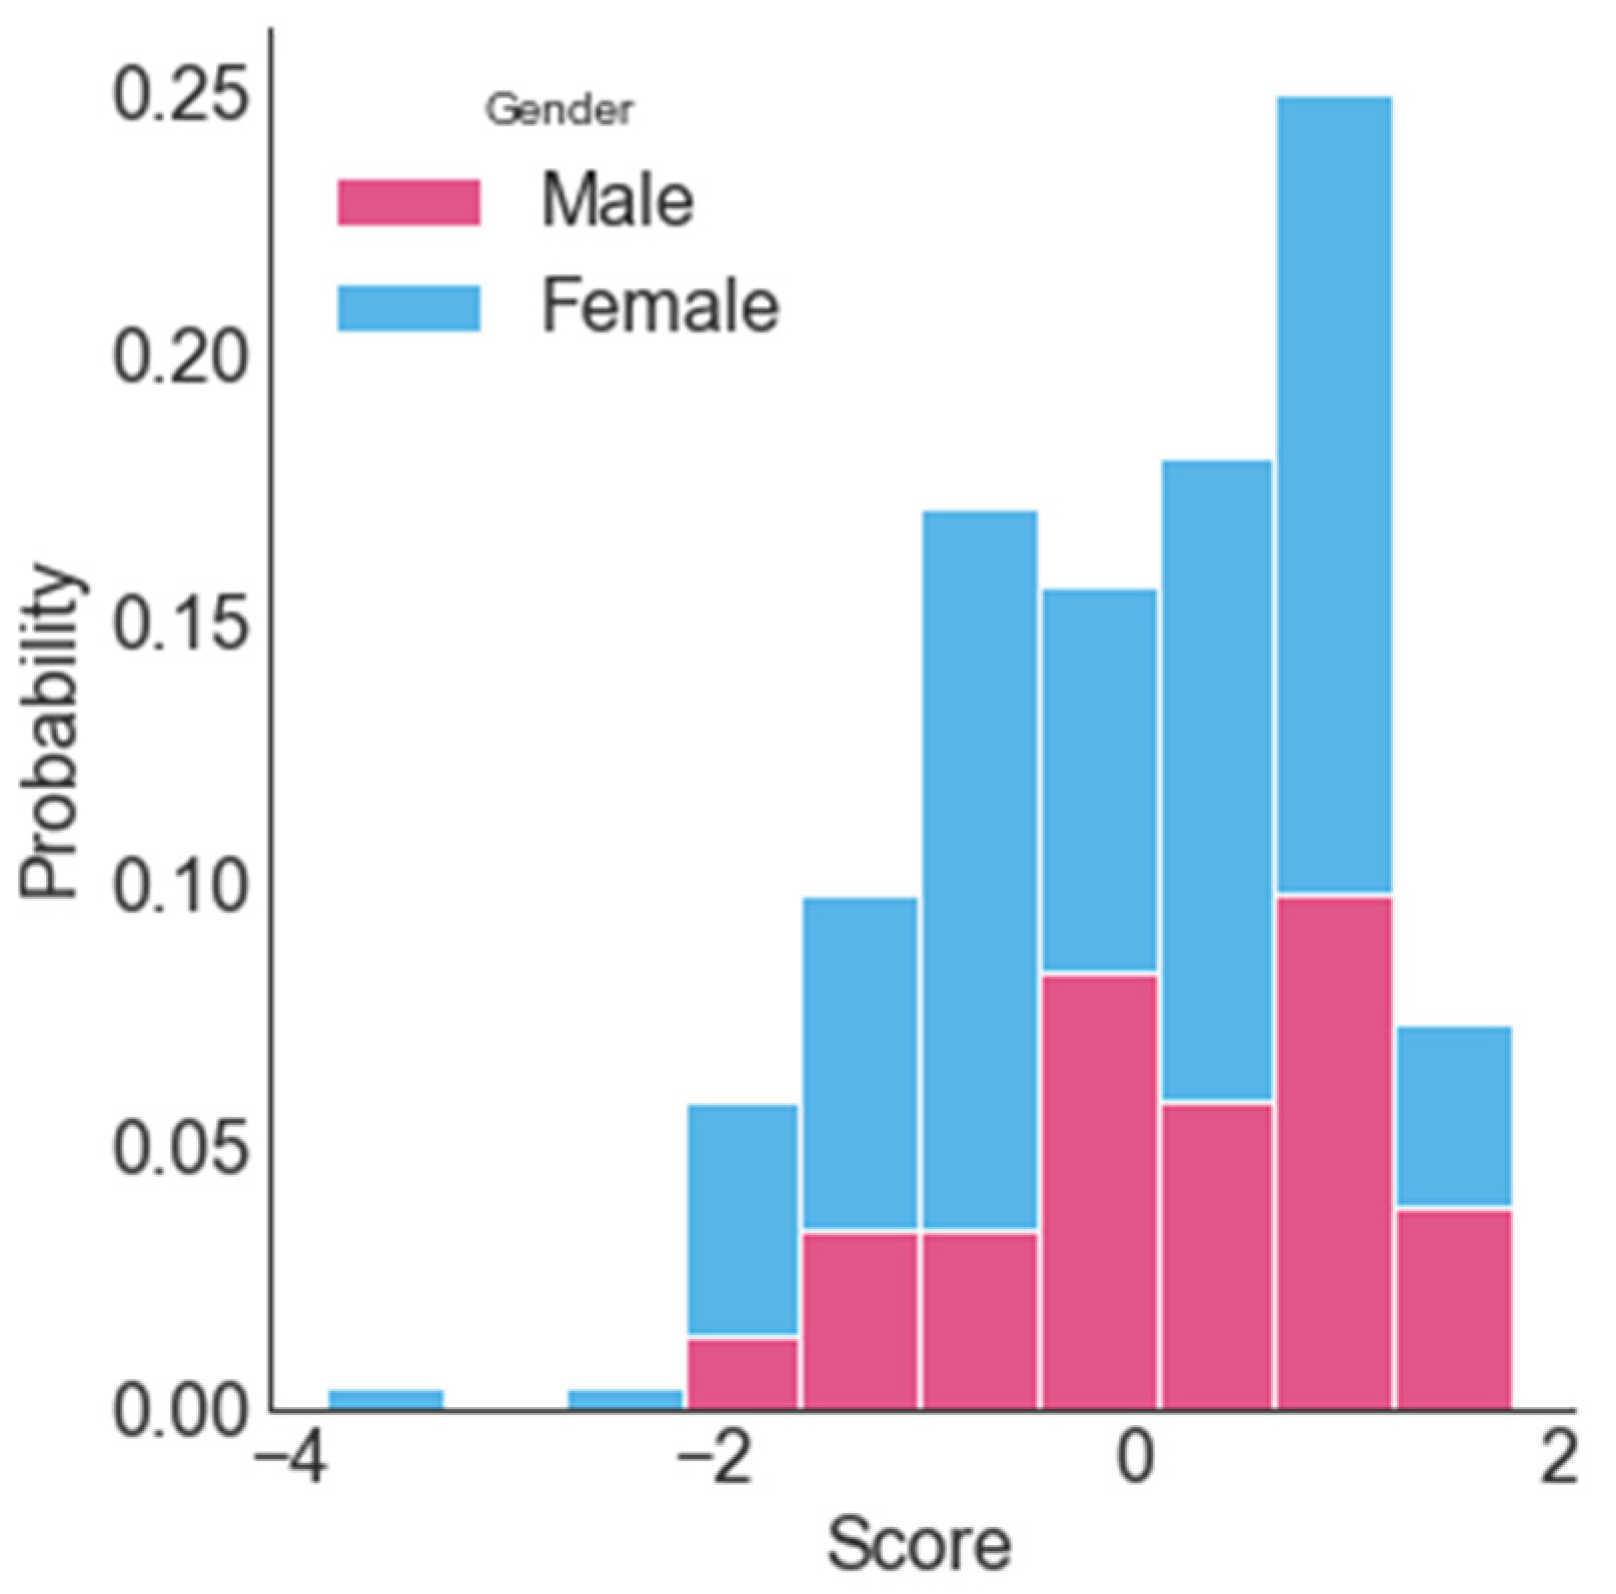
Further analysis revealed that male representative tends to have a higher score compared to female. This is shown in Figure 7 that tells the overall distribution. Few outliers are highlighted as well. The most common values are in the range from 0 to 1.
The statistics are represented in Table 4. It is crucial to note that males’ mean and median scores are equal, but not for females, which is caused by outliers. The percentiles are also considerably higher for the male representatives. These insights indicate that females tend to trust e-commerce less than males, thus being careful when selecting a platform for shopping.
4.2. Research of E-Commerce Aspects Customer Experience and Importance
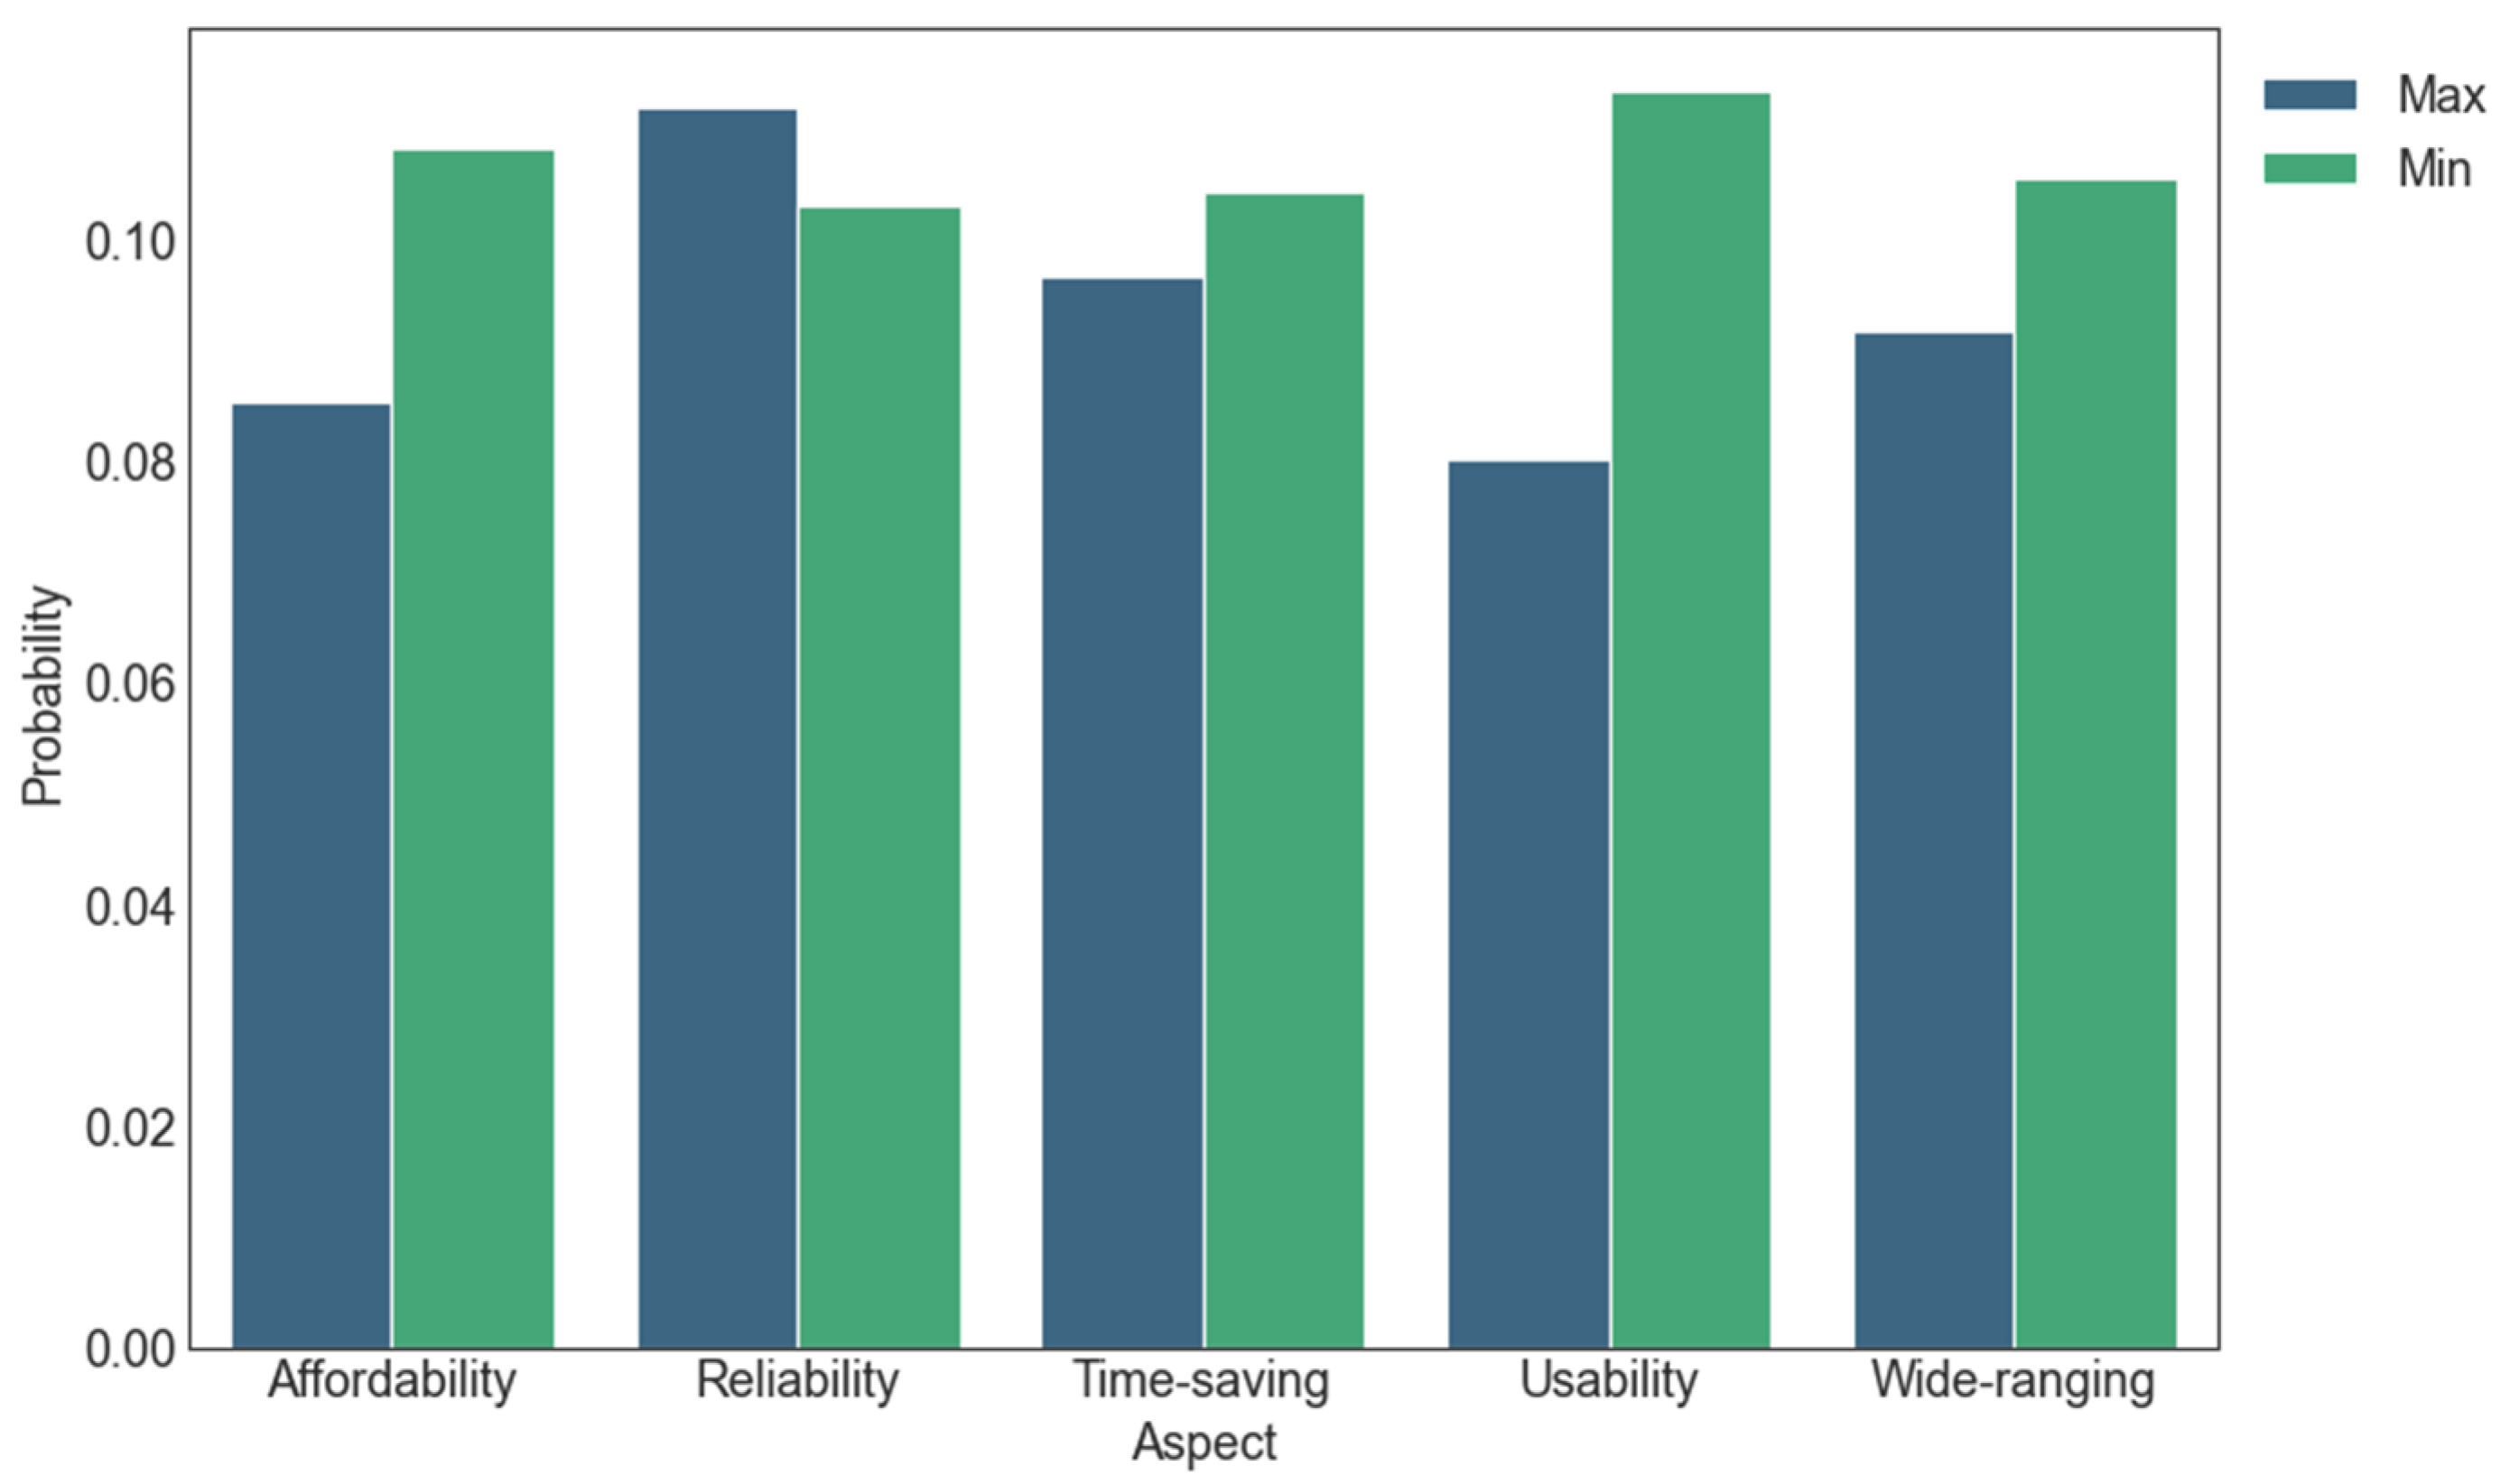
The participants were asked to rate the following e-commerce aspects from a customer perspective on a scale from 1 to 5, where 1 is the lowest score, and five the largest: affordability, usability, a time-saving, wide range of products (wide-ranging), and reliability.
The participants could assign the same score to one or multiple aspects. Because some aspects of the same respondent might have identical scores, we accounted for each aspect during our analysis. In rare cases, all five aspects could have the same score. So, we calculated the mean of them, and if it was more significant than our threshold (3), then it was considered as a positive aspect and assigned a label “max”; otherwise, it was a negative one with a label “min.”
In Figure 8, we visualized the probability of occurrence of a particular aspect with the “min” (negative) and “max” (positive) labels.
The data contain more low-scoring aspects (52.9%), considering them as e-commerce drawbacks rather than high-scoring (47.1%). The highest probability of being negative has the usability component. It has the least likelihood in the top part as well.
Reliability is the key positive aspect and the only one that received higher than low scores.
In the study, we covered the correlation of crucial aspects depending on the calculated e-commerce awareness scores. This review made it possible to model how a particular user perceives e-commerce, and to determine the correlation between the e-business awareness level and the critical customer factors.
To avoid bias and extreme values impact, the mean (a) and median (b) values were used for the visualization in Figure 9. According to this graph, people with a high score are pretty optimistic about its usability and that it is wide-ranging. However, the affordability and partially time-saving aspects have received low scores from these users.
On the other hand, users with a lower than the average score consider the e-commerce process time-saving (utterly opposite to the first group of users). They tend to evaluate it with a value bigger than three. They do not suppose e-commerce to be wide-ranging.
The third type of user with an average e-commerce awareness level positively evaluates affordability, whereas usability is not an advantage. It is instead a part of e-commerce that needs improvement.
A study of the purchase frequency on e-commerce platforms gave predictable insights visualized in Figure 10. The more frequently a person buys a particular product or uses specific services, the greater awareness in this area. The type of users who never use e-commerce tend to have a lower awareness level. Weekly shopping frequency representatives have the highest median score as well as higher quartiles compared to other categories. The users who use e-commerce daily have a minor representation and a pretty decent standardized score, mainly between 0 and 1, with two outliers.
4.3. Reliability Aspect Hypothesis Test and Deep Dive
Reliability is both a positive and negative aspect for users across this awareness level. However, a trend confirms that the higher the user’s awareness score, the more inclined this user is to evaluate the platform and the industry as reliable.
A hypothesis test was conducted during the research to determine whether there is a statistical difference between two consumers groups for their reliability aspect perception depending on the e-commerce awareness score. The first group considers e-commerce to be reliable, while the second as unreliable. The sample means the difference in the standardized score is 0.042. The H0 indicated no difference in the populations’ awareness score, whereas the Ha indicates the opposite. As it turned out, we failed to reject the H0 hypothesis with a significance level of 5%, meaning that there is no statistical difference between the two populations who have an unequal perception of reliability.
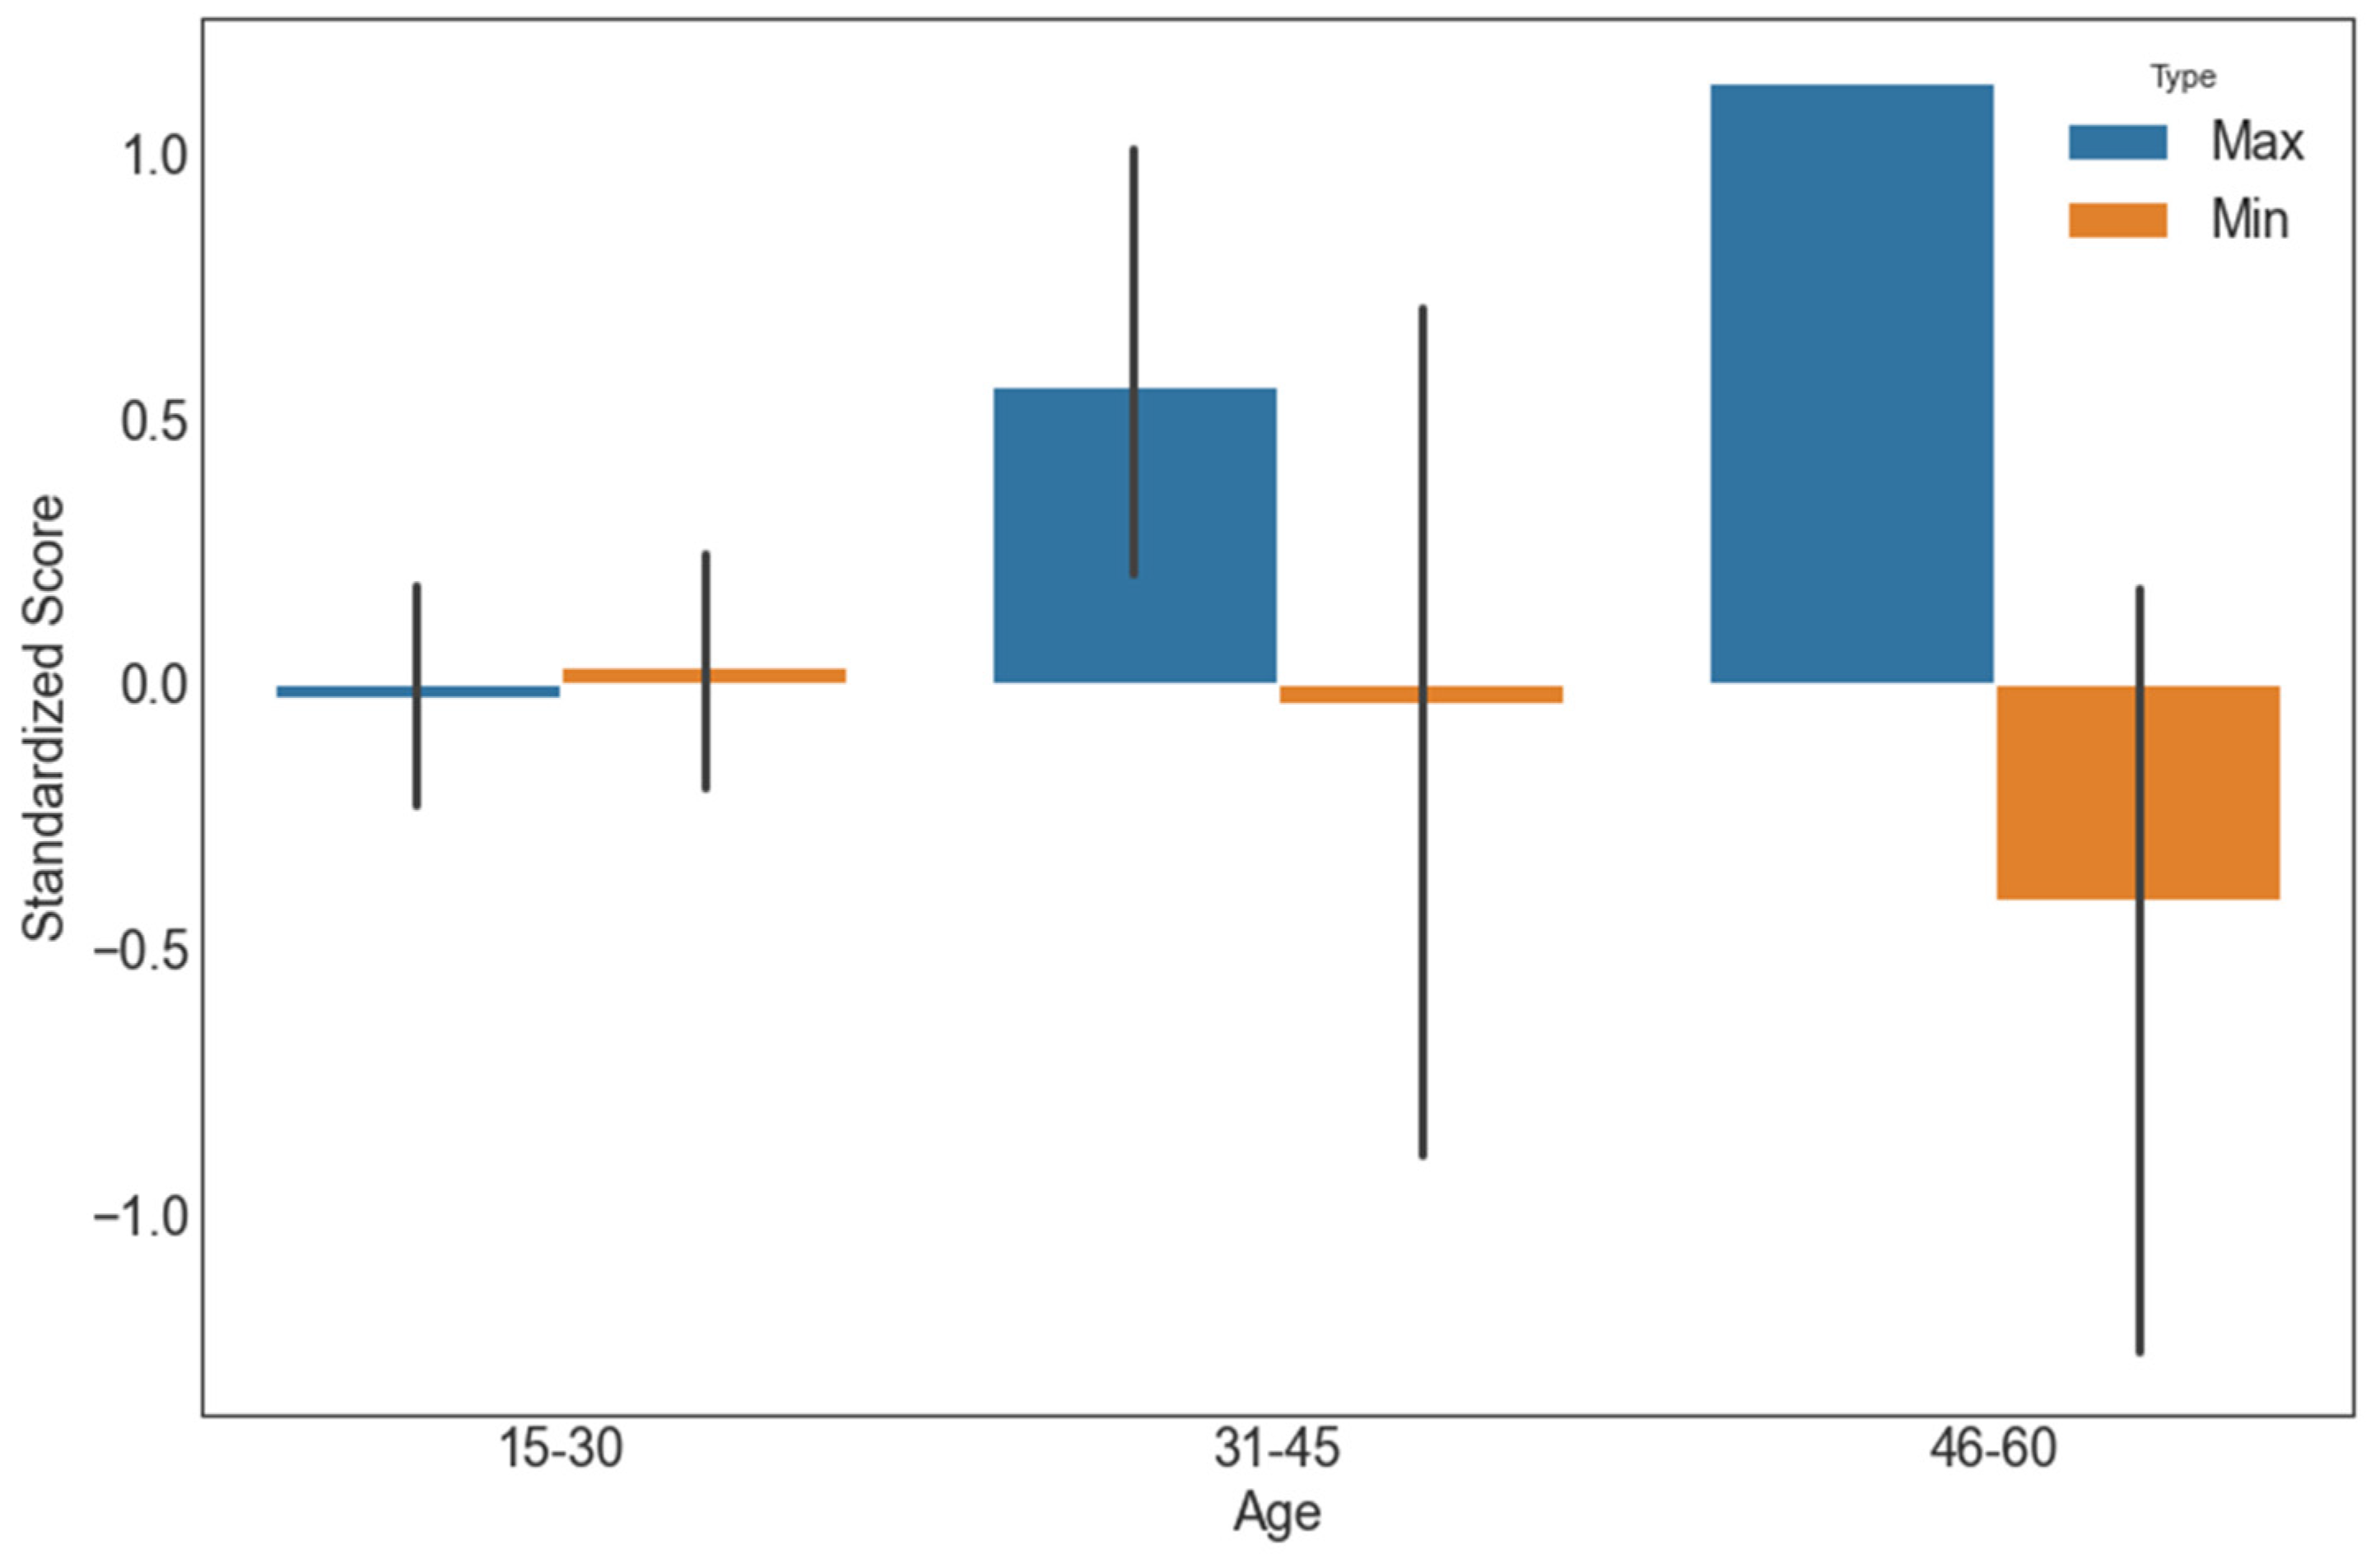
In order to provide better consumer understanding, thorough data analysis was conducted for those users among whom reliability belongs to the most positive or negative aspects of the e-commerce platform. It should be noted that 52% of respondents positively assess reliability. As it turned out, users aged 31–60 with above-average e-commerce awareness evaluate reliability as a competitive advantage of e-business. This is shown in Figure 11.
The exact correlation is seen in e-commerce aware users of the “Businessperson” occupation. At the same time, users aged 15–30 with a score close to the mean think of it as a drawback. Respondents whose e-commerce purchase frequency is shallow or does not even exist do not consider e-commerce reliable.
The same applies to respondents who make purchases mainly on a local market or retail store. This reaction might be the cause for making no purchases there or making them infrequently. Above 70% of customers who mostly purchase in the electronic category think e-commerce is unreliable; only 10% of restaurant food e-commerce customers think vice versa.
A total of 65.7% of respondents whose preferred payment option is credit/debit cards, think of e-commerce reliability as a negative aspect that needs further improvement.
4.4. US E-Commerce Records Cohort Analysis
The US 2020 E-commerce records data set was used to implement the cohort analysis. The data collection happened from January to December 2020 [60]. Cohort analysis can be very useful for analyzing time-series data to find patterns of change in customers’ behavior. It allows gaining a lot of valuable insights and exploring a vast range of metrics, corresponding trends. The customer’s monthly retention rate was calculated as a part of the analysis. The retention rate allows measuring the number of customers a company retains over a specific period [61,62]. The cohorts were formed based on transaction date features, and each user was assigned to a specific index depending on the interaction with an e-commerce platform. The result is visualized as a heatmap shown in Figure 12.
Cohort index 1 shows users who did their first interaction with the e-commerce platform on a specific month. If we look at cohort index 4 and the 2020-01 cohort month, we derive that only 24% of users made purchases in 2020-04 after being first introduced to the system four months earlier. This is the most significant value among all cohort indexes for this cohort month users. The highest retention rate equals 31% and is observed for the cohort month 2020-09 users at index 3. So, based on these statistics, we can answer the following business questions:
- What is the customers’ retention percentage?
- What month has the most interactions between users and the e-commerce platform?
- Does a specific cohort month have an impact on the retention rate? Is it related to any technical changes on the platform/promotions/business events?
- At what index the customer retention starts increasing/decreasing?
- What retention rate can we expect in the near future based on the current trend?
Solutions to these and other questions can be found using cohort analysis. From the chart above, we can see that the retention rage does not go above 31% and is 18% on average. We can clearly claim that only between 7% and 31% of customers were retained for the analyzed period. However, it does not mean that the same users interacted with the platform for the whole period. We can assume that a specific cohort sample interacted at index i. Another sample that might or might not contain previous sample users did its interaction at index i + n, and so forth.
5. Discussion
Business informatics is a very rapidly developing discipline with a lot of methods and applications to be studied. There are several educational programs and initiatives in business informatics in Europe to provide the labor market with resources capable of managing data in the business environment. According to statistics from the online service Keystone, there are 54 bachelor’s and 39 master’s degree programs in a set of business informatics disciplines. The study duration in these programs usually is from 6 to 8 semesters and covers the following aspects: computer analysis, data management, IT project management, computer systems, and software design. With the technological development, emphasis should also be placed on Big Data Analysis, Finance Machine Learning, and Data Science to be included in these courses. The number of such programs only increases, confirming the demand for business informatics, IT data, and knowledge management professionals in Europe and globally. Exchange of experience with business informatics specialists through the Web is necessary to conduct advanced research and implement the experience and results in the global academic environment. In particular, to create appropriate educational programs, methodological support for high-quality business informatics teaching, and organize corresponding international scientific and practical conferences. We have provided insights into the current research and development of cohort analysis usage in e-commerce and, essentially, business informatics. The emphasis is on the interpretability of the results that this technology delivers and the need to correlate various types of analysis with descriptive statistics. From a user perspective, the study of e-commerce aspects reveals valuable knowledge on what satisfies and frustrates users during online shopping. It can allow identifying users that need particular focus from the e-business representatives to increase the KPIs as well as e-business aspects that need improvement. This is especially critical during crises where trust is required for long-term business relationships with clients. We recommend researching implementing a strategy for efficient cohort analysis usage within specific industry representatives. This further study might explore tools, methods, and required resources regarding defined best practices.
The cohort analysis method requires the same user to have at least two actions completed over a period in order to form the cohort and provide knowledge. Nevertheless, the real-world limitations could complicate this process, and data might not be available. For instance, the user has not yet made more than one transaction or has temporarily stopped interacting with the system. Thus, this person cannot become a part of a cohort. We urge researching the possibility of cohort formation based on multiple users with similarities and representing them as a single entity. As an outcome, a cohort will contain N entities, where each of these entities contains M users with shared characteristics. Hence, the likeliness of collecting enough data about a specific entity is higher than when the entity consists of only a single person.
Open innovation in e-commerce can help establish an industry-validated framework for conducting cohort analysis and increase the interpretability of the obtained insights. From a long-term perspective, this will allow the presenting of high-quality research on cohort analysis and e-business. Recent studies shows that open innovation can lead to sustainability in the fourth industrial revolution. Yun J.J and others developed a quadruple-helix model to understand its dynamics in various areas [63]. Studies show that open innovation and technologies like artificial intelligence can help overcome post-COVID-19 challenges across organizations [64,65]. This fact is vital for e-commerce and other digital industries that have faced the fight against the pandemic period.
It is critical to research how software performance and infrastructure availability can engage new users and achieve a high retention rate. Thorough research on user engagement and its correlation with e-business service metrics has shown various methods for assessing system performance and customer satisfaction. This research can be extended with the cohort analysis application on the e-commerce data set, and new knowledge can be mined. We consider it essential to study the various aspects of e-business services from a customer perspective, mainly the reliability since our analysis revealed that different user categories perceive it differently. Further work on improving this experience needs to be undertaken.
6. Conclusions
To increase the level of data-drive business awareness, e-commerce representatives should enhance their business informatics usage; cohort analysis is one of these efficient methods that allow organizations to improve it. We conclude that in this way, these actors will make their business more observable than previously, detect gaps in the technological aspects, and accelerate the path of progress. As a result, e-commerce will move at the new pace of evolution of its representatives, develop new products and services, and meet the expectations of a new type of consumer. Adequate usage of the cohort analysis method will provide institutions with the necessary information resources to form an intelligent enterprise and a framework for crisis management. As an example, when considering the COVID-19 crisis, lack of specific practice negatively affected the dynamics of growth and turnover. Those representatives who already successfully used business informatics obtained the following results: the presence of multifunctional management information systems, quality business solutions, and efficient resources allocation. Once the business informatics best practices are followed, the cost and efficiency of e-commerce will be the most optimal. Thus, the study of COVID-19 impacts on the dynamics of business informatics advancement with the web users’ cohort analysis will increase e-business efficiency, identify trends in products and services, factors influencing current results, and model the progress of the events above in the future. The derived insights on e-commerce awareness could bring value to business persons. Our findings show a clear difference in the experience of customers on different understanding and loyalty levels. People with an above-average e-commerce awareness score consider e-commerce not as affordable and time-saving as other people with lower levels assume. The difference between the judgments of various aspects, mainly the wide range of products, in the e-commerce users’ behavior depends on the assigned score. For instance, respondents with high scores consider this an advantage, thus confirming the presence of a wide-ranging aspect in the e-commerce platform, whereas less aware participants think the opposite. These and other insights obtained will help make appropriate business decisions on the following items:
- Technical and/or business aspects that need improvements;
- Customer perception of e-business;
- User satisfaction/dissatisfaction;
- Observability of the customer journey and infrastructure performance.
Moreover, an e-business might discover what new data it needs to collect to mine extra knowledge, understand whether the industry standards are met, and focus on the next steps. On the other hand, if more focus is on a particular e-commerce aspect than others or the e-business, there is a certain probability of losing specific groups of users. So, a balanced attitude towards aspects improvements should be taken into account.
However, implementing the mentioned above cohort analysis usage might require resources. Because of this, we recommend doing so successively with continuous evaluation and optimization. The results need to be adequately interpreted, and sometimes, external consultants need to be hired to guide towards the next steps. If we take the whole population of customers in the cohort analysis, there is less impact on the types of people participating in it. Moreover, in some cases, the researchers cannot identify to what cohort-specific user belongs or the reasons for being a specific cohort part. It is worth mentioning that cohort analysis might provide value in the long run. In our study, we used the transaction date characteristic as a common one for grouping users into cohorts. The date features are used across various domains and tools as well. We recommend specifying a more specific characteristic that describes the group or multiple features to form the cohorts. This approach will increase the similarity among users in a cohort and allow precise knowledge mining on them. It might include products bought during a period, interests and acquisition date, location, shopping frequency, e-business aspects perception, and awareness. The researchers will benefit from this because they will have more control over the sampling process than when there is little transparency in cohorts’ formation. Characteristics can be selected based on statistical analysis and updated if changes in the real-world data occur. Big data is very promising in terms of cohort analysis usage in e-commerce. Its application in this area can reveal insight and allow efficient cohort formation. Mainly, we can use Big Data to sample users for the cohort analysis, thus having control over the data collection process. Nevertheless, if the business focuses on a short-term goal and needs results immediately, or there are not enough resources and time to execute the cohort analysis, other methods might become more valuable than this one. Further empirical analysis on industry and research-proven cases need to be accomplished. This method in e-commerce requires thorough explorations to deliver valuable results and prove expectations.
Author Contributions
Conceptualization, S.F.; methodology, S.F.; validation, S.F.; formal analysis, S.F.; investigation, S.F.; resources, T.U. and S.F.; data curation, S.F.; writing—original draft preparation, S.F. and T.U.; writing—review and editing, T.U. and S.F.; visualization, T.U.; project administration, S.F. All authors have read and agreed to the published version of the manuscript.
Funding
This research received no external funding.
Institutional Review Board Statement
Not applicable.
Informed Consent Statement
Not applicable.
Data Availability Statement
Not applicable.
Acknowledgments
This research is supported by the National Research Foundation of Ukraine within the project, “Methods of managing the web community in terms of psychological, social and economic influences on society during the COVID-19 pandemic”, grant number 174/01/0341 (S. Fedushko—executor).
Conflicts of Interest
The authors declare no conflict of interest.
References
- Sirimanne, S.N. COVID-19 and E-Commerce: A Global Review. UNCTAD and eTrade Global Review. 2021. Available online: https://unctad.org/system/files/official-document/dtlstict2020d13_en_0.pdf (accessed on 15 October 2021).
- Fedushko, S.; Ustyianovych, T.; Syerov, Y.; Peracek, T. User-Engagement Score and SLIs/SLOs/SLAs Measurements Correlation of E-Business Projects Through Big Data Analysis. Appl. Sci. 2020, 10, 9112. [Google Scholar] [CrossRef]
- OECD Policy Responses to Coronavirus (COVID-19). E-Commerce in the Time of COVID-19. 2020. Available online: https://read.oecd-ilibrary.org/view/?ref=137_137212-t0fjgnerdb&title=E-commerce-in-the-time-of-COVID-19 (accessed on 15 October 2021).
- Zhao, Y.; Bacao, F. How Does Gender Moderate Customer Intention of Shopping via Live-Streaming Apps during the COVID-19 Pandemic Lockdown Period? Int. J. Environ. Res. Public Health 2021, 18, 13004. [Google Scholar] [CrossRef]
- Hermes, A.; Riedl, R. Influence of Personality Traits on Choice of Retail Purchasing Channel: Literature Review and Research Agenda. J. Theor. Appl. Electron. Commer. Res. 2021, 16, 3299–3320. [Google Scholar] [CrossRef]
- Abdul Hussien, F.T.; Rahma, A.M.S.; Abdulwahab, H.B. An E-Commerce Recommendation System Based on Dynamic Analysis of Customer Behavior. Sustainability 2021, 13, 10786. [Google Scholar] [CrossRef]
- Luo, H.; Cheng, S.; Zhou, W.; Song, W.; Yu, S.; Lin, X. Research on the Impact of Online Promotions on Consumers’ Impulsive Online Shopping Intentions. J. Theor. Appl. Electron. Commer. Res. 2021, 16, 2386–2404. [Google Scholar] [CrossRef]
- D’Adamo, I.; González-Sánchez, R.; Medina-Salgado, M.S.; Settembre-Blundo, D. Methodological Perspective for Assessing European Consumers’ Awareness of Cybersecurity and Sustainability in E-Commerce. Sustainability 2021, 13, 11343. [Google Scholar] [CrossRef]
- Zabukovšek, S.S.; Tominc, P.; Bobek, S. Business Informatics Principles. In Spationomy; Pászto, V., Jürgens, C., Tominc, P., Burian, J., Eds.; Springer: Cham, Switzerland, 2020. [Google Scholar] [CrossRef] [Green Version]
- Du, X.; Liu, B.; Zhang, J. Application of business intelligence based on big data in e-commerce data analysis. J. Phys. Conf. Ser. 2019, 1395, 012011. [Google Scholar] [CrossRef] [Green Version]
- Zumstein, D.; Kotowski, W. Success Factors of E-Commerce-Drivers of the Conversion Rate and Basket Value. In Proceedings of the 18th International Conference e-Society 2020, Sofia, Bulgaria, 2–4 April 2020; pp. 43–50. [Google Scholar]
- Ahmed, H.; Jilani, T.A.; Haider, W.; Abbasi, M.A.; Nand, S.; Kamran, S. Establishing standard rules for choosing best KPIs for an e-commerce business based on google analytics and machine learning technique. Int. J. Adv. Comput. Sci. Appl. 2017, 8, 12–24. [Google Scholar] [CrossRef] [Green Version]
- Google Analytics Help. About Cohorts. Available online: https://support.google.com/analytics/answer/6158745?hl=en#zippy=%2Cin-this-article (accessed on 13 December 2021).
- Lin, X.; Wang, X.; Hajli, N. Building e-commerce satisfaction and boosting sales: The role of social commerce trust and its antecedents. Int. J. Electron. Commer. 2019, 23, 328–363. [Google Scholar] [CrossRef]
- Thiab, A.S.; Yusoh, Z.I.M.; Bin Shibghatullah, A.S. Internet of things-security and trust in e-Business. J. Eng. Appl. Sci. 2018, 13, 4939–4948. [Google Scholar] [CrossRef]
- Svobodová, Z.; Rajchlová, J. Strategic Behavior of E-Commerce Businesses in Online Industry of Electronics from a Customer Perspective. Adm. Sci. 2020, 10, 78. [Google Scholar] [CrossRef]
- Kuehnl, C.; Jozic, D.; Homburg, C. Effective customer journey design: Consumers’ conception, measurement, and consequences. J. Acad. Mark. Sci. 2019, 47, 551–568. [Google Scholar] [CrossRef]
- New Relic. Digital Experience Monitoring. Available online: https://newrelic.com/resources/datasheets/customer-experience-monitoring (accessed on 14 December 2021).
- Sabaitytė, J.; Davidavičienė, V.; Straková, J.; Raudeliūnienė, J. Decision tree modelling of E-consumers’ preferences for internet marketing communication tools during browsing. Econ. Manag. 2019, 22, 206–224. [Google Scholar] [CrossRef]
- TechValidate Customer Research Library. TechValidate Research on Scopus. Available online: https://www.techvalidate.com/product-research/scopus (accessed on 14 December 2021).
- Olaniyan, T.; Pinault, L.; Li, C.; van Donkelaar, A.; Meng, J.; Martin, R.V.; Hystad, P.; Robichaud, A.; Ménard, R.; Tjepkema, M.; et al. Ambient Air Pollution and the Risk of Acute Myocardial Infarction and Stroke: A National Cohort Study. Environ. Res. 2021, 204, 111975. [Google Scholar] [CrossRef]
- Wang, T.; Lv, Z.; Wen, Y.; Zou, X.; Zhou, G.; Cheng, J.; Zhong, D.; Zhang, Y.; Yu, S.; Liu, N.; et al. Associations of Plasma Multiple Metals with Risk of Hyperuricemia: A Cross-Sectional Study in a Mid-Aged and Older Population of China. Chemosphere 2021, 287, 132305. [Google Scholar] [CrossRef]
- Ballesteros-Pomar, M.D.; González-Arnáiz, E.; Maza, B.P.-D.; Barajas-Galindo, D.; Ariadel-Cobo, D.; González-Roza, L.; Cano-Rodríguez, I. Bioelectrical Impedance Analysis as an Alternative to Dual-Energy X-Ray Absorptiometry in the Assessment of Fat Mass and Appendicular Lean Mass in Patients with Obesity. Nutrition 2021, 93, 111442. [Google Scholar] [CrossRef] [PubMed]
- Zhang, Y.; Xie, Y.; Feng, Y.; Wang, Y.; Xu, X.; Zhu, S.; Xu, F.; Feng, N. Construction and Verification of a Prognostic Risk Model Based on Immunogenomic Landscape Analysis of Bladder Caner. Gene 2021, 808, 145966. [Google Scholar] [CrossRef]
- Tundo, A.; Betro, S.; Iommi, M.; de Filippis, R. Efficacy and Safety of 24-Week Pramipexole Augmentation in Patients with Treatment Resistant Depression. A Retrospective Cohort Study. Prog. Neuro-Psychopharmacol. Biol. Psychiatry 2021, 112, 110425. [Google Scholar] [CrossRef]
- Sathyan, A.; Yuan, W.; Fleck, D.E.; Bonnette, S.; Diekfuss, J.A.; Martis, M.; Gable, A.; Myer, G.D.; Altaye, M.; Dudley, J.A.; et al. Genetic Fuzzy Methodology to Predict Time to Return to Play from Sports-Related Concussion. Lect. Notes Netw. Syst. 2021, 258, 380–390. [Google Scholar] [CrossRef]
- Le Quellec, A.; Edouard, T.; Audebert-Bellanger, S.; Pouzet, A.; Bourdet, K.; Colson, C.; Oriot, C.; Poignant, S.; Saraux, A.; Devauchelle-Pensec, V. Joint Involvement in Noonan Syndrome. A Retrospective Paediatric Descriptive Study. Jt. Bone Spine 2021, 89, 105270. [Google Scholar] [CrossRef]
- Liang, O.; Dezhong, K.; Daoqing, X.; Jing, N.; Xingqian, F.; Weichen, H. Comparative clinical efficacy of polymethyl methacrylate and self-solidifying calcium phosphate cement in vertebroplasty: A meta-analysis. Chin. J. Tissue Eng. Res. 2021, 26, 681–688. [Google Scholar] [CrossRef]
- Yang, J.Z.; Kang, C.Y.; Yuan, J.; Zhang, Y.; Wei, Y.J.; Xu, L.; Zhou, F.; Fan, X. Effect of Adverse Childhood Experiences on Hypothalamic–Pituitary–Adrenal (HPA) Axis Function and Antidepressant Efficacy in Untreated First Episode Patients with Major Depressive Disorder. Psychoneuroendocrinology 2021, 134, 105432. [Google Scholar] [CrossRef]
- Scott, J.; Vorspan, F.; Loftus, J.; Bellivier, F.; Etain, B. Using density of antecedent events and trajectory path analysis to investigate family-correlated patterns of onset of bipolar I disorder: A comparison of cohorts from Europe and USA. Int. J. Bipolar Disord. 2021, 9, 29. [Google Scholar] [CrossRef]
- Wang, J.; Wu, Q.-S.; Lu, J.; Ni, Y.-H.; Zhou, F. Low Vaccination Coverage of Pneumococcal Conjugate Vaccines (PCVs) in Shanghai, China: A Database Analysis Based on Birth Cohorts from 2012 to 2020. Vaccine 2021, 39, 6189–6194. [Google Scholar] [CrossRef]
- Polos, J.; Koning, S.; McDade, T. Do Intersecting Identities Structure Social Contexts to Influence Life Course Health? The Case of School Peer Economic Disadvantage and Obesity. Soc. Sci. Med. 2021, 289, 114424. [Google Scholar] [CrossRef]
- Fan, Z.; Lv, X.; Tu, L.; Zhang, M.; Yu, X.; Wang, H. Reduced Social Activities and Networks, but Not Social Support, Are Associated with Cognitive Decline among Older Chinese Adults: A Prospective Study. Soc. Sci. Med. 2021, 289, 114423. [Google Scholar] [CrossRef] [PubMed]
- Borga, L.G.; D’Ambrosio, C. Social Protection and Multidimensional Poverty: Lessons from Ethiopia, India and Peru. World Dev. 2021, 147, 105634. [Google Scholar] [CrossRef]
- Shen, M.; Gu, X.; Li, S.; Yu, Y.; Zou, B.; Chen, X. Exposure to Black Carbon Is Associated with Symptoms of Depression: A Retrospective Cohort Study in College Students. Environ. Int. 2021, 157, 106870. [Google Scholar] [CrossRef]
- Hales, S.; Atkinson, J.; Metcalfe, J.; Kuschel, G.; Woodward, A. Long Term Exposure to Air Pollution, Mortality and Morbidity in New Zealand: Cohort Study. Sci. Total Environ. 2021, 801, 149660. [Google Scholar] [CrossRef]
- Saucy, A.; de Hoogh, K.; Vienneau, D.; Tangermann, L.; Schäffer, B.; Wunderli, J.-M.; Probst-Hensch, N.; Röösli, M. Mutual Effects of Fine Particulate Matter, Nitrogen Dioxide, and Fireworks on Cause-Specific Acute Cardiovascular Mortality: A Case-Crossover Study in Communities Affected by Aircraft Noise. Environ. Pollut. 2021, 291, 118066. [Google Scholar] [CrossRef]
- Wierichs, R.J.; Kramer, E.; Reiss, B.; Schwendicke, F.; Krois, J.; Meyer-Lueckel, H.; Wolf, T. A Prospective, Multi-Center, Practice-Based Cohort Study on All-Ceramic Crowns. Dent. Mater. 2021, 37, 1273–1282. [Google Scholar] [CrossRef]
- Beebe-Wang, N.; Okeson, A.; Althoff, T.; Lee, S.-I. Efficient and Explainable Risk Assessments for Imminent Dementia in an Aging Cohort Study. IEEE J. Biomed. Health Inform. 2021, 25, 2409–2420. [Google Scholar] [CrossRef] [PubMed]
- Sanghi, A.; Gruber, J.J.; Metwally, A.; Jiang, L.; Reynolds, W.; Sunwoo, J.; Orloff, L.; Chang, H.Y.; Kasowski, M.; Snyder, M.P. Chromatin Accessibility Associates with Protein-RNA Correlation in Human Cancer. Nat. Commun. 2021, 12, 5732. [Google Scholar] [CrossRef] [PubMed]
- He, Q.; Liu, L.; Chang, H.-T.; Wu, C.-D.; Ji, J.S. Residential Green Space Structures and Mortality in an Elderly Prospective Longitudinal Cohort in China. Environ. Res. Lett. 2021, 16, 094003. [Google Scholar] [CrossRef]
- Hu, Y. Divergent Gender Revolutions: Cohort Changes in Household Financial Management across Income Gradients. Gend. Soc. 2021, 35, 746–777. [Google Scholar] [CrossRef]
- Espuny Pujol, F.; Hancock, R.; Morciano, M. Trends in Survival of Older Care Home Residents in England: A 10-Year Multi-Cohort Study. Soc. Sci. Med. 2021, 282, 113883. [Google Scholar] [CrossRef]
- Carmichael, D.; MacEachen, C.; Archibald, J. Gamification in a Learning Resource for the Study of Human Computer Interaction. Lect. Notes Netw. Syst. 2021, 283, 697–717. [Google Scholar] [CrossRef]
- Cai, D.; Liu, W.; Ji, L.; Shi, D. Bayesian optimization assisted meal bolus decision based on Gaussian processes learning and risk-sensitive. Cont. Eng. Pract. 2021, 114, 104881. [Google Scholar] [CrossRef]
- Wodschow, K.; Bihrmann, K.; Larsen, M.L.; Gislason, G.; Ersbøll, A.K. Geographical Variation and Clustering Are Found in Atrial Fibrillation beyond Socioeconomic Differences: A Danish Cohort Study, 1987–2015. Int. J. Health Geogr. 2021, 20, 11. [Google Scholar] [CrossRef]
- Jankvist, U.T.; Gregersen, R.M.; Lauridsen, S.D. Illustrating the Need for a ‘Theory of Change’ in Implementation Processes. ZDM-Math. Educ. 2021, 53, 1047–1057. [Google Scholar] [CrossRef]
- Mill, J.; Agudelo, V.; Olivares, A.L.; Pons, M.I.; Silva, E.; Nuñez-Garcia, M.; Morales, X.; Arzamendi, D.; Freixa, X.; Noailly, J.; et al. Sensitivity Analysis of in Silico Fluid Simulations to Predict Thrombus Formation after Left Atrial Appendage Occlusion. Mathematics 2021, 9, 2304. [Google Scholar] [CrossRef]
- Chrysochou, E.; Koukoulakis, K.; Kanellopoulos, P.G.; Sakellari, A.; Karavoltsos, S.; Dassenakis, M.; Minaidis, M.; Maropoulos, G.; Bakeas, E. Human Serum Elements’ Levels and Leukemia: A First Pilot Study from an Adult Greek Cohort. J. Trace Elem. Med. Biol. 2021, 68, 126833. [Google Scholar] [CrossRef] [PubMed]
- Broder, J.C.; Gao, C.X.; Abramson, M.J.; Wolfe, R.; Dimitriadis, C.; Ikin, J.; Sim, M.R.; Del Monaco, A.; Johnston, F.H.; Carroll, M.; et al. Long-Term Impact of Exposure to Coalmine Fire Emitted PM2.5 on Emergency Ambulance Attendances. Chemosphere 2021, 288, 132339. [Google Scholar] [CrossRef]
- Su, Y.-S.; Lien, D.; Yao, Y. Economic Growth and Happiness in China: A Bayesian Multilevel Age-Period-Cohort Analysis Based on the CGSS Data 2005–2015. Int. Rev. Econ. Financ. 2021, 77, 191–205. [Google Scholar] [CrossRef]
- Pondee, P.; Panjaburee, P.; Srisawasdi, N. Preservice Science Teachers’ Emerging Pedagogy of Mobile Game Integration: A Tale of Two Cohorts Improvement Study. Res. Pract. Technol. Enhanc. Learn. 2021, 16, 16. [Google Scholar] [CrossRef]
- Wang, H.; Joshi, P.; Hong, S.-H.; Maye, P.F.; Rowe, D.W.; Shin, D.-G. cTAP: A Machine Learning Framework for Predicting Target Genes of a Transcription Factor Using a Cohort of Gene Expression Data Sets. In Proceedings of the 2020 IEEE International Conference on Bioinformatics and Biomedicine (BIBM), Seoul, Korea, 16–19 December 2020; pp. 164–167. [Google Scholar] [CrossRef]
- Manolio, T.A.; Goodhand, P.; Ginsburg, G. The International Hundred Thousand Plus Cohort Consortium: Integrating Large-Scale Cohorts to Address Global Scientific Challenges. Lancet Digit. Health 2020, 2, e567–e568. [Google Scholar] [CrossRef]
- Ekman, A.; Litton, J.-E. New times, new needs; E-epidemiology. Eur. J. Epidemiol. 2007, 22, 285–292. [Google Scholar] [CrossRef]
- Yun, J.J.; Zhao, X.; Jung, K.; Yigitcanlar, T. The Culture for Open Innovation Dynamics. Sustainability 2020, 12, 5076. [Google Scholar] [CrossRef]
- Majumder, S. Survey Data on E-Commerce Awareness. Kaggle. Available online: https://www.kaggle.com/swatickmajumder/survey-data-onecommerce-awareness-excel (accessed on 15 October 2021).
- Yun, J.J.; Won, D.; Park, K. Entrepreneurial cyclical dynamics of open innovation. J. Evol. Econ. 2018, 28, 1151–1174. [Google Scholar] [CrossRef]
- Yun, J.J.; Kim, D.; Yan, M.-R. Open Innovation Engineering—Preliminary Study on New Entrance of Technology to Market. Electronics 2020, 9, 791. [Google Scholar] [CrossRef]
- Kaggle Datasets (User: Ammaraahmad). United States E-Commerce Records 2020. Kaggle. Available online: https://www.kaggle.com/ammaraahmad/us-ecommerce-record-2020 (accessed on 15 October 2021).
- Kuan, H.H.; Bock, G.W.; Vathanophas, V. Comparing the effects of usability on customer conversion and retention at e-commerce websites. In Proceedings of the 38th Annual Hawaii International Conference on System Sciences, Big Island, HI, USA, 3–6 January 2005. [Google Scholar]
- Muchardie, B.G.; Gunawan, A.; Aditya, B. E-Commerce Market Segmentation Based on the Antecedents of Customer Satisfaction and Customer Retention. In Proceedings of the International Conference on Information Management and Technology (ICIMTech), Jakarta/Bali, Indonesia, 19–20 August 2019; pp. 103–108. [Google Scholar] [CrossRef]
- Yun, J.J.; Liu, Z. Micro- and Macro-Dynamics of Open Innovation with a Quadruple-Helix Model. Sustainability 2019, 11, 3301. [Google Scholar] [CrossRef] [Green Version]
- Madhav, A.V.S.; Tyagi, A.K. The World with Future Technologies (Post-COVID-19): Open Issues, Challenges, and the Road Ahead. In Intelligent Interactive Multimedia Systems for e-Healthcare Applications; Tyagi, A.K., Abraham, A., Kaklauskas, A., Eds.; Springer: Singapore, 2021. [Google Scholar] [CrossRef]
- Zhao, S. Innovation of Economic Business Model Based on Particle Swarm Optimization Algorithm. In Lecture Notes on Data Engineering and Communications Technologies, Proceedings of the 2021 International Conference on Machine Learning and Big Data Analytics for IoT Security and Privacy. SPIoT 2021; Macintyre, J., Zhao, J., Ma, X., Eds.; Springer: Cham, Switzerland, 2021. [Google Scholar] [CrossRef]
Figure 1.
The search results for TITLE-ABS-KEY (cohort AND analysis) query by year in the Scopus database for the 1947–2021 period as of 20 October 2021.
Figure 1.
The search results for TITLE-ABS-KEY (cohort AND analysis) query by year in the Scopus database for the 1947–2021 period as of 20 October 2021.

Figure 2.
The search results for TITLE-ABS-KEY (cohort AND analysis) query by subject area in Scopus database for the 1947–2021 period as of 20 October 2021.
Figure 2.
The search results for TITLE-ABS-KEY (cohort AND analysis) query by subject area in Scopus database for the 1947–2021 period as of 20 October 2021.

Figure 3.
The search query for the scientific papers in the Scopus database.

Figure 4.
The search results by country and territory for the (TITLE-ABS-KEY (business AND informatics) AND TITLE-ABS-KEY (cohort AND analysis)) query during the 2007–2020 period.
Figure 4.
The search results by country and territory for the (TITLE-ABS-KEY (business AND informatics) AND TITLE-ABS-KEY (cohort AND analysis)) query during the 2007–2020 period.

Figure 5.
Sample age distribution by gender.

Figure 6.
E-commerce awareness and loyalty score distributions.

Figure 7.
E-commerce awareness and loyalty score distributions.

Figure 8.
E-commerce aspects importance from a customer point of view.

Figure 9.
(a) Correlation of user aspects importance with the mean e-commerce awareness score; (b) correlation between user aspects importance with the median e-commerce awareness score.
Figure 9.
(a) Correlation of user aspects importance with the mean e-commerce awareness score; (b) correlation between user aspects importance with the median e-commerce awareness score.

Figure 10.
Standardized e-commerce awareness score distribution by purchase frequency.

Figure 11.
Standardized e-commerce awareness score distribution by age range for Reliability aspect.
Figure 11.
Standardized e-commerce awareness score distribution by age range for Reliability aspect.

Figure 12.
Standardized e-commerce awareness score distribution by age range for Reliability aspect.
Figure 12.
Standardized e-commerce awareness score distribution by age range for Reliability aspect.


Table 1.
Analysis of Cohort analysis keywords usage in Scopus indexed scientific documents.
| Subject Area | Documents | References | |
|---|---|---|---|
| Medical Science | Medicine | 639,467 |
|
| Biochemistry, Genetics and Molecular Biology | 127,446 | ||
| Neuroscience | 39,987 | ||
| Immunology and Microbiology | 33,780 | ||
| Nursing | 32,030 | ||
| Pharmacology, Toxicology and Pharmaceutics | 22,486 | ||
| Health Professions | 21,006 | ||
| Psychology | 19,875 | ||
| Dentistry | 18,351 | ||
| Veterinary | 3463 | ||
| Social Sciences | 4686 | ||
| Environmental Science | Agricultural and Biological Sciences | 3613 | |
| Environmental Science | 4240 | ||
| Earth and Planetary Sciences | 4240 | ||
| Materials Science | 952 | ||
| Engineering | 4124 | ||
| Physical Science | Physics and Astronomy | 3781 | |
| Energy | 4124 | ||
| Arts and Humanities | 3508 | ||
| Computer Science | 1878 | ||
| Mathematics | 1871 | ||
| Chemical Science | Chemical Engineering | 1312 |
|
| Chemistry | 888 | ||
| Economics Science | Economics, Econometrics and Finance | 985 | |
| Business, Management, Accounting | 201 | ||
| Decision Sciences | 4686 | ||
Table 2.
Review of cohort analysis usage in business informatics in Scopus indexed research papers.
| Year | Documents | Country/Territory |
|---|---|---|
| 2020 | 2 | Germany United States |
| 2019 | 1 | Germany |
| 2018 | 2 | United Kingdom United States |
| 2017 | 1 | Netherlands |
| 2014 | 1 | United States |
| 2013 | 2 | United States Germany Netherlands |
| 2010 | 1 | Italy |
| 2007 | 1 | Sweden |
| Total | 11 |
Table 3.
Data conversion for e-commerce awareness and loyalty score assignment.
| Column(s) | Actual Values | Assigned Values |
|---|---|---|
| Do you know about E-commerce business (Online business)? Do you like buying from online businesses? Is an E-Commerce business available in your location? Will you prefer others to use E-Commerce businesses? | Yes Maybe No | 1.0 0.5 0.0 |
| E-Commerce is the future of shopping. E-Commerce businesses are easy to understand and use. E-Commerce business is for everyone. Delivery through E-commerce businesses is fast. Delivery through E-commerce businesses is reliable. Payments in E-Commerce are safe. Products and Services on E-Commerce businesses are up to the mark. | Agree Neutral Disagree | 1 0 −1 |
| E-Commerce business kills local businesses. | Agree Neutral Disagree | −1 0 1 |
Table 4.
Descriptive statistics of the standardized e-commerce awareness and loyalty level score.
| Statistics | Male Score | Female Score |
|---|---|---|
| Mean | 0.18 | −0.1 |
| 25th percentile | −0.25 | −0.77 |
| 50th percentile | 0.18 | −0.05 |
| 75th percentile | 0.93 | 0.65 |
| 95th percentile | 1.51 | 1.22 |
Publisher’s Note: MDPI stays neutral with regard to jurisdictional claims in published maps and institutional affiliations. |
© 2022 by the authors. Licensee MDPI, Basel, Switzerland. This article is an open access article distributed under the terms and conditions of the Creative Commons Attribution (CC BY) license (https://creativecommons.org/licenses/by/4.0/).
Share and Cite
MDPI and ACS Style
Fedushko, S.; Ustyianovych, T. E-Commerce Customers Behavior Research Using Cohort Analysis: A Case Study of COVID-19. J. Open Innov. Technol. Mark. Complex. 2022, 8, 12. https://doi.org/10.3390/joitmc8010012
AMA Style
Fedushko S, Ustyianovych T. E-Commerce Customers Behavior Research Using Cohort Analysis: A Case Study of COVID-19. Journal of Open Innovation: Technology, Market, and Complexity. 2022; 8(1):12. https://doi.org/10.3390/joitmc8010012
Chicago/Turabian StyleFedushko, Solomiia, and Taras Ustyianovych. 2022. "E-Commerce Customers Behavior Research Using Cohort Analysis: A Case Study of COVID-19" Journal of Open Innovation: Technology, Market, and Complexity 8, no. 1: 12. https://doi.org/10.3390/joitmc8010012