Article

Digitalizing Gratitude and Building Trust through Technology in a Post-COVID-19 World—Report of a Case from Japan

NEC Solution Innovators Ltd., 1-18-7 Shinkiba, Koto-ku, Tokyo 136-8627, Japan
*
Author to whom correspondence should be addressed.
J. Open Innov. Technol. Mark. Complex. 2022, 8(1), 22; https://doi.org/10.3390/joitmc8010022
Submission received: 14 December 2021 / Revised: 8 January 2022 / Accepted: 12 January 2022 / Published: 14 January 2022

Abstract

:
Employee engagement has become a critical issue in Japanese companies. One way to develop it is to improve the relationship among employees through gratitude expressions. In the post-COVID-19 remote work environment, digital devices are essential. This paper confirms that expressions of gratitude delivered via digital devices enhance the relationship between employees. We experimented in a small-town government office where participants (n = 88) were asked to (1) use the Thanks App, an app we developed to express gratitude, for two months and (2) respond to an engagement survey we developed before and after the experimental period. Through cross-analysis of the data from the app and questionnaire, we found that the “trust in colleagues” factor had a strong correlation (r = 0.80, p < 0.001) with our new index computed by the app’s data. The results suggest that the use of the Thanks App may help visualize the trust relationship among teams. This study has a practical value in providing a new team management tool for visualizing team trust. In addition, it provides a new research method for emotional and social psychology using digital devices.

1. Introduction

Since Gallup’s State of the Global Workplace Report 2017 pointed out that employee engagement in Japan is far lower than in other countries, employee engagement has been a critical issue for Japanese companies. In the recently released 2021 edition of the same report, the employee engagement score in Japan worsened by one point. As a result, Japan ranked last out of 141 countries, along with Italy and Algeria.
Last year, the COVID-19 pandemic forced Japanese employees to resort to telework. Telework made it apparent that there are challenges in building trust, employee engagement, or well-being in the work environment without face-to-face communications. Therefore, building trust, employee engagement, or well-being in online work became tangible problems.
Our research on corporate and governmental employee engagement has been ongoing in Japan since 2015. In preliminary studies, we observed two results related to employee engagement. First, per our company survey in 2015, we found that gratitude correlated with supervisor and colleague support, factors that are closely related to employee engagement. Second, in a 2017 questionnaire, we found that 43% of ordinary Japanese people hesitate to feel and express gratitude. From these results, we hypothesize that employees feel gratitude and increased engagement from increased trust and support from colleagues and supervisors.
Recently, gratitude research has studied the social function of gratitude [1,2,3,4]. So, far, gratitude research has studied gratitude traits and emotions for individuals and the relationship among two people. In contrast, social gratitude studies examine the functions and effects of gratitude in groups of three or more people.
From the Job-Demands and Resources (JD-R) model on work engagement studies, one of the factors affecting work engagement was support from supervisors and colleagues. It is the degree to which you expect your supervisor or colleagues to support you when you ask for help. In other words, it means to trust. Meanwhile, according to the “find-remind-and-bind” theory on gratitude studies, expressing gratitude establishes a positive one-on-one relationship. Therefore, one can hypothesize that expressions of gratitude increase work engagement by improving relationships with supervisors and colleagues and increasing expectations for their support.
This study targets private companies or government offices in Japan because Gallup reports that employee engagement in Japan is among the lowest globally.
In addition, we want to conduct gratitude interventions using digital devices for three reasons. First, remote work is expected to become the norm in Japanese companies in the post-COVID-19 era. It will become challenging to express gratitude verbally in a remote work environment making digital devices even more essential. Second, previous gratitude studies have rarely used digital devices for intervention. Therefore, the effectiveness of gratitude through digital devices is not known and needs to be studied. Third, Japanese people, 43% of whom are unappreciative, need more ways to express their gratitude easily. Therefore, we need apps that allow people to express gratitude easily, anytime, anywhere, through digital devices.
Figure 1 shows a conceptual model built from the above theories. We would like to replace the gratitude intervention in this model with a gratitude intervention using digital devices. The purpose of this paper is to confirm that data on the expression of gratitude using digital devices are related to the relationship with supervisors and colleagues as a preparatory step or testing the intervention effect.
In the next section, we review previous research on the psychology of gratitude and work engagement. The third section is a description of our experiment. We describe the experimental methodology and the instruments used in our experiment. In the fourth section, we show the results of our experiment. We will conduct three analyses using the survey data, the digital data on gratitude, and both data together. In the fifth section, we discuss the gratitude using digital devices and the elements of engagement. We discuss the relation between the findings of this experiment and open innovation in the sixth section. Finally, we conclude this paper in the seventh section, and we mention the limitations of this study in the final section.

2. Literature Review

Recently, the social function of gratitude has been studied. Algoe et al. confirmed that gratitude behavior affects the people who witness it [1]. Makri et al. investigated the experience of gratitude in online communities and proposed a process model of social gratitude: the gratitude cycle [2]. Masaki et al. confirmed the impact of collective gratitude on affective commitment in organizations [3]. Sciara et al. confirmed that witnessing gratitude on social networking services (SNS) only partially enhances subjective well-being [4].
The gratitude study was started by McCullough in positive psychology [5]. McCullough et al. developed a questionnaire, the Gratitude Questionnaire-6 (GQ-6), to measure gratitude characteristics in an individual [6] and confirmed, using the questionnaire, that gratitude was related to subjective well-being [7]. All other questionnaires, including the Gratitude Adjective Checklist (GAC) [6], the Gratitude Resentment and Appreciation Test (GRAT) [8], and the Appreciation Scale [9], were developed by psychologists. Recently, a workplace-specific measure of gratitude, the Gratitude at Work Scale (GAWS), was developed [10,11].
Psychologists have identified four factors that inspire gratitude [12,13,14,15]: the value of benefits, the cost of helpers, the helper’s intention, and the obligation to assist. In contrast, Kuranaga and Higuchi found that the “naturalness of the situation” suppresses the gratitude of the Japanese people in their psychological studies [16]. Psychologists also confirmed the effect of gratitude on emotion. Bartlett and DeSteno showed that a grateful person behaves with prosocial behavior [17]. Grant and Gino showed that an appreciated person also behaves with prosocial behavior [18]. Lee et al. confirmed the relationship between receiving gratitude and proactive and reactive helping at work [19]. Many other psychologists confirmed the relation between gratitude and long-term well-being [5,9,20,21,22].
In psychology, researchers studied interventions using gratitude methods. Meaningful gratitude intervention methods include gratitude list, gratitude journal, three good things, and gratitude letter. Emmons and McCullough confirmed that the participants of their experiment using the gratitude list method increased appraisal of well-being and physical condition [23]. In a gratitude letter experiment, Seligman et al. confirmed that participants decreased depression and increased well-being [24]. Alternatively, Browning et al. confirmed the difficulty of the gratitude letter intervention because participants rarely wrote gratitude letters [25]. Algoe suggested the “find-remind-and-bind” theory, which demonstrated the effect of gratitude on strengthening relationships via her intervention studies [26]. O’Connell et al. [27] confirmed that intervention using a gratitude journal that is reflective, behavioral, and interpersonal improved emotional balance. Renshaw and Hindman [28] experimented with an intervention using instant communication technology instead of a gratitude letter. Moreover, they designed an intervention called brief grateful thinking and conducted a study [29]. Heckendorf et al. [30] confirmed that an Internet- and app-based gratitude intervention is effective for anxiety and depression. Furthermore, Klibert et al. [31] confirmed the effect of gratitude on maintaining positive emotions generated by positive experiences. Alternatively, placebo effects were attributed to interventions utilizing gratitude [32], which have been reported to exert little effect on anxiety and depression as well [33]. Dickens [34] reported that the effects of gratitude interventions are overemphasized. According to a review by van Agteren et al. [35], interventions based on mindfulness-based multifactorial positive psychology are effective instead of gratitude interventions alone. In neuroscience, Zack found that oxytocin is secreted in the brain when one feels gratitude and forms trust between people [36]. Algoe stated that oxytocin research is also useful in psychology [37].
According to the “find-remind-and-bind” theory, gratitude strengthens relationships between individuals in general. It is easy to expand this theory and apply it to employees. On the other hand, organizational culture is one of the most critical elements of employee relationships. Therefore, gratitude contributes to the organization and organizational culture [38]. Many researchers indicated the importance of organization or organizational culture on open innovation. The study of Kim and Choi confirmed that the intensity of organizational change moderates the relationship between the investment in human resource development and the perception of organizational innovation [39]. Srisathan et al. [40] found that organizational culture contributes to open innovation management through the mediating role of organizational sustainability. Naqshbandi et al. [41,42] confirmed that hierarchical organizational culture is negatively related to open innovation but positively related to learning culture. Lastly, Yun et al. [43] proposed organizational entrepreneurship as a culture that controls the dynamic process of open innovation.
Work engagement is the opposite concept of burnout, defined by Schaufeli et al. [44] as “a positive, fulfilling, work-related state of mind that is characterized by vigor, dedication, and absorption.” According to the definition, work engagement comprises three dimensions: vigor, dedication, and absorption. Concurrently, Schaufeli et al. [44,45,46] developed the Utrecht Work Engagement Scale (UWES), a measurement scale for work engagement. The UWES was translated into many languages and used for international comparisons [47,48]. According to Knight et al.’s study [49], 40 interventions for work engagement were tried. Recently, Komase et al. [50,51,52] reported an association between perceived gratitude and work engagement.
The JD-R model [53] is a model of the factors and outcomes of burnout and work engagement. The JD-R model divides multiple factors into two groups: job demands and job resources, where demands are mainly stressors such as workloads and lack of time, and resources are the support factors such as learning and promotion opportunities and support from superiors and colleagues. Several JD-R model studies [53,54,55,56,57,58,59,60,61] support that job demands do not directly contribute to work engagement. Therefore, the only way to improve work engagement is to improve job resources.
Similar concepts to work engagement are job involvement and organizational commitment. Job involvement refers to “the degree to which a person is identified psychologically with his work” [62] and represents the degree to which one is absorbed in one’s work. It implies that a state of high job involvement is working at the expense of life. In addition, Mowday et al. [63] explain the definition of organizational commitment as the degree of passive loyalty and willingness to devote to the company. It means that increasing organizational commitment requires employees to sacrifice their personal lives to serve the company.
This work style may be possible temporarily but not in the long term. If this work style continues, it gradually makes the worker a workaholic and increases the possibility of burnout syndrome. Consequently, companies that enforce this work style increase the risk that workers will not perform to their full potential or will leave the company. Therefore, it is necessary to focus on engagement, the opposite concept of burnout.
However, Allen and Meyer [64] divided organizational commitment into three categories: affective commitment, continuance commitment, and normative commitment. The affective commitment represents positive feelings toward the organization and is confirmed to be related to gratitude and engagement in studies of the JD-R model [53,54,55,56,57,58,59,60,61], Saks [65], Masaki et al. [3], and more. The continuance commitment and the normative commitment represent loyalty and obedience to the organization and are not used as organizational commitment in these studies.

3. Experimental Methods and Instruments

In 2018, we experimented with a division of a company in the same setting as this study to confirm the relationship between gratitude data and factors of engagement. However, the experiment did not yield quantitative results.
There are three reasons for this. First, there were only five teams in the targeted division. To examine the relationship between good team relations and gratitude, we collected the gratitude data on a team basis. Therefore, the sample size is the number of teams, not the number of people. We did not obtain any quantitative results from our five samples. We concluded that we need at least 10 teams. Second, staff members feel guilty about using their private smartphones during work in the Japanese workplace. Therefore, the teams with strict norms rarely used our prototype app. It led us to conclude that we need to formalize its use by either having all staff members own official smartphones or lending all staff members experimental smartphones. Third, there was a low need for appreciation in the sales team. Salespeople in the target division were individually very active and rarely had the opportunity to thank their colleagues. It led us to believe that it would be better to choose an organization with mainly back-office operations.
Further, we learned that staff motivation is an issue from our interviews with several local governments. Staff members were told only to demand or blame their residents, even if they contributed to them. Therefore, the local governments wanted to motivate their staff members by having them express their appreciation to each other.
In addition, we thought that the local government offices, which have many back-office works, would be suitable for our experiment. However, many local government offices in Japan prohibit the use of staff’s own smartphones at work. Therefore, we needed to lend out many smartphones for our experiment. We set the number of participants to be less than 100 to reduce the cost of renting out the smartphones. Nevertheless, we needed more than 10 teams to obtain quantitative results.
Based on the above conditions, we searched for a small-town hall with less than 100 staff members and more than 10 teams. As a result, the town office of Miyake Town in Nara Prefecture agreed to cooperate in 2019.

3.1. Recruiting

In the government office, 98 full-time staff members worked in 15 teams. We recruited participants from these staff through the information systems department in the government office. Consequently, 88 people participated in our experiment under an agreement.
This town government office has a large number of staff members in the age range 30–50s (75% of the total office) and a small number in their 20s (about 10%). Specifically, most of the employees in their 40s and above have been with the office for more than 20 years. This fact leads us to expect little change in human relations.
In addition, there are several specialized teams such as childcare, civil engineering, education, nursing care, and insurance. There is less staff turnover in these specialized teams due to the need for specialized knowledge and experience. Therefore, we believe that relationships are closer in the specialized teams.

3.2. Equipment and Process

For our experiment, we provided the participants with our engagement questionnaire, smartphones, and the “Thanks App,” the smartphone gratitude application. The participants responded to the questionnaire before and after the experiment. In the experiment, the participants used the “Thanks App” for two months.
The details of the experimental process are as follows.
First, we obtained permission from the town mayor to conduct our experiment. Then, we posted the invitation for study participants on the town government office’s information system. After the participants were confirmed, we rented iPhones from a rental company for a fee. We installed the Thanks App on all the rented iPhones and created an account for each participant. We prepared dummy e-mail addresses required for the accounts.
We prepared explanatory materials and consent forms for the experiment. We went to each participant with these materials and asked them to sign the consent form. We handed out iPhones, with the Thanks App installed, only to those participants who signed the consent form. On the iPhone, the website for answering the engagement questionnaire was already open. We asked them to answer the questionnaire on the spot.
One month after the experiment commenced, we made an interim report to the town’s mayor through a contact person. During the two months of the trial, we did not specifically intervene with the participants. One week before the end of the experiment, we sent out a request through the contact person for the participants to fill out the engagement questionnaire again. On the day the experiment ended, we thanked each participant and collected the loaned iPhones one by one. One month later, we reported the results of our experimental analysis to the mayor through the contact person.

3.3. Questionnaire

In the experiment, we used the Organizational Engagement Questionnaire (OEQ) we developed in Japanese. The questionnaire is a 43-question survey that measures the 10 factors listed in Table 1. The questions translated into English are shown in Appendix A. We discuss the reliability and validity of the questionnaire in Appendix B. The questionnaire used a seven-point Likert scale from 1 (strongly disagree) to 7 (strongly agree).

3.3.1. Development Process

We designed the questionnaire based on work engagement [44,45,46,47,48] and the JD-R model [53]. We collected many questions used to confirm the JD-R model in previous studies [53,54,55,56,57,58,59,60,61]. Further, we also added the questions for organizational climate (OC) for Japanese companies [66,67], team development [68], and organizational citizenship behavior (OCB) [69,70,71] because the JD-R model did not contain them. We translated all the English items to Japanese in the collected questions.
We identified 18 factors by exploratory factor analysis using the 1000 responses in Japanese that we collected through a research company. In the factor analysis, the loadings of each factor were equal to or greater than 0.5. The Cronbach’s alpha coefficients of each factor were equal to or greater than 0.8.
One of the 18 factors was work engagement. However, not all of the other factors may affect the work engagement factor. Therefore, we computed partial correlations between the average scores of 18 factors and obtained nine factors with significant correlations to the work engagement factor. Hence, we contained work engagement and the nine factors to our initial engagement questionnaire.
Finally, we shortened question items in the initial questionnaire using item-total (I-T) correlation because it contained many questions. The I-T correlation is the correlation between a score of one item and an average score of all items. We sorted the question items in descending order of the I-T correlation. We then calculated the correlation between the cumulative score of the items with the highest I-T correlation one by one and the overall score, selecting the question items with the correlation value of 0.95 or higher. We completed the final questionnaire, which is shortened to 43 items.

3.3.2. Measurement Factors

Work fulfillment (WF) is a factor related to work engagement [44,45,46]. Shimazu et al. developed a Japanese version of the Utrecht Work Engagement Survey (UWES-J) [47,48]. Because our use of UWES-J would be for commercial use, we created our own questions. However, we confirmed the conceptual validity between our items and the items of UWES-J using confirmatory factor analysis. Similar to UWES, the factor contains three sub-concepts: vigor, dedication, and absorption.
Love for organization (LO) integrated some questions from the affective organizational commitment and job satisfaction survey used in Saks’s study [65]. Saks confirmed that job engagement and organizational engagement are distinguished in his study. The factor contains four sub-concepts: meaningfulness, pride, preference, and satisfaction for the organization.
Teamwork (TW) is based on the Team Development Assessment (TDA) in a 4-D system used at the National Aeronautics and Space Administration [68]. Because there was no Japanese version of the TDA, we created our own Japanese questions. It originally comprised eight questions, but three questions remained as a result of shortening. This factor includes the sub-concepts of interest resolution, work commitment, and role clarity. Work commitment is a concept near job involvement.
Trust in colleagues (TC) picked up three questions from the rewarding coworker relations used in May’s study [72]. These questions were also not available in Japanese, so we translated them. These three questions ask about psychological connection, respect, and closeness among colleagues.
Reliable supervisors (RS) is based on the second factor, namely, confidence in superiors, of the OC scale in Japanese developed by S. Miyairi [66]. Our factor RS consisted of questions such as viewpoint variability, responsibility, policy explanation, and willingness to try new things.
Trust in supervisors (TS) comprised four questions analytically selected from the Multidimensional Leader-Member eXchange (LMX-MDM) [73]. We created Japanese translations of LMX-MDM’s questionnaire because we could not find a standard translation of LMX-MDM. LMX-MDM has four dimensions: affect, loyalty, contribution, and professional respect. However, due to the shortened questions, four questions on affect and loyalty remained in our factor.
Autonomy and feedback (AF) comprised nine questions about job characteristics [65,72,74]. We created Japanese questions because there was no standard translation of job characteristics. The nine questions include job autonomy, stakeholder expectation, feedback information of job purpose and job impact, opportunities and actions to learn about the organization’s key issues, transparency in decision making, opportunities to talk about work-related issues, and opportunities to participate in decision making.
Fairness of evaluation (FE) is based on the Organizational Justice Scale (OJS) [75]. Our questionnaire is based on a modified version of the Japanese version of the Organizational Justice Scale (OJS-J) [76]. The modification was made so that each question could be answered independently. Organizational justice (OJ) is composed of four dimensions: procedural justice, distributional justice, interpersonal justice, and information justice. However, only four questions remained in this questionnaire: two questions on distributive fairness and two questions on procedural fairness.
Openness in organization (OO) is based on Sekimoto’s [67] OC scale in Japanese. Sekimoto identified seven factors that characterize the OC of Japanese companies. However, the factor OO is composed of four questions picked up from the second factor “free and open-minded” and the fourth factor “flexibility, creativity, and originality” in Sekimoto’s seven factors. The four questions relate to the context in which true feelings, being yourself, being different from others, and straight expression are allowed.
Recommendation behavior (RB) is based on the OCB scales [69]. OCB is strongly influenced by culture, and dimensions defined in Japan and the United States vary. Therefore, there are many types of OCB scales [70,71]. However, for this factor, the organizational support behaviors in the Japanese version of the OCB scale were mainly selected. The three selected questions represent the behaviors of recommending your company, preserving image of your company, and defending your company.

3.4. Thanks App

We developed the Thanks App as a test tool, a simple smartphone application (Figure 2).
The primary function of the app is to send and receive a gratitude image with a short comment. The app has 110 images categorized into 11 kinds of positive affections, such as gratitude, gladness, and praise, and five levels of emotional strength. The user selects the recipient, chooses an image to express gratitude, writes a comment, and sends it to the recipient. The user can see the history of the images and the comments they sent and received.
The app can make closed groups to limit the number of recipients in the same group. In the experiment, we prepared a group that joined all participants. The app can also make subgroups to distinguish departments or teams. We created subgroups for each team to make it is easier to find recipients.
The app collects sent and received gratitude data the more often it is used. Gratitude data includes the sender’s ID, the receiver’s ID, an image ID, the level of emotional strength, and a comment. The gratitude data are saved in the database.
Using the gratitude data, we can show the social network structure formed by gratitude. We named this network “gratitude network.”

4. Results

A total of 88 participants joined in our experiment; 62 respondents (63% males, average age 49.1 years; 37% females, average age 40.7 years) answered the questionnaire before using the Thanks App. All participants used the Thanks App for about two months. At the end of the experiment, 26 respondents answered the original questionnaire anew. We decided not to use the second set of response data for our analysis because the number of responses was too small.
We originally planned to analyze and compare the before and after response data. Since we decided not to use the second response data, we changed the analysis plan to the following three steps. First, we aggregated the questionnaire data from each team in each factor. Second, we computed the app sent and received data from each team and formed network structures. Finally, we calculated the Pearson’s correlations between the questionnaire data and the app data.

4.1. Pre-Experiment Engagement Factors

Table 2 shows the average scores of our engagement on 10 factors for each team before the experiment.
The respondents weakly engage the organization because the total scores of all the factors are between 4.3 and 5.0. The factors with scores higher than 4.9 in total factor scores are TC and OO. The factors with scores less than 4.4 are LO and AF. These results indicate the job characteristics of small government offices. The before data shows that everyone knows each other and that opinions are freely expressed in a small office. The after data indicates that there is a lot of routine work and little feedback from participants in government work.
However, the scores of engagement factors differ from team to team. The staff in teams 3, 6, 14, and 15 are somewhat more strongly engaged because the scores of some factors are higher than 5.5. However, teams 14 and 15 only had one respondent; therefore, it should be considered only as a reference. Conversely, the staff in teams 2, 4, 5, 10, and 11 are weakly disengaged because the scores of multiple factors are less than 4.0; therefore, these scores mean negative responses.

4.2. Gratitude Count

We retrieved the Thanks App data from the database and counted the gratitude data for each team (Table 3).
The total sent and received was 4354 during the two-month experiment. The number of thanks between teams was higher (2939) than within teams (1415).
The team that sent the most thanks was team 6, with 954 sent, followed by team 3, with 629 sent. In team 6, the number of thanks within a team was less than that between teams. Conversely, there were more thanks within a team than between teams in team 3.
The team that sent the least gratitude was team 9, with only 23 thanks, followed by team 13, with only 27 thanks. We believe that the opportunity to send gratitude was too small because those two teams had two people.
We also calculated the gratitude count per user per team because the number of members was different for each one. However, we obtained the same results related to the teams that sent the most and least thanks. Thus, teams 3 and 6 sent thanks most often, and teams 9 and 13 barely sent thanks at all.

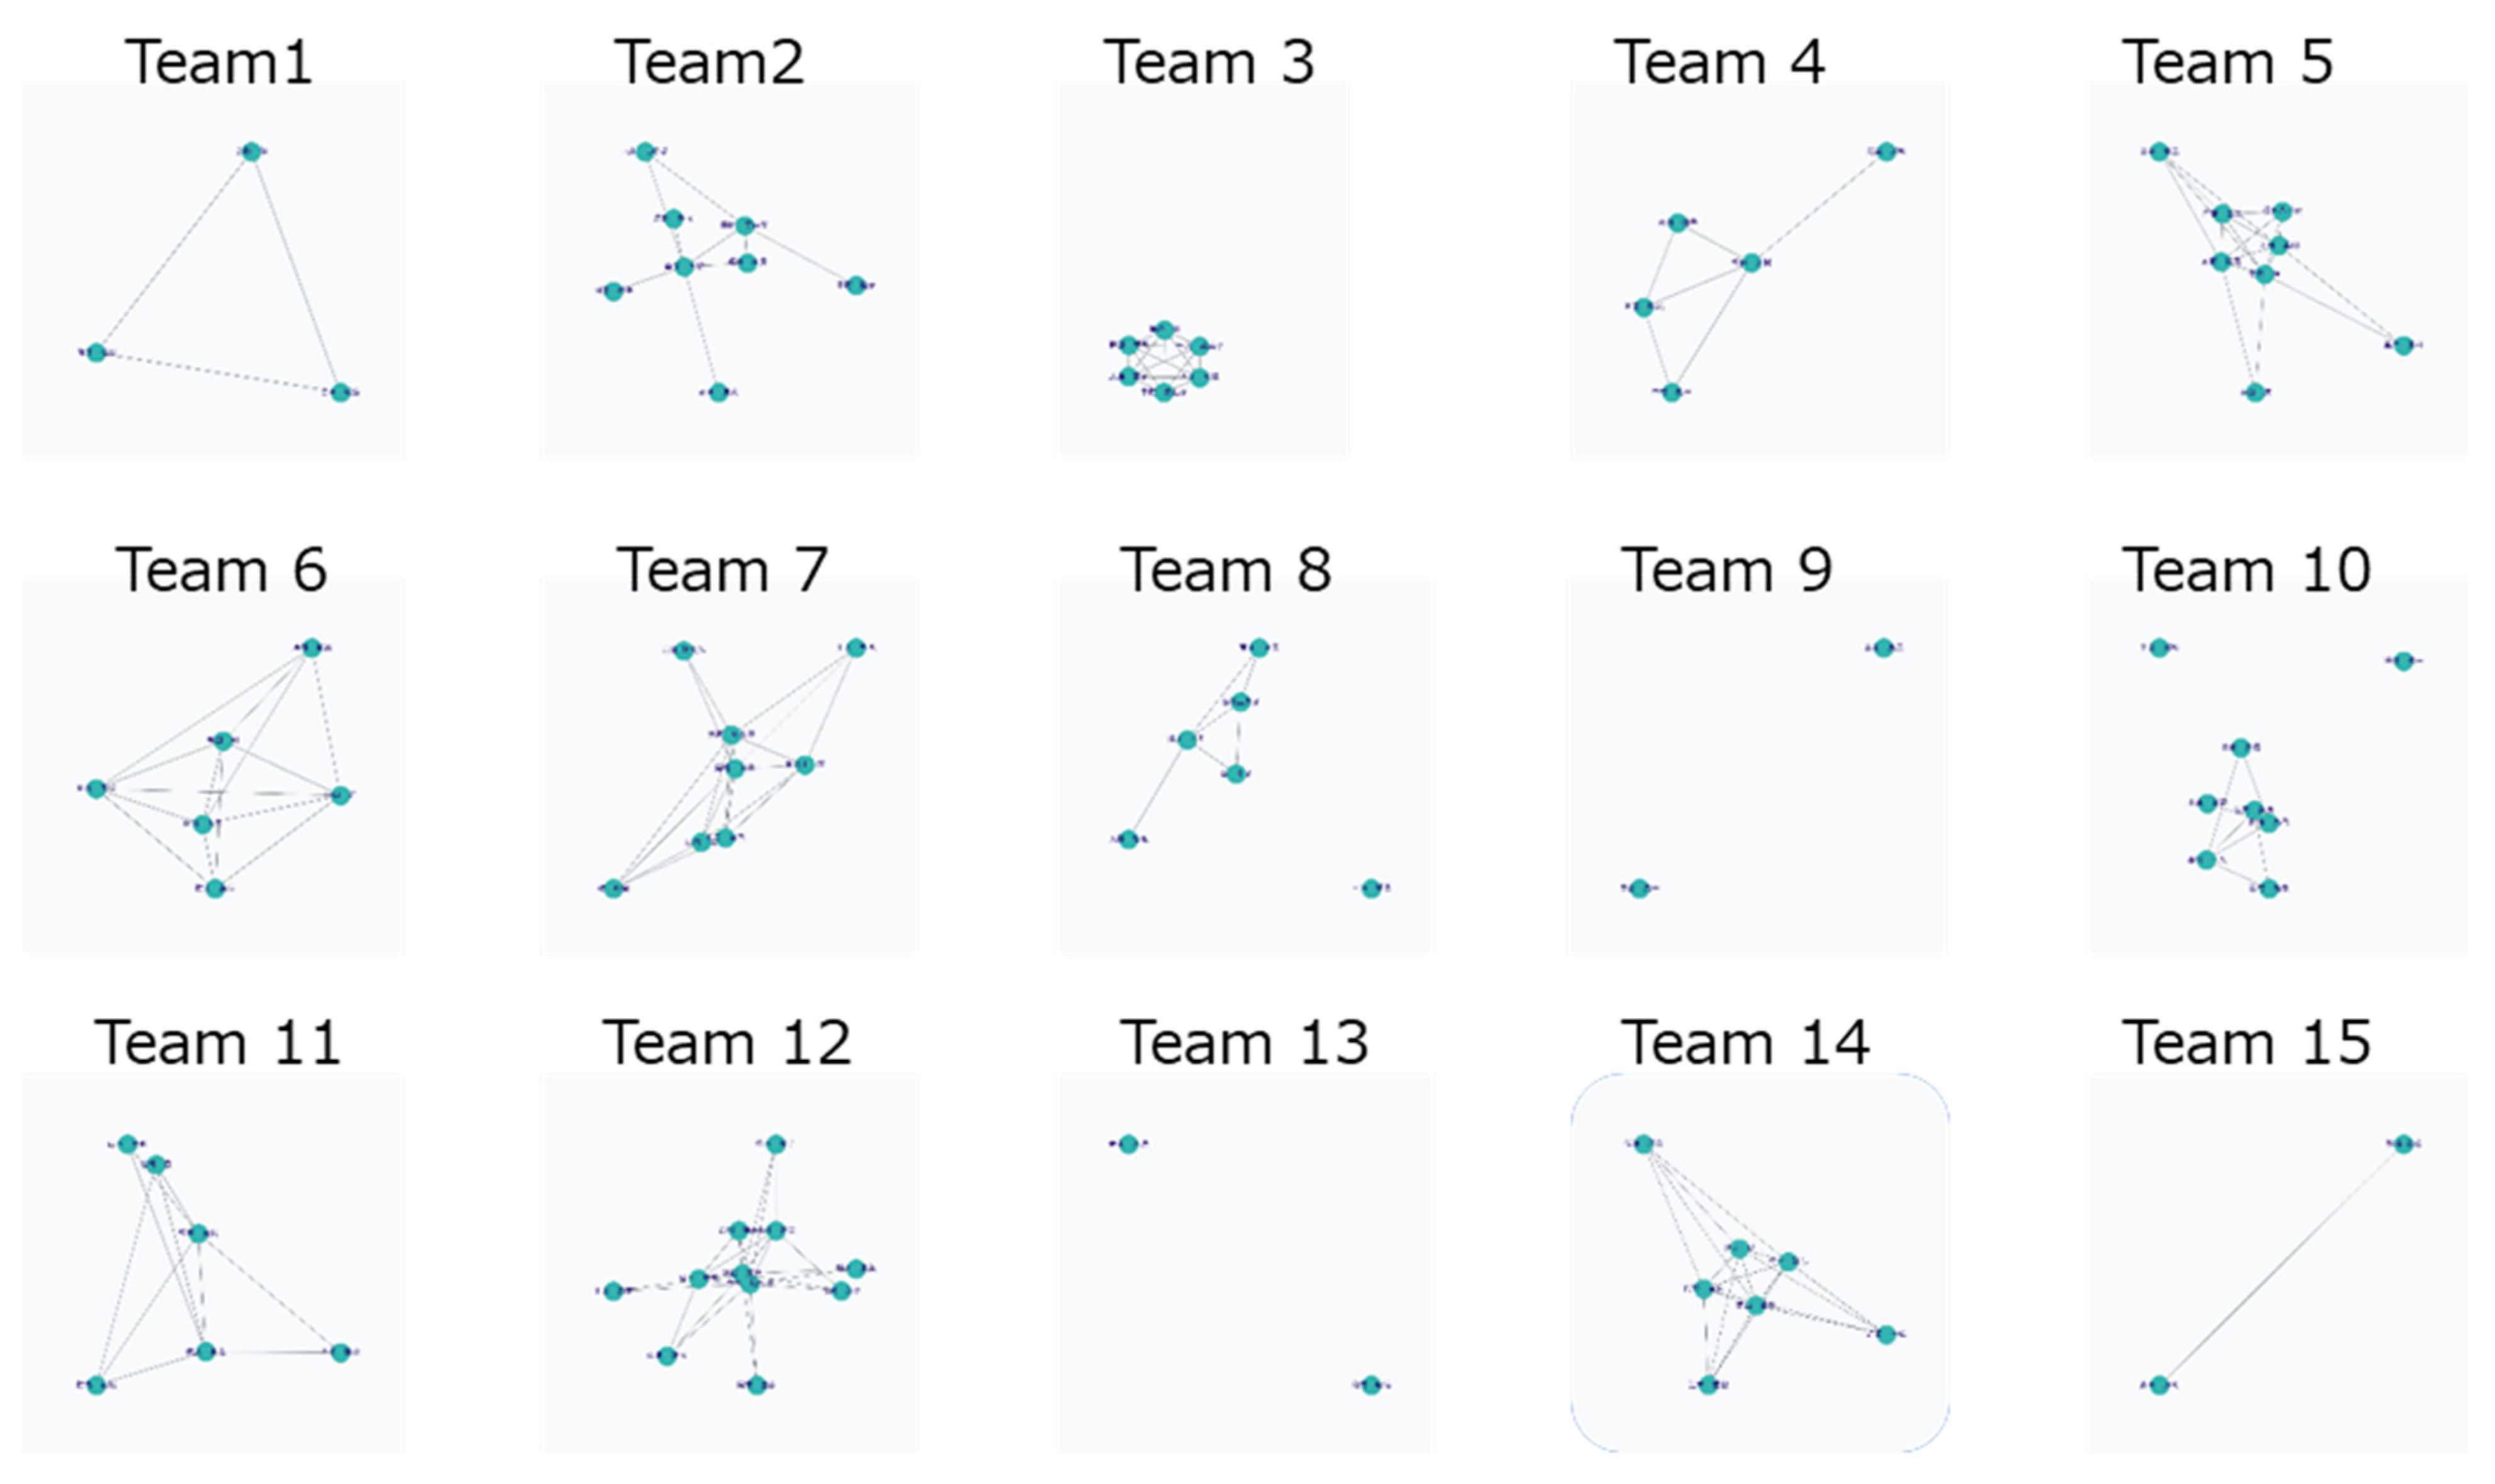
4.3. Gratitude Network

We drew the gratitude networks for each team based on the app’s data in Figure 3. In all the graphs, the nodes express persons and the edges express more than one thanks.
The 15 graphs in Figure 3 are classified into three different structure types: a dense network type, as in team 3; a sparse network type, as in team 4; an intermediate network type, as in team 5. To distinguish between network types, we considered the indicators of these structures.
Network density was one such indicator. Network density is the ratio of the actual number of edges to the total number of possible edges. However, network density did not provide a good representation of sparse network types. The network density for team 4 was 0.60, but the value could not determine a sparse network.
As an extension of network density, we devised a new indicator, the Triangular Network Density (TND). The following formula defines this indicator:
ρ 3 = i > j > k n d i j d j k d k i C n   3 ,   d i i = 0 ,   d i j = d j i ,   d i j 0 , 1 ,
where n > 2 is the number of nodes; i, j, k = 1, 2, …, are the node’s numbers; dij is the status of an edge between the i-th node and the j-th node. The status of dij is equal to 1 when the i-th node connects to the j-th node. If these nodes are not connected, the status of dij is equal to 0. The numerator in the above formula counts the triangular structures of a given graph. The denominator is the number of combinations in the above formula that count possible triangular structures of a graph with n nodes. However, this indicator cannot be defined using the formula when n = 1 and n = 2. Therefore, we identified that the indicator is equal to 0 if n = 1 because of no edges or if two nodes do not connect in a graph with two nodes, and equal to 1 if two nodes do connect in an n = 2 graph.
Table 4 shows the TND we computed for each team. Using this indicator, we can decide the network structure of team 4 as a sparse network because the indicator value is small (i.e., 0.200). If the dense network type has a density greater than 0.6, we can define the network structures of teams 1, 3, 6, and 14 as dense network types. When the sparse network type has a density of less than 0.2, we can define the network structures of teams 2, 4, 8, 9, 10, 11, and 12 as sparse network types.

4.4. Correlations between Engagement and Gratitude

To confirm the effect of team status on gratitude activity, we calculated the correlation between the survey data and the gratitude data. Specifically, we calculated the correlations between the 10 engagement factors per team and the number of thanks within the team per user. We did the same calculation between the 10 factors and the number of thanks between teams per user and between the 10 factors and the TND per team.
Table 5 shows the correlation between the questionnaire data before the experiment and the gratitude data obtained using the Thanks App for about two months.
The number of thanks per user within a team had a significant correlation with the TS factor. The better the relationship between the supervisor and the team members, the more gratitude exists within the team.
The number of thanks per user between teams had a high correlation with the WF and LO factors. The former represents work engagement, whereas the latter represents organizational engagement, consisting of job satisfaction and organizational commitment. This correlation indicates that teams with higher work engagement and organizational engagement are more likely to be grateful to other teams.
The TND has a significantly strong correlation with the TC factor. However, this indicator significantly correlates highly with other factors, including WF, LO, TW, RS, and TS. This indicates that the better the trust in relationships, especially with colleagues, the denser the gratitude network becomes.
Two factors, AF and FE, show limited correlation with three indicators based on the gratitude data. It implies that satisfaction with job characteristics and the evaluation system is unrelated to appreciation.
The factor OO has a significant correlation with two gratitude indicators in a team. It means that an open culture contributes to the amount and spread of appreciation within the team.
The factor RB has a significant correlation with the number of thanks per user between teams and with the TND. According to the investigation, when we developed the questionnaire, we confirmed that this factor was significantly correlated with WF. The two gratitude indicators also significantly correlated with WF. This result led us to assume that the correlation between the factor and two gratitude indicators derived from the correlation between the factor and WF.

5. Discussion

Our findings supported our goal of ascertaining the link between engagement factors and gratitude data via digital devices. Gratitude data correlates with some, but not all, of the engagement factors.

5.1. Trust in Supervisor and Gratitude Expression

Based on the find-remind-and-bind theory [26], we expect that the higher the amount of gratitude expressed among team members, the higher the TC will be. However, the amount of gratitude expressed within the team correlated with TS, not TC. The find-remind-and-bind theory was developed for one-on-one relationships, such as lovers; therefore, this does not mean that this theory is wrong. Algoe et al. suggest that another social function, such as the witness effect, could work in group appreciation, such as in teams and groups [1]. The Thanks App may have had a witness effect because it shared the experience of a colleague or team member obtaining appreciation from others. Notably, the fact that TS correlated with the amount of gratitude expressed supports the find-remind-and-bind theory because it satisfies the prerequisite of a one-to-one relationship. Because there is usually only one leader in a team, the relationship with the leader appears to be a one-to-one relationship for the members.
If team members dislike or distrust the leader, they may not be willing to express their appreciation to colleagues because they do not want the leader to see their posts (the Thanks App automatically publicly displays gratitude expressions to others). Conversely, if the members like and trust the leader, they will not mind if the leader sees them expressing their appreciation to their colleagues. In this case, the members would not hesitate to express gratitude using the Thanks App, so we can expect an increase in the amount of appreciation expressed. Thus, we believe that the score of the TS is proportional to the amount of gratitude expressed. Therefore, the trust between a leader and team members is needed to improve work engagement through appreciation using digital devices. The app will not be used by team members if such trust does not exist.
In addition, the amount of team gratitude expressed is a similar concept to that of collective gratitude in Masaki et al.’s study [3], but the relationship between the two is unclear.

5.2. Trust in Colleagues and Gratitude Expression

TC has a strong correlation with a newly defined indicator, TND, which becomes higher as the ratio of the triangular network increases. TND is higher when each member expresses gratitude to more team members. Conversely, if each team member expresses gratitude to only one other team member, the TND will remain low regardless of how much gratitude is expressed. Therefore, TND represents the extent of the relationship of expressing gratitude to each other.
If we assume that people always express their gratitude to the members they trust, we can explain the correlation between TND and TC. For example, consider a team with 11 team members, including yourself. If each member trusted only one other member, the TC questionnaire would have many “strongly disagree” responses because they do not trust 90% of the team members. Then, the TC score will be close to the minimum value of 1. In addition, because each member trusts only one person, we assume they will express gratitude only to that one person. Then, the TND is close to the minimum value of zero because the triangle network is hardly formed.
Conversely, if a team member trusts all 10 other members, we will have many “strongly agree” responses to the TC questions because they trust 100% of their team members. Therefore, the TC score will be close to the highest value of 7. In addition, because they will express their gratitude to all team members, many triangular networks will be formed, and TND will approach the maximum value of 1. Thus, we can explain that TND and TC are proportional.
Furthermore, if this assumption is valid, it implies that the TC score includes assessing how many of the team members are trustworthy.

5.3. Gratitude Network

The results of this study, “the higher the TC, the more complex is the structure of the gratitude network,” are similar to the social capital (SC) network structure [77]. The SC theory also explains that the more strongly connected and complex the social network is, the stronger the trust is within the community. However, the meaning of trust, which was strongly associated with a gratitude network structure, is different from the trust explained in SC theory.
In the SC theory, individuals who belong to a community with tightly knit relationships will behave in ways that do not go against the community’s will for fear of community sanctions. The community will then form an implicit rule, or norm, to be followed. Because most community members follow these norms, individuals who belong to the community expect other members to do the same. In SC theory, this expectation of adherence to the community norms is called trust [78].
The expectation of adherence to norms is a concept similar to TW in our OEQ factors; TC represents emotional connection, such as closeness between members. TND correlates (r = 0.68) with TW but has a stronger correlation (r = 0.80) with TC. This suggests that the gratitude network is a network of emotions such as closeness. In contrast, the network structure of SC theory can be described as a network of rationality, of “adhering to norms.”
This study is the first to capture the network structure of emotions in data.

5.4. Gratitude and Work Engagement

Another surprising result of this study is that the amount of gratitude expressed between teams correlates with WF and LO. Recently, Komase et al. [52] reported results that perceived gratitude and work engagement are related. Because our WF is similar to the concept of work engagement, if we assume the causality that “perceived gratitude results in expressed gratitude,” then our results would support the study of Komase et al. [52]. However, our results are different from their study. The results indicate that work engagement associated inter-team expressions of gratitude, not intra-team expressions.
We now turn to consider the implications of separating appreciation statements within and between teams. In this experiment, there was no replacement of team members. In addition, it has been at least six months since team formation. Therefore, we can assume that they know their team members relatively well and other team’s members know each other not so well. Under this assumption, relationships between individuals across teams are not “ongoing relationships,” which is the premise of the find-remind-and-bind theory [26]. In such relationships, not much appreciation is expressed. Nonetheless, our results show that teams with higher work engagement express more gratitude to other teams than teams with lower work engagement. It suggests that work engagement can be a factor in the development of new relationships between teams.

5.5. Gratitude Study with Digital Devices

This study is the first to provide a new research method using digital devices for gratitude study. Until now, questionnaires have been the primary measurement method in studies of gratitude characteristics [5,6,7,8,9,10,11,12,13,14,15,16,17,18,19,20,21,22]. Intervention methods, such as writing on paper, such as a thank you letter or expressing thanks verbally, have been used in studies of gratitude intervention [23,24,25,26,27,28,29,30,31].
However, with the advancement of information technology, modern human relationships need to consider real and virtual spaces. For example, in Japan, dysfunctional human relationships on SNS have caused suicides and have become a national problem. Therefore, future research on appreciation needs to consider intervention methods based on real and virtual spaces.
Furthermore, with digital communication tools such as e-mail, chat, and SNS, it is difficult to pick up only gratitude data. Thus, we believe that the use of gratitude-specific applications such as the Thanks App and the collection of gratitude-specific data will be necessary for future gratitude studies.
In addition, the results of this study provide the first suggestions on how to transform digital data of gratitude into psychological information. Converting digital data into psychological information will be critical in online team management because there is less visual information and more digital data in such teams.

5.6. Practical Advantages

We believe that there are several practical advantages to using digital devices for this purpose. The first is the ability to obtain time-series data. Because apps such as the Thanks App have daily use, they accumulate data over time. It is very different from surveys, where you can only obtain a snapshot of a particular point in time. In this study, we found that when we processed the gratitude data, we were able to associate it with trust among supervisors and colleagues. Therefore, by constantly analyzing the gratitude data, it is possible to observe the changing trust among the team over time.
Second, it is easy to implement in real-world organizations. Thank-you cards are used by many companies seeking an analog gratitude intervention. However, thank-you cards, while easy to implement, take time to tally. In addition, thank-you cards do not work in organizations where each individual or team has separate workstations, as was the case during the COVID-19 pandemic. The use of digital devices solves these problems.

6. Discussion: Digitization, Trust Building, and Open Innovation

The current business environment, such as during the COVID-19 pandemic, poses high levels of uncertainty. Thus, closed innovation through in-house research and development is a high-risk option that is based on limited knowledge. Therefore, open innovation is currently becoming increasingly important because it allows companies to make choices that are adaptive to changes based on external information.

6.1. Open Innovation Dynamics

Open innovation is defined as “the use of purposive inflows and outflows of knowledge to accelerate internal innovation, and expand the markets for external use of innovation, respectively” [79].
Schumpeter [80] defined innovation as a new combination of technology and market or product and society. As a pattern of a new combination, Schumpeter proposed five types, namely new products, new markets, new processes, new organizations, and new materials. Simply put, innovation is not an extension of an existing business but a creative destruction by a business with novelty. Entrepreneurship is key to such creative destruction.
Studies on entrepreneurship mainly focused on the traits or characters of individual entrepreneurs. However, this concept is now considered a process or dynamics [81]. The reason underlying this notion is that the success of an entrepreneurial venture, such as a startup, is related not only to the entrepreneur but also to their interactions with various groups of people, such as investors, accelerators, and early customers.
In other words, open innovation cannot be represented only by creative people and creative environments. Open innovation can be represented by the interaction of the people involved and their evolution over time, including environmental changes. This is the dynamics.

6.2. The Culture for Open Innovation Dynamics

Organizational culture influences intrapreneurship, that is, the entrepreneurship of the employees of an existing company. Organizational culture refers to the inherent values and shared assumptions of an organization [82], which are formed by the ideology of the founders and the common experience of the organization. Organizational culture influences the thoughts, feelings, and behaviors of members through shared norms. If the organizational culture constantly requires following the norm, then organizational culture will inhibit the intrapreneurship of the employees. For example, if an individual seeks to disrupt the norm, then all other members will oppose such an individual. Consequently, open innovation cannot be achieved.
Therefore, cultural entrepreneurship clearly exists within the organization, independent of individual employees. This concept is called organizational entrepreneurship. To promote open innovation, organizational entrepreneurship should be an organizational culture that encourages the pursuit of creative ideas and entrepreneurial opportunities. Frequently, organizational culture is expressed in the form of organizational structures, systems, procedures, values, philosophies, and credos. With these constructs, the organizational culture can influence the thoughts, feelings, and behaviors of employees [83].
Thus, an organizational culture of organizational entrepreneurship is necessary for open innovation. In particular, understanding the organizational culture is necessary for controlling open innovation dynamics [43]. In addition, a culture of open innovation dynamics should be one in which the thoughts, feelings, and actions of employees encourage “creative destruction.” Recently, Yun et al. [43] devised an interaction model between entrepreneurship, intrapreneurship, and organizational entrepreneurship as the culture for open innovation dynamics.

6.3. Trust for Open-Innovation Dynamics

However, a hindrance to organizational entrepreneurship is normative trust as defined by social capital theory, which is, “the expectation that members will act according to organizational norms,” because organizational entrepreneurship requires a creative disruption of organizational norms. For example, in an organization where normative trust is strong, creative destructive behavior is a violation of trust by supervisors and colleagues. Hence, the reputation of an employee who engages in such behavior will be lowered. As a result, the employee will not be able to start a business within the company due to lack of cooperation from others.
Conversely, emotional trust through intimacy is important for organizational entrepreneurship. This is because the creative destructive behavior does not violate the trust of supervisors and colleagues. Hence, employees’ evaluations will not be lowered by creative destructive behavior. Even if one employee does not follow the norm, other employees with high levels of emotional trust will become followers who facilitate creative destruction. Savolainenn and Ikonen [84] proposed a conceptual model of this complex and dynamic process of emotional trust building.
Therefore, the type of trust in organizational culture plays a decisive role in organizational entrepreneurship.
In addition, entrepreneurship is a process and is dynamic. Thus, tracking the time course of emotional trust is crucial. The digitization of gratitude enables the visibility of non-visible emotional trust as data. We believe that this fact can be useful in forming a culture of open innovation dynamics.

7. Conclusions

From many studies of the JD-R model, one factor that influences work engagement is the expectation of support from supervisors and colleagues. Meanwhile, from the find-remind-and-bind theory, it is known that gratitude strengthens the relationship. Therefore, we can hypothesize that if we can improve our relationships with our supervisors and colleagues through gratitude, we can improve our work engagement. We want to improve employee engagement by expressing gratitude via digital devices.
As a first step, in this study, we confirmed the relationship between gratitude data using digital devices, such as Thanks App, and responses to an original survey on engagement. Our results demonstrated that gratitude data was associated with the trust of supervisors and colleagues, which was a factor of engagement and a factor equivalent to work engagement.
Using these results, if we continue to use the Thanks App, we will be able to check the trust and engagement of our team without having to conduct surveys. In addition, because the gratitude data is updated from time to time, it suggests the possibility of understanding trust and engagement in real-time. Such information has significant implications for the management of online teams, which will become the norm in the post-COVID-19 era.
In addition, this study provides a new intervention method using digital devices for gratitude studies. By connecting digital data with assessment data, we provide implications for how digital devices can measure psychology. However, we cannot guarantee universality because this study is the first example of these interventions and psychometric methods. We believe that our study will provide direction for new developments in social and emotional psychology research.

8. Limitations

There are five limitations of this study.
First, this study is only one example of the relationship between appreciation and engagement questionnaires using digital devices. In this study, we chose the Miyake Town Office for several reasons. However, if the target organization is changed, the results may be different. Specifically, if we chose a private company organization instead of a government organization, the results may differ. To make the theory more universal, it will be necessary to try the same approach in many organizations.
Second, in this study, we do not know the effect of the intervention. The app-based intervention effect on the engagement factor is unknown because this study consequently included pre–post questionnaire responses and gratitude data in the analysis. It requires operational improvements to ensure that the pre- and post-surveys are properly administered.
Third, it is not always possible to obtain the same effect using other apps due to the functionality, design, and ease of use of the Thanks App in the experiment. For example, some participants may stop using an app because they do not like its usability. Thus, there is no guarantee that a study using a different application will yield similar results. An impractical solution is to design the experiment in a way that the subjects are constantly monitored.
Fourth, this study relies on the Japanese language. For example, we used “Arigato” as a word to express gratitude with the Thanks App. Whether we can obtain the same results in other languages requires an international comparison. However, we are not planning to do so.
Fifth, the study was unable to confirm the convergent validity for TW, TC, and AF of the OEQ (see Appendix B). TC is particularly important because it concerns the conclusions of this paper. Scholars suggested that it measures trust in colleagues instead of trust in people. Alternatively, a difference exists in that general trust measures trust in strangers, whereas TC measures trust in familiar people. Therefore, various forms of trust are considered different. To verify convergent validity, a Japanese scale with a closer concept of trust is required. However, we were unable to identify such a scale.

Author Contributions

Conceptualization, J.-i.Y., T.F. and K.N.; data curation, J.-i.Y. and Q.T.P.; formal analysis, J.-i.Y., K.N. and Q.T.P.; funding acquisition, T.F. and I.K.; investigation, J.-i.Y. and K.N.; methodology, J.-i.Y. and K.N.; project administration, I.K.; resources, I.K.; software, J.-i.Y.; supervision, T.F.; validation, J.-i.Y.; visualization, J.-i.Y.; writing—original draft, J.-i.Y.; writing—review and editing, Q.T.P. All authors have read and agreed to the published version of the manuscript.

Funding

This research received no external funding.

Institutional Review Board Statement

Ethical review and approval were waived based on the ethical guidelines for medical research for this study due to not fall under the category of medical research.

Informed Consent Statement

Informed consent was obtained from all subjects involved in the study.

Data Availability Statement

The data presented in this study are available on request to the corresponding author. The individual data are not publicly available due to not consent by participants to release. The participants agreed to release the statistical data only. All the statistical data are written in this paper.

Acknowledgments

We extend our gratitude to the government office of Miyake Town.

Conflicts of Interest

The authors declare no conflict of interest.

Appendix A. Organizational Engagement Questionnaire

The following questions are about your company, organization, workplace, or job. Please read the questions carefully and select 7 if you strongly agree with them or 1 if you strongly disagree with them.
Work Fulfillment
  • My work inspires me.
  • For me, my work is what motivates me.
  • When I am working, I tend to lose track of time.
  • In the workplace, I am very much alive.
Love for Organization
5.
Working for this company or organization is very meaningful to me.
6.
I am proud to work for this company or organization.
7.
I like working for this company and organization.
8.
I am very satisfied to work for this company and organization.
Teamwork
9.
In my team, conflicts within the team are resolved by properly discussing each other’s interests.
10.
In my team, team members are working together as one for the team’s achievement.
11.
In my team, each member understands their roles, accountabilities, and authorities and fulfills them.
Trust in Colleagues
12.
I feel like I have a connection with my colleagues.
13.
My colleagues and I have mutual respect for each other.
14.
I feel as close to my colleagues as I do to my friends.
Reliable Supervisors
15.
My supervisor has many different perspectives on a single issue.
16.
My supervisor takes final responsibility for the work entrusted to the member, even if the member fails.
17.
My supervisor explains the organization’s policies to the members in their own words.
18.
My supervisor reports any problems he/she notices to their supervisor.
19.
My supervisor is very proactive in introducing new things.
Trust in Supervisors
20.
My supervisor and I have a great time working together.
21.
My supervisor should be able to take my job’s side against higher level supervisors, even if they do not know the full extent of the problem.
22.
My supervisor should be able to shield me from any threats to my job.
23.
I trust my supervisor.
Autonomy and Feedback
24.
I can work the way I want to.
25.
I know exactly what to expect from the people I work with.
26.
I always receive satisfactory information about the purpose of my work.
27.
I have enough opportunities to know about the results of my work.
28.
I can always find out information about important issues in my organization.
29.
I always have access to information about important issues in my organization.
30.
The decision-making process in my organization is transparent to me.
31.
I can discuss work-related issues with anyone at any time.
32.
I can always reflect my own will in the content of my work.
Fairness of Evaluation
33.
The decision-making process for my evaluation (salary, promotion, job role, etc.) is based on accurate and fair information.
34.
The decision-making process for my evaluation (salary, promotion, job role, etc.) is the ethically and morally correct way.
35.
The evaluation I obtained (salary, promotion, job role, etc.) is well worth the effort I put into my work.
36.
The evaluation I obtained (salary, promotion, job role, etc.) is an accurate assessment of the work I accomplished.
Openness in Organization
37.
In my company and organization, there is an atmosphere where it is good to have honest discussions with colleagues and supervisors.
38.
In my company and organization, there is an atmosphere where you can always behave as yourself.
39.
In my company and organization, there is an atmosphere where it is okay to have different ideas and opinions from others.
40.
In my company and organization, there is an atmosphere where people do not mind if I express to them my intentions straight out.
Recommendation Behavior
41.
I have recommended working for this company and organization to anyone outside the company.
42.
I am willing to behave in a way that fits the image of the company or organization.
43.
I behave as if I am protecting my company or organization from outside forces.

Appendix B. Reliability and Validity

Since the OEQ is our original questionnaire, although it is based on the existing instruments, we have to verify the reliability and validity of our measurement variables. The design of the questionnaire has already been explained in Section 3.3.1. Section 3.3.2 described the measurement variables of the questionnaire and explained the scales from which each factor is derived.
In this section, we verify the reliability and validity of the 10 factors of the questionnaire. Reliability is the consistency of measurement results. This means that we will obtain the same measurement results under exactly the same conditions. Validity is the accuracy of the measurement. It is impossible to prove complete validity, but we need evidence that we are indeed measuring the target concept.

Appendix B.1. Reliability

Reliability refers to the consistency of measurement. According to Heale and Twycross [85], homogeneity, stability, and equivalence confirm the reliability of a questionnaire. Homogeneity refers to the fact that all items measure a single concept and is assessed by internal consistency. Stability is the ability to reproduce the same results under the same conditions and is assessed via test–retest reliability. Lastly, equivalence refers to the notion that the results are independent of the performer of the measurement. Equivalence is based on the evaluation of the questionnaire by multiple experts. This study used internal consistency and test–retest reliability to verify the reliability of the questionnaire.

Appendix B.1.1. Internal Consistency
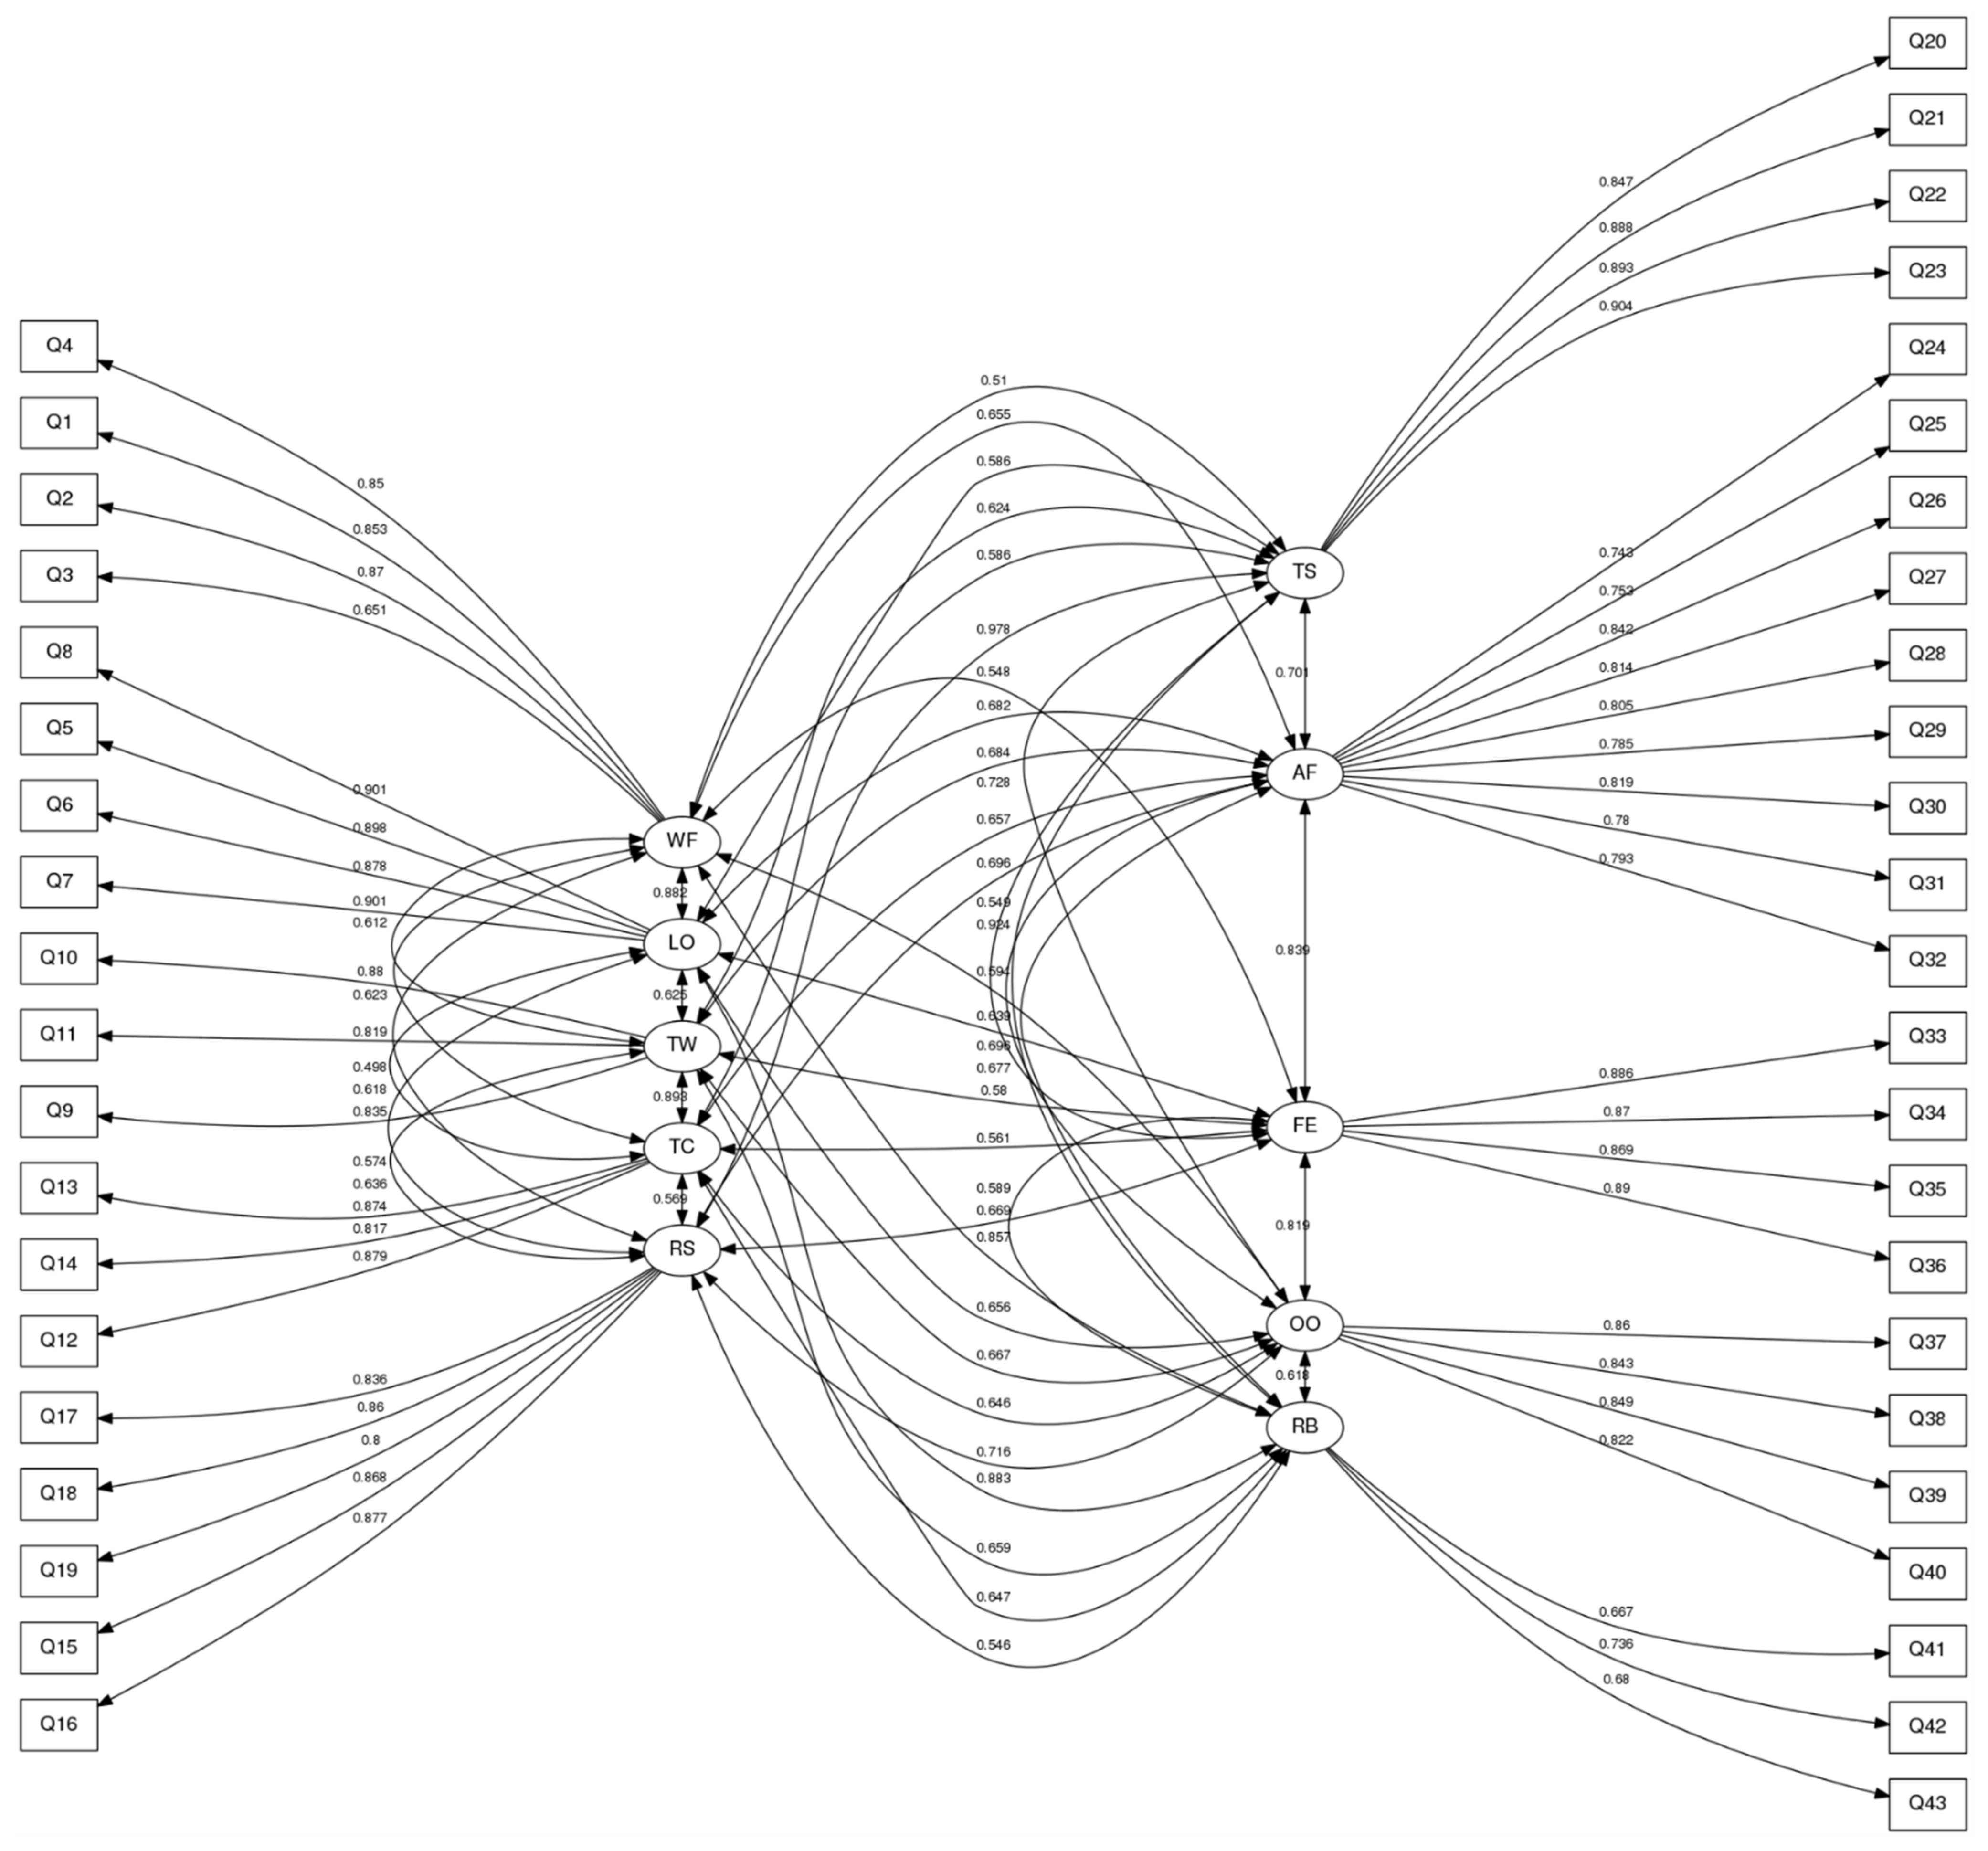
The data used to validate internal consistency were the response data of 8403 respondents (males: 4538; mean age: 43.6 years; females: 3865; mean age: 42.9 years) from the closed survey which we conducted through a survey company in 2019.
Internal consistency was verified using the I–T correlation, split-half test, and Cronbach’s alpha coefficient. The I–T correlation refers to the correlation between the sum of the items that compose a factor and each item, and it takes values between 0.00 and 1.00. In general, the higher the value, the higher the correlation. The split-half test divides the questionnaire items that make up a factor in half, produces two sums, and verifies them using their correlation values, which are subjected to the Spearman–Brown correction. The reliability score range is from 0.00 to 1.00. In this validation, we did not use the more accurate Kuder-Richardson test with is suggested by Heale and Twycross [85] because it only supports questions in a yes-or-no format. Thus, Cronbach’s alpha is the most commonly used test to determine the internal consistency of a scale.
The reliability score for Cronbach’s alpha ranges from 0.00 to 1.00. Heale and Twycross [85] suggested that an acceptable reliability score is 0.7 or higher, whereas Mohamand et al. [86] found that a reliability score of 0.67 or higher is acceptable.
Table A1 displays the results of the factor analysis and the internal consistency. Exploratory factor analysis (EFA) was conducted to check the unidimensionality of each factor [87]. Factor items should have a factor loading of 0.5 or higher. We obtained the result that all items had factor loadings of 0.5 or higher. Thus, the unidimensionality of all the factors was confirmed. The results of the confirmatory factor analysis (CFA) will be used in the validity test described below. We calculated the I-T correlations, Cronbach’s alpha, and the split-half scores as the internal consistency. The results indicate that all factors measured by the OEQ obtained reliability scores of 0.70 or higher. Therefore, we can conclude that the internal consistency of the factors measured by the OEQ is sufficiently high.
Table A1. Factor analysis and internal consistency of the Organizational Engagement Questionnaire (n = 8403 via Internet survey in 2019).
FactorsItems *MSD% of
Variance
LoadingsI-T Corr.Cronbach’s AlphaSplit-Half Coeff. **
EFACFA
WFQ13.81 1.480 50.762 0.883 0.8530.894 0.88 0.88
Q24.01 1.501 0.900 0.8700.902
Q33.97 1.485 0.657 0.6510.784
Q43.78 1.472 0.786 0.8500.850
LOQ54.07 1.512 15.339 0.897 0.8980.923 0.94 0.94
Q63.91 1.535 0.876 0.8780.913
Q74.02 1.532 0.897 0.9010.923
Q84.02 1.549 0.908 0.9010.929
TWQ94.04 1.350 53.219 0.817 0.8350.890 0.88 0.89
Q104.08 1.380 0.886 0.8800.913
Q114.24 1.359 0.830 0.8190.895
TCQ123.89 1.364 41.260 0.903 0.8790.920 0.89 0.87
Q134.07 1.356 0.837 0.8740.899
Q143.92 1.429 0.835 0.8170.904
RSQ153.98 1.481 14.401 0.880 0.8680.899 0.93 0.92
Q164.03 1.529 0.845 0.8770.881
Q173.97 1.482 0.849 0.8360.881
Q184.04 1.512 0.856 0.8600.886
Q193.88 1.464 0.817 0.8000.861
TSQ203.91 1.489 18.445 0.840 0.8470.891 0.93 0.94
Q213.88 1.474 0.892 0.8880.917
Q223.87 1.521 0.896 0.8930.920
Q234.02 1.583 0.904 0.9040.926
AFQ244.12 1.353 127.958 0.746 0.7430.783 0.94 0.94
Q254.10 1.255 0.756 0.7530.787
Q263.83 1.293 0.832 0.8420.846
Q273.98 1.350 0.815 0.8140.835
Q283.73 1.365 0.816 0.8050.837
Q293.73 1.368 0.799 0.7850.824
Q303.71 1.352 0.801 0.8190.824
Q313.99 1.360 0.773 0.7800.805
Q324.02 1.337 0.803 0.7930.828
FEQ333.74 1.365 8.492 0.884 0.8860.913 0.93 0.94
Q343.82 1.349 0.864 0.8700.902
Q353.71 1.399 0.872 0.8690.908
Q363.75 1.372 0.894 0.8900.918
OOQ373.84 1.389 34.016 0.858 0.8600.893 0.91 0.92
Q383.97 1.360 0.839 0.8430.882
Q393.93 1.349 0.855 0.8490.889
Q403.78 1.390 0.821 0.8220.875
RBQ413.24 1.491 1149.729 0.543 0.6670.772 0.73 0.75
Q424.22 1.348 0.762 0.7360.818
Q434.07 1.428 0.781 0.6800.832
* Refer to Appendix A. ** Reliability coefficients of the split-half method with an alternating summation of the questionnaire items, corrected by the Spearman–Brown formula.

Appendix B.1.2. Test–Retest Reliability

For test–retest reliability, the validation data used were the results of a closed survey on 96 respondents (males: 71, mean age: 42.0 years; females: 25, mean age: 41.4 years) in a technology company conducted in 2018.
In this study, the OEQ was measured four times in one year. For the test–retest reliability, measurements were conducted multiple times over a certain period to verify the correlation between the scores at each time point. The higher the correlation coefficient, the higher the reliability. However, the measurements should be performed on the same subjects and under similar circumstances.
Heale and Twycross [85] stated that a correlation coefficient of less than 0.3 indicates a weak correlation, 0.3 to 0.5 indicate a moderate correlation, and 0.5 and higher point to a strong correlation.
Table A2 presents the results of the test–retest reliability scores. The results indicate that all eight factors, except for TW and RB, obtained reliability scores of 0.5 and higher. In other words, this study infers that the test–retest reliability of the eight factors, except for TW and RB, is sufficiently high.
In addition, the fourth measurement may have been influenced by the change in the awareness and behavior of employees. Through interviews after the fourth measurement, we confirmed that a change in attitude and behavior occurred among managers and employees. Thus, we inferred that TW and RB are sensitive to this change. This reason may underlie the small correlation coefficient between the results of the fourth measurement and the results obtained from the other time points.
Apart from the fourth result, RB exhibited a strong correlation of more than 0.5, which is considered sufficiently high for test–retest reliability. However, TW displayed moderate correlation even excluding the fourth result. Therefore, the test–retest reliability of TW is considered to be relatively low.
Table A2. Test–retest reliability of the Organizational Engagement Questionnaire (n = 96 in a technology company in 2018).
Waves
1–2
Waves
2–3
Waves
3–4
Waves
1–3
Waves
2–4
Waves
1–4
Work fulfillment (WF)0.71 0.70 0.65 0.57 0.59 0.63
Love for organization (LO)0.70 0.70 0.74 0.64 0.69 0.67
Teamwork (TW)0.44 0.47 0.50 0.55 0.50 0.34
Trust in colleagues (TC)0.54 0.70 0.72 0.57 0.55 0.55
Reliable supervisor (RS)0.69 0.79 0.78 0.66 0.69 0.62
Trust in supervisor (TS)0.71 0.81 0.82 0.69 0.77 0.68
Autonomy and feedback (AF)0.73 0.75 0.77 0.68 0.75 0.68
Fairness of evaluation (FE)0.66 0.74 0.73 0.66 0.63 0.65
Openness in organization (OO)0.74 0.81 0.66 0.68 0.69 0.61
Recommendation behavior (RB)0.69 0.73 0.35 0.61 0.37 0.44
Note: Wave 1: April 2018; Wave 2: August 2018; Wave 3: December 2018; and Wave 4: March 2019. All correlation coefficients are significant (p < 0.001).

Appendix B.2. Validity

The validity of the questionnaire was checked via construct validity. According to Heale and Twycross [85], construct validity requires the verification of homogeneity, convergence, and theoretical evidence. Homogeneity refers to internal consistency, which has been confirmed in the previous section. Convergence refers to convergent validity, which can be confirmed by the high correlation among similar concepts. Theoretical evidence ensures that the results of the measurement are consistent with the behavior of the respondents. In this case, we confirmed theoretical evidence through correlations that exceed the moderate level for concepts theoretically expected to be related.
Pearson’s correlation was used to evaluate relevance, where correlation coefficients of less than 0.2, 0.2–0.4, 0.4–0.7, and 0.7 or higher indicate no correlation, weak, moderate, and strong correlations, respectively.
To collect data for validation, we conducted a survey through a research company and received responses from 385 respondents (males: 286, mean age: 47.6 years; females: 99, mean age: 41.1 years).
However, according to a review by Messick [88], these validations are only external aspects of construct validity. Hence, we also tested the structural aspect of construct validity using CFA with structural equation modeling (SEM). SEM is a method of testing the goodness of fit between a predicted theoretical model and measured data. CFA is one of the special cases of SEM. CFA tests the goodness of fit with a factor structure model, where the factors are latent variables, and the items are observed variables. If the factor structure model has many factors, it is assumed that there are correlations between all the factors.
There are many indices to evaluate goodness-of-fit: the goodness-of-fit index (GFI); the adjusted goodness-of-fit index (AFGI); the Normed Fit Index (NFI); the Comparative Fit Index (CFI); the incremental fit index (IFI); the Root Mean Square Error Approximation (RMSEA). GFI, AGFI, NFI, CFI, and IFI take values between 0 and 1, with the value closer to 1 meaning the better the fit. RMSEA is a residual, so the closer it is to 0, the better the fit. When GFI and AGFI are greater than 0.90, the model is well fitted [89]. CFI, NFI, IFI, and RMSEA are considered to be a good fit when they satisfy a combination of the following conditions: CFI > 0.90, NFI > 0.90, RMSEA < 0.08 [90]; CFI > 0.95, NFI > 0.90, RMSEA < 0.06 [91]; CFI > 0.90, IFI > 0.90, NFI > 0.80, RMSEA < 0.08 [91].
We used the data in Table A1 in our verification using CFA.

Appendix B.2.1. Scales

Table A3 presents a list of Japanese scales used to examine the construct validity of the OEQ. Out of the 10 factors, seven (i.e., WF, LO, RS, TS, FE, OO, and RB) were derived from the Japanese versions of the original scales (i.e., UWES-J [44,45,46,47,48], organizational commitment [92,93,94], Miyairi’s OC scales [66], LMX-MDM [73,95], OJS-J [75,76], Sekimoto’s OC scales [67], and OCB [71]) were used. For the three factors, namely, TW, TC, and AF, the Japanese versions of the original scales were unavailable. As such, we prepared alternative scales. For TW, we used the Teamwork measure developed by Misawa et al. [96]. For TC, we used the general trust questionnaire developed by Yamagishi [77] but replaced “people” with “colleagues.” For AF, we used the feedback and autonomy scales among the job characteristics scales developed by Ishibashi [97]. In addition, we included intrinsic motivation [98,99], burnout [100,101,102,103], intent to quit [94], and psychological safety [104] due to their theoretically predicted relevance. Specifically, intrinsic motivation is predicted to be positively correlated with work engagement [105]. Based on the original definition, burnout is expected to be negatively correlated with work engagement [44]. The “intent to quit” is a commonly used outcome in the JD-R model and has been found to be negatively correlated with work engagement [53,54,55,56,57,58,59,60,61]. Psychological safety required for teaming [104] is expected to be positively correlated with TW and TC, which represent relationships with team members.
Furthermore, we also adopted several scales from the New Brief Japanese Stress Questionnaire (New BJSQ) [106], which, similar to the OEQ, was developed with reference to the JD-R model. Although the New BJSQ contains many scales, we selected those that are theoretically related to the 10 factors of the OEQ. Moreover, the scales were selected mainly from those related to job resources because the OEQ excludes scales related to job demands. For example, “job satisfaction” is a concept included in the LO. Kahn [107] considered “meaningfulness” as a major component of engagement. “Performance of a duty” is a sense of obligation due to extrinsic motivation. Thus, it is expected to exhibit a low correlation with WF and LO. “Collective efficacy,” “workplace social capital,” and “coworker support,” which are measures related to positive team relationship, are expected to be positively correlated with TW and TC. Alternatively, “interpersonal conflict” and “role conflict,” which are disincentives for teaming, may have no correlation or have a negative correlation with TW and TC. “Supervisor support,” “leadership,” and “interactional justice” may be positively correlated with RS and TS. Furthermore, “job control,” “participation,” and “role clarity,” which are scales related to job characteristics, may be positively correlated with AF. “Monetary/status reward,” “esteem reward,” and “fair personnel evaluation,” which are scales related to reward and evaluation, are considered to be positively correlated with FE. “Respect for individuals” and “workplace social capital,” which represent OC, are considered positively correlated with OO. “Workplace social capital” represents a sense of unity in the workplace and is simultaneously considered to influence a sense of unity in the team.
Table A3. Valid and reliable Japanese scales for the construct validity test of the Organizational Engagement Questionnaire.
ScaleDescription
9-item UWES-J
–Work engagement
The scale has three versions (17-item, 9-item, and 3-item) and was developed by Schaufeli et al. [44,45,46] and translated into Japanese by Shimazu [47,48]. This study used the nine-item version.
Intrinsic motivationThe Japanese five-item scale developed by Horie et al. [98] to capture the process of gaining satisfaction from activities and being motivated. It takes only the intrinsic satisfaction items from the Minnesota Satisfaction Questionnaire and aligns them with Deci’s definition of intrinsic motivation [99].
Organizational Commitment
–Affective commitment
–Continuance commitment
–Normative commitment
A scale used to measure the three-dimensional organizational commitment proposed by Mayer and Allen [92]. We used the Japanese version of this scale (Nishida [93] and Aoki [94]). Affective commitment refers to the employee’s affection toward the organization [93], whereas continuance commitment denotes continual affiliation with the organization without affection [93]. Lastly, normative commitment refers to the attitudes of subordinates toward the organization [94].
Japanese Burnout Scale (JBS)
–Personal accomplishment
–Emotional exhaustion
–Depersonalization
This is the most used burnout scale in Japan that used the same construct as the Maslach Burnout Inventory (MBI). The scale was developed by Tao [100], validated by Kubo [101,102], and compared with MBI by Igawa et al. [103]. This scale displayed sufficient validity for providers of human services but low validity for other industries. Initially, work engagement was defined as the opposite concept of burnout.
Intent to quitThis is an outcome measure in the JD-R model that predicts turnover. Many studies that used the JD-R model demonstrated that this score decreases with improvement in work engagement. The current study used the Japanese scale of Aoki [94].
Teamwork measure
–Task orientation
–Job directions
It is a teamwork scale developed by Misawa et al. [96] and consists of three factors, namely team orientation, leadership, and team process. It has a total of 10 sub-factors. The current study used two factors, namely task orientation and job directions.
Psychological safetyThe scale was developed by Edmondson [104] to measure “the environment in an organization or group in which one can speak without fear of blame or rejection.”
General trust
–For people
–For colleagues
This scale developed by Yamagishi [77] measures the extent of the trustworthiness of strangers. We changed the word people to colleagues and used it as a scale to measure the extent of the trustworthiness of colleagues who are strangers.
Miyairi’s organizational climate
–Trust for one’s immediate superiors
Developed by Miyairi [66], this scale is one of the eight factors of the Organizational Climate Scale and measures the level of trust of an employee in the judgment, policy, and issue recognition of an immediate supervisor. This construct expresses trust in a supervisor’s ability to solve problems, build relationships, and make decisions. Moreover, this construct is the basis of the RS.
Multidimensional LMX (LMX-MDM)
–Loyalty
–Affect
Developed by Liden [73] and translated into Japanese by Matsuura et al. [95], the scale consists of four dimensions, namely, affect, professional respect, loyalty, and contribution. We used affect and loyalty to express emotional trust in supervisors. This scale forms the basis of the TS.
Job characteristics
–Feedback
–Autonomy
Based on the job characteristic theory of Hackman and Oldham [74], we used the Japanese scale created by Ishibashi [97]. Feedback measures the chances of knowing how to proceed with a job, how well it is done, and how good or bad the job is. Autonomy measures the extent to which one can control work, challenge work, and change work methods through personal initiatives.
Organizational justice
–Distributive justice
–Procedural justice
The scale was developed by Colquitt [75] and translated into Japanese by Shibaoka et al. [76]. Organizational justice is composed of four dimensions, namely procedural, distributive, interpersonal, and informational. The current study used procedural and distributive justice, which are the bases of FE.
Sekimoto’s organizational climate
–Free and open-mindedness
–Flexibility, creativity, and originality
This seven-dimensional scale was developed by Sekimoto et al. [67] and measures the organizational climate of Japanese companies. We used the two factors, which were the bases of OO.
Japanese OCB
–Organizational support behavior
This scale intends to measure the Japanese version of OCB developed by Tanaka [71]. The measurement items differ between the Japanese and the American versions. The Japanese version measures five items, namely interpersonal assistance, honesty, job consideration, organizational support behavior, and cleanliness. This study used only organizational support behaviors on which the RB was based.
New BJSQ
–Job satisfaction
–Meaningfulness of work
–Collective efficacy
–Coworker support
–Supervisor support
–Leadership
–Interactional justice
–Job control
–Participation (procedural justice)
–Monetary/status reward
–Esteem reward
–Fair personnel evaluation
–Respect for individuals
–Workplace social capital
–Interpersonal conflict
–Role clarity
–Performance of duties
–Family support
–Role conflict
Inoue et al. [106] developed the new version of the questionnaire for workplace stress checks. The old version was developed by the same research group and adopted by the Japanese Ministry of Health, Labor and Welfare. The new version is an extended version that introduces the concepts of work engagement and the JD-R model into the old version. In this survey, we mainly selected and used the scales classified as job resources and scales related to relationships. “Procedural justice” is a scale in which the item asks regarding “participation in decision making” and is typically named “participation.“ Therefore, “procedural justice” was changed to “participation.”

Appendix B.2.2. Correlations

Table A4 presents the convergent validity and theoretical consistency of the OEQ. Convergent validity indicates the correlation coefficient with similar concepts. Theoretical consistency indicates the measures that are theoretically predicted to be relevant and those that are demonstrated to be relevant with analysis. To determine relevance, a correlation coefficient of 0.6 or higher was used as a criterion. However, for TC, relevance was determined when the correlation coefficient was 0.55 or higher. The correlation coefficients presented in this table were all significant (p < 0.001), except for role conflict, which is non-significant due to the lack of correlation.
Table A4. Convergent validity of the Organizational Engagement Questionnaire. Values following the scale names are significant Pearson’s correlation coefficients with p < 0.001, except for role conflict (n = 385 workers; males: 286, mean age 47.6 years; females: 99, mean age 41.1 years).
Convergent ValidityTheoretical Consistency
WFUWES-9-J/Work engagement (0.80)Intrinsic motivation (0.71)
JBS/personal accomplishment (0.70)
Affective commitment (0.63)
New BJSQ/meaningfulness of work (0.52)
New BJSQ/performance of a duty (0.29)
Intent to quit (−0.34)
JBS/depersonalization (−0.38)
JBS/emotional exhaustion (−0.33)
LOAffective commitment (0.77)
Continuance commitment (0.45)
Normative commitment (0.58)
New BJSQ/Job satisfaction (0.64)
UWES-9-J/work engagement (0.73)
Intrinsic motivation (0.73)
JBS/personal accomplishment (0.64)
New BJSQ/meaningfulness of work (0.59)
New BJSQ/performance of duties (0.34)
Intent to quit (−0.46)
JBS/depersonalization (−0.47)
JBS/emotional exhaustion (−0.40)
TWTeamwork/task orientation (0.62)
Teamwork/job direction (0.62)
New BJSQ/role clarity (0.44)
Psychological safety (0.61)
New BJSQ/collective efficacy (0.63)
New BJSQ/workplace social capital (0.60)
New BJSQ/coworker support (0.51)
New BJSQ/interpersonal conflict (−0.38)
New BJSQ/role conflict (−0.01)
TCGeneral trust for people (0.46)
General trust for colleague (0.58)
Psychological safety (0.59)
New BJSQ/collective efficacy (0.58)
New BJSQ/coworker support (0.57)
New BJSQ/workplace social capital (0.56)
New BJSQ/interpersonal conflict (−0.31)
New BJSQ/role conflict (−0.02)
RSTrust in one’s immediate superiors (0.76)
LMX-MDM/Loyalty (0.70)
LMX-MDM/Affect (0.69)
New BJSQ/supervisor support (0.65)
New BJSQ/leadership (0.62)
New BJSQ/interactional justice (0.62)
TSLMX-MDM/Affect (0.71)
LMX-MDM/Loyalty (0.69)
Trust in one’s immediate superiors (0.68)
New BJSQ/supervisor support (0.67)
New BJSQ/interactional justice (0.61)
New BJSQ/leadership (0.59)
AFFeedback (0.60)
Autonomy (0.48)
New BJSQ/Job control (0.56)
Free and open-minded (0.65)
Teamwork/task orientation (0.61)
New BJSQ/respect for individuals (0.63)
New BJSQ/collective efficacy (0.61)
New BJSQ/participation (0.60)
New BJSQ/role clarity (0.50)
FEDistributive organizational justice (0.69)
Procedural organizational justice (0.65)
New BJSQ/Fair personnel evaluation (0.66)
New BJSQ/monetary/status reward (0.71)
New BJSQ/Esteem reward (0.69)
Free and open-minded (0.66)
Affective commitment (0.65)
New BJSQ/leadership (0.61)
New BJSQ/workplace social capital (0.61)
New BJSQ/participation (0.61)
OOFree and open-minded (0.74)
Flexibility, creativity, and originality (0.66)
New BJSQ/respect for individuals (0.71)
New BJSQ/workplace social capital (0.68)
Affective commitment (0.66)
New BJSQ/esteem reward (0.66)
New BJSQ/participation (0.64)
New BJSQ/fair personnel evaluation (0.64)
RBOrganizational support behavior (0.54)
Work fulfillment (0.70)
Love for the organization (0.78)
UWES-9-J/work engagement (0.64)
Affective commitment (0.64)
Intrinsic motivation (0.63)
JBS/Personal accomplishment (0.59)

Appendix B.2.3. Convergent Validity

WF, LO, RS, TS, and OO exhibited strong correlations (0.70) with the derived measures, which confirms convergent validity. LO was confirmed to be convergent, whereas small correlations were obtained for continuance commitment (0.45) and normative commitment (0.58) compared with affective commitment. The following text will discuss the remaining five factors.
The TW constructs of interest resolution, work commitment, and role clarity correspond to the job direction and task orientation of the Teamwork measure and role clarity of the New BJSQ, respectively. The first two factors have a moderate correlation (0.62) with TW, which may be considered reasonable. However, the correlation of role clarity is small (0.44). Thus, TW cannot measure role clarity.
For TC, the correlation coefficient was higher for general trust in colleagues (0.58) than general trust in people (0.46). This finding suggests that TC represents trust in colleagues. However, convergence is unlikely because the correlation coefficient is less than 0.6. General trust includes trust in strangers; however, TC includes only trust in familiar colleagues. Therefore, the finding suggests that TC has convergent validity.
AF includes various concepts, such as autonomy, feedback, information transparency, and self-determinism in work. However, information transparency and self-determination were excluded from the validation because no Japanese scales measured the same concepts. AF exhibited a relatively small correlation (0.48) with Ishibashi’s autonomy scale [97] and a moderate correlation (0.56) with the job control scale of the New BJSQ. In addition, it has a moderate correlation (0.60) with Ishibashi’s feedback scale [97]. Therefore, convergent validity was suggested because the moderate correlations were obtained with concepts that represent a component of AF.
FE has a moderate correlation with distributive (0.69) and procedural (0.65) organizational justice, which were expected to be strongly correlated. In particular, distributive organizational justice can be regarded as a nearly strong correlation. FE also has a moderate correlation (0.66) with the fair personnel evaluation of the New BJSQ. Therefore, we propose that convergent validity for FE was confirmed.
RB has a moderate correlation (0.54) with organizational support behavior. RB is derived from organizational support behavior; however, organizational support behavior poses other measurement items apart from RB, such as “to play a role in work, you also sacrifice your family” and “read the company newsletter and bulletins frequently to know the latest situation in the company.” These items do not necessarily reflect the behaviors of strongly engaged people. Alternatively, RB is strongly correlated to WF (0.70) and LO (0.78). Therefore, RB is valid as an engagement behavior instead of an organizational support behavior.
In conclusion, convergent validity was confirmed for WF, LO, RS, TS, FE, OO, and RB, whereas convergent validity was suggested for TW, TC, and AF.

Appendix B.2.4. Theoretical Consistency

WF was theoretically expected to exhibit a positive correlation with intrinsic motivation (0.71), personal accomplishment (0.70) as a reverse measure of burnout, and affective commitment (0.63). Conversely, it is also theoretically consistent that WF has a negative correlation with two measures of burnout, namely depersonalization (−0.38), emotional exhaustion (−0.33), and intent to quit (−0.34). Finally, WF only had a low correlation (0.29) with performance of duties based on extrinsic motivation, which confirms its discriminant validity. Therefore, this finding confirmed the theoretical consistency of WF.
Because LO is strongly correlated with WF (0.78), it should theoretically exhibit the same trend as WF. In other words, LO is positively correlated with work engagement (0.73), intrinsic motivation (0.73), and personal accomplishment (0.64). Conversely, LO is negatively correlated with depersonalization (−0.47), emotional exhaustion (−0.40), and intent to quit (−0.46). LO demonstrates only a low correlation (0.34) with performance of duties. Thus, we obtained the expected results and confirmed the theoretical consistency of LO.
The moderate correlations of TW and TC with psychological safety, collective efficacy, and workplace social capital are consistent with theoretical predictions. Coworker support, which represents the expectation of help from coworkers, has a higher correlation with TC than with TW. When the TC of emotional trust is high, people expect help from coworkers, whereas when the TC of normative trust is high, people intend to solve problems independently. Therefore, coworker support is strongly linked to TW and less to TC. Interpersonal conflict and role conflict are considered disincentives for teaming. Thus, their negative correlation with TW and TC is theoretically consistent. Therefore, this study confirmed the theoretical consistency of TW and TC.
The fact that RS and TS are moderately correlated with the scales for supervisor support, leadership, and interactional justice is consistent with the theoretical prediction. Supervisor support represents the expectation of support from supervisors; leadership denotes encouragement from supervisors; interactional justice refers to the impartial attitude of supervisors. For example, if a supervisor is unfair, then employees may become increasingly distrustful, and RS (ability trust) and TS (emotional trust) will also decrease. Thus, the theoretical consistency of RS and TS was confirmed.
One of the questions in the AF is transparency of decision making. Therefore, the moderate correlation (0.60) of AF to participation, that is participation in decision making, is theoretically consistent. Clarity of job purpose is one of the questions in the AF. Thus, we expected it to be related to role clarity. In fact, AF displayed a moderate correlation (0.50) with role clarity. However, this result is not as strong as those of the other scales. The low correlation may be due to the difference between clarity of purpose and role clarity. Although not theoretically predicted, AF was correlated with free and open-minded (0.65), respect for individuals (0.63), task orientation (0.61), and collective efficacy (0.61) by more than 0.60. The first three factors are related to information transparency of AF. Organizations with an open-minded culture are more likely to disclose information to employees and refrain from disparaging their individuality. In addition, task orientation involves the transfer of skills among team members, which plays a part in information transparency. The last one can be explained by feedback items for AF. Knowledge of workmanship through work feedback increases a team’s sense of efficacy. Therefore, the study confirmed the theoretical consistency of AF because it is logically explainable.
Compensation is determined by evaluation in companies. Thus, a strong correlation between FE, which represents evaluation, and measures of compensation is theoretically easy to predict. In fact, FE displayed high correlations with monetary/status reward (0.71) and esteem reward (0.69). Alternatively, the more that information is disclosed and the more good communication there is with supervisors, the more that employees believe in fair evaluation based on accurate information. Thus, FE, which represents fairness of evaluation, has a moderate correlation with free and open-minded (0.69), which represents an open-minded organization; leadership (0.61), which represents communication with superiors; participation (0.61), which represents participation in decision making. In addition, the more that employees like the organization, the more likely they are to blindly believe in the fairness of the evaluation. Thus, FE is considered correlated (0.65) to affective commitment. The study, therefore, confirmed the theoretical consistency of FE because it is logically explainable.
An open organization, as represented by OO, is an organization that divulges information. For example, allowing all employees to participate in decision making increases participation (0.64). In addition, if information is disclosed, then employees will naturally give fair evaluations, which will increase fair personnel evaluation (0.64). The work of other employees will also be disclosed, and employees will naturally receive esteem rewards (0.66), such as appreciation. As a result, an atmosphere of togetherness and respect among individuals would be fostered in the workplace. Therefore, the correlations of OO to respect for individuals (0.71) and workplace social capital (0.68) are theoretically predictable. Finally, the moderate correlation of OO (0.66) with affective commitment is explainable because employees prefer such an open organization. Therefore, the study confirmed the theoretical consistency of OO because it is logically explainable.
Based on the convergent validity testing, RB measures behaviors specific to engaged employees. Hence, assuming that RB is correlated with measures related to WF and LO is easy. In fact, RB has moderate correlations with work engagement (0.64), affective commitment (0.64), intrinsic motivation (0.63), and personal accomplishment (0.59). Therefore, the study confirmed the theoretical consistency of RB.
In summary, all factors of the OEQ were consistent with theoretical predictions or could be explained theoretically.

Appendix B.2.5. Confirmatory Factor Analysis

Figure A1 shows the results of CFA for the 10-factor model of OEQ. The standardized coefficients in Figure A1 have already been shown in Table A1 as the factor loadings of CFA. The goodness of fit between the factor structure model and the OEQ measurement data was χ2/Df = 15.607 (p < 0.001), GFI = 0.924, AGFI = 0.912, CFI = 0.964, NFI = 0.962, IFI = 0.964, and RMSEA = 0.042. This result satisfies the conditions of GFI > 0.90, AGFI > 0.90, CFI > 0.95, NFI > 0.90, IFI > 0.90, and RMSEA < 0.06, so the factor structure model is a good fit.

Appendix B.2.6. Construct Validity

The homogeneity of each OEQ factor was confirmed by testing for internal consistency. Convergent validity was confirmed for WF, LO, RS, TS, FE, OO, and RB and suggested for TW, TC, and AF. Theoretical consistency was examined as an alternative to theoretical evidence, and theoretical consistency was confirmed for all factors of the OEQ. The results of the CFA indicated that the factor structure model fit the OEQ measurement data well. Therefore, we believe that we have confirmed the construct validity of the questionnaire. However, other measures may be used for several factors to increase the accuracy of convergent validity.
Figure A1. Standardized coefficients for the 10-factor model for OEQ based on CFA through the software package sem 3.1-9 for R 3.4.1. χ2/Df = 15.607 (p < 0.001), GFI = 0.924, AGFI = 0.912, CFI = 0.964, NFI = 0.962, IFI = 0.964, and RMSEA = 0.042.
Joitmc 08 00022 g0a1

References

  1. Algoe, S.B.; Dwyer, P.; Younge, A.; Oveis, C. A new perspective on the social functions of emotions: Gratitude and the witnessing effect. J. Person. Soc. Psychol. 2020, 119, 40–74. [Google Scholar] [CrossRef] [PubMed] [Green Version]
  2. Makri, S.; Turner, S. “I can’t express my thanks enough”: The “gratitude cycle” in online communities. J. Assoc. Inf. Sci. Technol. 2019, 71, 503–515. [Google Scholar] [CrossRef]
  3. Masaki, I.; Muramoto, Y. The role of gratitude in a gender-diverse workplace: Effects of collective gratitude on affective commitment. Organ. Sci. 2021, 54, 20–31. (In Japanese) [Google Scholar]
  4. Sciara, S.; Villani, D.; Di Natale, A.F.; Regalia, C. Gratitude and Social Media: A Pilot Experiment on the Benefits of Exposure to Others’ Grateful Interactions on Facebook. Front. Psychol. 2021, 12, 667052. [Google Scholar] [CrossRef]
  5. McCullough, M.E.; Kilpatrick, S.D.; Emmons, R.A.; Larson, D.B. Is gratitude a moral affect? Psychol. Bull. 2001, 127, 249–266. [Google Scholar] [CrossRef] [Green Version]
  6. McCullough, M.E.; Emmons, R.A.; Tsang, J.A. The grateful disposition: A conceptual and empirical topography. J. Personal. Soc. Psychol. 2002, 82, 112–127. [Google Scholar] [CrossRef]
  7. McCullough, M.E. Savoring Life, Past, and Present: Explaining What Hope and Gratitude Share in Common. Psychol. Inq. 2002, 13, 302–304. [Google Scholar]
  8. Watkins, P.C.; Woodward, K.; Stone, T.; Kolts, R.L. Gratitude and happiness: Development of a measure of gratitude, and relationships with subjective wellbeing. Soc. Behav. Personal. 2003, 31, 431–451. [Google Scholar] [CrossRef]
  9. Adler, M.G.; Fagley, N.S. Appreciation: Individual Differences in Finding Value and Meaning as a Unique Predictor of Subjective Well-Being. J. Personal. 2005, 73, 79–114. [Google Scholar] [CrossRef]
  10. Cain, I.H.; Cairo, A.; Duffy, M.; Meli, L.; Rye, M.S.; Worthington, E.L., Jr. Measuring gratitude at work. J. Posit. Psychol. 2019, 14, 440–451. [Google Scholar] [CrossRef]
  11. Komase, Y.; Watanabe, K.; Sasaki, N.; Kawakami, N. Reliability and validity of the Japanese version of the Gratitude at Work Scale (GAWS). J. Occup. Health 2020, 62, e12185. [Google Scholar] [CrossRef]
  12. Bar-Tal, D.; Bar-Zohar, Y.; Greenberg, M.S.; Herman, M. Reciprocity behavior in the relationship between donor and recipient and between harm-doer and victim. Sociometry 1977, 40, 293–298. [Google Scholar] [CrossRef]
  13. Naito, T.; Wangwan, J.; Tani, M. Gratitude in University Students in Japan and Thailand. J. Cross Cult. Psychol. 2005, 36, 247–263. [Google Scholar] [CrossRef]
  14. Tesser, A.; Gatewood, R.; Driver, M. Some determinants of gratitude. J. Personal. Soc. Psychol. 1968, 9, 233–236. [Google Scholar] [CrossRef]
  15. Wood, A.M.; Maltby, J.; Stewart, N.; Linley, P.A.; Joseph, S. A social-cognitive model of trait and state levels of gratitude. Emotion 2008, 8, 281–290. [Google Scholar] [CrossRef] [Green Version]
  16. Kuranaga, H.; Higuchi, M. The effect of cognitive appraisals on emotional experiences of gratitude in the situations arousing gratitude. Jpn. J. Research. On Emot. 2011, 19, 19–27. [Google Scholar] [CrossRef] [Green Version]
  17. Bartlett, M.Y.; DeSteno, D. Gratitude and Prosocial Behavior: Helping When It Costs You. Psychol. Sci. 2006, 17, 319–325. [Google Scholar] [CrossRef]
  18. Grant, A.M.; Gino, F. A little thanks goes a long way: Explaining why gratitude expressions motivate prosocial behavior. J. Personal. Soc. Psychol. 2010, 98, 946–955. [Google Scholar] [CrossRef]
  19. Lee, H.W.; Bradburn, J.; Johnson, R.E.; Lin, S.H.J.; Chang, C.H.D. The benefits of receiving gratitude for helpers: A daily investigation of proactive and reactive helping at work. J. Appl. Psychol. 2019, 104, 197–213. [Google Scholar] [CrossRef]
  20. Wood, A.M.; Joseph, S.; Maltby, J. Gratitude predicts psychological well-being above the Big Five facets. Personal. Individ. Differ. 2009, 46, 443–447. [Google Scholar] [CrossRef]
  21. Washizu, N.; Naito, T. The Emotions Sumanai, Gratitude, and Indebtedness, and Their Relations to Interpersonal Orientation and Psychological Well-Being Among Japanese University Students. Int. Perspect. Psychol. 2015, 4, 209–222. [Google Scholar] [CrossRef]
  22. Lin, C.C. The roles of social support and coping style in the relationship between gratitude and well-being. Personal. Individ. Differ. 2016, 89, 13–18. [Google Scholar] [CrossRef]
  23. Emmons, R.A.; McCullough, M.E. Counting blessings versus burdens: An experimental investigation of gratitude and subjective well-being in daily life. J. Personal. Soc. Psychol. 2003, 84, 377–389. [Google Scholar] [CrossRef]
  24. Seligman, M.E.P.; Steen, T.A.; Park, N.; Peterson, C. Positive Psychology Progress: Empirical Validation of Interventions. Am. Psychol. 2005, 60, 410–421. [Google Scholar] [CrossRef] [Green Version]
  25. Browning, S.; Geller, E.S. Studying Subjective Well-Being during a Quarantine: How does a weekly gratitude letter affect daily mood states? Va. J. Bus. Technol. Sci. 2021, 1. [Google Scholar] [CrossRef]
  26. Algoe, S.B. Find, Remind, and Bind: The Functions of Gratitude in Everyday Relationships. Soc. Personal. Psychol. Compass 2012, 6, 455–469. [Google Scholar] [CrossRef]
  27. O’Connell, B.H.; O’Shea, D.; Gallagher, S. Feeling Thanks and Saying Thanks: A Randomized Controlled Trial Examining If and How Socially Oriented Gratitude Journals Work. J. Clin. Psychol. 2017, 73, 1280–1300. [Google Scholar] [CrossRef] [Green Version]
  28. Renshaw, T.L.; Hindman, M.L. Expressing gratitude via instant communication technology: A randomized controlled trial targeting college students’ mental health. Ment. Health Prev. 2017, 7, 37–44. [Google Scholar] [CrossRef]
  29. Renshaw, T.L.; Rock, D.K. Effects of a brief grateful thinking intervention on college students’ mental health. Ment. Health Prev. 2018, 9, 19–24. [Google Scholar] [CrossRef]
  30. Heckendorf, H.; Lehr, D.; Ebert, D.D.; Freund, H. Efficacy of an internet and app-based gratitude intervention in reducing repetitive negative thinking and mechanisms of change in the intervention’s effect on anxiety and depression: Results from a randomized controlled trial. Behav. Res. Ther. 2019, 119, 103415. [Google Scholar] [CrossRef]
  31. Klibert, J.; Rochani, H.; Samawi, H.; Leleux-LaBarge, K.; Ryan, R. The Impact of an Integrated Gratitude Intervention on Positive Affect and Coping Resources. Int. J. Appl. Posit. Psychol. 2019, 3, 23–41. [Google Scholar] [CrossRef] [Green Version]
  32. Davis, D.E.; Choe, E.; Meyers, J.; Wade, N.; Varjas, K.; Gifford, A.; Quinn, A.; Hook, J.N.; Van Tongeren, D.R.; Griffin, B.J.; et al. Thankful for the little things: A meta-analysis of gratitude interventions. J. Couns. Psychol. 2016, 63, 20–31. [Google Scholar] [CrossRef] [PubMed]
  33. Cregg, D.R.; Cheavens, J.S. Gratitude Interventions: Effective Self-help? A Meta-analysis of the Impact on Symptoms of Depression and Anxiety. J. Happiness Stud. 2021, 22, 413–445. [Google Scholar] [CrossRef]
  34. Dickens, L.R. Using Gratitude to Promote Positive Change: A Series of Meta-Analyses Investigating the Effectiveness of Gratitude Interventions. Basic Appl. Soc. Psychol. 2017, 39, 193–208. [Google Scholar] [CrossRef]
  35. Van Agteren, J.; Iasiello, M.; Lo, L.; Bartholomaeus, J.; Kopsaftis, Z.; Carey, M.; Kyrios, M. A systematic review and meta-analysis of psychological interventions to improve mental wellbeing. Nat. Hum. Behav. 2021, 5, 631–652. [Google Scholar] [CrossRef] [PubMed]
  36. Zak, P.J. Trust Factor: The Science of Creating High-Performance Companies; AMACOM Books: New York, NY, USA, 2017. [Google Scholar]
  37. Algoe, S.B.; Kurtz, L.E.; Grewen, K. Oxytocin and Social Bonds: The Role of Oxytocin in Perceptions of Romantic Partners’ Bonding Behavior. Psychol. Sci. 2017, 28, 1763–1772. [Google Scholar] [CrossRef] [PubMed]
  38. Fabio, A.; Palazzeschi, L.; Bucci, O. Gratitude in Organizations: A Contribution for Healthy Organizational Contexts. Front. Psychol. 2017, 8, 2025. [Google Scholar] [CrossRef] [PubMed] [Green Version]
  39. Kim, J.; Choi, S.O. The Intensity of Organizational Change and the Perception of Organizational Innovativeness; with Discussion on Open Innovation. J. Open Innov. Technol. Mark. Complex. 2020, 6, 66. [Google Scholar] [CrossRef]
  40. Srisathan, W.A.; Ketkaew, C.; Naruetharadhol, P. The intervention of organizational sustainability in the effect of organizational culture on open innovation performance: A case of thai and chinese SMEs. Cogent Bus. Manag. 2020, 7, 1717408. [Google Scholar] [CrossRef]
  41. Naqshbandi, M.M.; Kamel, Y. Intervening role of realized absorptive capacity in organizational culture–open innovation relationship: Evidence from an emerging market. J. Gen. Manag. 2017, 42, 5–20. [Google Scholar] [CrossRef]
  42. Naqshbandi, M.M.; Tabche, I. The interplay of leadership, absorptive capacity, and organizational learning culture in open innovation: Testing a moderated mediation model. Technol. Forecast. Soc. Chang. 2018, 133, 156–167. [Google Scholar] [CrossRef]
  43. Yun, J.J.; Zhao, X.; Jung, K.; Yigitcanlar, T. The culture for open innovation dynamics. Sustainability 2020, 12, 5076. [Google Scholar] [CrossRef]
  44. Schaufeli, W.B.; Salanova, M.; Gonzales-Roma, V.; Bakker, A.B. The measurement of engagement and burnout: A two sample confirmatory factor analytic approach. J. Happiness Stud. 2002, 3, 71–92. [Google Scholar] [CrossRef]
  45. Schaufeli, W.B.; Bakker, A.B.; Salanova, M. The Measurement of Work Engagement with a Short Questionnaire: A Cross-National Study. Educ. Psychol. Meas. 2006, 66, 701–716. [Google Scholar] [CrossRef]
  46. Schaufeli, W.B.; Shimazu, A.; Hakanen, J.; Salanova, M.; de Witte, H. An Ultra-Short Measure for Work Engagement: The UWES-3 Validation Across Five Countries. Euro. J. Psychol. Assess. 2017, 35, 577–591. [Google Scholar] [CrossRef]
  47. Shimazu, A.; Schaufeli, W.B.; Kosugi, S.; Suzuki, A.; Nahiwa, H.; Kato, A.; Sakamoto, M. Work Engagement in Japan: Validation of the Japanese Version of the Utrecht Work Engagement Scale. Appl. Psychol. 2008, 57, 510–523. [Google Scholar] [CrossRef]
  48. Shimazu, A.; Schaufeli, W.B.; Miyahara, D.; Iwata, N. Why Japanese workers show low work engagement: An item response theory analysis of the Utrecht Work Engagement Scale. BioPsychoSoc. Med. 2010, 4, 17. [Google Scholar] [CrossRef] [Green Version]
  49. Knight, C.; Patterson, M.; Dawson, J. Work engagement interventions can be effective: A systematic review. Eur. J. Work Organ. Psychol. 2019, 28, 348–372. [Google Scholar] [CrossRef]
  50. Komase, Y.; Watanabe, K.; Imamura, K.; Kawakami, N. Effects of a Newly Developed Gratitude Intervention Program on Work Engagement Among Japanese Workers: A Pre- and Posttest Study. J. Occup. Environ. Med. 2019, 61, e378–e383. [Google Scholar] [CrossRef]
  51. Komase, Y.; Watanabe, K.; Kawakami, N. Effects of a gratitude intervention program on work engagement among Japanese workers: A protocol for a cluster randomized controlled trial. BMC Psychol. 2021, 9, 35. [Google Scholar] [CrossRef]
  52. Komase, Y.; Watanabe, K.; Sasaki, N.; Kawakami, N. The Effect of Perceived Gratitude from Others on Work Engagement. J. Occup. Environ. Med. 2021, 63, 592–595. [Google Scholar] [CrossRef]
  53. Bakker, A.B.; Demerouti, E.; de Boer, E.; Schaufeli, W.B. Job demands and job resources as predictors of absence duration and frequency. J. Vocat. Behav. 2003, 62, 341–356. [Google Scholar] [CrossRef]
  54. Bakker, A.B.; Demerouti, E.; Schaufeli, W.B. Dual processes at work in a call centre: An application of the job demands–resources model. Eur. J. Work Organ. Psychol. 2003, 12, 393–417. [Google Scholar] [CrossRef]
  55. Schaufeli, W.B.; Bakker, A.B. Job demands, job resources, and their relationship with burnout and engagement: A multi-sample study. J. Organ. Behav. 2004, 25, 293–315. [Google Scholar] [CrossRef] [Green Version]
  56. Bakker, A.B.; Demerouti, E. The Job Demands-Resources model: State of the art. J. Manag. Psychol. 2007, 22, 309–328. [Google Scholar] [CrossRef] [Green Version]
  57. Bakker, A.B.; Hakanen, J.J.; Demerouti, E.; Xanthopoulou, D. Job Resources Boost Work Engagement, Particularly When Job Demands. J. Educ. Psychol. 2007, 99, 274–284. [Google Scholar] [CrossRef] [Green Version]
  58. Salanova, M.; Schaufeli, W.B. A crossnational study of work engagement as a mediator between job resources and proactive behavior. Int. J. Hum. Resour. Manag. 2008, 19, 116–131. [Google Scholar] [CrossRef] [Green Version]
  59. Hakanen, J.J.; Schaufeli, W.B.; Ahola, K. The Job demands-Resources model: A three-year cross-lagged study of burnout, depression, commitment, and work engagement. Work Stress 2008, 22, 224–241. [Google Scholar] [CrossRef]
  60. Bakker, A.B.; van Veldhoven, M.; Xanthopoulou, D. Beyond the Demand-Control Model: Thriving on High Job Demands and Resources. J. Pers. Psychol. 2010, 9, 3–16. [Google Scholar] [CrossRef]
  61. Crawford, E.R.; LePine, J.A.; Rich, B.L. Linking Job Demands and Resources to Employee Engagement and Burnout: A Theoretical Extension and Meta-Analytic Test. J. Appl. Psychol. 2010, 95, 834–848. [Google Scholar] [CrossRef] [PubMed]
  62. Lodahl, T.M.; Kejner, M. The Definition and Measurement of Job Involvement. J. Appl. Psychol. 1965, 49, 24–33. [Google Scholar] [CrossRef] [PubMed]
  63. Mowday, R.T.; Steers, R.M.; Porter, L.W. The Measurement of Organizational Commitment. J. Vocat. Behav. 1979, 14, 224–247. [Google Scholar] [CrossRef]
  64. Jaros, M. Mayer and Allen Model of Organizational Commitment: Measurement Issues. Icfai J. Organ. Behav. 2007, 6, 7–25. [Google Scholar]
  65. Saks, A.M. Antecedents and consequences of employee engagement. J. Manag. Psychol. 2006, 27, 600–619. [Google Scholar] [CrossRef] [Green Version]
  66. Miyaisri, S. Development of the Organizational Climate Scale and Possibility of its Application for Organizational Change. Nihonbashi Gakkan Univ. Bull. 2007, 6, 3–13. (In Japanese) [Google Scholar]
  67. Sekimoto, M.; Kamagata, M.; Yamaguchi, Y. An attempt to create an organizational climate scale (I). Bull. Toyohashi Sozo Coll. 2001, 5, 51–65. (In Japanese) [Google Scholar]
  68. Pellerin, C.J. How NASA Builds Teams: Mission Critical Soft Skills for Scientists, Engineers, and Project Teams; Wiley: Hoboken, NJ, USA, 2009. [Google Scholar]
  69. Organ, D.W. Organizational Citizenship Behavior: The Good Soldier Syndrome; Lexington Books: Lexington, MA, USA, 1988. [Google Scholar]
  70. Podsakoff, P.M.; MacKenzie, S.B.; Paine, J.B.; Bachrach, D.G. Organizational Citizenship Behaviors: A Critical Review of the Theoretical and Empirical Literature and Suggestions for Future Research. J. Manag. 2000, 26, 513–563. [Google Scholar] [CrossRef]
  71. Tanaka, K. Organizational Citizenship Behavior: Measurement Scales, Similar Concepts, Related Concepts, and Its Determinants. Jpn. J. Adm. Sci. 2001, 15, 1–28. [Google Scholar]
  72. May, D.R.; Gilson, R.L.; Harter, L.M. The psychological conditions of meaningfulness, safety and availability, and the engagement of the human spirit at work. J. Occup. Organ. Psychol. 2004, 77, 11–37. [Google Scholar] [CrossRef]
  73. Liden, R.C.; Maslyn, J.M. Multidimensionality of Leader-Member Exchange: An Empirical Assessment through Scale development. J. Manag. 1998, 24, 43–72. [Google Scholar] [CrossRef]
  74. Hackman, J.R.; Oldham, G.R. Development of the Job Diagnostic Survey. J. Appl. Psychol. 1975, 60, 159–170. [Google Scholar] [CrossRef] [Green Version]
  75. Colquitt, J.A. On the Dimensionality of Organizational Justice: A Construct Validation of a Measure. J. Appl. Psychol. 2001, 86, 386–400. [Google Scholar] [CrossRef] [Green Version]
  76. Shibaoka, M.; Takada, M.; Watanabe, M.; Kojima, R.; Kakinuma, M.; Tanaka, K.; Kawakami, N. Development and Validity of the Japanese Version of the Organizational Justice Scale. Ind. Health 2010, 48, 66–73. [Google Scholar] [CrossRef]
  77. Yamagishi, T.; Cook, K.S.; Watabe, M. Structure of Trust; University of Tokyo Press: Tokyo, Japan, 1998. [Google Scholar]
  78. Burt, R.S. The Network Structure of Social Capital. Res. Organ. Behav. 2000, 22, 345–423. [Google Scholar] [CrossRef]
  79. Chesbrough, H.; Vanhaverbeke, W.; West, J. Open Innovation: Researching a New Paradigm; Oxford University Press: Oxford, UK, 2006. [Google Scholar]
  80. Schumpeter, J.A.; Redvers, O.P.I.E. The Theory of Economic Development. An Inquiry into Profits, Capital, Credit, Interest, and the Business Cycle; Harvard University Press: Cambridge, MA, USA, 1934. [Google Scholar]
  81. Shalley, C.; Hitt, M.A.; Zhou, J.; Morris, M.H.; Webb, J.W. Entrepreneurship as Emergence. In The Oxford Handbook of Creativity, Innovation, and Entrepreneurship; Oxford University Press: Oxford, UK, 2015; pp. 457–476. [Google Scholar]
  82. Yun, J.J.; Egbetoku, A.A.; Zhao, X. How does a social open innovation succeed? Learning from Burro battery and grassroots innovation festival of India. Sci. Technol. Soc. 2019, 24, 122–143. [Google Scholar] [CrossRef]
  83. Formica, P. The Innovative Coworking Spaces of 15th-Century Italy; Harvard Business Review: Brighton, MA, USA, 2016. [Google Scholar]
  84. Savolainen, T.; Ikonen, M. Process dynamics of trust development: Exploring and illustrating emergence in the team context. In Trust, Organizations and Social Interaction: Studying Trust as Process within and between Organizations; Jagd, S., Fuglsang, L., Eds.; Edward Elgar Publishing: Cheltenham, UK, 2016. [Google Scholar]
  85. Heale, R.; Twycross, A. Validity and reliability in quantitative studies. Evid. Based Nurs. 2015, 18, 66–67. [Google Scholar] [CrossRef] [Green Version]
  86. Mohamad, M.M.; Sulaiman, N.L.; Sern, L.C.; Salleh, K.M. Measuring the Validity and Reliability of Research Instruments. Procedia Soc. Behav. Sci. 2015, 204, 164–171. [Google Scholar] [CrossRef] [Green Version]
  87. O’Leary-Kelly, S.W.; Vokurka, R.J. The empirical assessment of construct validity. J. Oper. Manag. 1998, 16, 387–405. [Google Scholar] [CrossRef]
  88. Messick, S. Validity of psychological assessment: Validation of inferences from persons’ responses and performances as scientific inquiry into score meaning. Am. Psychol. 1995, 50, 741. [Google Scholar] [CrossRef]
  89. Gau, M.L.; Lee, T.Y. Construct validity of the prenatal attachment inventory: A confirmatory factor analysis approach. J. Nurs. Res. JNR 2003, 11, 177–187. [Google Scholar] [CrossRef]
  90. Ugulu, I. Confirmatory factor analysis for testing validity and reliability of traditional knowledge scale to measure university students attitudes. Educ. Res. Rev. 2013, 8, 1399–1408. [Google Scholar]
  91. Yu, T. Examining Construct Validity of the Student Online Learning Readiness (SOLR) Instrument Using Confirmatory Factor Analysis. Online Learn. 2018, 22, 277–288. [Google Scholar] [CrossRef]
  92. Meyer, J.P.; Allen, N.J.; Smith, C.A. Commitment to organizations and occupations: Extension and test of a three-component conceptualization. J. Appl. Psychol. 1993, 78, 538. [Google Scholar] [CrossRef]
  93. Nishida, T. Effects of job satisfaction, organizational commitment, organizational justice, and OCB on work group effectiveness. Jpn. J. Adm. Sci. 2000, 13, 137–158. [Google Scholar] [CrossRef] [Green Version]
  94. Aoki, K. Effects of Psychological Contract and Organizational Commitment upon Employees’ Intentions to Quit. Jpn. Assoc. Ind. Organ. Psychol. J. 2001, 15, 13–25. [Google Scholar]
  95. Matsuura, K.; Nomura, S. Reliability and validity of the Japanese version of Multidimensional measure of Leader-Member Exchange. In Proceedings of the 73th Annual Convention of Japanese Psychological Association, Kyoto, Japan, 26–28 August 2009. (In Japanese). [Google Scholar]
  96. Misawa, R.; Sasou, K.; Yamaguchi, H. Development of the Teamwork Measure for Nursing Teams. Jpn. J. Soc. Psychol. 2009, 24, 219–232. [Google Scholar]
  97. Ishibashi, S. The effects on Job Characteristics and Satisfaction on Organizational Citizenship Behavior. J. Jpn. Ind. Manag. Assoc. 2016, 66, 309–316. (In Japanese) [Google Scholar]
  98. Horie, T.; Inuzuka, A.; Iakawa, Y. Relation between Knowledge Contribution and Intrinsic Motivation within an R&D Organization. Jpn. J. Adm. Sci. 2007, 20, 1–12. [Google Scholar]
  99. Deci, E.L. Intrinsic Motivation; Plenum Press: New York, NY, USA, 1975. [Google Scholar]
  100. Tao, M. Theory and Measurement of Burnout in Human Services. Sci. Rep. Kyoto Prefect. Univ. Humanist. Sci. 1987, 39, 99–112. [Google Scholar]
  101. Kubo, M.; Tao, M. Burnout among nurses-the relationship between stresses and burnout. Jpn. J. Exp. Soc. Psychol. 1994, 34, 33–43. [Google Scholar] [CrossRef] [Green Version]
  102. Kubo, M. The factorial and construct validity of the Japanese Burnout Scale among service workers. Shinrigaku Kenkyu 2014, 85, 364–372. [Google Scholar] [CrossRef] [Green Version]
  103. Igawa, J.; Nakanishi, D. The difference between the Maslach Burnout Inventory-Human Services Survey (MBI-HSS) and the Japanese Burnout Scale (JBS). Jpn. J. Psychol. 2019, 90, 484–492. [Google Scholar] [CrossRef] [Green Version]
  104. Edmondson, A.C. Teaming: How Organizations Learn, Innovate, And Compete. In The Knowledge Economy; Jossey-Bass: San Francisco, CA, USA, 2012. [Google Scholar]
  105. Putra, E.D.; Cho, S.; Liu, J. Extrinsic and intrinsic motivation on work engagement in the hospitality industry: Test of motivation crowding theory. Tour. Hosp. Res. 2017, 17, 228–241. [Google Scholar] [CrossRef]
  106. Inoue, A.; Kawakami, N.; Shimomitsu, T.; Tsutsumi, A.; Haratani, T.; Yoshikawa, T.; Shimazu, A.; Odagiri, Y. Development of the new brief job stress questionnaire. In Psychosocial Factors at Work in the Asia Pacific; Springer: Cham, Germany, 2016; pp. 225–247. [Google Scholar]
  107. Kahn, W.A. Psychological conditions of personal engagement and disengagement at work. Acad. Manag. J. 1990, 33, 692–724. [Google Scholar]
Figure 1. A conceptual model based on previous studies and the target of our study.
Joitmc 08 00022 g001
Figure 2. The Thanks App Interface.
Joitmc 08 00022 g002
Figure 3. Gratitude network for each team.
Joitmc 08 00022 g003
Table 1. The 10 factors in our questionnaire.
CategoryFactorDescription
EngagementWork fulfillment (WF)Near work engagement
Love for organization (LO)Job satisfaction and organizational commitment
ColleagueTeamwork (TW)Role clarity and job responsibilities
Trust in colleagues (TC)Closeness with colleagues
SupervisorReliable supervisor (RS)Expectations that the supervisor will protect you from threats
Trust in supervisor (TS)Closeness with a supervisor
System and cultureAutonomy and feedback (AF)A part of job characteristics
Fairness of evaluation (FE)Distributional and procedural justice
Openness in organization (OO)Psychological safety culture
BehaviorRecommendation behavior (RB)Recommending your company to others
Table 2. Average engagement scores on 10 factors for each team.
Team No.RespondentsAverage Scores of the 10 Factors in Our Questionnaire
MaleFemaleTotalWFLOTWTCRSTSAFFEOORB
13035.243 4.832 5.565 5.333 4.607 4.582 3.966 4.590 4.758 5.173
23473.745 3.824 4.237 4.677 3.943 4.003 3.969 4.431 5.004 3.752
31454.843 4.300 5.259 5.609 4.720 5.755 4.539 5.352 6.052 5.147
44154.240 3.800 4.330 4.339 3.923 4.104 3.801 4.302 4.601 4.182
55163.210 3.995 3.995 4.511 3.467 4.171 3.857 4.043 4.376 3.727
64374.904 4.645 5.857 5.867 4.893 5.539 4.623 5.006 6.143 4.813
73254.489 4.499 5.073 5.135 4.524 4.706 4.518 4.501 4.854 4.747
84264.241 4.502 4.674 4.775 4.139 4.668 4.002 4.419 4.794 4.542
92024.395 3.878 5.000 5.011 4.300 4.887 4.501 5.127 4.631 4.448
103143.768 4.374 4.092 3.907 3.801 3.626 3.949 3.688 3.934 4.131
112023.605 3.750 4.002 4.337 4.197 3.880 3.834 4.000 4.122 4.000
122574.837 4.535 5.052 4.724 4.228 4.823 4.335 4.397 5.251 4.638
131014.270 4.000 4.000 4.000 4.200 4.253 4.004 4.247 4.253 3.629
141014.952 4.998 6.000 6.000 6.000 4.506 6.000 6.000 6.000 4.727
151017.000 5.750 4.997 5.631 5.994 5.253 4.887 5.000 5.488 5.629
Total 3923624.516 4.379 4.809 4.924 4.462 4.584 4.319 4.607 4.951 4.486
Table 3. Gratitude data count for each team.
Team No.No. of UsersGratitude CountGratitude Count/User
TotalWithin a TeamBetween TeamsTotalWithin a TeamBetween Teams
1336675291122.025.097.0
281987412424.89.315.5
36629339290125.867.858.0
45103257820.65.015.6
582587618232.39.522.8
66954303651159.050.5108.5
7837514822746.918.528.4
861693613328.26.022.2
922322111.51.010.5
1082153218326.94.022.9
1162738718645.514.531.0
121131914117829.012.816.2
1322722513.5 1.0 12.5
1472366716933.7 9.6 24.1
1522098201104.5 4.0 100.5
Total8843541415293949.5 16.1 33.4
Table 4. Triangular network density for each team.
Team No.Number of UsersTriangular Network Density (TND)
131.000
280.036
361.000
450.200
580.321
660.800
780.357
860.100
920.000
1080.036
1160.171
12110.133
1320.000
1470.629
1521.000
Table 5. Correlations between our 10 engagement factors and the gratitude data from the Thanks App.
Questionnaire (Pre-Survey)Thanks per Users
in a Team
Thanks per Users
between Teams
Triangular Network Density (TND)
rp rp rp
EngagementWF0.16 0.564 0.68 0.005 **0.70 0.003 **
LO0.10 0.731 0.66 0.008 **0.69 0.005 **
ColleagueTW0.50 0.058 0.56 0.030 *0.68 0.005 **
TC0.54 0.037 *0.64 0.010 *0.80 0.000 ***
SupervisorRS0.19 0.504 0.54 0.036 *0.68 0.005 **
TS0.68 0.005 **0.60 0.019 *0.67 0.006 **
System and cultureAF0.15 0.596 0.21 0.453 0.45 0.094
FE0.37 0.175 0.31 0.265 0.57 0.027 *
OO0.64 0.011 *0.51 0.052 0.68 0.005 **
BehaviorRB0.44 0.105 0.73 0.002 **0.81 0.000 ***
* p < 0.05, ** p < 0.01, *** p < 0.001.
Publisher’s Note: MDPI stays neutral with regard to jurisdictional claims in published maps and institutional affiliations.

