Dynamics of Business Models in Industry-Wide Collaborative Networks for Circularity


1
Institute of Management, Faculty of Business and Management, Brno University of Technology, CZ-61200 Brno, Czech Republic
2
Institute of Business Engineering and Management, Riga University of Technology, LV-1658 Riga, Latvia
*
Author to whom correspondence should be addressed.
J. Open Innov. Technol. Mark. Complex. 2022, 8(1), 3; https://doi.org/10.3390/joitmc8010003
Submission received: 13 November 2021
/
Revised: 15 December 2021
/
Accepted: 16 December 2021
/
Published: 4 January 2022
(This article belongs to the Special Issue Open Innovation and Business Model in the Global Economic Crisis Which is Triggered by the Pandemic of COVID-19)
Abstract
:Incumbent B2B manufacturing companies join forces and form collaborative networks, called consortia, aiming to increase the circularity of their products. Our research interest lies in the understanding of how the business models (BM) of the companies and the industry are affected by such collaborations in the collaborative networks of the circular economy (CE). Given the exploratory nature of our empirical research, we applied a mixed research strategy of an inductively deductive nature. We carried out case studies in a manufacturing industry field and combined them with quantitative content analyses of the companies’ financial and non-financial reports. Drawing on the assumptions of the Attention-Based View Theory and Legitimacy Theory, we defined and found verbally communicated identifiers of BM elements, CE strategies, and collaborative networks, quantified their occurrences, and transformed them into variables. Using correlation analyses, we determined the tightness and the changes in relationships between the BMs’ elements and CE strategies. We examined the dynamic changes in the structure of BMs and their elements occurring within the implementation of selected CE strategies. Our findings suggest that collaborative networks for CE support an adaptation of the industry’s BMs. The higher-level CE strategies impact the BM more than the lower-level ones. The contribution of our research is in the suggested method of quantification and concretization of an abstract concept of BMs’ elements and their interrelations. This enables an assessment and a direct comparison of BMs, as well as of implemented CE strategies across companies and across industries. Our results also shed more light on the way the companies and industries adapt their BMs towards reaching circularity, as well as on how collaborative networks support such a transition.
1. Introduction
Current societal challenges related to products, processes, businesses, and entire sectors include a requirement to increase the sustainability of entrepreneurship and to contribute to addressing the issues related to both environmental and social aspects of entrepreneurship. The reduction in or elimination of negative influences and events associated with traditional production and consumption methods has become a new paradigm. Following the 2015 UN Conference in Paris [1] and the conclusion of the Paris Agreement—a global agreement on climate change—there has been increasing pressure to achieve greater environmental friendliness within business to ensure sustainable development. The European Green Deal, presented by the European Commission in 2020 [2], is another significant milestone on the road to ensuring society-wide sustainability. Reducing consumption, especially non-renewable sources of raw materials, reducing waste generation, and reuse, are becoming a new social paradigm. Businesses are expected to move from a linear to a circular use of resources and products. A CE is perceived as one of the supporting tools for achieving sustainability, especially with regard to the environmental aspect, as well as social and economic. A CE comes to the forefront of consumer, business, industry, and government interests.
However, established businesses face the difficult task of tackling new challenges, how to adapt their products and processes to sustainability-related demands and how to implement adequate CE strategies into their existing and established BMs. They are seeking ways to achieve not only the environmental, but also social and economic sustainability, considering expectations related to corporate social responsibility (CSR), in accordance with the triple-bottom-line approach [3], called 3P (people, planet, and profit).
One way for established businesses to grasp comprehensive CE issues at both corporate and sectoral level may consist in gradually changing their BMs by dynamically adapting their BMs and their elements by implementing selected CE strategies. The topic of BM dynamics through CE implementation, its form and scope are an emerging one [4,5,6]. Transformation of the linear-operating BM is a crucial constituent in the attainment of a CE, however the academic literature on the subject has not yet matured, and the uptake of such BMs in the corporate sector is slow [4]. Currently the hypothesis is that higher-level CE strategies require more complex BM and ecosystem changes [7]. At the same time, while there are a growing number of papers dealing with BM dynamics from a mainly qualitative perspective or e.g., from system dynamics perspective [8,9,10], the truly quantitative methods enabling a numerical assessment of BM and supporting a measurement of business model dynamics are emerging, although available [11,12]. We perceive the need for a method that supports quantification of BM and its elements and thus a comparison of various BMs, for academia and for practitioners. We aim to contribute to an understanding of how CE affects BMs, both for theoretical research purposes and for practical application at the corporate and sectoral level. Our intention is to contribute to filling this research opportunity.
The BMs of companies are interconnected within business ecosystems and sectors [13]. Thus, the adaptation of BMs by implementing CE strategies is not a matter for a single enterprise. The change in the BM is comprehensive in nature [14] and requires the cooperation of different actors in the ecosystem. Enterprises from different parts of the ecosystem and the supply chain cooperate on sustainability-oriented [15] and on CE-oriented innovations [16,17]. Innovation can also involve cooperation between producers and citizens [18]. One possible form of cooperation includes open collaborative networks in the form of various consortia or alliances. These bring together relevant stakeholders in the ecosystem, whose aim is to achieve a change in the currently applied BMs by implementing CE strategies. They apply a more open and innovative way of cooperation, leading to the adaptation and innovation of established BMs. Digital platforms may support communication, coordination, and cooperation among various stakeholders in the consortia [19], particularly in industrial ecosystems [20].
Therefore, we formulate our research question (RQ) as follows:
RQ: How do the individual companies’ and industries’ business models dynamically adapt as the companies collaborate in the consortia for a circular economy?
The cooperating companies’ attention needs to be focused on the BM configurations that differ to the traditional ones, which are based on the linear use of resources. Given the systemic nature of the desired BM adaptation, the BM adaptation needs to be supported by a strong communication towards and with numerous stakeholders, driving their attention towards the relevant BM adaptation enablers. A transition to a CE and BM adaptation will likely require a behavioural change of various involved actors. Those behavioural changes that are necessary on both a personal and an organisational level can be supported, for example, by coaching [21], education and strong communication both internally and externally [22].
The communication regarding the CE is an inherent part of the companies’ on-line marketing communication [23], especially the CSR related one. One of the key means of communicating on CSR, and also one of the main vehicles for disclosing the relevant BM on the company level, are the various corporate reports (CR), i.e., annual, sustainability, integrated, or strategic reports [24,25,26,27].
2. Theoretical Background
2.1. Attention Based View Theory
According to the Attention Based View Theory (ABV), the behaviour of the company may be explained according to how the attention of the decision-making bodies is structured, distributed, and influenced [28]. Attention is actively focused on issues and responses to them. A BM is a “cognitive structure that organises managerial understanding of internal and external interdependencies” [28] (p. 79). Ocasio [29] sees the specific context or situation, in which managers are located as an incentive to contribute to the selection of the focus of the managers’ attention. This is reflected in the structured distribution of attention, which is determined for specific activities, communication, and procedures. Attention is positively associated with the strategy [30]. Attention results in specific steps taken by the enterprise [31].
We anticipate that businesses, especially in the context of the events and challenges of 2020 associated with the European Green Deal, will focus their attention on adapting their BMs to better comply with the requirements of achieving a higher level of environmental sustainability, specifically through the CE implementation. As a result, attention will be reflected in the manner in which they communicate their BM and CE implementation into the BMs in their CRs.
2.2. Legitimacy Theory
Attention is related to the significance or materiality in an area serving as a key characteristic and engine of communication mediated in CR [25,26]. Information on the BM is part of CR and according to [24], is closely related to the Legitimacy Theory, according to which businesses will prioritise publishing information, which is legitimate in the eyes of the society and leads to an aligned business value system and ecosystem. At the same time, [24] state that more information will be made public by businesses if there is a risk of increased costs associated with illegitimacy, such as product boycotts or problems with the employment of talented individuals. If the European Green Deal is considered a societal challenge, we assume that businesses will regard CE as an object of materiality to achieve greater legitimacy. Therefore, activities related to the BM adaptation and the CE implementation, or the level of information about them, will be considered legitimate by businesses. Legitimacy is clearly related to the information relevant to achieving sustainability, the aspects of which are the very essence of CR.
Based on the assumptions of the ABV Theory and Legitimacy Theory, we assume that businesses will increasingly focus their external communication on the issue of adapting their BM by means of the CE implementation. As CR is a key means of communication in the CSR field and since both BM and CE are considered part of the CSR, we posit that it is possible to identify relevant indicators of both BM and CE in the CR. With the help of qualitative and quantitative research methods, the aim of our research is to define relevant indicators, to find them in CRs, quantify them, transform them into variables—BM elements and CE strategies—evaluate their mutual relations and dynamics.
2.3. Concept of the Business Model
The BM is an abstract concept, describing the logic of how the company does business and creates value, what its value proposition is, for whom it creates value and why is it profitable—how it captures the value created [28,32].
The so-called Recombination School of University of St. Gallen [28,33] conceptualizes the BM through key elements: the customer (WHO or for whom) and value offerings (WHAT), which are deemed as the BM’s external elements. Furthermore, the BM contains the process and activity of creating and delivering value (HOW) together with the value capture expressed in costs and revenues (WHY), which can be considered as internal elements of the BM. The HOW element can be divided into HOW1 (value creation) and HOW2 (value delivery). The BM is considered a functional system of these interconnected elements [34,35,36].
Particularly for circular economy-oriented BMs, [22] suggests BM extension with an element of value communication (VCO). Bieger and Reinhold [37] mention the concept of the communication and include the VCO element in the BM. Krmela [22] explicitly extends the set of BM elements to include a key element of value communication—VCO—as a tool for transferring value aspects offered by the value creator into value aspects perceived, requested, and accepted by the recipient of the value. All stakeholders associated with the entity applying the BM can be considered to be beneficiaries of the value. Accordingly, in our research, we consider the BM a system made of the six interconnected elements WHO, WHAT, HOW1, HOW2, WHY and VCO (Figure 1).
2.4. Business Model Dynamics
The BM elements and the BMs themselves are subject to dynamic change through adaptation over time [36,38,39]. Such dynamically adapted, innovative BMs support the transition to higher sustainability and especially to the CE [16].

Subject to the size and the scope of the changes, the BM dynamics (BMD) mean either adaptive, incremental, or more abrupt, radical changes of the existing BMs [41,42]. When researching the BMD, possible forms of the BMD [43] (p. 39) can be distinguished:
In our research presented here, we have agreed with the definition of the BMD according to [43] p. 39): “The dynamics of the business model means any change in the content, significance, and relations of individual elements of the business model, caused by internal or external influences, which leads to the expansion or revision of the existing BM. By changing its BM, the entity applying the business model is better adapting to the changed ecosystem conditions”.
2.5. 9R Model of Circular Economy Strategies
A CE aims for a decoupling of the resource use from the economic growth and for the reduction and elimination of waste [51]. The CE is conceptualised inconsistently by individual authors and organisations. Kirchherr et al. [52] identified a total of 117 CE definitions. The Ellen MacArthur Foundation (https://www.ellenmacarthurfoundation.org, accessed on 13 November 2021) is considered a CE pioneer, with its work being followed by several authors dealing with CE issues.
CE principles and the application of various CE strategies have been conceptualised in the 9R CE framework [7], consisting of 10 various CE strategies (Table 1). The CE 9R strategy model was created by adapting the RLI’s concept [53]. A key prerequisite, intertwined with all CE strategies, consists of design being orientated towards product circularity or the so-called eco-design [54]. Each CE strategy will presumably require different configurations of the BM elements [7] and will therefore presumably cause different BMD. From the CE perspective, the objective in the 9R model is to achieve the highest (10th) level R0, i.e., the complete refusal of consumption (Refuse). The lowest level is represented by R9, i.e., saving waste by processing it into a form of energy (Recover) [7]. Any of the 9R levels is considered to be a more acceptable solution than landfilling, which is not included at all in the 9R model of CE strategies.
Potting et al. [7] admit that Recycling (R2) is the most common CE strategy. Yang and Evans [54] include Recycling (R8), Remanufacturing (R6) and Re-using (R3)—three of the nine possible strategies in CE—as key approaches to improving environmental sustainability. However, changes will be needed to implement higher-level strategies—socio-institutional, revenue models, product design and key technologies. An incremental adaptation of the BM should be sufficient for socio-institutional changes. In the case of changing revenue models, product design or key technologies, it can be assumed that a more complex and radical BMD in the form of a BM innovation will be necessary [7].
The 9R model of CE strategies focuses on preserving materials in the production and consumption cycle at the most optimal possible level [54] and thus reducing and eliminating unused waste. The model is very close to the overall strategy of the European Union to minimise waste, in particular Directive 2008/98/EC of the European Parliament and of the Council of 19 November 2008 on waste and repealing certain Directives [55], which was extended by Directive 2018/851 on 30 May 2018 [56]. Maintaining value in the economic system should be considered as crucial for CE [57]. In the modern concept of CE 3.0, the CE is perceived as more than just waste management, which can lead to their uneconomic (in terms of waste of resources), non-ecological (environmentally unsound) or possibly socially problematic (jeopardising the health or lives of people) waste disposal. A CE currently exceeds the thresholds of economic gains stemming from its application. What are coming to the fore are the efforts to ensure long-term sustainability and to preserve mainly non-renewable sources, alongside the increasing population and, finally, to attempt to halt global warming.
2.6. Open Innovation Concept within a Business Model Concept
Companies cooperate in various partnerships, coalitions and consortia [58] on the way towards reaching circularity with their products. The cooperation involves both existing stakeholders in the given industry field, as well as new entrants to the industry [59]. The BMs of the cooperating companies are exposed to know-how from outside, not existent among the incumbent companies. Thus, an open innovation brings know-how from the external environment and impacts the BMs of the incumbent companies, leading to BMD [60]. Larger players especially can benefit from this [13]. Companies applying the open innovation into their BMs will reach a faster extension of the value proposition in a form of new products [61]. An open innovation attitude in various forms defined through rectangular compass (overshooting, expanding bottom, forward neighborhood, backward neighborhood) is the trigger of BM innovation dynamics [18]. The dynamics of open innovation through collaborative networking can help enterprises overcome the limits of existing closed systems of individual enterprises [62]. Therefore, open innovation is mainly applied at the stage of product or market maturity [63].
3. Materials and Methods
3.1. Method
Considering the emerging research field of CE and an abstract concept of the BM, a mixed research strategy [64] has been chosen. In the qualitative part, we have applied an in-depth case study approach, conducted on manufacturing companies, as well as on a consortium of companies, active in the European manufacturing and processing industry field, producing decorative and information systems (DIS). DIS are physical, material products, used both by B2B, B2C and B2G companies, as well as by individual persons in numerous end-use applications. DIS manufacturing is a particular industry field that processes products of a different nature—both of renewable (typically wooden fibre based) and non-renewable (typically crude oil based) resource origins, into a product containing multi-material components. These components (hereinafter referred to as the “MRL”—anonymized) constitute approximately 50% of the whole DIS (in weight terms), support the application of DIS onto the final product and become, after the first use of DIS for numerous reasons, difficult to separately collect and process waste from. The amount of annually generated MRL in Europe amounts to approximately half a million metric tons. Accordingly, the implementation of CE strategies for the DIS, and especially for these supporting components of DIS, is perceived as an ever increasingly relevant topic in the DIS industry.
The qualitative data were collected between spring 2020 and spring 2021 through participants’ observations, narrative interviews and focus group meetings with experts from the industry. In parallel, we have performed manifest and latent content analysis of the key documents published by companies active in DIS manufacturing. In the quantitative part of our research, the documents of the sample of the examined enterprises were analysed using the quantitative content analysis with auto-coded texts [14,24]. A total set of 98 documents (n = 98) of the examined enterprises and consortia were subject to the analysis, with a total word-count of 3,373,742.
Sets of verbal semantic indicators (codes) representing the clusters BM elements (Appendix A, 64 indicators), CE strategy (Appendix B, 74 indicators) and network cooperation in the enterprise network (Appendix C, 14 indicators) were used to analyse the documents and determine the variables. We created and defined the sets in an iterative manner during the research using the examination of professional sources, selected scientific papers referenced under [65,66,67,68], case studies and manifest and latent content analyses of the documents of the examined sample. By means of an analytical induction, we also used our own previous experience with the examined industry [36]. These sources were auto-coded. As a result, a total of 139,043 verbal BM and CE indicator occurrences were found with the help of the quantitative content analysis using auto-coding. Furthermore, 1993 verbal indicator occurrences of network cooperation of enterprises were found. By means of the absolute frequencies of the occurrences, the indicators found were clustered, transformed and aggregated into empirically determined variables expressed as:
- The variables of the cluster “BM elements”: “WHO, WHAT, HOW1, HOW2, WHY and VCO”
- The variables of the cluster “CE strategy”: “CIRCULAR, R0, R1, R2, R3, R4, R5, R6, R7, R8, R9, and RR”
- The moderating variable of the cluster “network cooperation”: “CONSORTIUM”
The significance of the variables was determined as the relative frequency of indicator occurrences in the BM and in the CE aggregated models. The object of our research was the BMD, expressed as a change in the tightness of relations between the variables and how they are influenced by the variable of the network cooperation. Our aim was to verify the existence of the dependence between the identified variables, to measure its intensity and direction. At the same time, we intended to compare the dependencies when considering the selected external moderating factor, namely collaboration in a network of enterprises in the form of open innovation. Therefore, we chose correlation analysis, like [30,69,70]. Considering the large number of verbal indicators found, Pearson correlation and partial correlation coefficients were used to determine the relationships between the variables obtained. We also compared the examined sample from the time perspective [71,72] for 2019 and 2020 to determine the temporal BMD. In the analytical part of our research, we used SW MAXQDA2020 Analytics Pro for manifest and latent content analysis, for identification of the verbal semantic indicators, and for auto-coding by means of the quantitative content analysis. We used SW JASP for statistical evaluations of the relationships between the variables in the quantitative part of the research.
Employing multiple sources of evidence, as well as multiple analytical tools, we aimed for a triangulation of largely qualitative data and thus increased construct validity [73]. The cross-case synthesis [71] contributed to our understanding of how the original BM based on linearity of the resource use evolves towards an adapted, more circular one in a collaborative network. Regarding the names of the experts—the respondents were anonymised. The names of entities, products, industries, and data sources were anonymised or pseudo-anonymised for reasons of necessary confidentiality. Similarly, a few verbal semantic indicators were partially pseudo-anonymised. The list of the abbreviations used in the text is provided in Appendix D.
3.2. Sample
The examined sample included, in the qualitative part, 26 European B2B enterprises operating at the top of the supply chain of the DIS sector as suppliers of MRL materials, i.e., essential physical components of DIS. The companies became members of the CEDIS.E Consortium in 2020, aimed at implementing MRL-focused CE strategies into the DIS sector. Stratified purposive sampling and replication logic [74] were applied. Due to the comprehensiveness of the supply chain in the DIS sector and the relatively small number of companies at the top of the supply chain, entities with a cumulated market share of around 85% in their market segments were included in the quantitative research, with the availability and reliability of comparable data and the possibility of their triangulation. While the cumulative annual sales value of all relevant DIS finished products in Europe is estimated by industry experts to be around EUR 15 bn, the accumulated annual EUR turnover of the regionally or globally active 26 companies from the population under investigation exceeds this value several times over.
57 internal and external documents of the CEDIS.E were used in the quantitative analysis for the period spring 2020–spring 2021 (minutes of the meetings and white papers), covering the results of the joint work of 26 enterprises within CEDIS.E. The data set is called CEDIS.E. The analysis also included externally communicated, structured and comparable information available through the CRs: 18 of 26 examined companies published their CRs, which could be taken into consideration in our CRs’ analyses. The analysis covered 41 CRs for the period of 2019–2020. The data set is called the COMPANIES.
3.3. Research Hypotheses
We anticipate that, considering the impact of the European Green Deal on the focus of business’ attention and its legitimacy for stakeholders, the BM communicated in the CR of the COMPANIES for 2020 will show a changed elements’ structure in terms of their relative importance in the BM, compared to the BM for 2019. Therefore, our Hypothesis 1 is:
Hypothesis 1 (H1).
The structure of the communicated aggregated BM in the COMPANIES data set in 2020 shows a change in the relative significance of its elements compared to the communicated aggregated BM in the COMPANIES data set in 2019.
By analogy, we assume that the communicated aggregate strategies of the CE of the COMPANIES data set for 2020 will show a different structure in terms of the relative significance of each strategy from the CE of the COMPANIES data set for 2019. Therefore, our Hypothesis 2 is:
Hypothesis 2 (H2).
The structure of the communicated aggregated CE model of the COMPANIES data set in 2020 shows a change in the relative significance of each CE strategy compared to the aggregated CE model of the COMPANIES data set in 2019.
In addition, we are interested whether, considering the cooperation in the CEDIS.E Consortium, the aggregated BM, as expressed and communicated in the published CR in the COMPANIES data set, is comparable to the BM expressed in the CEDIS.E documents. Therefore, our Hypothesis 3 is:
Hypothesis 3 (H3).
The structure of the communicated aggregated BM of the COMPANIES data set shows different relative significance of its elements compared to the BM structure of the CEDIS.E data set.
Finally, we assume that the structure of the communicated aggregated model of CE strategies of the COMPANIES data set shows different relative significance of the individual CE strategies compared to the CEDIS.E Consortium owing to the individual focus of the attention of individual companies. Therefore, our Hypothesis 4 is:
Hypothesis 4 (H4).
The structure of the communicated aggregated CE model of the COMPANIES data set shows different relative significance of its elements compared to the CE model of the CEDIS.E data set.
4. Results
The companies operating in the DIS sector saw the establishment of, and in 2020 became members of, the global consortium entitled CEDIS (Circular Economy for Decorative and Information Systems). The European branch of the consortium was named CEDIS.E. The idea of establishing the CEDIS consortium occurred in the summer of 2019 after previous efforts to reuse the MRL had proved insufficient. Such efforts failed due to the weak cooperation across the supply chain (HOW1 element), a lack of awareness and due to the fact that the reuse of the MRL was a relatively low priority on the part of participants at the end of the supply chain—the consumer product manufacturers which were using DIS (VCO element). The consortium’s declared objective was to create a sustainable and circular BM for more than 75% of the MRL consumed in Europe, by 2025.
4.1. Analysis of the BM and the CE
4.1.1. Business Model in the DIS Sector Expressed through CEDIS.E
Joint work of member companies within the CEDIS.E Consortium is organised and conducted through expert working groups called focus areas (FAs). The FAs meet regularly for joint discussions on the issues at hand. An integral part of any discussion within the FAs consists of the emphasis on the rules for conducting discussions, with an emphasis on the need to respect the principles of anti-monopoly policy, the protection of free competition and the non-disclosure of information, which is considered by individual participants and enterprises to be the subject of trade secrets (HOW1 element).
The CEDIS consortium is considered global yet highly decentralised, with a strong emphasis on regional specific activities and scope. At the global level, the focus includes the coordination of key activities through the FA Technical Requirements and FA Communication. These FAs support both global and regional activities. The other FAs have a pure regional scope. In total, there are seven FAs directly relevant for CEDIS.E:
- The FA Technical requirements (HOW1 and WHAT elements): the focus of the work includes the assessment of MRL recycling options from the technical perspective.
- The FA Communication (VCO and WHO elements): the focus is primarily on working on supporting communication tools, in particular cooperation on the preparation of an essential guidance document called “White Paper”, as well as the creation of externally publishable documents on CEDIS and cooperation on the creation of websites to raise awareness and reach out to more stakeholders.
- The FA Data (HOW1 and WHO elements): the focus is to identify the main locations of the MRL used. Another objective is to establish a baseline and progress measurement towards the set quantitative targets of CEDIS.E.
- The FA Recycling Solutions (HOW1, WHAT and VCO elements): the aim is to identify existing and potential partners and specific solutions for the recycling of the MRL.
- FA Transport (HOW2 element): the aim is to find and recommend suitable ways of transporting the used MRL, considering the applicable legislation at the national and European level, i.e., laws and regulations relating to waste management and transport.
- The FA Regulatory (HOW1, HOW2 and VCO elements): the FA’s objective is mainly to monitor laws, regulations, guidelines, and recommendations relevant to the DIS and wasted MRL.
- The FA Management (HOW1, VCO and WHY elements): the aim of the FA Coordination is to ensure coordination of CEDIS.E activities with CEDIS global activities, recommendations of principles of work, preparation of a contract on the functioning of CEDIS.E, supervision of activities and, finally, coordination of communication towards and with CEDIS.E stakeholders.
Individual member companies nominated their representants to the FAs at their own discretion. There are three smaller FAs: FA Transport (5 members), FA Regulatory (6 members) and FA Management (6 members). On the contrary, the FA Data (8 members) and FA Recycling Solutions (14 members) had a higher number of members. The globally active FA Technical Requirements consisted of 14 members. The number of FA members can be seen as an indicator of the importance of the FA for CEDIS.E, as well as of the individual priorities of each member company in the field of CE.
Using the quantitative content analysis of internal CEDIS.E documents (n = 57), we have established the structure of the BM in the DIS sector expressed through CEDIS.E. The BM is shown in Figure 2. This clearly indicates the dominance of the HOW1 element (42%). The results of the correlation analysis of relations between individual BM elements of CEDIS.E are shown in Table 2. Of the 15 relationships, 10 show a relationship between elements confirmed at the significance level α = 0.05. The result indicates a significant coherence of the BM elements in the examined sample of companies. Remarkably, in our results, the VCO element does not have a strong result and at the significance level α = 0.05 confirmed correlation with any other BM element expressed through CEDIS.E.
4.1.2. Business Model in the DIS Sector Expressed through COMPANIES
To compare cases, also over time [71,74], analogically to the CEDIS.E data set, we have also analysed the CR documents (n = 41) of the COMPANIES data set. By means of the quantitative content analysis, we determined the structure of the BM in the DIS sector expressed through the COMPANIES. The BM is shown in Figure 3. This indicates a significant dominance of the HOW1 element (36%).
Our research Hypothesis 1 assumes that the structure of the BM elements in the COMPANIES changed in 2020 compared to 2019. By means of the t-test, we tested the Hypothesis 11 being that in the examined sample of CR documents (n = 41) of the COMPANIES, the cumulated relative frequencies of the BM 2019 elements ≠ cumulated relative frequencies of the BM 2020. This means that the BM COMPANIES 2019 ≠ BM COMPANIES 2020. At df 39, at the significance level α = 0.05, t 〈−1.427; −0.356〉 and p 〈0.162; 0.724〉, we reject the alternative Hypothesis 11 and accept Hypothesis 10 being that the BM structure did not change.
Proof of Hypothesis 10:
BM COMPANIES in 2020 is not significantly different from the BM COMPANIES in 2019. □
Confirming Hypothesis 10 allows the determination of the aggregated BM in the DIS sector, expressed through the COMPANIES data set for 2019–2020, as shown in Figure 3.
Table 3 shows the results of the correlation analysis between the BM COMPANIES elements. Of the 15 relations, 12 show a relationship confirmed at the significance level α = 0.05. The result indicates a significant coherence of the BM elements in the examined sample. Contrary to CEDIS.E, VCO is correlated with three other BM elements. The visual comparison of Figure 2 and Figure 3, as well as Table 2 and Table 3, indicates differences in the significance of the BM elements and the relationships between them. The comparison of the BM COMPANIES with the BM CEDIS.E using the t-test at df 96, at the significance level α = 0.05, t 〈8369; 13,031〉 and achieved p < 0.001 leads to the rejection of Hypothesis 30 and the acceptance of alternative Hypothesis 31—there is a difference in BM structure.
Proof of Hypothesis 31:
The BM COMPANIES shows a different element structure from the BM CEDIS.E, expressed as the significance of the elements in the BM. □
4.1.3. Circular Economy Strategies in the DIS Sector through CEDIS.E
CEDIS.E focuses on the used MRL being a residuum resulting from the use of DIS. DIS products themselves, which are applied to consumer products, were not the primary interest of CEDIS.E for implementation of CE strategies. The DIS themselves become part of products (or their transport packaging) and are subject to individual and comprehensive product solutions from the CE perspective, considering the end of the life cycle of individual products. The issues of their involvement in the CE system are significantly different from the ones of the used MRL. CEDIS.E does not consider the disposal of waste MRL in the form of landfilling, or incineration without obtaining energy, as an acceptable end of waste solution.
Our analysis of group discussions within CEDIS.E, minutes of the meetings, CR and the websites of individual enterprises indicate the explicit or implicit performance of activities, which may be assigned to individual CE 9R strategies (R0–R9) [7].
R0 Refuse. The introduction of “MRL-less” technology and product type may be considered as one of the activities of the DIS sector belonging to the R0 strategy. This is a DIS-based technology, yet it does not require the conventional MRL. Other options for implementing the R0 strategy are substitutes within different DIS categories. These do not generate an MRL type of waste.
Another possible alternative within the R0 strategy is to change the MRL structural design to the mono-material form. This means a modified design for circularity, which would facilitate the application of R6–R8 strategies. The application of the R0 strategy has not been the immediate focus of CEDIS.E. However, individual member companies clearly apply such a strategy individually.
R1 Rethink. This strategy is applied primarily in the form of the so-called “smart DIS” i.e., DIS with additional functions and integrated digitised information carriers. The second alternative includes the multi-layer DIS. With an unchanged DIS size and thus the same amount of MRL consumed, it is possible to provide a multi-functional DIS. The application of the R1 strategy has not been the immediate focus of CEDIS.E. However, interest in it may be found at the level of individual companies.
R2 Reduce is a widely applied strategy in the DIS sector. There has been a gradual reduction in the weight of the MRL used, by almost 10% over the past 10 years. This strategy may be called R2.2 Reduce incrementally.
There are also more radical attempts on the market to reduce the weight of the MRL, potentially leading to a reduction in waste by tens of percent from the current state. We call the strategy of significant weight reduction used by RL R2.1 Reduce radically.
The application of the R2 strategy has not been the immediate focus of CEDIS.E. However, interest in it may be found at the level of individual companies.
R3 Reuse. According to DIS industry experts, a meaningful reuse of an MRL already used once in an unchanged form does not seem technologically possible. Strictly speaking, the R3 strategy cannot be considered meaningfully applicable to the DIS sector. The application of the R3 strategy was a marginal focus of CEDIS.E and was soon found to be irrelevant. However, marginal interest in it, as an alternative strategy, can be seen at the level of individual enterprises.
R4 Repair. With the existing technology and strictly in line with the definition [7], R4 strategy cannot be considered applicable in the DIS sector regarding the used MRL. The reasons are the same as in case of R3. None of the examined companies applied a similar strategy to the MRL and the considerations for its implementation were not the subject of CEDIS.E’s activities.
R5 Refurbish. Like R3 and R4, the current technology does not allow the repair and upgrading of an already used MRL in accordance with the definition [7]. The strategy was not implemented by individual companies in the field of used MRL nor was it the subject of CEDIS.E’s activities.
R6 Remanufacture, or targeted use of the components of a disassembled product into a new product with the equal functionality. The resemblance to the R7 and R8 strategies requires conceptual refinement, consisting mainly of the principle of “equal functionality”. In the context of the DIS sector and in accordance with the declared preferences of CEDIS.E, what is considered as the R6 strategy is the process of the remanufacturing and thus practically reusing of the used MRL in the form of extracting materials contained therein and their use for the remanufacture of the major component for the MRL.
CEDIS.E calls the corresponding strategy in line with R6 as circular recycling. The strategy leads to the preservation of the MRL and DIS in the existing design and technology used. The application of the R6 strategy is CEDIS.E’s main and preferred focus.
R7 Repurpose, i.e., to change the purpose, and to use the disassembled product or its components for a new product with a different functionality. In the case of the DIS sector and the logic of MRL production, it is possible to define a change of purpose as an overhaul into a technologically related product.
CEDIS.E calls the corresponding strategy as recycling into other products related to MRL. This may include a targeted but also unintentional, yet accepted use of the used MRL in its second life. The R7 strategy application is the second preferred focus of CEDIS.E activities on the path to achieving CE in the DIS sector.
R8 Recycle. To process materials in order to obtain at least the same or better (high-grade, so-called upcycling) or lower (low-grade, so called downcycling) quality or value materials or product, when compared with the original one.
The CEDIS.E Consortium refers to recycling into other types of products on a similar raw material platform, without distinguishing whether they favour upcycling or down-cycling.
The application of the R8 strategy, together with R6 and R7, is the focus of CEDIS.E and the preferred strategy. Semantically, it is confused with the R6 and R7 strategies among practitioners, and in the case of the DIS sector, it is not easy to distinguish the R6, R7 and R8 strategies unambiguously.
R9 Recover. Use of materials with energy gain by thermal process. The R9 strategy is at the bottom of the CE 9R strategies ranking. This strategy is not preferred by the CEDIS.E Consortium. However, it is admitted as acceptable provided that the LCA (life cycle analysis) objectively demonstrates a greater environmental and economic meaningfulness in a particular case than a higher-level CE strategy. For some complex MRL structures in the DIS industry, it currently seems the only one feasible.
Within the DIS industry, the R9 strategy is occasionally applied both by direct participants—MRL and DIS manufacturers—in their own CHP units (combined heat and power generators) and by other stakeholders in the supply chain in the DIS sector.
Semantically, the R9 (recover waste for energy) strategy may be confused with efforts towards “recovering waste” through higher-level CE strategies.
RR Return and Replant. The strategy is not explicitly mentioned by the authors [47,52]. Within the examined DIS sector, it has been identified as relevant owing to the use of renewable sources and the existence of certification systems, confirming the ability to absorb the used materials by natural processes and the renewability of soil funds. What is particularly relevant is the certification of products for biodegradability and compostability, as well as the use of raw materials and materials certified according to the FSC® (Forest Stewardship Council) and PEFC™ (Programme for the Endorsement of Forest Certification) standards.
Following the qualitative part, we analysed by means of the quantitative content analysis the CEDIS.E documents sample (n = 57). We have identified the structure of the model of applied CE strategies in the DIS sector expressed through CEDIS.E. The structure is shown in Figure 4. This indicates a significant dominance of the R8 strategy (86%).
4.1.4. Circular Economy Strategies in the DIS Sector Expressed in the CR COMPANIES
By means of the quantitative content analysis of the COMPANIES documents sample (n = 41), we have determined the structure of the model of applied CE strategies in the DIS sector expressed through CR COMPANIES. The structure is shown in Figure 5.
Hypothesis 2 of our research assumes that the structure of the CE strategies in the COMPANIES sample changed in 2020 compared to 2019. Therefore, by means of the t-test, we tested Hypothesis 2 assuming that in the CR COMPANIES documents sample (n = 41), the cumulated relative frequencies of the CE strategies 2019 ≠ the cumulated relative frequencies of CE strategies 2020. This means that CE 2019 ≠ CE 2020. At df 39, at the significance level α = 0.05, t 〈−2.211; 1.079〉 and p 〈0.033; 0.909〉, we reject alternative Hypothesis 21 and accept Hypothesis 20 being that there is no difference in CE structure.
Proof of Hypothesis 20:
The CE strategy model of COMPANIES in 2020 is not different from the CE strategy model of the COMPANIES in 2019. The exception includes the R4 strategy at t = −2211 and p = 0.033. As this is an insignificant CE strategy with a representation of 1.35%, we have admitted the exception. □
On the other hand, the Hypothesis 4 test and comparison of CE COMPANIES with CE CEDIS.E using the t-test at df 96, at the significance level α = 0.05, t 〈−0.288; 10,887〉 and p < 0.002 or lower, leads to the acceptance of alternative Hypothesis 41 for strategies R0–R3, R5, R8 and R9:
Proof of Hypothesis 41:
CE COMPANIES ≠ CE CEDIS.E (for R0–R3, R5, R8 and R9 strategies). □
Only in the case of the R7 strategy t = −0.288 at p = 0.774, is Hypothesis 41 rejected and Hypothesis 40 accepted: R7 CE COMPANIES = R7 CE CEDIS.E. For the R4, R6 and RR strategies, it was not possible to test the hypothesis due to no occurrence of their indicators in CEDIS.E documents.
4.2. Relationships between BM Elements and CE Strategies
The final step of our analyses was to perform a correlation analysis of the relationships between the BM elements and selected CE strategies, applied by the COMPANIES sample and communicated via the CR. Due to the results of the analyses mentioned in Section 4.1.2 and Section 4.1.4, we focused on the R0, R2, R8 and R9 strategies. The relationship tightness was tested at the significance level α = 0.05.
The influence of CEDIS.E membership on the relationships between the BM elements and CE strategies was measured using partial correlation coefficients. The subject of our analyses consisted in a change in the tightness of the relationships between the variables, assuming the influence of the moderating variable “CONSORTIUM” (Table 4) and excluding it (Table 5). The results are shown in Table 4 and Table 5.
Inspired by [12], we have transformed the correlation coefficients obtained from Table 4 and Table 5 into absolute values |r| and categorised the tightness of the relationships between the variables according to the intensity of the tightness [57] expressed as rt:
- |r| = 〈0; 0.2〉 ∨ p > 0.05 => rt = 0 (no correlation)
- |r| = (0.20; 0.35〉 ∧ p < 0.05 => rt = 1 (weak correlation)
- |r| = (0.35; 0.6〉 ∧ p < 0.05 => rt = 2 (moderate correlation)
- |r| = (0.6; 0.8〉 ∧ p < 0.05 => rt = 3 (strong correlation)
- |r| = (0.8; 1〉 ∧ p < 0.05 => rt = 4 (very strong correlation)
The level of change in the tightness of individual relationships between the BM elements and CE strategies is expressed in |rt − rt*|. The overall level of change of each individual BM element when applying all selected CE strategies is expressed in ∑|rt − rt*|. Similarly, the change of all BM elements is expressed when applying each individual CE strategy. See Table 8.
5. Discussion and Implications
Our research proposes a novel approach toward the quantification of OM elements and their importance to OM. We were inspired by the BM innovation related research of Clauss [11], however, we applied a different data collection and evaluation method. Like Kamp et al. [75], we studied specific factors, representing both opportunities and threats. These are in our case CE strategies that affected BMD in terms of the interaction of BM elements both mutually and with external factors. We built on the work of Yeger and Shenhar [12] who both addressed the issue of measuring the change of the BM by measuring the change of its elements. To this end, we suggested a universal and relatively simple-to-apply method for quantification of the individual elements of BM in a novel way and, similar to Jindřichovská et al. [25], Bini et al. [26] and Di Tullio et al. [27], we analysed CRs, drawing on the assumptions of Attention Based View and Legitimacy theories as did Michalak et al. [24]. We specifically focused on the dynamics of open innovation through the collaboration in a consortium for CE, affecting BMs of participating companies. Our research clarifies and quantifies in a new way, how and to what extent CE related collaboration in a consortium affects BM. The research suggests a method for a quantified qualitative data-based comparison of the impact of open innovation, represented by the collaboration in a consortium for CE, on BMD. Here we see the main contribution to existing research and knowledge.
The results of our research and proofs of Hypothesis 10 and Hypothesis 20 led to the rejection of alternative Hypothesis 11 and Hypothesis 21. Despite the introduction of the European Green Deal in 2020 and the fact that cooperation in the CEDIS.E Consortium has been initiated, the communicated aggregated BM of the COMPANIES sample, expressed through the CRs, showed a comparable structure and significance of the elements both for 2020 and 2019. In addition, the same was the case with the communicated aggregated CE strategy model for both years. Here, our results indicate an alignment with finding that companies continue to focus on quantitative rather than qualitative BM related information disclosure in their reports as stated by Di Tullio et al. [27]. Our research contributes by providing a method of extraction of relevant OM and CM qualitative information from CRs and its transformation into comparable data.
However, the comparison of the mean values of the increase in communication in 2020 compared to 2019, expressed as the aggregation of occurrences of all identified indicators as applied by Di Tullio et al. [76] (Table 9), indicates a higher intensity of communication: in the case of the BM (All BM) and in the case of CE (All CE) strategies, by 23%, and in the case of network cooperation (Consortium) by 33%, when comparing the means for both years.
The examined sample of companies paid more attention, in absolute terms, to the BM, CE and network cooperation in 2020 in their CR than in 2019. However, the relative focus of attention on the individual BM elements, as well as individual CE strategies, remained unchanged for both years. The BM element HOW1 plays a key role, with a share of 36% in the overall BM. The finding does not come as a complete surprise due to the examined manufacturing and processing industry and the presence of B2B incumbents focused on the production and processing of physical products.
On the other hand, the comparison of both COMPANIES and CEDIS.E sample groups, by means of the analysis of the available documents, leads to the conclusion that cooperation in the consortium results in a different BM structure and a different focus on the CE strategies of the two examined sample groups. Here our research completes the findings of Brown et al. [16,17] who see the cooperation among companies as being a key contributor to the proliferation of CE into BMs.
The dominant BM element in the case of a CEDIS.E sample remains, similar to COMPANIES, with the HOW1 element at 42%. However, the HOW2 and VCO elements have a greater importance. This proves the finding of Krmela [22], making the element of communication, the VCO, an essential part of BM oriented on CE. Both elements are considered relevant to the implementation of CEDIS.E preferred CE strategies, R6, R7 and R8. The preference of the R8 strategy by CEDIS.E (respectively, the set of R6–R8 strategies due to semantics) has been demonstrated in both qualitative and quantitative parts of the research. As such, it may be stated that Hypothesis 31 and Hypothesis 41 have been accepted: the communicated BM and the communicated CE strategies of the COMPANIES sample show a different structure than for the CEDIS.E sample.
At the same time, the results of the conducted correlation analyses indicate the extent of the impact of cooperation in the consortium on the BMD of the examined sample group of enterprises, expressed as a change in the tightness of the relationship between the BM elements and the selected CE strategies. The level of change in individual relationships between the BM elements and CE strategies is expressed through transformed correlation coefficients by the relationship |rt − rt*|. The overall level of change of each individual BM element when applying all selected CE strategies in parallel is expressed in ∑|rt − rt*|.
Out of 24 examined relationships (six BM elements times four selected CE strategies), 13 show a non-zero result of the relationship change when excluding the effect of the moderating variable (CONSORTIUM). Thus, it may be assumed that cooperation in the consortium leads to a change in the examined relationships between BM elements, thus causing BMD and leading to it. The VCO, HOW1 and WHAT elements show the highest extent of the relationship change, considering the implementation of all CE strategies (∑|rt − rt*| = 4). Thus, we concluded that these are the elements most related to the BMD.
The R0 strategy shows the highest change rate of all elements at the same time (∑|rt – rt*| = 7), followed by the R2 strategy (∑|rt − rt*| = 4) and R8 (∑|rt − rt*| = 1). Conversely, when the R9 strategy is applied, there is no change to the BM elements or to the overall BM (∑|rt − rt*| = 0). Here, our research completes and confirms the hypotheses expressed by Potting et al. [7], stating that higher level CE strategies require a more substantial adaptation of BM. In other words, the higher the measured BMD, the higher the level of adaptation of BM.
If we consider changes in all BM elements when implementing all CE strategies in parallel, with the effect of the moderating variable CONSORTIUM, we obtain the value of the aggregated BM change ∑|rt − rt*| = 12 (also see Table 8). Thus, collaboration in a consortium leads to substantial BMD. Yun [62] recommends that large enterprises focus on partnerships, to foster the dynamics of open innovation. Our research consequently suggests how the collaboration of companies in a consortium potentially changes the sectoral BM from linear to circular, thereby contributing to conquer the growth limits of capitalism, pertinent to traditional closed innovation by an individual company.
The analyses carried out provide the answer to our research question:
RQ: How do the individual companies’ and industries’ BMs dynamically adapt as the companies collaborate in the consortia for circular economy?
Response to the RQ: Cooperation in the network of enterprises, provided through the CEDIS/CEDIS.E consortium, leads to a change in the tightness of the relationships between the different BM elements and the selected CE strategies. This results in the dynamics of the BM and its elements, the intensity of which varies according to the selected CE strategy. The strongest influence was found for the VCO, HOW1 and WHAT elements. The R0 strategy is the CE strategy with the strongest impact on the BM’s elements.
Thus, our research results both qualitatively and quantitatively confirm the assumptions of Potting et al. [7] proving that higher level CE strategies—R0 in our case—mean a higher-level complexity of adaptation of BM, i.e., a higher level of BMD. In an extreme case of BMD, the BM adaptation can turn into BM innovation [42]. We align with the research of Yun et al. [63] who distinguish a mature market, represented by incumbent firms, in which participating companies tend to adopt open innovation, in our case through collaboration in the consortium. The R8 strategy is characteristic for mature products sold in mature markets. Contrarily, strategies R0 and R2 are characteristic for the early stages of the introduction of highly innovative products, which are more characterised by closed innovation, as stated by Yun et al. [63].
6. Conclusions, Research Limitations and Further Research
There has been no doubt about the relevance and up-to-date nature of the topic of adaptation of the BM of established B2B enterprises in conjunction with the implementation of measures aimed at reducing or eliminating unsustainability through the CE implementation. Expert sources indicate a growing interest in associating the issue of the BM and CE adaptation, yet at the same time confirm the continuing diversity of understanding, perspectives, approaches and, in part, terminology [5,45].
Businesses in the analysed European DIS sector aim to adapt their BMs by implementing CE strategies. One of the key objectives is to reduce the share of unused waste generated by the sector. A more open way of innovation of BM and cooperation through the CEDIS.E Consortium is intended to facilitate achieving this objective, in particular by means of jointly implemented CE strategies, with the focus on the R6, R7 and R8 strategies.
Through the consortium, the participating companies were expected to jointly develop new capabilities, including the ability to collaborate differently than in a typical linear economy. A more open and innovative way of cooperation among them in a consortium, while staying strictly within the frame of anti-trust laws, was established. The main aim of the consortium is to support increased circularity of the DIS sector’s main waste, called MRL. The companies needed to re-define the key elements of their BMs, with the value proposition, value creation, value delivery, value capture and value communication of the industries’ BMs differing and, as such, they had to be ready to share the value with a wider and partially different group of stakeholders. Also, a new way of involving the B2B customers into the CE related efforts was perceived as crucial and their awareness about the CE oriented BM needed to be increased. As a result, the elements of BMs in the industry dynamically evolved towards an adapted BM for a CE. Our results indicate that this more open way of cooperation in the consortium unambiguously facilitates the dynamic adaptation of the BM [59], especially towards a CE [77]. More than half (13/24) of the relationships between the BM elements and CE strategies strengthen due to the moderating effect of the consortium. This proves that cooperation in such a consortium supports the change toward BM for a CE. Another finding consists of confirming the assumption that higher-level CE strategies lead to a higher level of BDM, expressed as ∑|rt − rt*| for each CE strategy, as stated by Potting et al. [7].
One of the objectives of our research was to contribute to developing the theory in the field of BMD. For this reason, we have opted for the mix research strategy. We used case studies and focused on the selected DIS sector. This allowed us to take a more comprehensive approach and examine the issues being studied deeply and in context. The combination of qualitative and quantitative strategy supported the triangulation of the findings and a validation of the conclusions. The topic of BMD is and remains of high complexity and of a wicked nature, especially if linked with CE strategies. Every raw material, feedstock, every product, and every industry are individual, characterised by their specifics, impacting the BMD differently. Therefore, the BMD in one industry might be different to the BMD in another industry, even if the same CE strategy is implemented. Fully reliable, verifiable quantitative data pertinent to the transition to BMs for a CE are still rare. They are supposed to be disclosed in CRs [27], but many are frequently confidential, potentially not unambiguously separable from linear BMs pertinent data, apart from a threat of their misinterpretations or manipulations. However, our research bypasses this shortcoming by suggesting a simple-to-apply analytical method for the determination of the composition of BM, as well as the implemented CE strategies. This makes them explicit and thus minimizes the problem of lack of their precision [78].
Our research and its results are, however, affected by the selected methodology. Ruling out limitations is very hard due to potential duplicates in quantitative evaluation of verbal indicator occurrences, where, for example, two defined indicators relate to a single topic. A semantic of various expressions pertinent to BM and a CE needs to be considered, too. The applied methodology of examining the BM, CE and BMD is universally applicable and transferable, considering the specific terminology of the examined sector and the need to adapt the set of verbal semantic indicators created and used by us. Given the reporting requirements of the EU [79], researchers, practitioners, as well as managers, can benefit from applying our method. Thus, they can compare their own data with the data of their peers or even with the data of other industries. Naturally, this has to assume the availability of CRs, or at least other comparable means of stakeholder communication.
Although we are convinced that correlation analysis is a suitable tool for our research, we are aware of its weaknesses. In particular, the possibility of the existence of a hidden moderating variable. In our case, we chose the variable network cooperation as a moderating variable for comparing before–after. However, we acknowledge the possibility of the existence of other variables, which potentially influence the strength of the relationships between BM elements with each other, and with CE strategies. Accordingly, we believe that our research will inspire other researchers applying other statistical methods. This is especially the case since, with the increasing number of reliable and comparable quantitative data published in the CRs, it will be possible to use BM and CE indicators of a more quantitative nature instead of quantified qualitative verbal semantic indicators in the future. This applies both in terms of comparing their evolution in a time series and in terms of comparing them across businesses and sectors.
Author Contributions
Conceptualization, A.K. and I.Š.; methodology, A.K.; software, A.K.; validation, A.K., I.Š. and V.B.; formal analysis, A.K.; investigation, A.K.; resources, A.K. and I.Š.; data curation, A.K.; writing—original draft preparation, A.K.; writing—review and editing, A.K., I.Š. and V.B; visualization, A.K.; supervision, I.Š.; project administration, A.K.; funding acquisition, I.Š. All authors have read and agreed to the published version of the manuscript.
Funding
This paper was created with the financial support of Brno University of Technology, Faculty of Business and Management. Supported by project FP–S-20–6355: Koncepce řízení a rozvoje podniku v prostředí multioborových hodnotových sítí (The concept of management and development of the company in the environment of multidisciplinary value networks).
Institutional Review Board Statement
Not applicable.
Informed Consent Statement
Not applicable.
Data Availability Statement
Not applicable.
Acknowledgments
The authors would also like to thank both the two anonymous reviewers of this manuscript as well as the proof reader for their dutiful, detailed, and helpful reviews that contributed to the improvement of the paper.
Conflicts of Interest
The authors declare no conflict of interest. The funders had no role in the design of the study; in the collection, analyses, or interpretation of data; in drafting the manuscript, or in the decision to publish the results. The analyses carried out are based on available sources. The research conclusions reflect the research and analytical methods used and are the result of deductive–inductive procedures applied. They cannot be interpreted as the official opinion of the examined DIS industry.
Appendix A
Set of verbal semantic indicators (roots) of variables “BM elements”. Total: 64 indicators.
WHO: customer, customer relationship, market, positioning, presence, segment
HOW1: alliance, capability, collaborat, competenc, cooperat, creat, equip, information, manufactur, material, network, organisation, organization, partner, people, resource, service, supplier, supply chain, technolog, value chain
HOW2: connect, deliver, distribution, channel, logistic
VCO: award, awareness, certif, certificate, communicat, conversation, dialogue, educat, engage, influenc, marketing, promot, publicit
WHAT: product, brand, design, offer, output, service, solution, value proposition
WHY: captur, costs, financial, margin, monetiz, pric, profit, revenue, revenue model, revenue stream
Remark: used as words’ roots and lemmatized in English language
Analytical software: MAXQDA 2020 Analytics Pro
Appendix B
Set of verbal semantic indicators (roots) of variables “CE strategy”. Total: 74 indicators.
CIRCULAR: anti-litter, circular, closed loop, closing loop, collect, design out waste, loop, reverse logistic, sludge, take back, wast
R0: alternative, avoid, eliminat, flexible packaging, linerless, mono-material, prevent, refus, remov, replac, shrink sleeve, wet-glue, wraparound
R1: extended life, lifecycle, lifespan, multi-layer, multius, reclos, redesign, rethink, RFID
R2: decrease waste, downgauge, less, less energy, less water, lighter, lightweight, optimiz, thinner
R3: re-sell, re-us, re-use, resale, resell, reus
R4: recreat, refit, repair, reproduce, revital
R5: redesign, refurbish, renovat, retrofit
R6: recondition, remanufacture, restor
R7: repurpos
R8: high grade, low grade, recycle, recycled content, reprocess
R9: energy recovery, incinerat, reclaim, recover
RR: biodegrade, compost, degrad, return
Remark: used as words’ roots and lemmatized in English language
Analytical software: MAXQDA 2020 Analytics Pro
Appendix C
Set of verbal semantic indicators (roots) of the variable “network cooperation”. Total: 14 indicators.
CONSORTIUM: consort, coalit, association
Furthermore, 11 specific terms (e.g., service provider names, etc.) were used for the DIS sector, which cannot be mentioned in this paper due to anonymisation and confidentiality.
Source: Empiric research (case studies)
Remark: used as words’ roots and lemmatized in English language
Analytical software: MAXQDA 2020 Analytics Pro
Appendix D
| Abbreviation | Meaning | Remark |
| 3P | Triple-bottom-line approach | People, Planet, Profit |
| B2B | Business-to-business | |
| B2C | Business-to-consumer | |
| B2G | Business-to-government | |
| BM | Business model | |
| BMD | Dynamics of the business model | |
| CE | Circular Economy | |
| CEDIS | Circular Economy for Decorative and Information Systems (Global) | Consortium (Global) |
| CEDIS.E. | Circular Economy for Decorative and Information Systems (European leg) | Consortium (Europe), consisting of 26 companies |
| COMPANIES | Set of 18 analysed companies | Suppliers to DIS industry |
| CR | Company Reports | Annual, Sustainability, Integrated or Strategic reports |
| CSR | Corporate Social Responsibility | |
| DIS | Decorative and Information Systems | Subject product |
| FA | Focus Area of CEDIS.E | Working groups |
| MRL | Polymeric DIS component | Waste, subject of CE in DIS |
| HOW1 | Value creation | BM element |
| HOW2 | Value delivery | BM element |
| R (0-9) | Strategies of CE | Derived from the 9R model |
| RQ | Research question | |
| RR | Return and Replant | A specific CE strategy |
| VCO | Value communication | BM element |
| WHAT | Value proposition | BM element |
| WHO | The customer | BM element |
| WHY | Value capture | BM element |
References
- The Paris Agreement. Available online: https://unfccc.int/process-and-meetings/the-paris-agreement/the-paris-agreement (accessed on 1 May 2021).
- A European Green Deal. Available online: https://ec.europa.eu/info/strategy/priorities-2019-2024/european-green-deal_en (accessed on 1 May 2021).
- Elkington, J. Accounting for the triple bottom line. Meas. Bus. Excell. 1998, 2, 18–22. [Google Scholar] [CrossRef]
- De Angelis, R. Circular Economy and Paradox Theory. A Business Model Perspective. J. Clean. Prod. 2021, 285, 124823. [Google Scholar] [CrossRef]
- Salvador, R.; Barros, M.V.; Mendes da Luz, L.; Piekarski, C.M.; De Francisco, A.C. Circular Business Models: Current aspects that influence implementation and unaddressed subjects. J. Clean. Prod. 2019, 250, 119555. [Google Scholar] [CrossRef]
- Sterev, N. New Industrial Business Models: From Linear to Circular Economy Approach. Trakia J. Sci. 2019, 17 (Suppl. S1), 511–523. [Google Scholar] [CrossRef]
- Potting, J.; Hekkert, M.; Worrell, E.; Hanemaaijer, A. Circular Economy: Measuring Innovation in Product Chains; PBL Netherlands Environmental Assessment Agency: The Hague, The Netherlands, 2016. [Google Scholar]
- Abdelkafi, N.; Täuscher, K. Business Models for Sustainability from a System Dynamics Perspective. Organ. Environ. 2016, 29, 74–96. [Google Scholar] [CrossRef]
- Cosenz, F.; Noto, G. A dynamic business modelling approach to design and experiment new business venture strategies. Long Range Plan. 2018, 51, 127–140. [Google Scholar] [CrossRef]
- Cosenz, F.; Bivona, E. Fostering growth patterns of SMEs through business model innovation. A tailored dynamic business modelling approach. J. Bus. Res. 2021, 130, 658–669. [Google Scholar] [CrossRef]
- Clauss, T. Measuring Business Model Innovation: Conceptualization, Scale Development, and Proof of Performance. RD Manag. 2017, 47, 385–403. [Google Scholar] [CrossRef]
- Yeger, D.; Shenhar, A. A Unified Framework for Classification of Business Model Transformations of Established Firms. J. Bus. Models 2019, 7, 73–78. [Google Scholar]
- Gay, B. Open Innovation, Networking, and Business Model Dynamics: The Two Sides. J. Innov. Entrep. 2014, 3, 2. [Google Scholar] [CrossRef] [Green Version]
- Ciechan-Kujawa, M.; Buszko, M. Complexity of Changes in the Business Model: An Empirical Research. Eur. Res. Stud. J. 2020, XXIII, 5–17. [Google Scholar] [CrossRef]
- Shi, Y.; Lu, C.; Hou, H.; Zhen, L.; Hu, J. Linking Business Ecosystem and Natural Ecosystem Together—A Sustainable Pathway for Future Industrialization. J. Open Innov. Technol. Mark. Complex. 2021, 7, 38. [Google Scholar] [CrossRef]
- Brown, P.; Bocken, N.; Balkenende, R. Why do Companies Pursue Collaborative Circular Oriented Innovation? Sustainability 2019, 11, 635. [Google Scholar] [CrossRef] [Green Version]
- Brown, P.; Bocken, N.; Balkenende, R. How Do Companies Collaborate for Circular Oriented Innovation? Sustainability 2020, 12, 1648. [Google Scholar] [CrossRef] [Green Version]
- Yun, J.J.; Xiaofei, Z. Business Model Innovation through a Rectangular Compass: From the Perspective of Open Innovation with Mechanism Design. J. Open Innov. Technol. Mark. Complex. 2020, 6, 131. [Google Scholar] [CrossRef]
- Shum, K.; Kodama, F.; Shibata, T. Towards a Longitudinal Outlook on Industry Transition Management. J. Open Innov. Technol. Mark. Complex. 2020, 6, 79. [Google Scholar] [CrossRef]
- Choi, P.K. A Need for Co-Evolution between Technological Innovations and Social Innovations. J. Open Innov. Technol. Mark. Complex. 2020, 6, 54. [Google Scholar] [CrossRef]
- Rosha, A.; Lace, N. The Scope of Coaching in the Context of Organizational Change. J. Open Innov. Technol. Mark. Complex. 2016, 2, 2. [Google Scholar] [CrossRef] [Green Version]
- Krmela, A. Value Communication in Dynamic Business Models for Circular Economy Network Collaboration. In DOKBAT Conference Proceedings, Proceedings of the16th Annual International Bata Conference for Ph.D. Students and Young Researchers. Tomas Bata University, Zlín, Czech Republic, 2–3 September 2020; Ondra, P., Ed.; Faculty of Management and Economics: Zlín, Czech Republic, 2020; pp. 281–294. [Google Scholar] [CrossRef]
- Chamberlin, L.; Boks, C. Marketing Approaches for a Circular Economy: Using Design Frameworks to Interpret Online Communications. Sustainability 2018, 10, 2070. [Google Scholar] [CrossRef] [Green Version]
- Michalak, J.; Rimmel, G.; Beusch, P.; Jonäll, K. Business Model Disclosures in Corporate Reports. J. Bus. Models 2017, 5, 51–73. [Google Scholar]
- Jindřichovská, I.; Kubíčková, D.; Mocanu, M. Case Study Analysis of Sustainability Reporting of an Agri-Food Giant. Sustainability 2020, 12, 4491. [Google Scholar] [CrossRef]
- Bini, L.; Dainelli, F.; Giunta, F. Business Model Disclosure in the Strategic Report. Entangling Intellectual Capital in the Value Creation Process. J. Intellect. Cap. 2016, 17, 83–102. [Google Scholar] [CrossRef]
- Di Tullio, P.; La Torre, M.; Dumay, J.; Rea, M.A. Accountingisation and the narrative (re)turn of business model information in corporate reporting. J. Account. Organ. Chang. 2021, 1–24. [Google Scholar] [CrossRef]
- Gassmann, O.; Frankenberger, K.; Sauer, R. Exploring the Field of Business Model Innovation. New Theoretical Perspectives; Palgrave Macmillan: St. Gallen, Switzerland, 2016; pp. 1–118. [Google Scholar]
- Ocasio, W. Towards an Attention-based View of the Firm. Strateg. Manag. J. 1997, 18, 187–207. [Google Scholar] [CrossRef]
- Cho, T.S.; Hambrick, D.C. Attention as the Mediator between Top Management Team Characteristics and Strategic Change: The Case of Airline Deregulation. Organ. Sci. 2006, 17, 453–469. [Google Scholar] [CrossRef]
- Ocasio, W. Attention to Attention. Organ. Sci. 2011, 22, 1286–1296. [Google Scholar] [CrossRef] [Green Version]
- Ibarra, D.; Bigdeli, A.Z.; Igartua, J.I.; Ganzarain, J. Business Model Innovation in Established SMEs: A Configurational Approach. J. Open Innov. Technol. Mark. Complex. 2020, 6, 76. [Google Scholar] [CrossRef]
- Krumeich, J.; Werth, D.; Loos, P. Business Model Dynamics—Towards a Dynamic Framework of Business Model Components. In Pre-ICIS 2010–2012, LNBIP 198; Sedera, D., Ed.; Springer International Publishing: Cham, Switzerland, 2015; pp. 190–215. [Google Scholar]
- Šimberová, I.; Kita, P. New Business Models Based on Multiple Value Creation for the Customer: A Case Study in the Chemical Industry. Sustainability 2020, 12, 3932. [Google Scholar] [CrossRef]
- Osterwalder, A.; Pigneur, Y. Business Model Generation; Wiley: Hoboken, NJ, USA, 2010; pp. 1–282. [Google Scholar]
- Jin, C.; Linghui, H.; Guannan, Q. Citizen Innovation: Exploring the Responsibility Governance and Cooperative Mode of a “Post-Schumpeter” Paradigm. J. Open Innov. Technol. Mark. Complex. 2020, 6, 172. [Google Scholar] [CrossRef]
- Bieger, T.; Reinhold, S. Das wertbasierte Geschäftsmodell—Ein aktualisierter Strukturierungsansatz. In Innovative Geschäftsmodelle; Bieger, T., Zu Knyphausen-Aufsess, D., Krys, C., Eds.; Springer: Berlin/Heidelberg, Germany, 2011; pp. 13–70. [Google Scholar]
- Saebi, T.; Lien, L.; Foss, N.J. What Drives Business Model Adaptation? The Impact of Opportunities, Threats and Strategic Orientation. Long Range Plan. 2017, 50, 567–581. [Google Scholar] [CrossRef] [Green Version]
- Demil, B.; Lecocq, X. Business Model Evolution: In Search of Dynamic Consistency. Long Range Plan. 2010, 43, 227–246. [Google Scholar] [CrossRef]
- Gassmann, O.; Frankenberger, K.; Csik, M. The Business Model Navigator. 55 Models That Will Revolutionize Your Business; Pearson Education Limited: Harlow, UK, 2014; pp. 1–400. [Google Scholar]
- Khodaei, H.; Ortt, R. Capturing Dynamics in Business Model Framework. J. Open Innov. Technol. Mark. Complex. 2019, 5, 8. [Google Scholar] [CrossRef] [Green Version]
- Wirtz, B. Business Model Management, Design, Process, Instruments, 2nd ed.; German University of Administrative Sciences: Speyer, Germany, 2016; pp. 1–351. [Google Scholar]
- Krmela, A. Dynamika Obchodního Modelu versus Dynamický Obchodní Model [Business Model Dynamics versus Dynamic Business Model]. Grant J. 2020, 9, 36–40. [Google Scholar]
- Peters, F.; van Kleef, E.; Snijders, R.; van den Elst, J. The Interrelation between business model components—Key partners contributing to a media concept. J. Media Bus. Stud. 2013, 10, 1–22. [Google Scholar] [CrossRef]
- Schaffer, N.; Pfaff, M.; Krcmar, H. Dynamic Business Models: A Comprehensive Classification of Literature. In Proceedings of the Thirteenth Mediterranean Conference on Information Systems (MCIS 2019), Naples, Italy, 27–28 September 2019. [Google Scholar]
- Cavalcante, S.A.; Kesting, P.; Ulhøi, J.P. Business Model Dynamics: The Central Role of Individual Agency. Acad. Manag. Proc. 2010, 1, 1–6. [Google Scholar] [CrossRef]
- Cavalcante, S.; Kesting, P.; Ulhøi, J. Business Model Dynamics and innovation: (re) Establishing the missing linkages. Manag. Decis. 2011, 49, 1327–1342. [Google Scholar] [CrossRef] [Green Version]
- Dai, J.; Shen, L.; Zheng, W. Business-Model Dynamics: A case study of Tencent. In Proceedings of the 2011 IEEE 18th International Conference on Industrial Engineering and Engineering Management, Changchun, China, 3–5 September 2011. [Google Scholar]
- Ning, Y.; Fu, H.; Zheng, W. Business Model Dynamics: A case study of Apple Inc. In Proceedings of the 2011 IEEE 18th International Conference on Industrial Engineering and Engineering Management, Changchun, China, 3–5 September 2011. [Google Scholar]
- Teece, D.J. Business Models and Dynamic Capabilities. Long Range Plan. 2018, 51, 40–49. [Google Scholar] [CrossRef]
- Geissdoerfer, M.; Savaget, P.; Bocken, N.M.P.; Hultink, E.J. The Circular Economy—A new sustainability paradigm? J. Clean. Prod. 2017, 143, 757–768. [Google Scholar] [CrossRef] [Green Version]
- Kirchherr, J.; Reike, D.; Hekkert, M. Conceptualizing the Circular Economy: An Analysis of 114 Definitions. Resour. Conserv. Recycl. 2017, 127, 221–232. [Google Scholar] [CrossRef]
- RLI. Circular Economy. From Wish to Practice; RLI Council for the Environment and Infrastructure: Den Haag, The Netherlands, 2015. [Google Scholar]
- Yang, M.; Evans, S. Product-service System Business Model Archetypes and Sustainability. J. Clean. Prod. 2019, 220, 1156–1166. [Google Scholar] [CrossRef]
- EUR-Lex. Available online: https://eur-lex.europa.eu/legal-content/EN/TXT/?uri=celex%3A32008L0098 (accessed on 1 May 2021).
- EUR-Lex. Available online: https://eur-lex.europa.eu/legal-content/EN/TXT/?uri=CELEX%3A32018L0851 (accessed on 1 May 2021).
- Reike, D.; Vermeulen, W.J.V.; Witjes, S. The Circular Economy: New or Refurbished as CE 3.0?—Exploring Controversies in the Conceptualization of the Circular Economy through a Focus on History and Resource Value Retention Options. Resour. Conserv. Recycl. 2017, 135, 246–264. [Google Scholar] [CrossRef]
- Jesus, G.M.K.; Jugend, D. How can open innovation contribute to circular economy adoption? Insights from a literature review. Eur. J. Innov. Manag. 2021. in-print. [Google Scholar] [CrossRef]
- Pichlak, M.; Szrome, A.R. Eco-innovation, Sustainability and Business Model Innovation by Open Innovation Dynamics. J. Open Innov. Technol. Mark. Complex. 2021, 7, 149. [Google Scholar] [CrossRef]
- Yun, J.J.; Zhao, X.; Wu, J.; Yi, J.C.; Park, K.; Jung, W. Business Model, Open Innovation, and Sustainability in Car Sharing Industry—Comparing Three Economies. Sustainability 2020, 12, 1883. [Google Scholar] [CrossRef] [Green Version]
- Yun, J.J. Business Model Design Compass. Open Innovation Funnel to Schumpeterian New Combination Business Model Developing Circle; Springer Nature: Singapore, 2017; pp. 1–232. [Google Scholar]
- Yun, J.J. How do we conquer the growth limits of capitalism? Schumpeterian Dynamics of Open Innovation. J. Open Innov. Technol. Mark. Complex. 2015, 1, 17. [Google Scholar] [CrossRef] [Green Version]
- Yun, J.J.; Won, D.; Park, K. Dynamics from open innovation to evolutionary change. J. Open Innov. Technol. Mark. Complex. 2016, 2, 7. [Google Scholar] [CrossRef] [Green Version]
- Tashakkori, A.; Teddlie, C. Mixed Methodology. Combining Qualitative and Quantitative Approaches; Sage: Thousand Oaks, CA, USA, 1998; pp. 1–185. [Google Scholar]
- Lüdeke-Freund, F.; Gold, S.; Bocken, N.M.P. A review and typology of circular economy business model patterns. J. Ind. Ecol. 2018, 23, 36–61. [Google Scholar] [CrossRef] [Green Version]
- Salvador, R.; Puglieri, R.F.N.; Halog, A.; de Andrade, F.G.; Piekarski, C.M.; de Francisco, A.C. Key aspects for designing business models for a circular bioeconomy. J. Clean. Prod. 2021, 278, 124341. [Google Scholar] [CrossRef]
- CEPE. Glossary of Sustainability Related Terms. Available online: https://www.cepe.org/wp-content/uploads//2020/05/2017-05-05-CEPE-draft-glossary-of-sustainability-related-terms-rev-2017-1.pdf (accessed on 26 May 2021).
- Sustainable Labelling Solutions. Labels + Packaging Innovations Guide Europe 2020. Available online: https://label.averydennison.com/content/dam/averydennison/lpm-responsive/europe/english/documents/product-overviews/product/sustainable-solutions/lpm-eu-innovation-guide-sustainable-labelling-web-edited.pdf (accessed on 7 July 2021).
- Urbinati, A.; Franzo, S.; Chiaroni, D. Enablers and Barriers for Circular Business Models: An Empirical Analysis in the Italian Automotive Industry. Sustain. Prod. Consum. 2021, 27, 551–566. [Google Scholar] [CrossRef]
- Hendl, J. Kvalitativní výzkum. Základní Teorie, Metody a Aplikace, 4th ed.; Portál: Prague, Czech Republic, 2016; pp. 1–440. [Google Scholar]
- Yin, R.K. Case Study Research and Applications. Design and Methods, 6th ed.; Sage: Los Angeles, CA, USA, 2018; pp. xiii–320. [Google Scholar]
- Saunders, M.; Lewis, P.; Thornhill, A. Research Methods for Business Students, 7th ed.; Pearson: Harlow, UK, 2016; pp. I–742. [Google Scholar]
- Maxwell, J.A. Qualitative Research Design. An Interactive Approach, 2nd ed.; Sage: Thousand Oaks, CA, USA, 2005; pp. ix–176. [Google Scholar]
- Hendl, J. Přehled Statistických Metod. Analýza a Metaanalýza Dat, 5th ed.; Portál: Prague, Czech Republic, 2015; pp. 1–736. [Google Scholar]
- Kamp, L.M.; Meslin, T.A.J.; Khodaei, H.; Ortt, J.R. The Dynamic Business Model Framework—Illustrated with Renewable Energy Company Cases from Indonesia. J. Open Innov. Technol. Mark. Complex. 2021, 7, 231. [Google Scholar] [CrossRef]
- Di Tullio, P.; La Torre, M.; Valentinetti, D.; Rea, M.A. Toward Performance Measurement Systems Based on Business Models. Manag. Control 2021, 1, 97–122. [Google Scholar] [CrossRef]
- Martina, R.A.; Oskam, I.F. Practical guidelines for designing recycling, collaborative, and scalable business models: A case study of reusing textile fibers into biocomposite products. J. Clean. Prod. 2021, 318, 128542. [Google Scholar] [CrossRef]
- Romero, M.C.; Lara, P.; Villalobos, J. Evolution of the Business Model: Arriving at Open Business Model Dynamics. J. Open Innov. Technol. Mark. Complex. 2021, 7, 86. [Google Scholar] [CrossRef]
- EU. Directive 2014/95/EU of the European Parliament and the Council of 22 October 2014. Available online: https://eur-lex.europa.eu/legal-content/EN/TXT/PDF/?uri=CELEX:32014L0095&from=CS (accessed on 1 November 2021).
Figure 2.
BM CEDIS.E in 2020. Own depiction as per CEDIS.E (n = 57).

Figure 3.
BM COMPANIES in 2019–2020. Own depiction per COMPANIES CR (n = 41).

Figure 4.
CE strategies of CEDIS.E in 2020. Own depiction per CEDIS.E (n = 57).

Figure 5.
CE strategies of the COMPANIES sample in 2019–2020. Own depiction per CR COMPANIES (n = 41).
Figure 5.
CE strategies of the COMPANIES sample in 2019–2020. Own depiction per CR COMPANIES (n = 41).


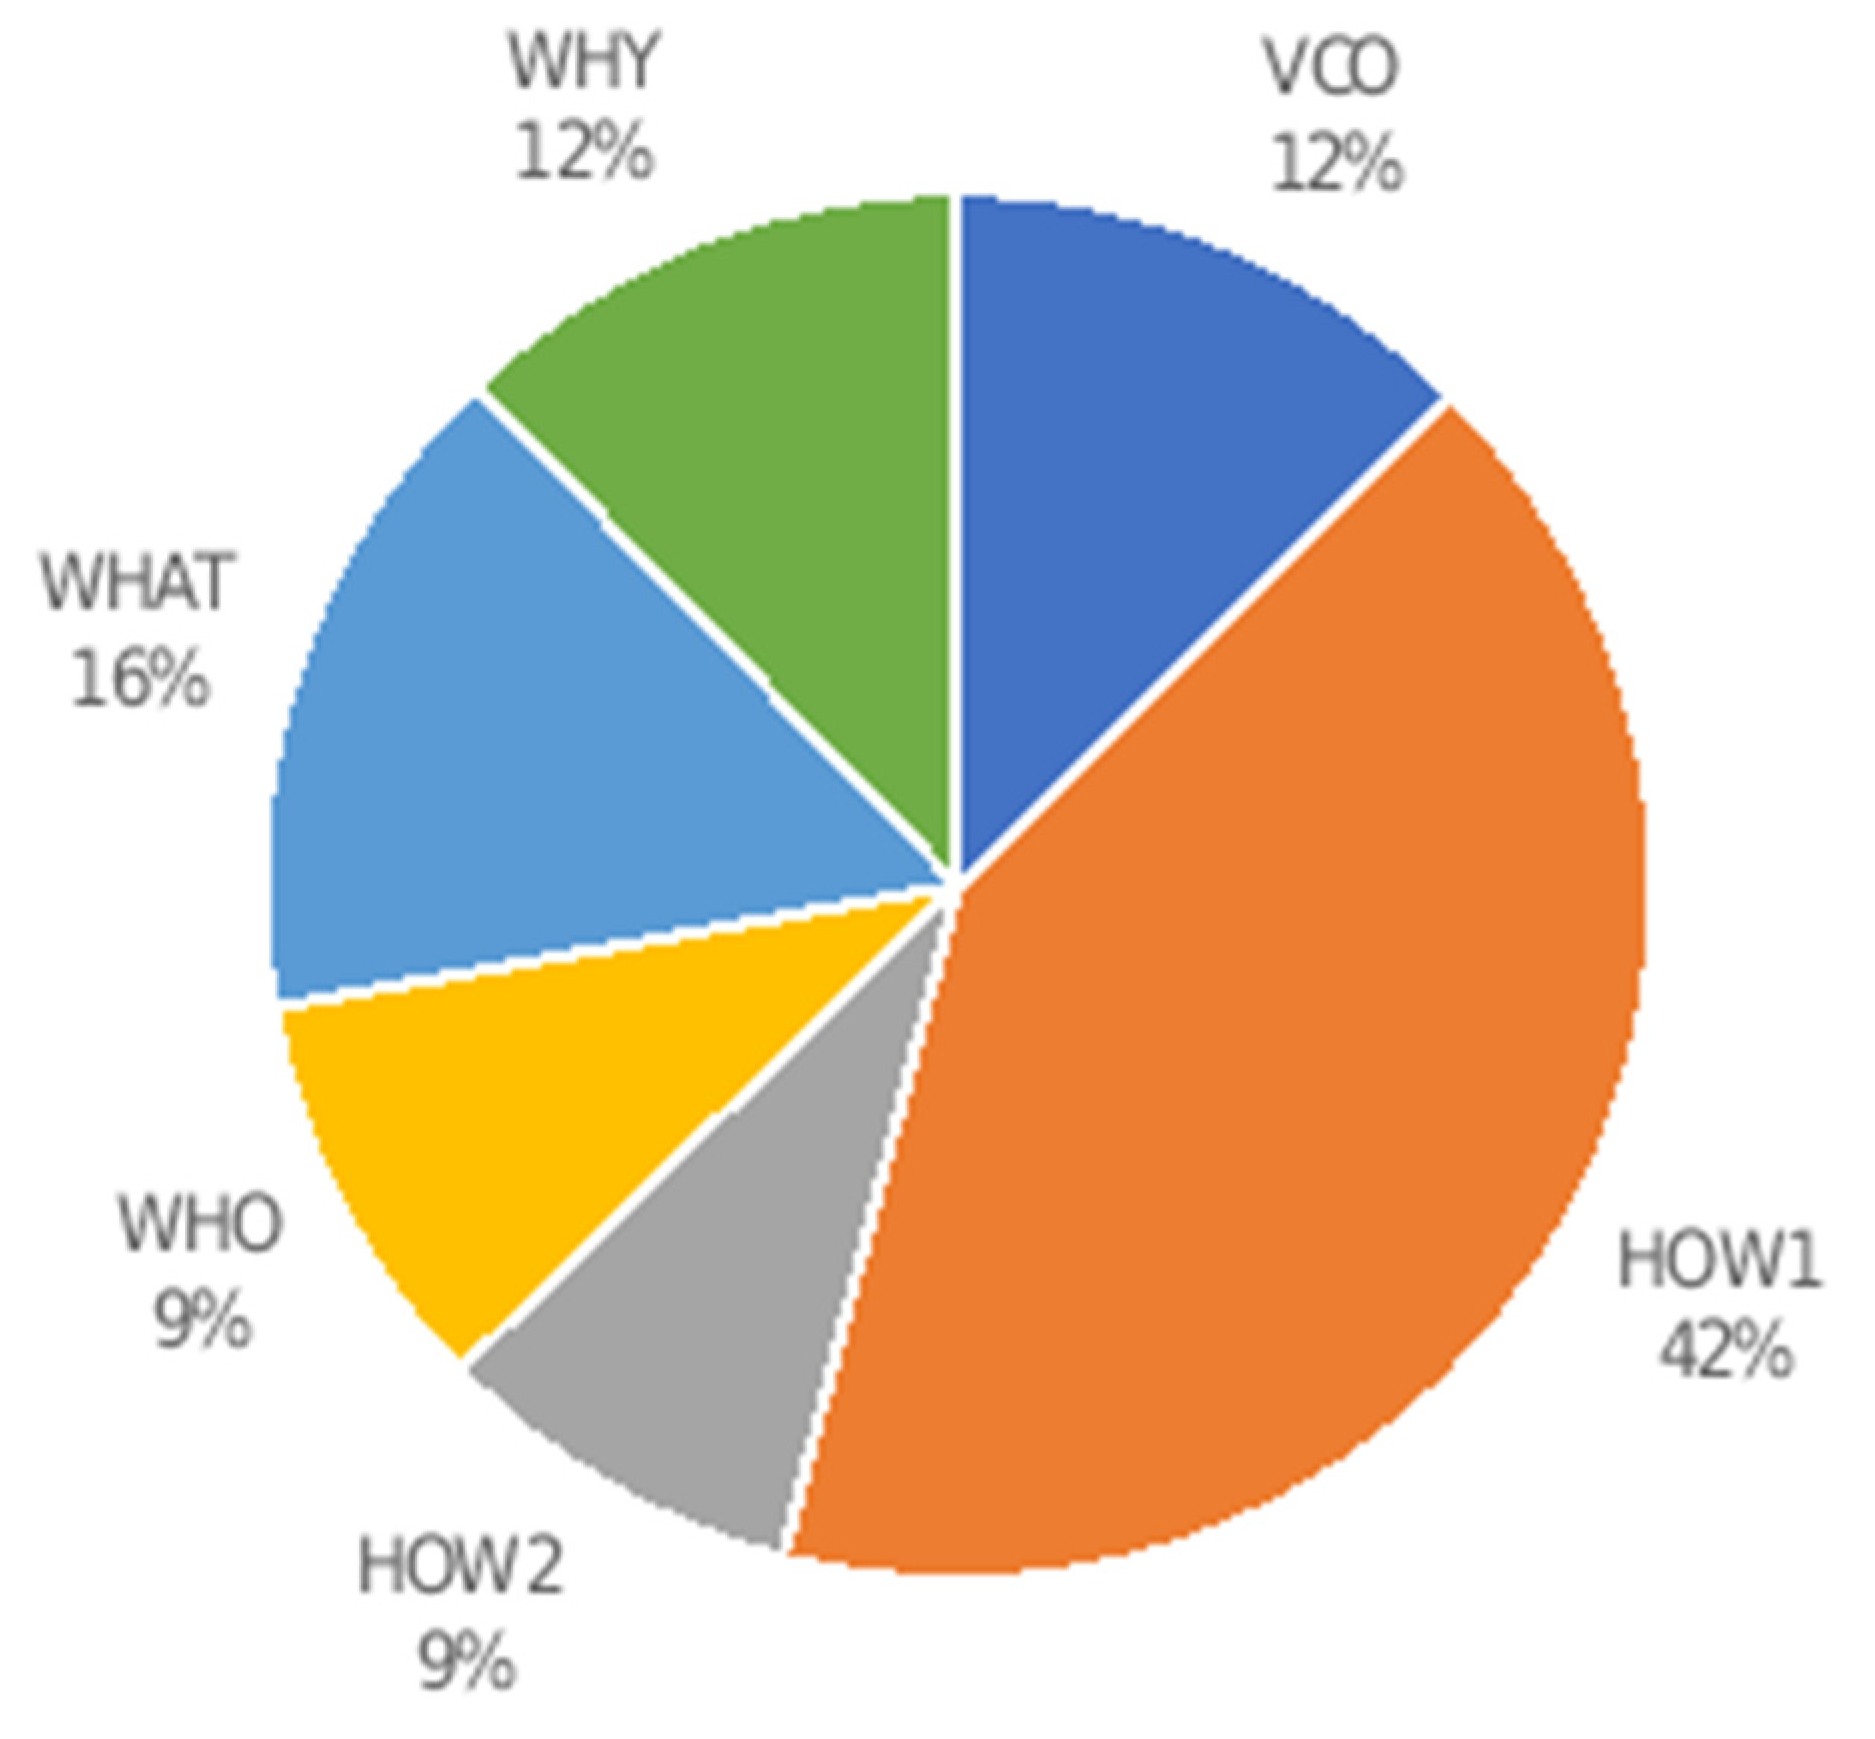
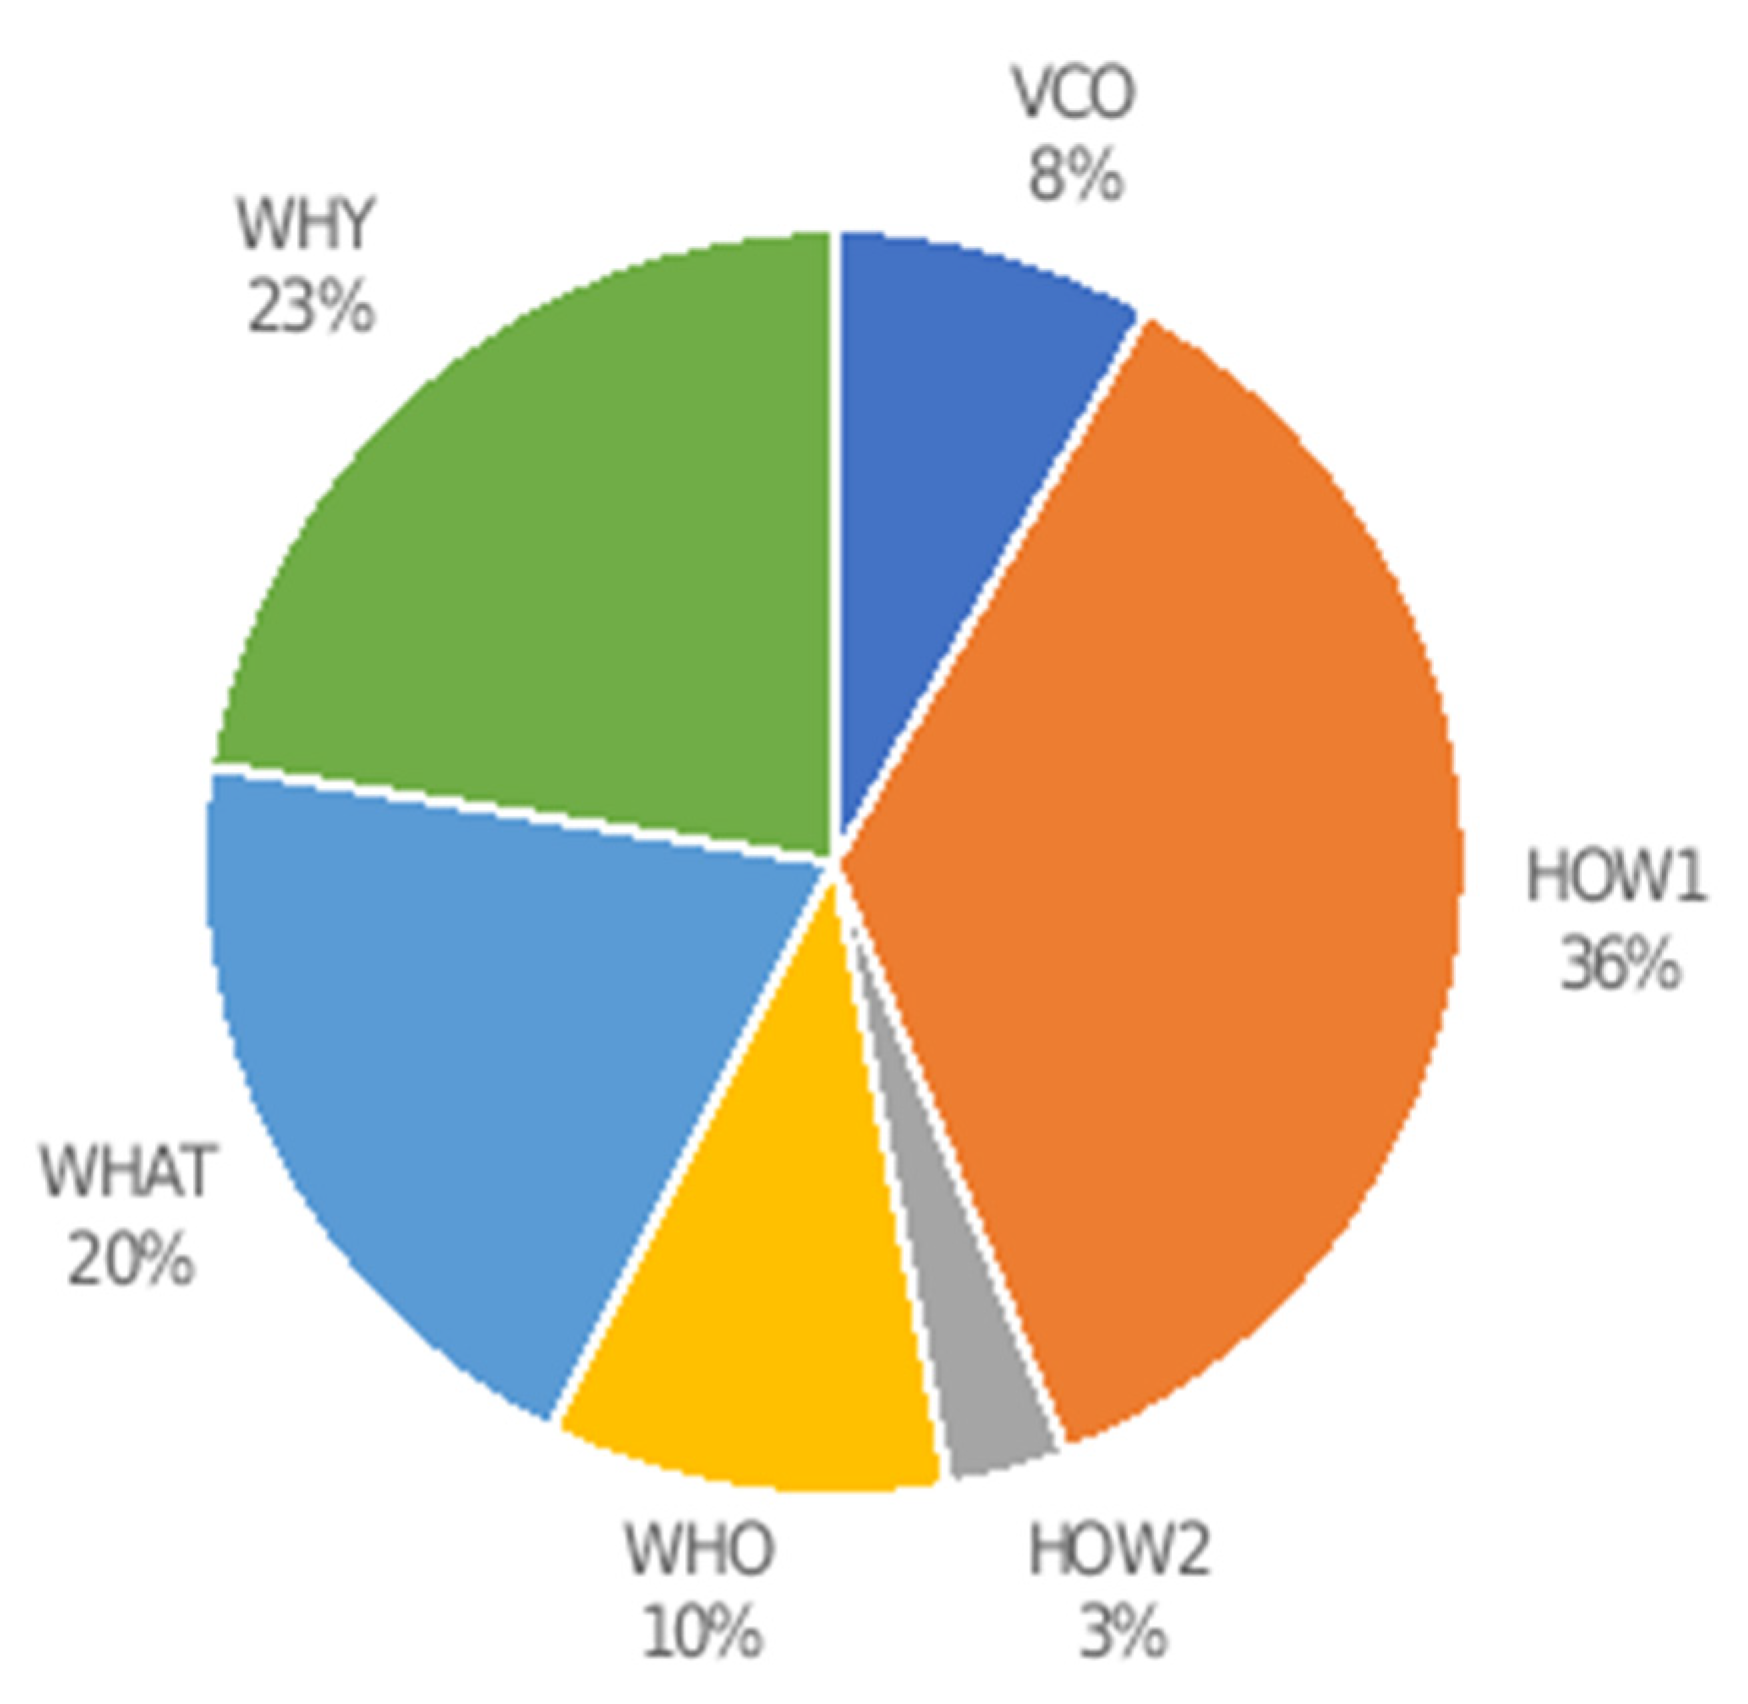
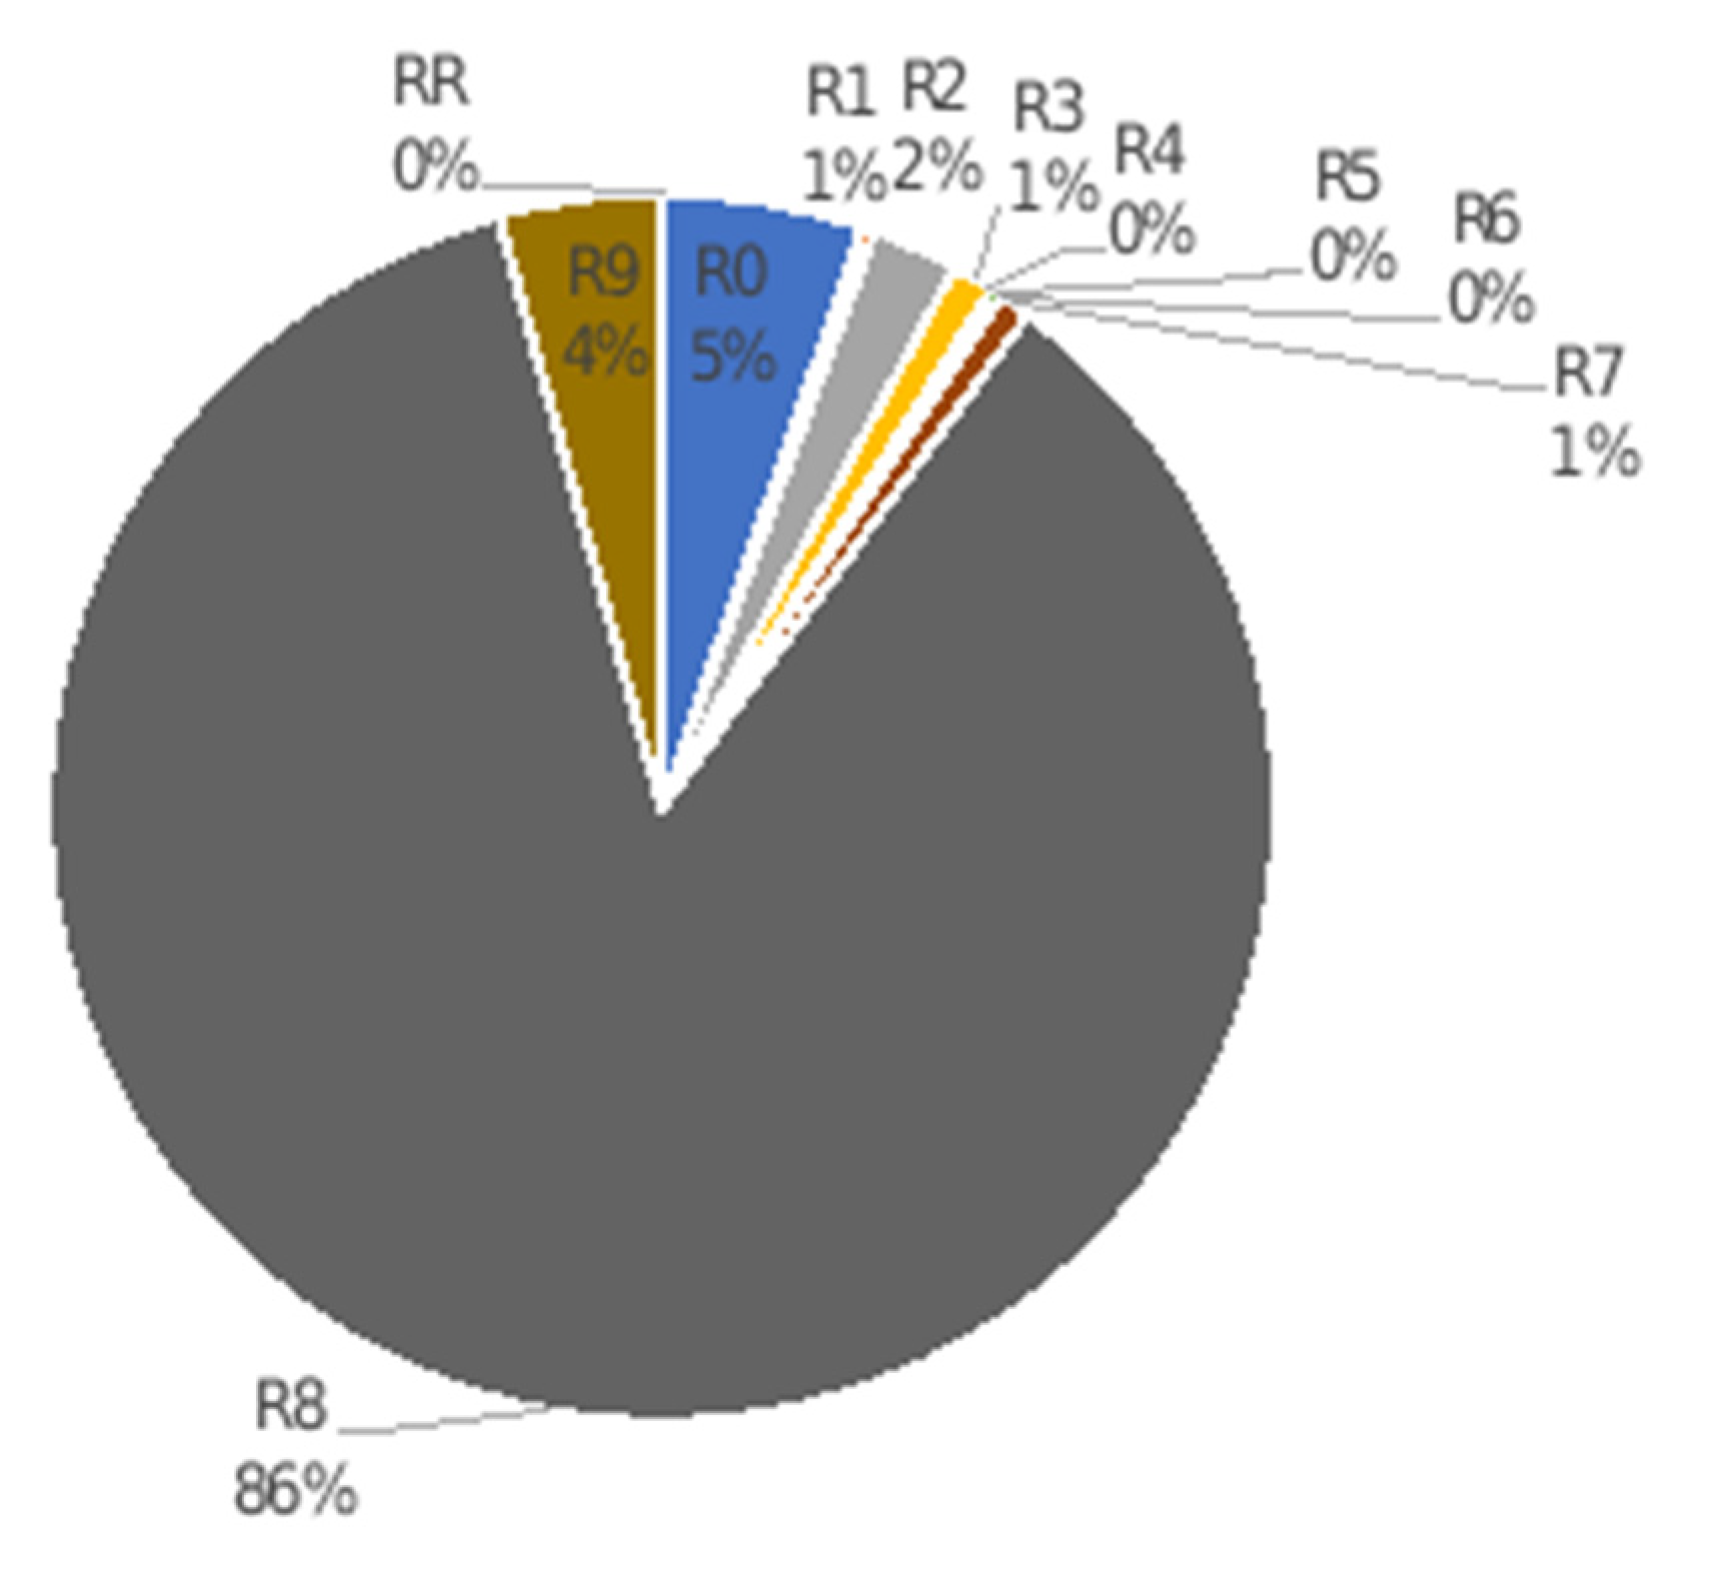
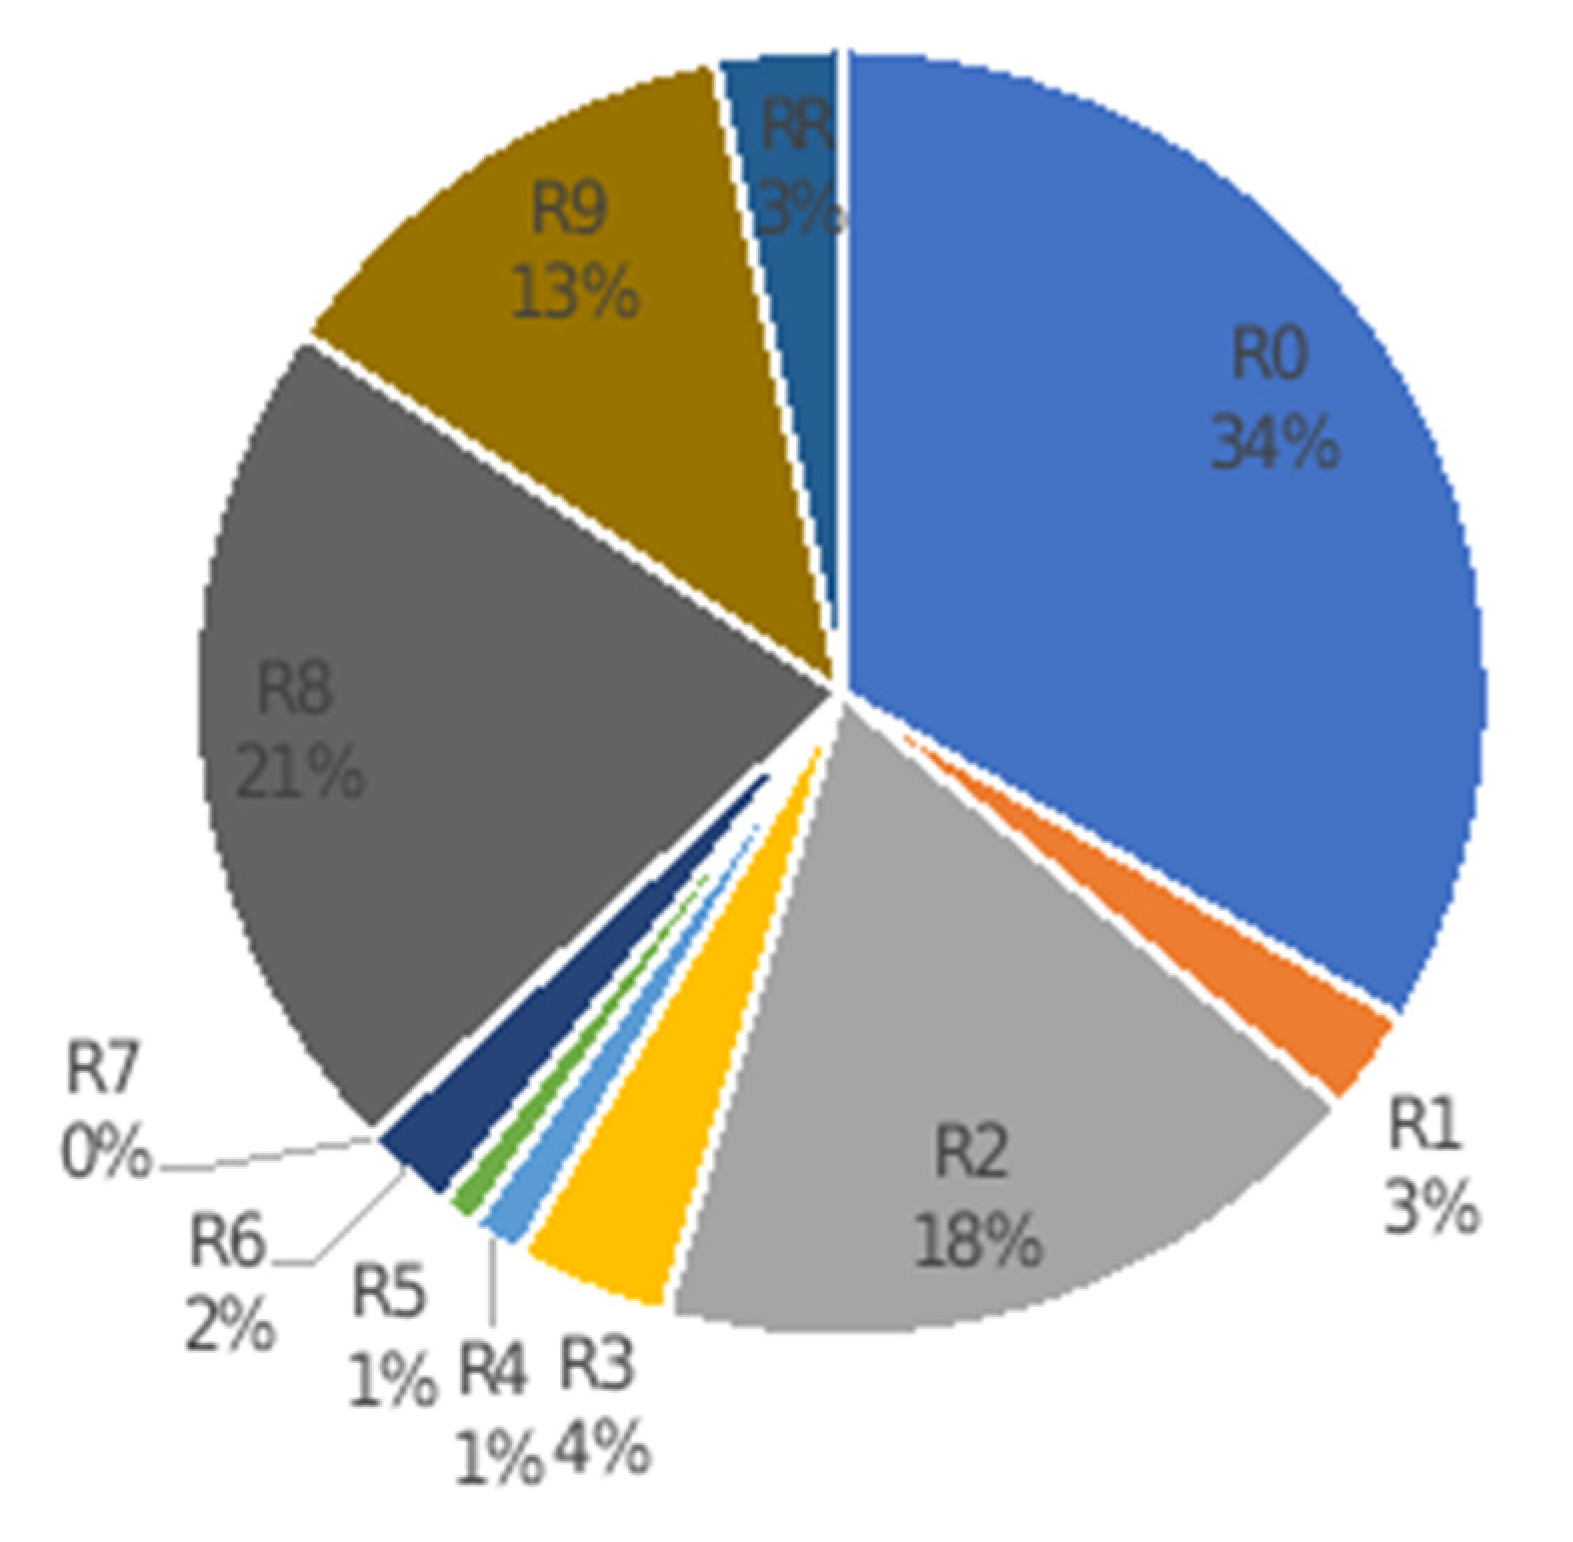
Table 1.
9R model of CE strategies adapted from Potting et al. (2016) [7].
Table 1.
9R model of CE strategies adapted from Potting et al. (2016) [7].
| CE Strategy | Key Principle | Description |
|---|---|---|
| R0 | Refuse | Make redundant, abandon use |
| R1 | Rethink | Intensive use, sharing, multi-functionality |
| R2 | Reduce | Consume less resources |
| R3 | Re-use | Use by another customer |
| R4 | Repair | Repair defective, maintain |
| R5 | Refurbish | Restore, bring up to date |
| R6 | Remanufacture | Use parts for same function |
| R7 | Repurpose | Use parts for different function |
| R8 | Recycle | Process and obtain same or lower quality |
| R9 | Recover | Incinerate for energy |
Table 2.
Relationships between the BM elements of CEDIS.E.
| Variable | VCO | HOW1 | HOW2 | WHO | WHAT | WHY | |
|---|---|---|---|---|---|---|---|
| VCO | Pearson’s r | - | |||||
| p-value | - | ||||||
| HOW1 | Pearson’s r | −0.066 | - | ||||
| p-value | 0.626 | - | |||||
| HOW2 | Pearson’s r | −0.079 | 0.439 *** | - | |||
| p-value | 0.560 | <0.001 | - | ||||
| WHO | Pearson’s r | −0.011 | 0.496 *** | 0.396 *** | - | ||
| p-value | 0.938 | <0.001 | 0.002 | - | |||
| WHAT | Pearson’s r | −0.102 | 0.622 *** | 0.517 *** | 0.505 *** | - | |
| p-value | 0.451 | <0.001 | <0.001 | <0.001 | - | ||
| WHY | Pearson’s r | 0.238 | 0.475 *** | 0.392 ** | 0.652 *** | 0.483 *** | - |
| p-value | 0.074 | < 0.001 | 0.003 | <0.001 | <0.001 | - |
** p < 0.01, *** p < 0.001.
Table 3.
Relationships between the elements of the BM COMPANIES.
| Variable | VCO | HOW1 | HOW2 | WHO | WHAT | WHY | |
|---|---|---|---|---|---|---|---|
| VCO | Pearson’s r | - | |||||
| p-value | - | ||||||
| HOW1 | Pearson’s r | 0.666 *** | - | ||||
| p-value | <0.001 | - | |||||
| HOW2 | Pearson’s r | 0.682 *** | 0.730 *** | - | |||
| p-value | <0.001 | < 0.001 | - | ||||
| WHO | Pearson’s r | 0.117 | 0.636 *** | 0.337 * | - | ||
| p-value | 0.467 | < 0.001 | 0.031 | - | |||
| WHAT | Pearson’s r | 0.622 *** | 0.961 *** | 0.706 *** | 0.677 *** | - | |
| p-value | <0.001 | <0.001 | <0.001 | <0.001 | - | ||
| WHY | Pearson’s r | 0.023 | 0.440 *** | 0.249 ** | 0.793 *** | 0.463 ** | - |
| p-value | 0.887 | 0.004 | 0.116 | <0.001 | 0.002 | - |
* p < 0.05, ** p < 0.01, *** p < 0.001.
Table 4.
Pearson’s correlations r among BM elements and CE strategies of CR COMPANIES.
| Variable | VCO | HOW1 | HOW2 | WHO | WHAT | WHY | |
|---|---|---|---|---|---|---|---|
| R0 | Pearson’s r | 0.823 *** | 0.817 *** | 0.651 *** | 0.346 * | 0.809 *** | 0.192 |
| R2 | Pearson’s r | 0.378 * | 0.800 *** | 0.807 *** | 0.688 *** | 0.780 *** | 0.605 *** |
| R8 | Pearson’s r | 0.811 *** | 0.605 *** | 0.743 *** | −0.067 | 0.569 *** | −0.193 |
| R9 | Pearson’s r | 0.056 | 0.422 ** | 0.204 | 0.436 ** | 0.492 ** | 0.460 ** |
* p < 0.05, ** p < 0.01, *** p < 0.001.
Table 5.
Pearson’s partial correlations among BM elements and CE strategies of CR COMPANIES.
| Variable | VCO | HOW1 | HOW2 | WHO | WHAT | WHY | |
|---|---|---|---|---|---|---|---|
| R0 | Pearson’s r | 0.702 *** | 0.584 *** | 0.497 ** | 0.106 | 0.572 *** | −0.051 |
| R2 | Pearson’s r | 0.102 | 0.766 *** | 0.744 *** | 0.618 *** | 0.716 *** | 0.543 *** |
| R8 | Pearson’s r | 0.722 *** | 0.334 * | 0.653 *** | −0.360 * | 0.271 | −0.460 ** |
| R9 | Pearson’s r | −0.118 | 0.396 * | 0.101 | 0.382 * | 0.506 *** | 0.417 ** |
* p < 0.05, ** p < 0.01, *** p < 0.001 (conditioned on variable: CONSORTIUM).
Table 6.
Transformed Pearson’s correlations (rt) among BM elements and CE strategies of CR COMPANIES (transformed from values in the Table 4).
Table 6.
Transformed Pearson’s correlations (rt) among BM elements and CE strategies of CR COMPANIES (transformed from values in the Table 4).
| Variable | VCO | HOW1 | HOW2 | WHO | WHAT | WHY |
|---|---|---|---|---|---|---|
| R0 | 4 | 4 | 3 | 1 | 4 | 0 |
| R2 | 2 | 3 | 4 | 3 | 3 | 3 |
| R8 | 4 | 3 | 3 | 0 | 2 | 0 |
| R9 | 0 | 2 | 0 | 2 | 2 | 2 |
Table 7.
Transformed Pearson’s partial correlations (rt*) among BM elements and CE strategies of CR COMPANIES (conditioned on variable: CONSORTIUM) (transformed from values in the Table 5).
Table 7.
Transformed Pearson’s partial correlations (rt*) among BM elements and CE strategies of CR COMPANIES (conditioned on variable: CONSORTIUM) (transformed from values in the Table 5).
| Variable | VCO | HOW1 | HOW2 | WHO | WHAT | WHY |
|---|---|---|---|---|---|---|
| R0 | 3 | 2 | 2 | 0 | 2 | 0 |
| R2 | 0 | 3 | 3 | 3 | 3 | 2 |
| R8 | 3 | 1 | 3 | 2 | 0 | 2 |
| R9 | 0 | 2 | 0 | 2 | 2 | 2 |
| Variable | VCO | HOW1 | HOW2 | WHO | WHAT | WHY | ∑|rt − rt*| |
|---|---|---|---|---|---|---|---|
| R0 | 1 | 2 | 1 | 1 | 2 | 0 | 7 |
| R2 | 2 | 0 | 1 | 0 | 0 | 1 | 4 |
| R8 | 1 | 2 | 0 | −2 | 2 | −2 | 1 |
| R9 | 0 | 0 | 0 | 0 | 0 | 0 | 0 |
| ∑|rt − rt*| | 4 | 4 | 2 | −1 | 4 | −1 | 12 |
Table 9.
Aggregated occurrence of verbal semantic indicators in CR COMPANIES.
| Variable | All BM | All CE | Consortium | |||
|---|---|---|---|---|---|---|
| 2019 | 2020 | 2019 | 2020 | 2019 | 2020 | |
| Valid | 23 | 18 | 23 | 18 | 23 | 18 |
| Mean | 2675.261 | 3295.222 | 293.522 | 362.278 | 18.261 | 24.333 |
| Std. Dev. | 1650.915 | 1633.203 | 217.912 | 262.485 | 16.020 | 20.056 |
| Variance | 2.726 × 10⁶ | 2.667 × 10⁶ | 47,485.715 | 68,898.565 | 256.656 | 402.235 |
| Sum | 61,531.000 | 59,314.000 | 6751.000 | 6521.000 | 420.000 | 438.000 |
Publisher’s Note: MDPI stays neutral with regard to jurisdictional claims in published maps and institutional affiliations. |
© 2022 by the authors. Licensee MDPI, Basel, Switzerland. This article is an open access article distributed under the terms and conditions of the Creative Commons Attribution (CC BY) license (https://creativecommons.org/licenses/by/4.0/).
Share and Cite
MDPI and ACS Style
Krmela, A.; Šimberová, I.; Babiča, V. Dynamics of Business Models in Industry-Wide Collaborative Networks for Circularity. J. Open Innov. Technol. Mark. Complex. 2022, 8, 3. https://doi.org/10.3390/joitmc8010003
AMA Style
Krmela A, Šimberová I, Babiča V. Dynamics of Business Models in Industry-Wide Collaborative Networks for Circularity. Journal of Open Innovation: Technology, Market, and Complexity. 2022; 8(1):3. https://doi.org/10.3390/joitmc8010003
Chicago/Turabian StyleKrmela, Aleš, Iveta Šimberová, and Viktorija Babiča. 2022. "Dynamics of Business Models in Industry-Wide Collaborative Networks for Circularity" Journal of Open Innovation: Technology, Market, and Complexity 8, no. 1: 3. https://doi.org/10.3390/joitmc8010003