Article

Enhancement of the Solubility and Dissolution Rate of Telmisartan by Surface Solid Dispersions Employing Superdisintegrants, Hydrophilic Polymers and Combined Carriers

1
Department of Pharmaceutics, College of Pharmaceutical Sciences and Drug Manufacturing, Misr University for Science and Technology, Giza 12566, Egypt
2
Department of Pharmaceutics and Industrial Pharmacy, College of Pharmacy, Cairo University, Cairo 11562, Egypt
3
Wadi El Neel Benta Pharma, 10th of Ramadan, Cairo 44629, Egypt
*
Author to whom correspondence should be addressed.
Sci. Pharm. 2022, 90(4), 71; https://doi.org/10.3390/scipharm90040071
Submission received: 17 October 2022 / Revised: 31 October 2022 / Accepted: 2 November 2022 / Published: 4 November 2022

Abstract

:
Telmisartan (Tel) is a potent antihypertensive drug with a very poor aqueous solubility, especially in pH ranging from 3 to 9 (i.e., biological fluids) that results in poor bioavailability. Our aim was to improve Tel solubility and dissolution rates without the need for expensive multistep procedures, and without inclusion of alkalinizers. This study adopted the use of surface solid dispersions (SSDs) employing superdisintegrants, hydrophilic polymers and combined carriers including a superdisintegrant with a hydrophilic polymer. Tel-SSDs were formulated using thesolvent evaporation method. Compatibility between Tel and different carriers was examined via FT-IR. Tel-SSDs were evaluated optically and thermally to reveal a complete loss of the crystalline nature of the drug. Both drug content and percentage yield were calculated to judge the efficiency of the preparation technique used. Saturation, aqueous solubility, and dissolutions rates were determined. Dissolution profiles were studied using model dependent and independent approaches and were subjected to the pair-wise procedure using the DDsolver software program. Effect of aging was studied by comparing the drug content and dissolution profiles of freshly prepared SSDs with aged samples. All Tel-SSDs showed acceptable physical properties. Tel-SSDs showed pertinent enhancement related to the carrier used. Combined surface solid dispersions employing superdisintegrant croscarmellose sodium with either hydrophilic polymer PEG 4000 or Poloxamer 407 gave remarkable enhancement in solubility and dissolution rates of Tel where more than 90% of the drug was released within 20 min. The effect of aging results proved a non-significant difference in the drug content and dissolution profiles between fresh and aged samples. Formulation of Tel SSDs using combined carriers proved to be effective in enhancing the aqueous solubility and dissolution rates of Tel, as well as showing good stability upon aging.

1. Introduction

Hypertension is one of the main causes of heart disease, and in recent years, the age adjusted hypertension and hypertension disease death rates are increasing. Consequently, the prevention and treatment of hypertension are of social significance [1]. Telmisartan (Tel) is a potent, non-peptide antagonist of the angiotensin II type-1 receptor that is indicated for the treatment of hypertension [2]. Tel has the longest half-life (24 h) compared to other angiotensin II receptor blockers. Another superior characteristic is its high lipophilicity that ensures more effective distribution and tissue penetration [3]. However, the main problem of Tel is its poor aqueous solubility in biological fluids [4]. There are many successful approaches to enhance Tel solubility, yet most include expensive and multistep techniques [5]. Additionally, some studies included the use of alkalinizers [4], which proved to be effective but can cause instability problems [2]. Solid dispersions (SDs) have been proven to cause significant enhancement in the solubility of poorly soluble drugs [6], since active pharmaceutical ingredients dispersed inside the carrier matrix in an amorphous form [7]. Nowadays, more than 30% of market drugs that require solubility enhancement are formulated in a solid dispersion form [8]. SDs not only provide a more amorphous state for the drug, but also increase the wettability of the drug associated with the presence of hydrophilic polymers [9]. Several studies report the incorporation of some additives as surfactants, additional hydrophilic polymers and superdisintegrants to achieve more enhanced drug release [6,10,11]. In our study, we will interpret the effect of formulating Tel in surface solid dispersions (Tel-SSDs) using different hydrophilic polymers, superdisintegrants and combined matrix.

2. Materials and Methods

2.1. Materials

Telmisartan, Poloxamer 407, PEG 4000 and PVP K30 were purchased from Sigma, Ciro, Egypt. Croscarmellose, crospovidone, sodium starch glycolate and colloidal silicon dioxide were purchase from CID, Giza, Egypt. Methanol and chloroform were purchased from Sigma, Cairo, Egypt. Sodium lauryl sulphate; El Nasr pharmaceutical chemicals Co., Cairo, Egypt. All solvents used were HPLC grade.

2.2. Preparation of Primary Surface Solid Dispersions (P-SSD) Employing Superdisintegrants

Three formulations were prepared of P-SSD (F1–F3); each was corresponding to one of the superdisintegrants used (sodium starch glycolate (SSG), crospovidone (CP), & croscarmellose sodium (CCS)), in a 1:1 drug to carrier ratio using the solvent evaporation method (Table 1). The required amount of telmisartan was dissolved in sufficient amount of mixture of (chloroform: methanol) 4:1 to get a clear solution. The superdisintegrant (passed through sieve no.120) was then added to the clear drug solution and dispersed. The mixtures were sonicated (Elmasonic S30H, Elma; Singen (Hohentwiel), Germany) for 15 min to ensure complete mixing. This solution was added to colloidal silicon dioxide while mixing until a homogenous mixture was obtained. The obtained slurry was subjected to heating at 40 °C until a constant weight, using moisture balance (moisture analyzing balance PCE-MA 110, PCE Instruments, Southampton Hampshire, UK). The resulting solid mass was then pulverized in a mortar to get a dry, free-flowing powder. The powder was then passed through a sieve no. 100.

2.3. Preparation of Primary Surface Solid Dispersions (P-SSD) Employing Hydrophilic Polymers

Three formulations were prepared of P-SSD (F4–F6); each was corresponding to one of the polymers used (PVP K30, PEG 4000, & Poloxamer 407), in a 1:1 drug to carrier ratio using the solvent evaporation method. The required amount of telmisartan as well as the hydrophilic carrier were dissolved in a sufficient amount of a mixture of (chloroform: methanol) 4:1 to get a clear solution. Then the same steps were performed as mentioned above (Table 1).

2.4. Preparing Combined Carrier-Solid Dispersions (C-SSDs) Employing Superdisintegrants and Hydrophilic Polymers

Nine formulations were prepared of C-SSDs (F7–F15); each corresponds to a superdisintegrant combined with a hydrophilic carrier, in a 1:1:1 drug to carrier ratio using the solvent evaporation method. The required amount of telmisartan as well as the hydrophilic carrier were dissolved in a sufficient amount of mixture of (chloroform: methanol) 4:1 to get a clear solution. The superdisintegrant (passed through sieve no. 120) was then added to the clear drug solution and dispersed. The mixtures were sonicated for 15 min to ensure complete mixing. Then, the same steps were performed as mentioned above (Table 1)

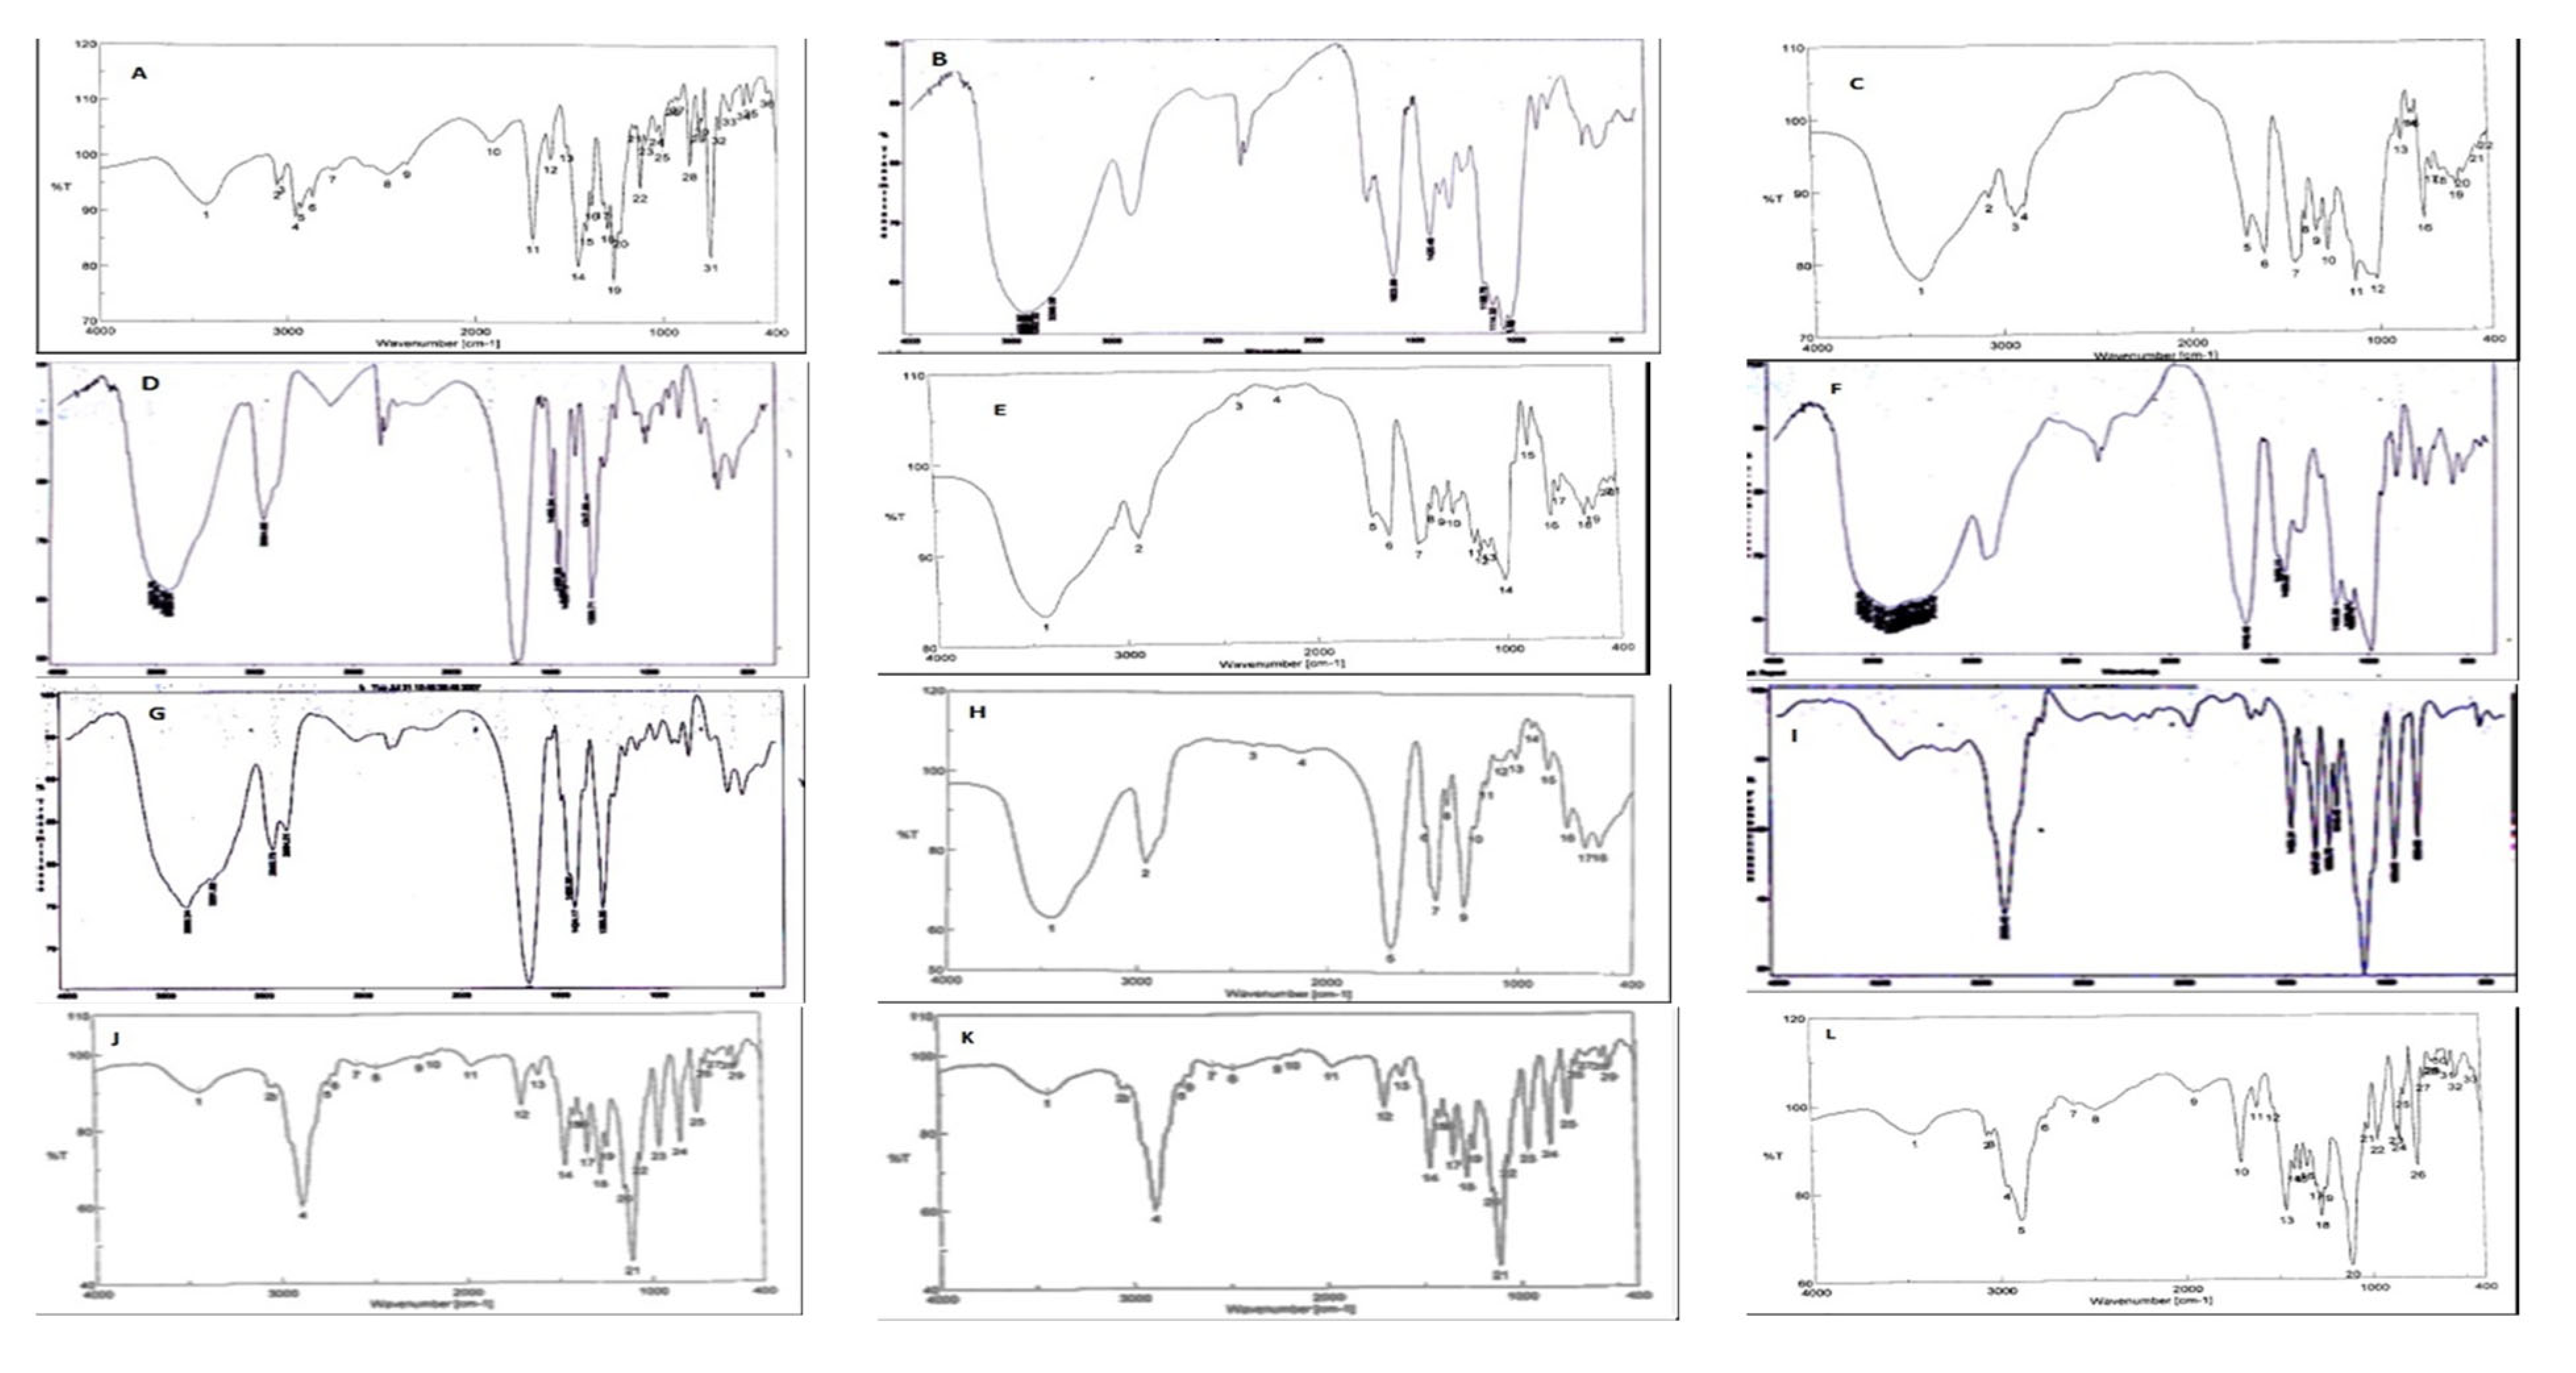
2.5. Compatibility Evaluation of Telmisartan with Different Carriers Using Fourier-Transform Infrared Spectroscopy (FTIR)

To ensure the compatibility and examine any possible interactions between the formulation ingredients; Fourier transform infrared (FT-IR) spectrometer using (Bruker Vector 22 FTIR, Bruker Corporation, Billerica, MA, USA) was performed. FTIR spectra in the range of 4000 and 500 cm−1 for the drug, the carriers and their physical mixtures were determined using the KBr disc technique.

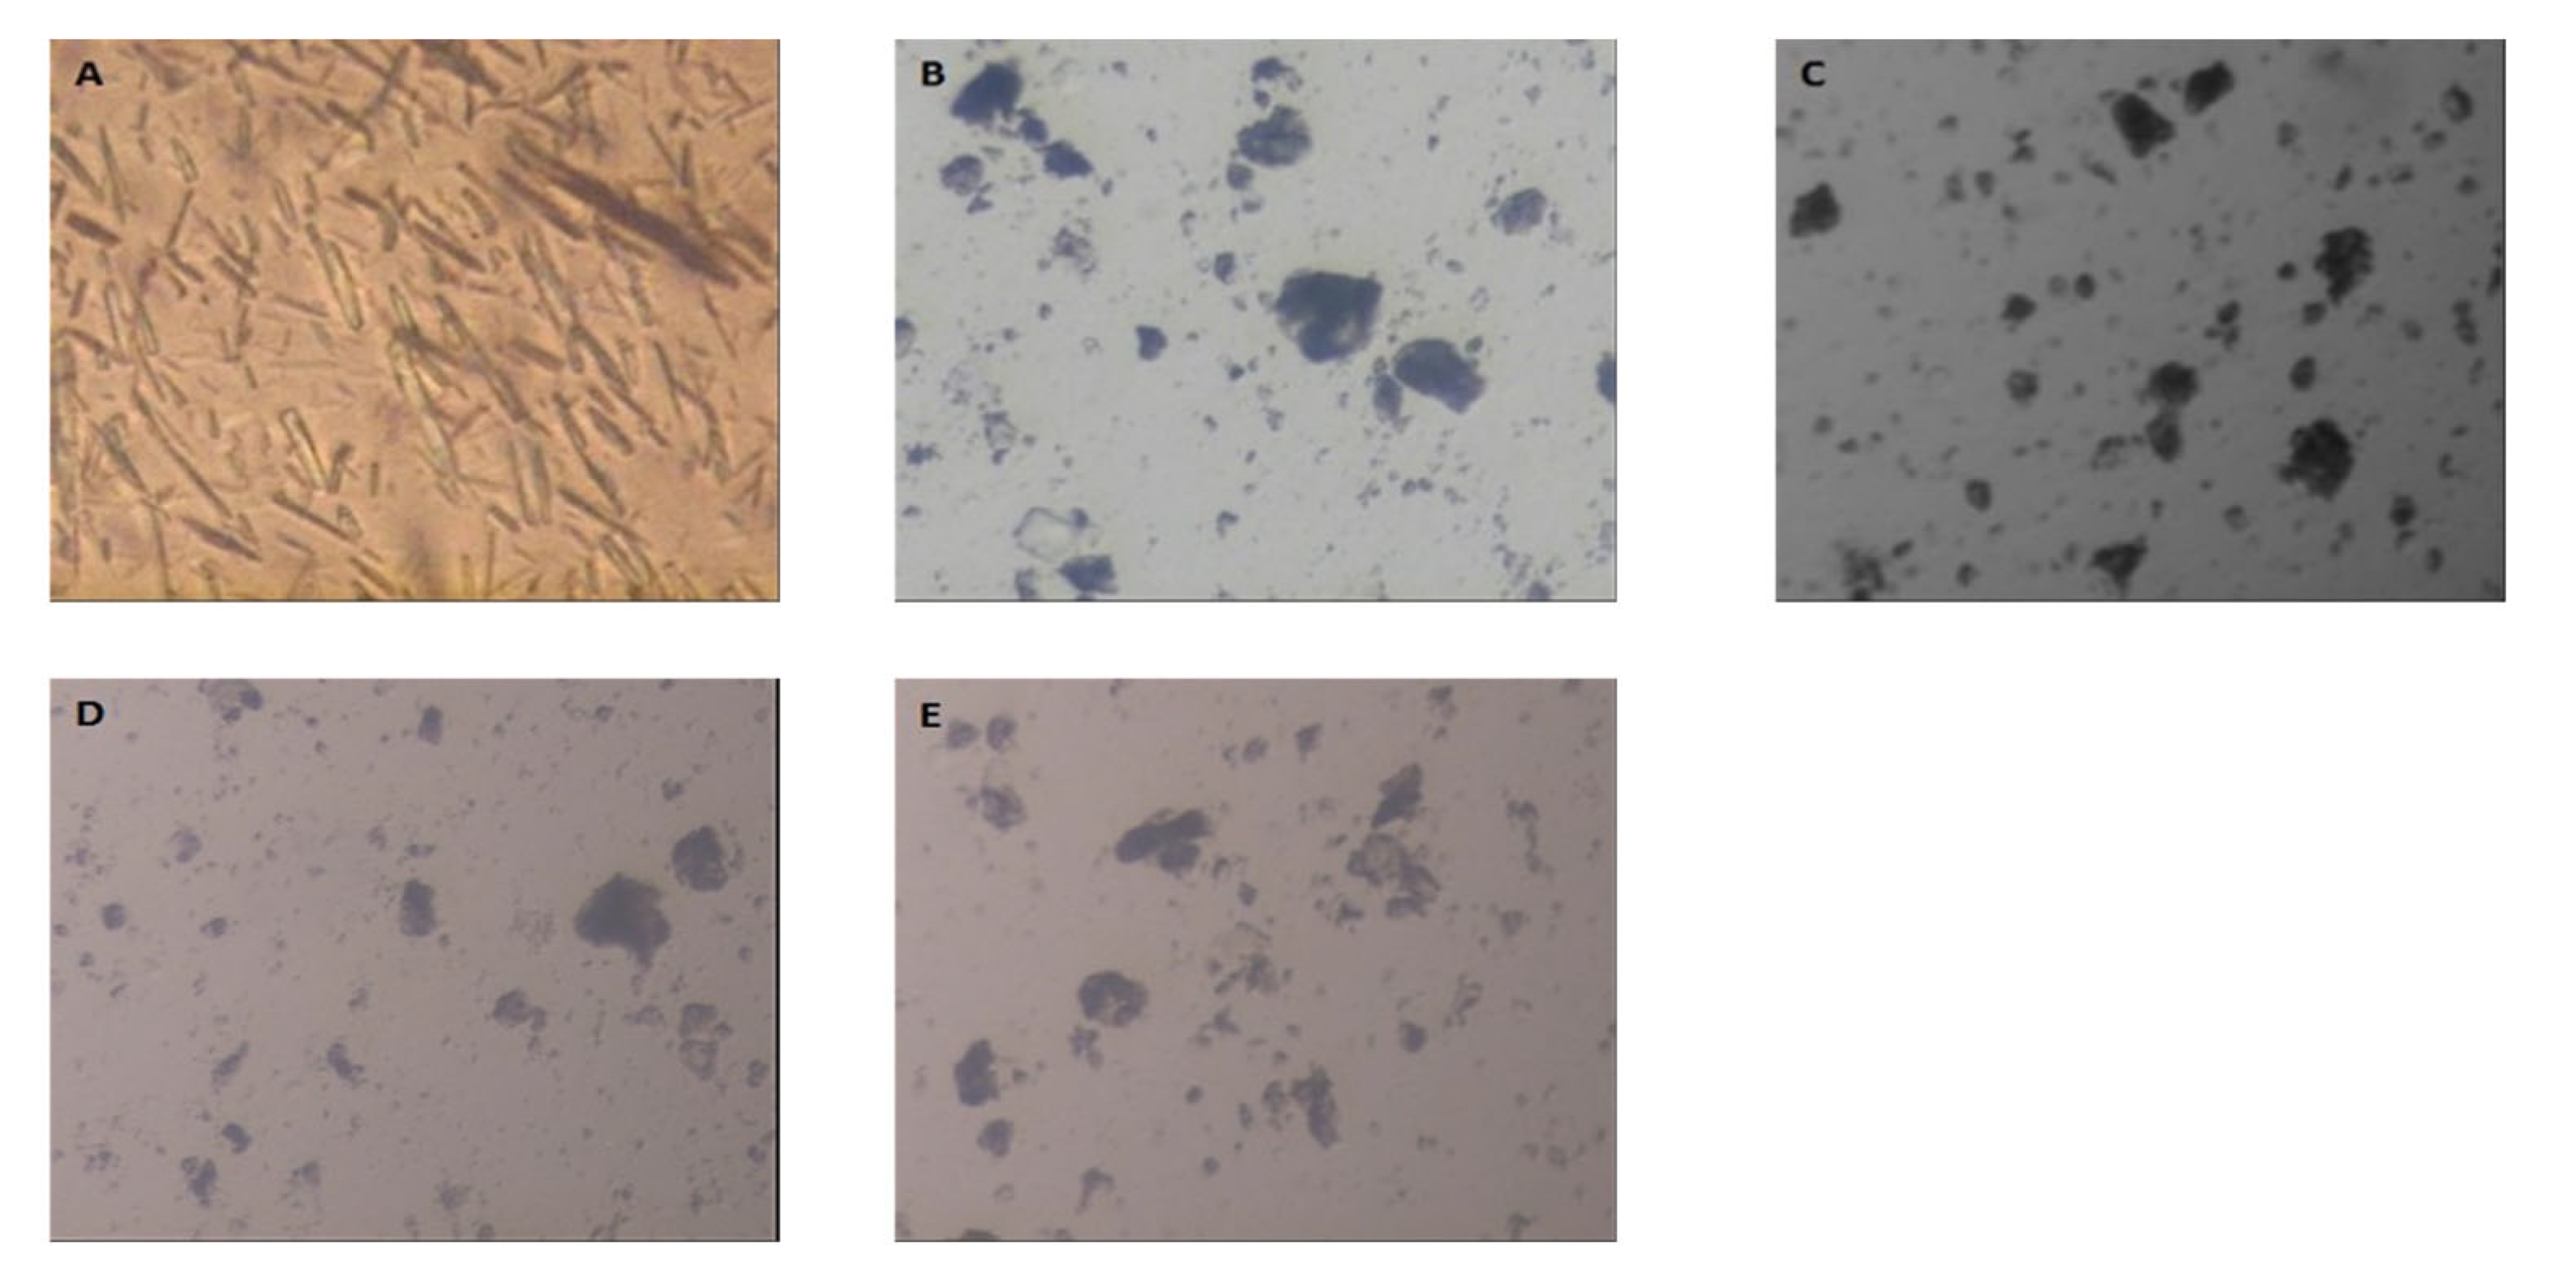
2.6. Optical Microscope Examination of Tel-SSDs

External morphology was examined using an optical microscope (Kern OBS 106, Kern & Sohn GmbH, Lohmar, Germany). Samples of pure drug and Tel-SSDs were mounted onto the slides and analyzed under the optical microscope at a magnification of 40×.

2.7. Determination of Telmisartan Content in Tel-SSDs

The drug content of telmisartan in each formula was calculated. An amount of Tel-SSDs, equivalent to 25 mg of telmisartan, was dissolved in a 100 mL volumetric flask containing methanol. One ml of this solution was completed to 25 mL with methanol in a 25 mL volumetric flask. The absorbance was measured spectrophotometrically at the predetermined λmax of telmisartan, 302 nm.
The drug content percentage was ca”cula’ed using the following equation [12]:
The drug content% = the actual drug content/the theoretical drug content × 100,

2.8. Determination of the Percentage Yield

The percentage yield gives a good indication of the efficiency of the preparation technique. The percentage yield was calculated using the following equation [13]
% yield = practical weight/theoretical weight × 100,

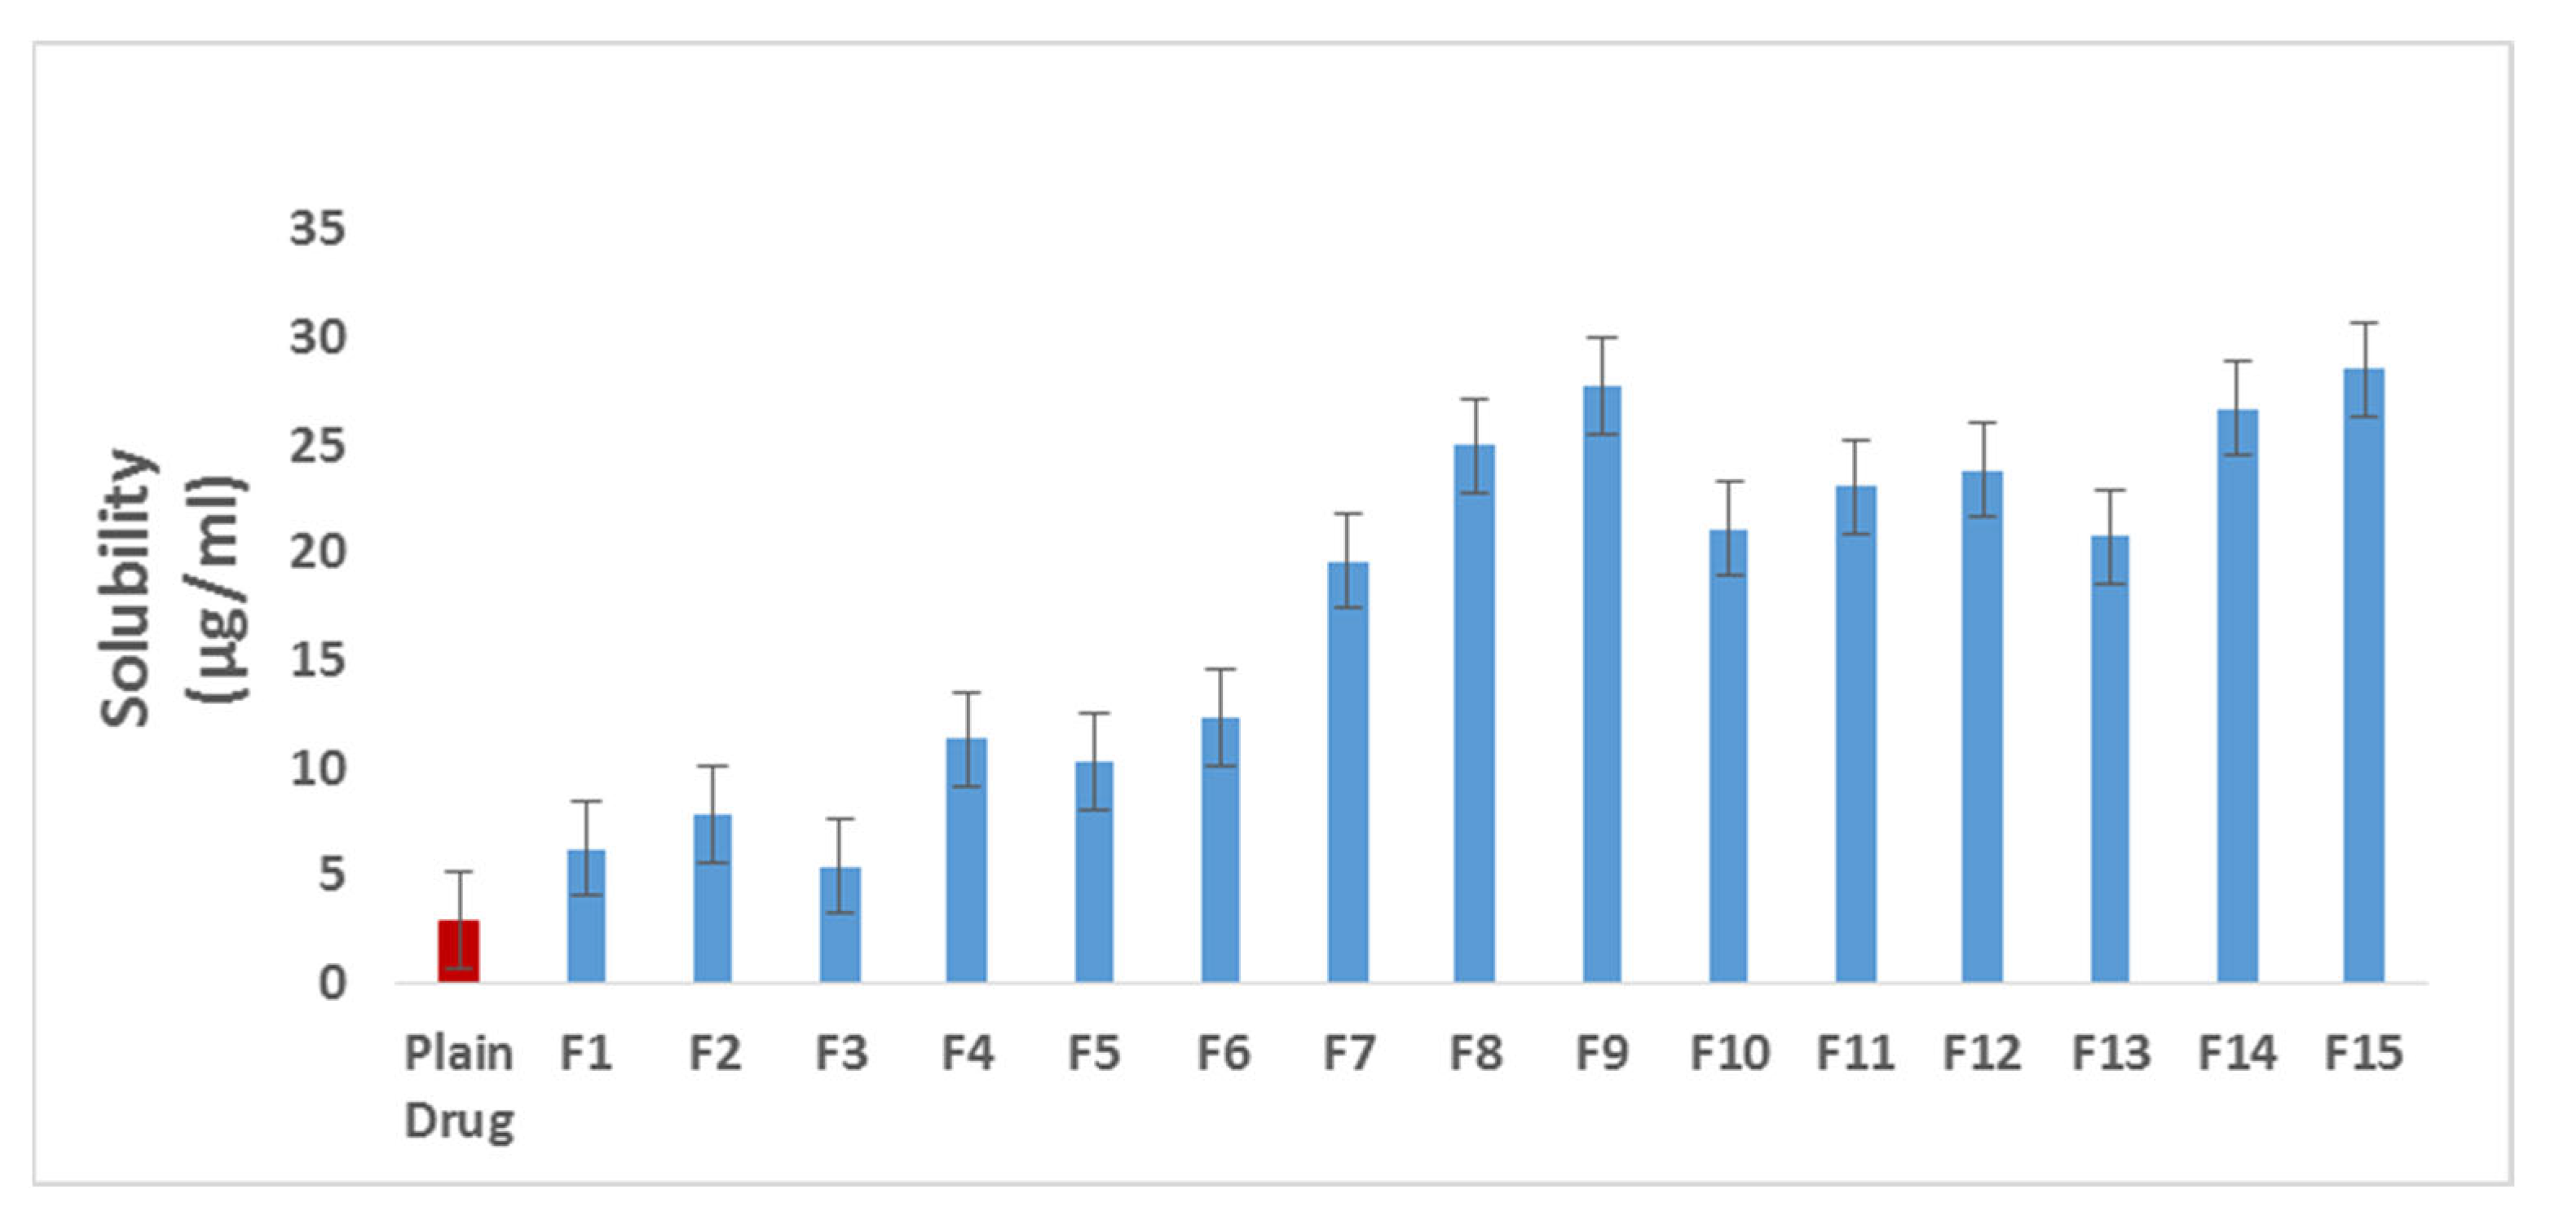
2.9. Saturation Aqueous Solubility Study

The saturation aqueous solubility of the drug was determined for the plain drug and Tel-SSDs. An excess amount of the sample to be tested was added to 10 mL of distilled water in 30 mL screw-capped vials. The vials were shaken for 48 h in an incubator shaker at 37 ± 1 °C. The solution was filtered using 0.45 μm Millipore® filters, and the concentration of the drug was determined at λmax 302 nm. All experiments were run in triplicates.

2.10. Dissolution Study

The dissolution study was done through the following.

2.10.1. Development of Dissolution Media

Solubility studies in different media at different pHs were conducted to find a suitable dissolution media that provides a sink condition, and hence was able to be selected for dissolution rate comparison (Table 2). The dissolution media used were stimulated saliva fluid pH 6.8 and phosphate buffer pH 7.4. The term sink condition is defined as a volume of medium at least three times the volume required to form a saturated solution of a drug substance [14]. Sink condition calculated as CS/CD, where CS is the saturated solubility of the compound in the medium and CD is the concentration of compound in the bulk medium and should be greater than or equal to three. The apparent solubility of telmisartan in water and in different media in the presence of co-solvent or surfactant in water was determined at 37 °C. The selected surfactants to be used were tween and sodium lauryl sulphate (SLS) at different concentrations, Tel (40 mg) was placed in 100 mL screw-capped vials contain 40 mL of various solvents. The vials were shaken for 48 h in an incubator shaker at 37 ± 1 °C. The solution was filtered using 0.45 μm Millipore® filters, and the concentration of the drug was determined at λmax against respective blank solution. The amount of drug dissolved was calculated using a calibration curve.

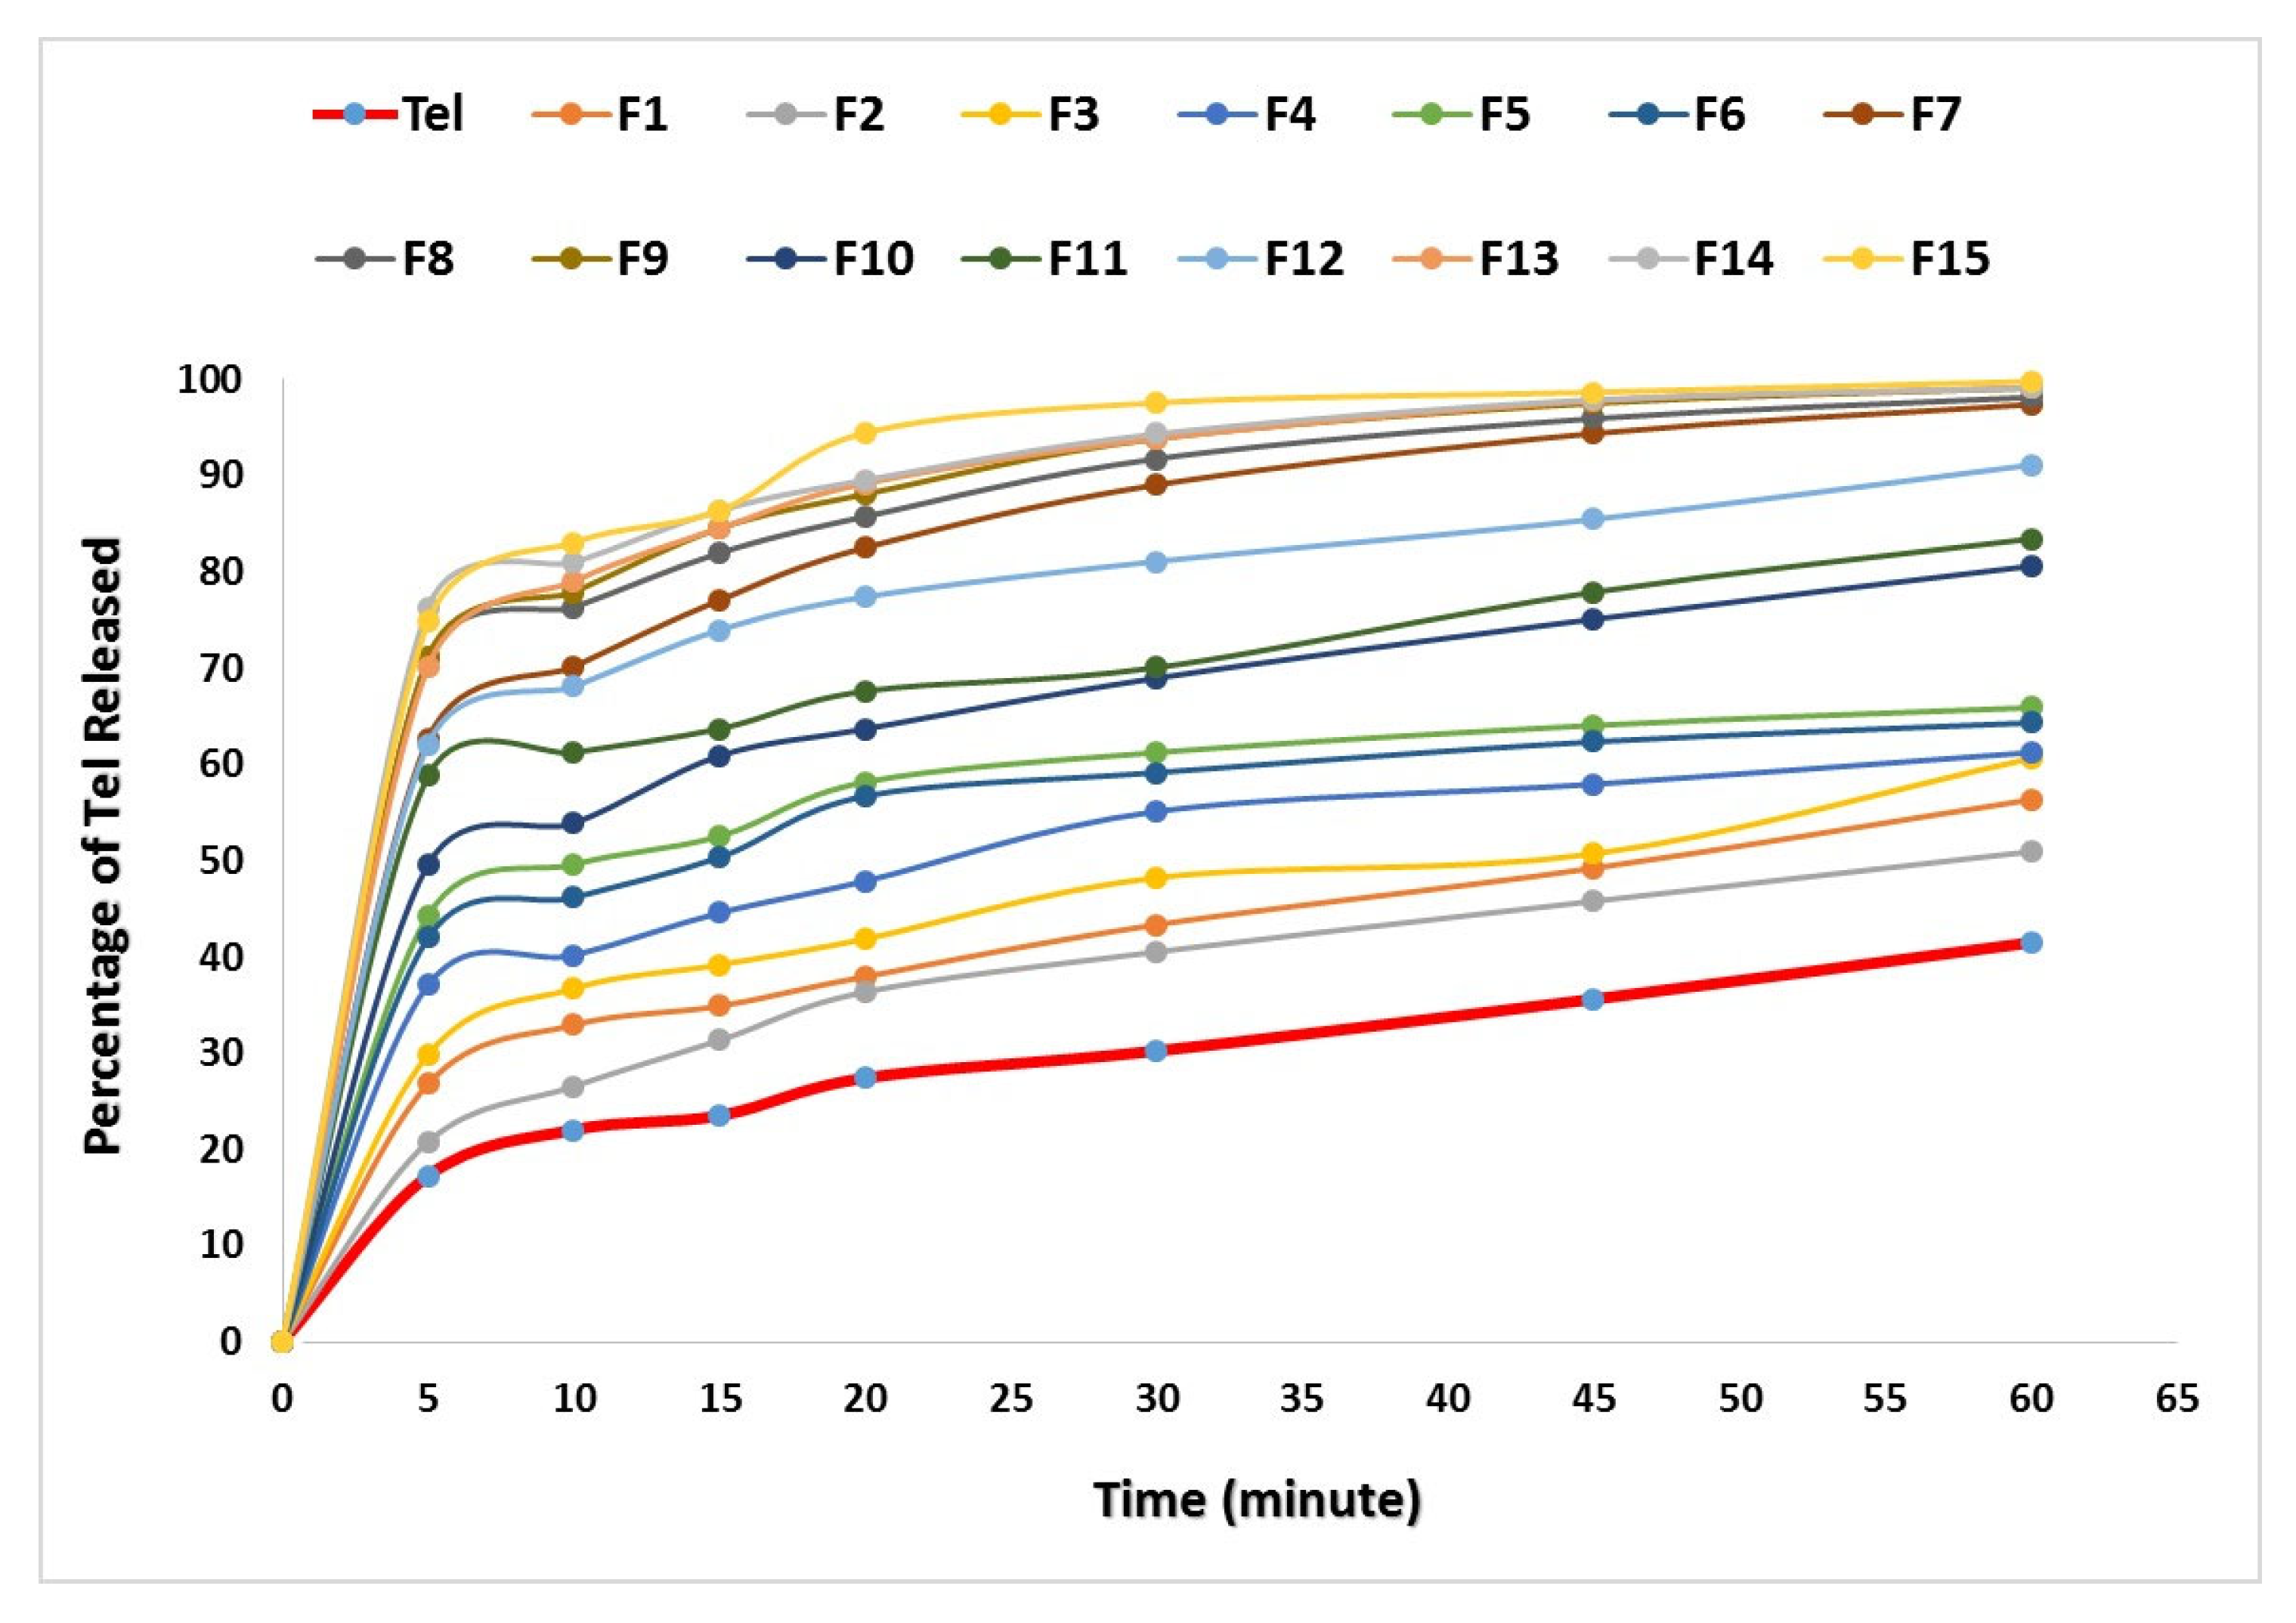
2.10.2. In Vitro Dissolution Profiles

The dissolution profiles of the pure drug and its solid dispersions were determined using USP standard dissolution apparatus II (Dr. Schleuniger Pharmaton, type Diss 6000, Solothurn, Switzerland). An accurately weighed amount of each of the prepared SSDs, equivalent to 40 mg of telmisartan, was placed in 900 mL of phosphate buffer (7.4) containing 1.5% SLS. The paddle was rotated at 50 rpm, and the temperature of the dissolution medium maintained at 37 ± 1 °C. Three milliliters of aliquot samples were withdrawn, with replacement, at 5, 10, 15, 20, 30 and 60 min. Samples were filtered using 0.45 μm Millipore® filter and properly diluted prior to measuring their absorbance at λmax 302 nm. All experiments were run in triplicates.

2.10.3. In Vitro Dissolution Profiles Study

In order to compare the drug release rate of plain drug with all formulated SSDs, model-independent approaches was carried out. Mean dissolution time (MDT), dissolution efficiency (DE) [15] at 45 min (DE 45%) and dissolution efficiency at 60 min (DEall%) were calculated according to the following equations [16]
MDT in   vitro = i = 1 n T mid Δ M /   i = 1 n Δ M ,
where i is dissolution sample number, n is number of dissolution sample times, Tmid is time at the midpoint between times ti and ti−1, and ΔM is the amount of Tel dissolved (μg) between times ti and ti−1 [16].
DE % = 0 T Yt × dt / Y 100 × t × 100 % ,
where Yt is percent of drug dissolved at certain time t, Y100 represents 100% dissolution, and the integral represents the area under dissolution curve between time zero and T (overall dissolution time) [17]. The time T in our study was 60 min.

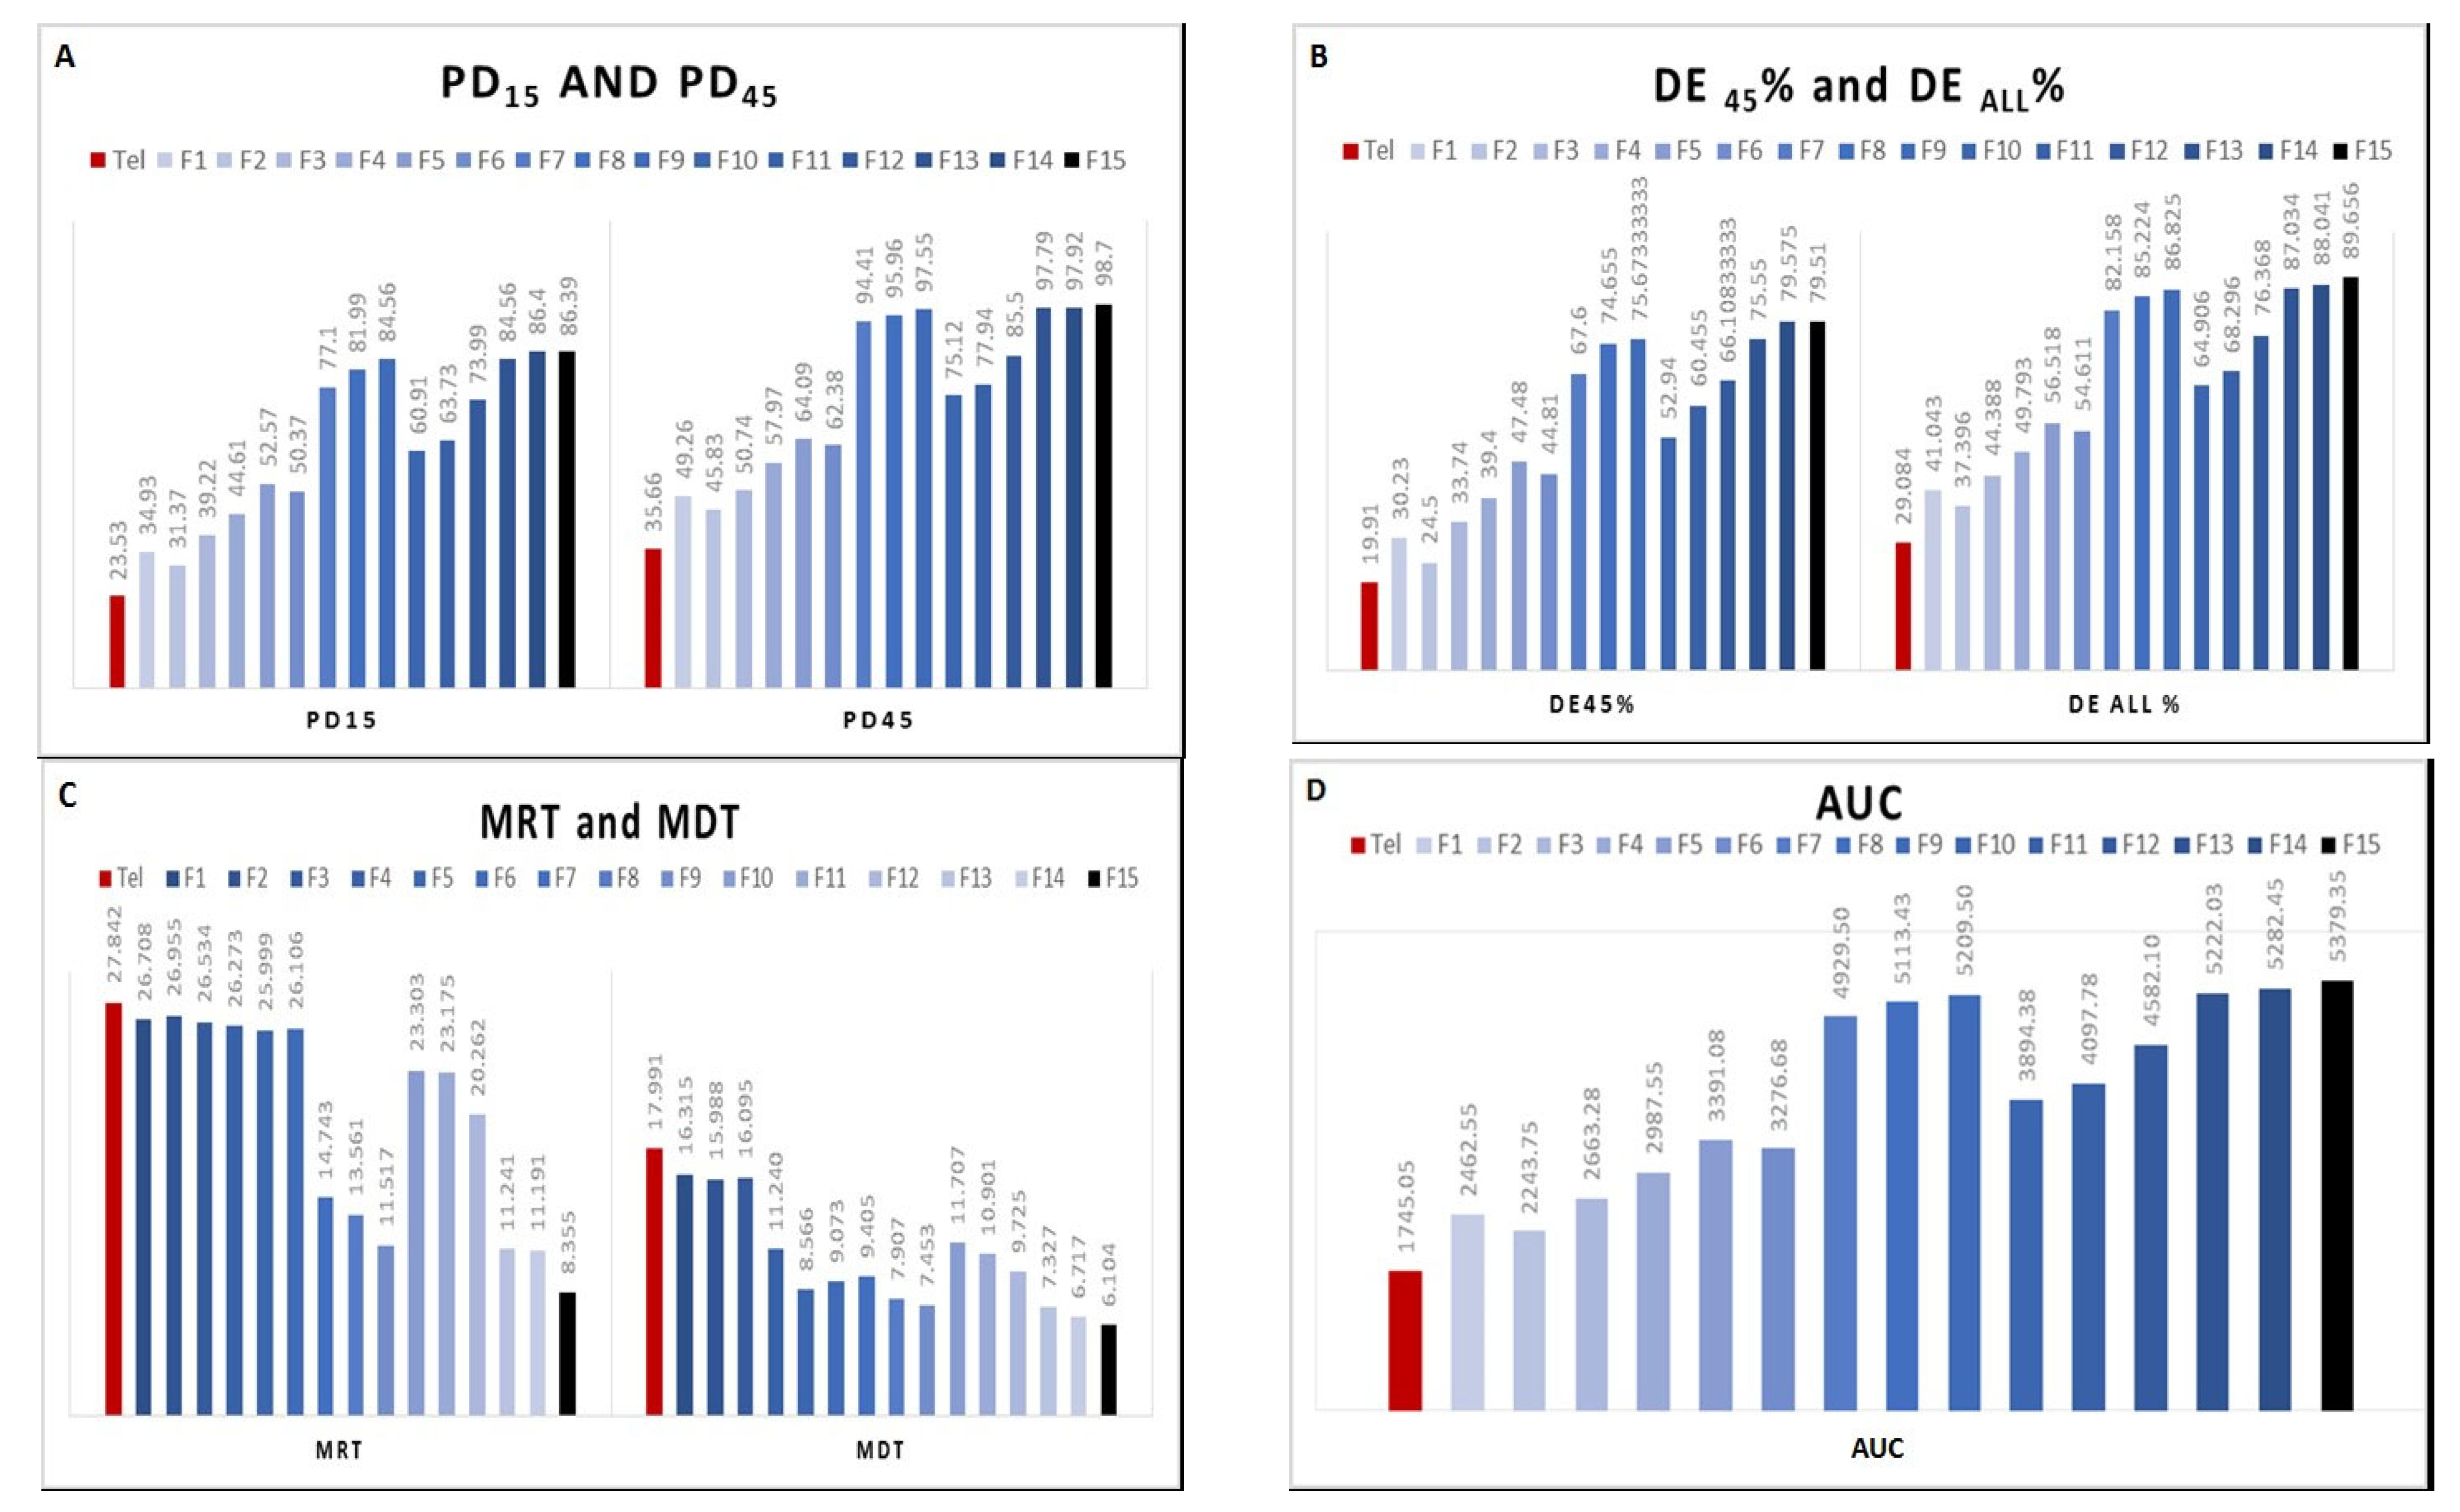
2.10.4. Comparison of Dissolution Data Profiles Using Ddsolver Software Program

To analyze and precisely compare the dissolution data profiles, model-dependent as well as model-independent approaches were applied by means of Ddsolver software program [18]. This was done through the following steps.
  • Model selection,
  • Characterizing the release curves and establishment of corresponding kinetic parameters,
  • Dissolution profile comparison,
  • Selection of the best formulae that caused the highest improvement in release rates.

2.10.5. Kinetic Analysis of Dissolution Data

Model-dependent approaches were applied to assess the mechanism of drug release. The following linear regression equations were employed.
For zero-order Kinetics [19]:
Qt = Qo + Kot,
where Qt is the concentration of the drug at time t, Qo is the initial concentration and Ko is the zero order release constant [19].
For first-order Kinetics [20]:
Log Qt = log Qo + K1t/2.303,
where Qt is the concentration of the drug at time t, Qo is the initial concentration and K1 is the first-order release constant [20].
For Higuchi-diffusion model [21]:
Q = Dt (2A – Cs) Cs,
where Q is the amount of drug released per unit area at time t, D is the drug diffusion coefficient in the matrix at time t, A is the total amount of the drug present in the matrix per unit volume and Cs is the drug solubility in the matrix [21]. In a general way, it is possible to simplify the Higuchi model as (generally known as the simplified Higuchi model).
For simplified Higuchi model [22]:
Q = Kht1/2,
where, Kh is the Higuchi dissolution constant [22].
For Weibull model [23]:
Xt = X(∞) [1 – exp(−αtβ)],
where Xt is the percentage drug dissolved at time t, X(∞) the percentage drug dissolved at infinite time, α the scale factor and β the shape factor [23].

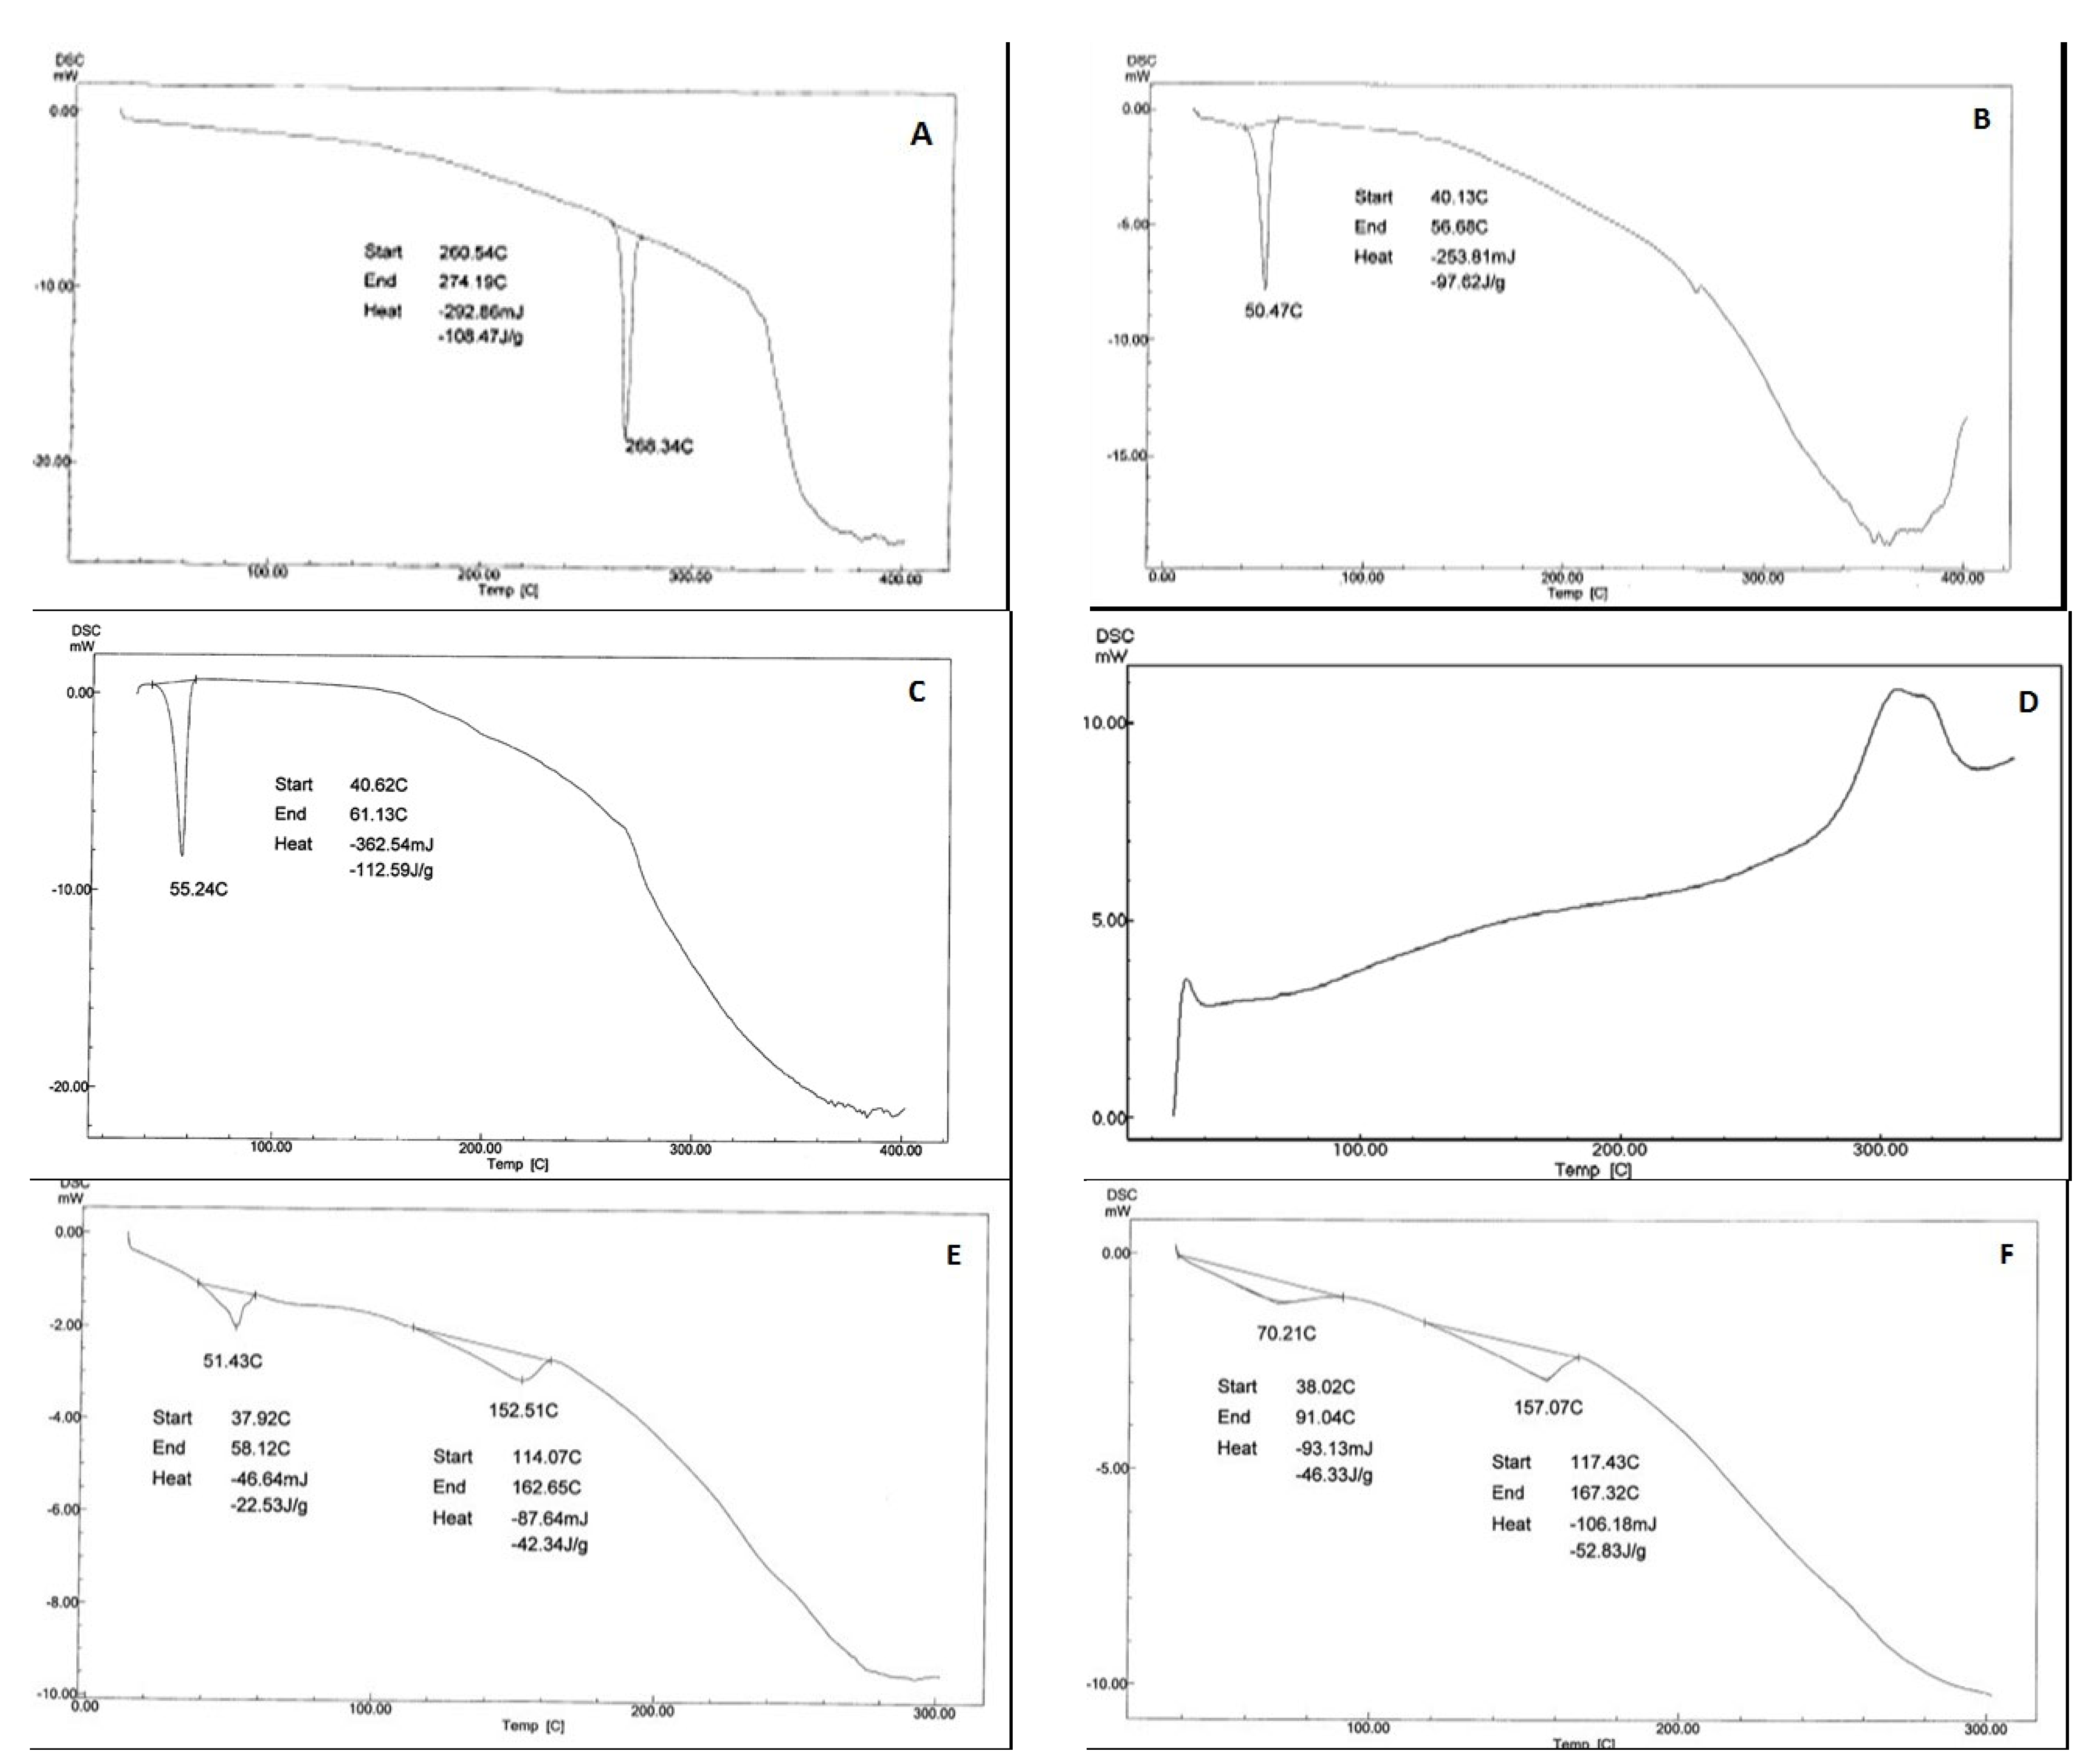
2.10.6. Differential Scanning Salorimetry (DSC)

Thermal analysis for the pure drug, carriers and selected optimized formula giving the best dissolution profiles were evaluated using differential scanning calorimeter (DSC 50; Shimadzu, Japan). Samples weighing (3–4 mg) were placed in an aluminum pan sealed and heated from 5 °C to 350 °C at a rate of 10 °C/min, under a nitrogen purge with indium in the reference pan.

2.10.7. Effect of Aging

To study the effect of aging on the prepared SSDs, samples were packed in screw-capped vials for 12 months at room temperature. These samples were subjected to drug content and in-vitro dissolution study. All experiments were run in triplicates.

3. Results and Discussion

3.1. Compatibility Evaluation of Telmisartan with Different Carriers Using FTIR

Tel plain drug (Figure 1A) showed five characteristics peaks, broad peak at 3433.64 cm−1 indicating the presence of NH/OH stretching. Sharp peaks at 3057.58 cm−1 (aromatic C–H stretch), 2958.27 cm−1 (aliphatic C–H stretch), 1695.12 cm−1 (carbonyl group), 1603.52 cm−1 (aromatic C=C bend and stretch) and 1455.99 cm−1 indicating the presence of C=C aromatic. The spectra of all SSD (Figure 1B–L) were compared with those of the initial materials. There were no major changes in band intensity of the telmisartan characteristic peaks; hence, there was no interaction between telmisartan and the SSDs components.

3.2. Optical Microscope Examination

The external morphology of Tel showed that it has a needle crystal shape (Figure 2A). The optical results of Tel and the optimized formulae (F8, F9, F14, and F15). All Tel-SSDs appeared in amorphous forms (Figure 2A–E) pointing to losing of the crystalline structure of plain Tel. The newly obtained drug amorphous form led to improved drug solubility, owing to the lower energy required for the drug molecules to be dissolved [24].

3.3. Telmisartan SSDs Drug Content and Percentage Yield

As shown in Table 1, drug content ranged from 94.15 to 104.39% while the percentage yield was between 89.6 to 96.4%. This high percentage yield, as well as the drug content ranges, reveal the efficiency of the solid dispersion preparation technique.

3.4. Saturation Aqueous Solubility Study

Plain Tel solubility was 2.93 µg/mL. As shown in Table 1 and Figure 3, all Tel-SSDs showed enhanced solubility compared to the plain Tel. P-SSDs containing hydrophilic polymers showed higher solubility than that containing superdisintegrants. They showed nearly fourfold increase in Tel solubility whereas P-SSDs containing superdisintegrants showed approximately two-fold increase. On the other hand, all C-SSDs showed very high solubility. The highest solubility was recorded with formula F15 with 28.52 µg/mL that is 9.7 ≈ 10 folds higher than the plain Tel. It was clear that the deposition of Tel on the surface of an inert carrier changed its nature into a more amorphous structure. Additionally, the solubilizing and wetting effect of hydrophilic carriers, as well as the effect of superdisintegrants in reducing particle size of the drug, had a clear, pertinent effect on Tel solubility.

3.5. Development of Dissolution Media

To select a proper medium for accurate dissolution testing, solubility studies in different media at different pHs were conducted. Solubility studies in different dissolution media indicated that the dose of telmisartan (40 mg) taken was not soluble under normal conditions. This low solubility makes it difficult to maintain the sink condition in dissolution media. The best conditions were fulfilled by using phosphate buffer pH 7.4 containing 1.5% w/v SLS. SLS was used as solubilizer to enhance the solubility and to maintain sink conditions in the respective dissolution media [4].

3.6. In Vitro Dissolution Profiles

The improved solubility of Tel-SSDs was well reflected on Tel dissolution rates Figure 4. Regarding the plain Tel dissolution profile, it was noticed that after 5 min, the average percent of Tel dissolved was 17.28%, which gradually increased to 22.06 and 23.53% at the end of the 10th and 15th minutes, respectively. By the end of the experiment (60 min), the average percentage of drug dissolved was 41.54%. The dissolution profile of Tel revealed its hydrophobic crystalline nature. Furthermore, Tel exhibits a tendency to form large aggregates which float on the surface of dissolution medium. These aggregates cause a reduction in the effective surface area of the drug particles available for dissolution [25].
On the other hand, all prepared SSDs enhanced the dissolution rate of Tel. The enhancement in the dissolution rate of Tel (P-SSDs) using hydrophilic carriers was higher than using superdisintegrants. Meanwhile, all (C-SSDs) showed remarkable improvement when compared to (P-SSDs). This correlates well with the solubility results mentioned earlier. The highest dissolution rates were recorded with F15 and F14.
The dissolution rate enhancement of Tel SSDs was affected by various reasons related to the carriers used. Regarding P-SSDs (F1–F3), the improvement in dissolution rate was in the order, croscarmellose sodium > sodium starch glycolate > crospovidone. It is well known that there are different disintegration mechanisms depending on the type of superdisintegrant used. The disintegration of CCS and SSG is achieved through a swelling mechanism [26]. When Tel-SSDs containing CCS and SSG were exposed to the dissolution medium, they absorbed large amounts of water and swell, breaking Tel into fine aggregates. This increased the wettability of Tel, leading to an improvement in the dissolution rates. Contrarily, crospovidone disintegration does not rely on the swelling mechanism. CP disintegration is based on the strain recovery mechanism [27]. Accordingly, for CP to have a significant disintegration effect, there must be a compression force as happens with tablet manufacturing [28]. That is why the effect of CP Tel-SSD on the dissolution rate was less when compared with CCS and SSG Tel-SSDs.
As for P-SSDs (F4–F6), the hydrophilic polymers caused significant improvement in dissolution rates. This could be related to the hydrophilicity and surfactant property of polymers, resulting in higher wettability and increasing the surface available for dissolution by reducing interfacial tension between hydrophobic drug and dissolution media.
Consequently, the C-SSDs (F7–F15) showed a very high improvement in dissolution rates. It is obvious that the combined effect of the superdisintegrants and the hydrophilic polymers is reflected in the faster dissolution rates. The disintegration of the drug into fine particles, as well as the hydration and wettability caused by the hydrophilic polymers, led to this noticeable increase in the dissolution rates compared to the plain drug.

3.7. Comparison of Dissolution Data Profiles Using Ddsolver Software Program

As shown in Table 3, model selection was based on a detailed analysis of different statistical criterion to evaluate the goodness of fit of a kinetic model. These statistical criterions were coefficients of determination, (R2), the mean square error (MSE), the weighted sum of squares (WSS), Akaike information criterion, (AIC) and model selection criterion, (MSC) [18]. Based on the values of these statistical parameters, it was clear that the best fitting results were obtained by the Weibull model.
Table 3. Kinetic model selection criteria and models parameters.
ModelParameterTelF1F2F3F4F5F6F7F8F9F10F11F12F13F14F15
WeibullR20.99 0.99 0.99 0.98 0.99 0.99 0.99 0.99 0.98 0.99 0.99 0.99 0.99 0.99 0.990.99
MSE1.56 3.10 0.47 4.76 2.33 1.33 2.27 4.50 4.82 3.43 3.18 9.46 2.23 1.91 3.78 4.49
WSS7.79 15.52 2.34 23.82 11.65 6.64 11.36 22.48 24.10 17.16 15.91 47.32 11.13 9.54 18.92 22.45
AIC18.37 23.19 9.97 26.19 21.19 17.25 21.01 25.79 26.28 23.90 23.37 31.00 20.87 19.79 24.58 25.78
MSC3.41 3.11 5.10 2.69 3.20 3.48 3.06 3.20 2.66 3.05 3.27 1.75 3.41 3.67 2.58 2.60
α11.10 6.47 8.86 5.31 3.82 2.58 2.89 2.36 1.67 1.76 2.76 1.93 1.85 1.84 1.39 1.66
Td294.28 114.20 128.66 92.35 71.27 40.87 48.71 5.95 3.50 3.48 17.71 11.05 6.11 3.61 2.31 2.81
β0.42 0.39 0.45 0.37 0.31 0.26 0.27 0.48 0.41 0.45 0.35 0.27 0.34 0.47 0.40 0.49
T1/2123.84 45.04 56.89 34.19 22.17 9.76 12.73 2.78 1.43 1.56 6.28 2.88 2.09 1.67 0.91 1.33
First order ModelR20.92 0.91 0.93 0.89 0.87 0.85 0.85 0.97 0.97 0.98 0.92 0.89 0.95 0.98 0.98 0.98
MSE65.91 129.59 91.49 162.55 221.54 299.46 278.83 73.47 74.21 52.84 210.83 270.27 152.78 45.19 53.36 32.02
WSS461.36 907.15 640.40 1137.85 1550.79 2096.19 1951.84 514.30 519.44 369.87 1475.84 1891.87 1069.46 316.35 373.51 224.15
AIC51.07 56.48 53.70 58.30 60.77 63.18 62.61 51.94 52.02 49.31 60.38 62.36 57.80 48.05 49.38 45.30
MSC−0.16 −0.38 0.00 −0.56 −0.95 −1.30 −1.20 0.95 0.75 1.14 −0.46 −0.88 −0.10 1.31 1.01 1.61
K0.012 0.019 0.017 0.022 0.027 0.038 0.035 0.125 0.168 0.181 0.056 0.070 0.108 0.181 0.218 0.221
T1/260.09 36.03 41.88 31.22 25.33 18.20 20.06 5.53 4.12 3.84 12.42 9.90 6.43 3.82 3.18 3.13
Zero OrderR20.90 0.86 0.88 0.84 0.78 0.71 0.73 0.73 0.68 0.67 0.77 0.71 0.70 0.67 0.64 0.64
MSE36.34 86.13 66.12 114.34 169.62 263.85 237.27 525.80 634.29 668.21 301.02 379.79 489.87 675.16 728.86 766.35
WSS218.03 516.79 396.69 686.02 1017.72 1583.08 1423.60 3154.81 3805.73 4009.24 1806.13 2278.74 2939.24 4050.95 4373.18 4598.12
AIC47.08 53.98 51.87 56.25 59.40 62.94 62.09 68.45 69.95 70.37 63.99 65.85 67.89 70.45 71.07 71.47
MSC0.34 −0.07 0.23 −0.31 −0.78 −1.27 −1.14 −1.11 −1.49 −1.50 −0.91 −1.32 −1.36 −1.49 −1.70 −1.66
K0.55 0.71 0.69 0.74 0.73 0.73 0.73 1.11 1.04 1.05 0.93 0.89 0.98 1.06 1.01 1.02
T1/258.54 42.06 46.01 39.05 35.82 32.05 33.05 21.93 21.36 21.00 27.42 26.29 23.62 20.95 20.83 20.49
Higuchi ModelR20.860.660.860.46−0.26−2.27−1.48−1.37−4.41−4.41−0.67−3.02−3.08−4.27−8.35−6.92
MSE9.50 35.03 16.13 56.19 106.78 208.36 176.42 385.80 551.85 579.70 205.50 323.75 406.82 582.55 688.22 708.41
WSS57.00 210.20 96.78 337.14 640.65 1250.18 1058.53 2314.80 3311.10 3478.21 1232.99 1942.50 2440.93 3495.31 4129.32 4250.46
AIC30.30 39.44 34.01 42.74 47.24 51.92 50.75 56.23 58.74 59.08 51.82 55.00 56.60 59.11 60.28 60.48
MSC1.70 0.79 1.67 0.32 −0.52 −1.47 −1.19 −1.15 −1.97 −1.97 −0.80 −1.68 −1.69 −1.95 −2.52 −2.36
K5.67 7.97 7.24 8.63 9.53 10.79 10.43 15.71 16.26 16.56 12.48 13.12 14.65 16.60 16.78 17.07
T1/277.75 39.37 47.69 33.54 27.54 21.47 22.97 10.13 9.45 9.12 16.05 14.52 11.64 9.07 8.88 8.58
R2: coefficients of determination, MSE: the mean square error, WSS: the weighted sum of squares, AIC: Akaike information criterion, MSC: model selection criterion (Table 4).
The following step was a characterization of the release curves and establishment of the kinetic parameters. As the Weibull model was the best fitting model, the parameters of this model were determined and interpreted as seen in Table 3. The two non-linear model parameters are α and β. The scale factor α corresponds to the time scale of the process, which can be expressed by the more informative dissolution time, Td, that is defined by α = (Td)β. Td represents the time interval necessary to dissolve or release 63.2% of the drug [29]. In addition, the Weibull model t½ values for all the samples were determined. The second Weibull parameter is β, which describes the shape of the profile: exponential (β = 1; case 1), sigmoid (β > 1; case 2) or parabolic (β < 1; case 3) [23]. As for the time scale α, Td and t½ parameters, it was clear that all Tel-SSDs showed a general decrease in the time scale values when compared to the plain drug. Thus, all Tel-SSDs had a faster release than the plain Tel. The fastest formula was F14 with 1.39, 2.31 and 0.91 min for α, Td and t½ values, respectively. On the other hand, all tested samples releasing profiles were of the parabolic type; case 3 i.e., (β < 1).
Further dissolution profile comparison was done using model-independent approaches as seen in Table 5. This includes the following parameters; difference factor f1 [30], which is proportional to the average difference between two profiles, similarity factor f2 [31], which is inversely proportional to the average squared difference between two profiles, difference factor modified by Costa f1’ and Rescigno index (ξ1 and ξ2) [32]. Consequently, other parameters include: difference in similarity Sd [23], mean distance D1 and mean squared distance D2 parameters [33].
These parameters were used to assess the extent of similarity or difference between the dissolution profiles of Tel-SSDs verses the dissolution of the plain drug. It was evident that all Tel-SSDs showed a high degree of difference when compared with the plain Tel, whereas the highest degrees of difference were recorded with F15 followed by F14 with very marginal differences, seen in Table 5.
The final step in analyzing the dissolution data and release profiles was done to help select the best formula which caused the highest release rate enhancement. This was done by calculating the following dissolution parameters: the average percent dissolved after 15 min PD15 as well as after 45 min PD45, and area under the dissolution curve (AUC). Additionally, calculating the mean residence time of the drug molecules in the dosage form (MRT), mean dissolution time (MDT) [34] dissolution efficiency at 45 min (DE 45%) and dissolution efficiency at 60 min (DEall%) [17].
As seen in Table 6 and Figure 5, formula F15 and F14 had the highest average percent of drug dissolved PD15, PD45, the largest AUC, the lowest MRT and MDT with the highest DE45% as well as DEall%.
Finally, by analyzing and interpreting different dissolution parameters, it was clear that formulae F15 and F14 delivered the highest enhancement effect on Tel dissolution and release rates.

3.8. Differential Scanning Calorimetry (DSC)

The thermogram pattern of telmisartan was typical of a highly crystalline compounds, characterized by a sharp endothermic peak at 268.34 °C with an onset at 260.54 °C and an endset at 270.19 °C corresponding to its melting endotherm, seen in Figure 6A. The thermal behavior of PEG 6000, Poloxamer 407 (D) and CCS exhibited endothermic peaks at 50.47 °C, 55.24 °C, and broad endothermic peaks respectively. As for the optimized formulae (F14 and F15), it was clear that the telmisartan endothermic peak shifted towards lower melting temperatures and showed more broadness, asserting loss of crystallinity [35], shown in Figure 6E,F. Moreover, The DSC thermograms did not show any new peaks; all peaks are related to the carriers and the drug. Thus, we ascertain that no interactions occurred between the drug and the carrier systems.

3.9. Effect of Aging

To study the effect of aging on the selected samples, both drug content and dissolution profile comparison between fresh and aged samples were performed.
As shown in Table 7, very minor decreases in the drug content values of aged solid dispersions were found. The drug content results were subjected to an unpaired t-test (p-value 0.05), where there was no significant difference between the fresh and aged drug content results.
Additionally, the dissolution profiles also showed very minor changes, seen in Figure 7. Dissolution is considered a critical factor in assessing the effect of aging on the newly formed formulations as it has a direct effect on products’ bioavailability [36].
In accordance, to compare between the dissolution profiles of fresh and aged samples, all results were subjected to the pair-wise procedure, which includes the difference factor f1, similarity factor f2, difference factor modified by Costa f1′ and Rescigno index (ξ1 and ξ2), Table 7. The difference factor f1 values for F14 and F15 were 4.06 and 2.00, respectively. On the other hand, the similarity factor f2 values were 69.64 and 75.94, respectively. For the dissolution profiles to be similar, the difference factor f1 value should be between (0–15), whereas the f2 value should lay between (50–100). As for the difference factor modified by Costa f1′, it has no specific value range; however, similar profiles tend to have low f1′ while dissimilar profiles have high f1′ values [29]. Considering the Rescigno index (ξ1 and ξ2), this index always presents values between 0 and 1. This index is 0 when the two release profiles are identical [32]. Thereby, the difference factor modified by Costa f1′ and Rescigno index (ξ1 and ξ2) results showed similarities between the fresh and aged dissolution profiles. Summing up the pair-wise procedure results, it was obvious that there were no clear changes in the dissolution profiles. Consequently, the absence of dissolution changes provides very important evidence to ensure products stability during aging.

4. Conclusions

Solid dispersion was achieved by the incorporation of the drug into hydrophilic carriers (PEG4000, PVP K30 &poloxamer 407) or superdisintegrant carriers (croscarmellose, crospovidone & sodium starch) or a combination between hydrophilic carriers and superdisintegrant carriers. The drug solution then absorbed onto the surface of extremely fine carrier (aerosil) to increase its surface area and to form the primary and combined SSD. All test samples showed an increase in telmisartan solubility as the deposition of the drug on the surface of an inert carrier led to reduction in the particle size of the drug. The solubilization and wetting effect of the carriers and superdisintegrant thereby increased telmisartan solubility.
Solubility studies in different media at different pH indicated that a phosphate buffer pH 7.4 and SLS enhanced drug solubility and maintained a sink condition in the respective dissolution media.
All prepared SSDs were capable of enhancing the dissolution behavior of telmisartan when compared with the pure drug, where the Combined SSD (C-SSD) strongly improved the dissolution rate over the Primary SSD (P-SSD). Additionally, the enhancement in the dissolution rate of telmisartan from Primary SSD (P-SSD) using hydrophilic carrier (Poloxamer 407, PEG 4000 and PVP K30) was more than the superdisintegrant carrier (Croscarmellose sodium, sodium starch glycolate and crospovidone).
The C-SSD formulae (F14 and F15) combination of Croscarmellose sodium with PEG 4000 or Poloxamer 407 as a carrier demonstrated lower MDT values and higher DE% in comparison to other formulae and were therefore selected as the optimized formula for further investigation.
The formulated SSDs showed good stability upon aging, which was reflected in the drug content percentage and the dissolutions rates when compared to freshly prepared formulae.

Author Contributions

Conceptualization, M.F.E.-M.; methodology, M.E.-N. and R.A.A.; software, H.M.S.A. and A.A.T.; validation, M.E.-N., R.A.A.; formal analysis, H.M.S.A.; investigation, H.M.S.A.; data curation, R.T. and A.A.T.; writing—original draft preparation, H.M.S.A.; writing—review and editing, R.T.; R.A.A. and A.A.T.; visualization, H.M.S.A.; supervision, M.E.-N., R.T. and R.A.A.; project administration, M.F.E.-M.; funding acquisition, H.M.S.A. All authors have read and agreed to the published version of the manuscript.

Funding

This research received no external funding.

Institutional Review Board Statement

Not applicable.

Informed Consent Statement

Not applicable.

Data Availability Statement

Not applicable.

Conflicts of Interest

The authors declare no conflict of interest.

References

  1. Roth, G.A.; Mensah, G.A.; Johnson, C.O.; Addolorato, G.; Ammirati, E.; Baddour, L.M.; Barengo, N.C.; Beaton, A.Z.; Benjamin, E.J.; Benziger, C.P.; et al. Global burden of cardiovascular diseases and risk factors, 1990–2019: Update from the gbd 2019 study. J. Am. Coll. Cardiol. 2020, 76, 2982–3021. [Google Scholar] [CrossRef] [PubMed]
  2. Giri, B.R.; Kwon, J.; Vo, A.Q.; Bhagurkar, A.M.; Bandari, S.; Kim, D.W. Hot-melt extruded amorphous solid dispersion for solubility, stability, and bioavailability enhancement of telmisartan. Pharmaceuticals 2021, 14, 73. [Google Scholar] [CrossRef] [PubMed]
  3. Wienen, W.; Entzeroth, M.; van Meel, J.C.A.; Stangier, J.; Busch, U.; Ebner, T.; Schmid, J.; Lehmann, H.; Matzek, K.; Kempthorne-Rawson, J.; et al. A review on telmisartan: A novel, long-acting angiotensin ii-receptor antagonist. Cardiovasc. Drug Rev. 2000, 18, 127–154. [Google Scholar] [CrossRef]
  4. Al-Japairai, K.A.S.; Alkhalidi, H.M.; Mahmood, S.; Almurisi, S.H.; Doolaanea, A.A.; Al-Sindi, T.A.; Chatterjee, B. Lyophilized amorphous dispersion of telmisartan in a combined carrier–alkalizer system: Formulation development and in vivo study. ACS Omega 2020, 5, 32466–32480. [Google Scholar] [CrossRef] [PubMed]
  5. Kundu, S.; Kumari, N.; Soni, S.R.; Ranjan, S.; Kumar, R.; Sharon, A.; Ghosh, A. Enhanced solubility of telmisartan phthalic acid cocrystals within the ph range of a systemic absorption site. ACS Omega 2018, 3, 15380–15388. [Google Scholar] [CrossRef] [PubMed] [Green Version]
  6. Bhujbal, S.V.; Mitra, B.; Jain, U.; Gong, Y.; Agrawal, A.; Karki, S.; Taylor, L.S.; Kumar, S.; Zhou, Q. Pharmaceutical amorphous solid dispersion: A review of manufacturing strategies. Acta Pharm. Sin. B 2021, 11, 2505–2536. [Google Scholar] [CrossRef]
  7. Frank, D.; Schenck, L.; Koynov, A.; Su, Y.; Li, Y.; Variankaval, N. Optimizing solvent selection and processing conditions to generate high bulk-density, co-precipitated amorphous dispersions of posaconazole. Pharmaceutics 2021, 13, 2017. [Google Scholar] [CrossRef]
  8. Iyer, R.; Petrovska Jovanovska, V.; Berginc, K.; Jaklič, M.; Fabiani, F.; Harlacher, C.; Huzjak, T.; Sanchez-Felix, M.V. Amorphous solid dispersions (asds): The influence of material properties, manufacturing processes and analytical technologies in drug product development. Pharmaceutics 2021, 13, 1682. [Google Scholar] [CrossRef]
  9. Vasconcelos, T.; Sarmento, B.; Costa, P. Solid dispersions as strategy to improve oral bioavailability of poor water soluble drugs. Drug Discov. Today 2007, 12, 1068–1075. [Google Scholar] [CrossRef]
  10. Vo, C.L.-N.; Park, C.; Lee, B.-J. Current trends and future perspectives of solid dispersions containing poorly water-soluble drugs. Eur. J. Pharm. Biopharm. 2013, 85, 799–813. [Google Scholar] [CrossRef]
  11. Sandeep, D.; Vidyadhara, S.; Sailaja, Y.; Lakshmi, B.S.; Vanya, N. Formulation and evaluation of atorvastatin solid dispersions using entada scandens seed starch as superdisintegrant. Res. J. Pharm. Technol. 2021, 14, 5141–5149. [Google Scholar]
  12. Qushawy, M.; Nasr, A.; Swidan, S.; Mortagi, Y. Development and characterization of glimepiride novel solid nanodispersion for improving its oral bioavailability. Sci. Pharm. 2020, 88, 52–69. [Google Scholar] [CrossRef]
  13. Ismail, E.A.; Elamin, E.S.; Ahmed, E.M.M.; Abdelrahman, M. Enhancement of aqueous solubility of meloxicam using solid dispersions based on ziziphus spina-christi gums. Drug Des. 2021, 10, 188. [Google Scholar]
  14. Rohrs, B. Dissolution method development for poorly soluble compounds. Dissolution Technol. 2001, 8, 6–12. [Google Scholar] [CrossRef]
  15. Ha, E.S.; Kim, J.S.; Baek, I.H.; Yoo, J.W.; Jung, Y.; Moon, H.R.; Kim, M.S. Development of megestrol acetate solid dispersion nanoparticles for enhanced oral delivery by using a supercritical antisolvent process. Drug Des. Dev. Ther. 2015, 9, 4269–4277. [Google Scholar]
  16. Rane, Y.; Mashru, R.; Sankalia, M.; Sankalia, J. Effect of hydrophilic swellable polymers on dissolution enhancement of carbamazepine solid dispersions studied using response surface methodology. AAPS PharmSciTech 2007, 8, 27. [Google Scholar] [CrossRef] [Green Version]
  17. Dastmalchi, S.; Garjani, A.; Maleki, N.; Sheikhee, G.; Baghchevan, V.; Jafari-Azad, P.; Valizadeh, H.; Barzegar-Jalali, M. Enhancing dissolution, serum concentrations and hypoglycemic effect of glibenclamide using solvent deposition technique. J. Pharm. Pharm. Sci. 2005, 8, 175–181. [Google Scholar]
  18. Zhang, Y.; Huo, M.; Zhou, J.; Zou, A.; Li, W.; Yao, C.; Xie, S. Ddsolver: An add-in program for modeling and comparison of drug dissolution profiles. AAPS J. 2010, 12, 263–271. [Google Scholar] [CrossRef] [Green Version]
  19. Hambisa, S.; Yohannes, S.; Suleman, S. In vitro comparative quality assessment of different brands of norfloxacin tablets available in jimma, southwest ethiopia. Drug Des. Dev. Ther. 2019, 13, 1241–1249. [Google Scholar] [CrossRef] [Green Version]
  20. Lokhandwala, H.; Deshpande, A.; Deshpande, S. Kinetic modeling and dissolution profiles comparison: An overview. Int. J. Pharma Bio Sci. 2013, 4, 728–737. [Google Scholar]
  21. Higuchi, T. Mechanism of sustained-action medication. Theoretical analysis of rate of release of solid drugs dispersed in solid matrices. J. Pharm. Sci. 1963, 52, 1145–1149. [Google Scholar] [CrossRef] [PubMed]
  22. Hameed, H.A.; Khan, S.; Shahid, M.; Ullah, R.; Bari, A.; Ali, S.S.; Hussain, Z.; Sohail, M.; Khan, S.U.; Htar, T.T. Engineering of naproxen loaded polymer hybrid enteric microspheres for modified release tablets: Development, characterization, in silico modelling and in vivo evaluation. Drug Des. Dev. Ther. 2020, 14, 27–41. [Google Scholar] [CrossRef] [PubMed] [Green Version]
  23. Adams, E.; Coomans, D.; Smeyers-Verbeke, J.; Massart, D.L. Non-linear mixed effects models for the evaluation of dissolution profiles. Int. J. Pharm. 2002, 240, 37–53. [Google Scholar] [CrossRef]
  24. Karagianni, A.; Kachrimanis, K.; Nikolakakis, I. Co-amorphous solid dispersions for solubility and absorption improvement of drugs: Composition, preparation, characterization and formulations for oral delivery. Pharmaceutics 2018, 10, 98. [Google Scholar] [CrossRef] [Green Version]
  25. Sangwai, M.; Vavia, P. Amorphous ternary cyclodextrin nanocomposites of telmisartan for oral drug delivery: Improved solubility and reduced pharmacokinetic variability. Int. J. Pharm. 2013, 453, 423–432. [Google Scholar] [CrossRef]
  26. Markl, D.; Zeitler, J.A. A review of disintegration mechanisms and measurement techniques. Pharm. Res. 2017, 34, 890–917. [Google Scholar] [CrossRef] [Green Version]
  27. Quodbach, J.; Kleinebudde, P. Systematic classification of tablet disintegrants by water uptake and force development kinetics. J. Pharm. Pharmacol. 2014, 66, 1429–1438. [Google Scholar] [CrossRef]
  28. Quodbach, J.; Kleinebudde, P. Performance of tablet disintegrants: Impact of storage conditions and relative tablet density. Pharm. Dev. Technol. 2015, 20, 762–768. [Google Scholar] [CrossRef]
  29. Costa, P.; Sousa Lobo, J.M. Modeling and comparison of dissolution profiles. Eur. J. Pharm. Sci. 2001, 13, 123–133. [Google Scholar] [CrossRef]
  30. Uebbing, L.; Klumpp, L.; Webster, G.K.; Löbenberg, R. Justification of disintegration testing beyond current fda criteria using in vitro and in silico models. Drug Des. Dev. Ther. 2017, 11, 1163–1174. [Google Scholar] [CrossRef] [Green Version]
  31. Lee, H.G.; Park, Y.S.; Jeong, J.H.; Kwon, Y.B.; Shin, D.H.; Kim, J.Y.; Rhee, Y.S.; Park, E.S.; Kim, D.W.; Park, C.W. Physicochemical properties and drug-release mechanisms of dual-release bilayer tablet containing mirabegron and fesoterodine fumarate. Drug Des. Dev. Ther. 2019, 13, 2459–2474. [Google Scholar] [CrossRef] [PubMed] [Green Version]
  32. Rescigno, A.; Marzo, A.; Thyroff-Friesinger, U. Mefenamic acid bioequivalence assessment with a new statistical procedure. Pharmacol. Res. 1996, 34, 149–152. [Google Scholar] [CrossRef] [PubMed]
  33. Cardot, J.M.; Roudier, B.; Schütz, H. Dissolution comparisons using a multivariate statistical distance (msd) test and a comparison of various approaches for calculating the measurements of dissolution profile comparison. AAPS J. 2017, 19, 1091–1101. [Google Scholar] [CrossRef]
  34. Podczeck, F. Comparison of in vitro dissolution profiles by calculating mean dissolution time (mdt) or mean residence time (mrt). Int. J. Pharm. 1993, 97, 93–100. [Google Scholar] [CrossRef]
  35. Liu, P.; Zhou, J.Y.; Chang, J.H.; Liu, X.G.; Xue, H.F.; Wang, R.X.; Li, Z.S.; Li, C.S.; Wang, J.; Liu, C.Z. Soluplus-mediated diosgenin amorphous solid dispersion with high solubility and high stability: Development, characterization and oral bioavailability. Drug Des. Dev. Ther. 2020, 14, 2959–2975. [Google Scholar] [CrossRef] [PubMed]
  36. Kate, V.K.; Payghan, S.A.; Shinde, A.J. Effect of aging conditions on the dissolution stability of piroxicam mucoadhesive fast disintegrating tablet. Inventi Rapid NDDS 2013, 2013, 1–6. [Google Scholar]
Figure 1. FT-IR of (A) Tel, (B) CCS, (C) physical mixture of Tel with CCS, (D) CP, (E) physical mixture of Tel with CP, (E) SSG, (F) physical mixture of Tel with SSG, (G) PVP k30, (H) physical mixture of Tel with PVP K30, (I) PEG 4000, (J) physical mixture of Tel with PEG 4000, (K) Poloxmer 407, (L) physical mixture of Tel with Poloxmer 407.
Scipharm 90 00071 g001
Figure 2. Optical microscope photographs of (A) plain Tel, (B) F8, (C) F9, (D) F14, and (E) F15.
Scipharm 90 00071 g002
Figure 3. Saturation aqueous solubility of Tel and Tel SSDs.
Scipharm 90 00071 g003
Figure 4. Dissolution profile of plain and Tel-SSDs.
Scipharm 90 00071 g004
Figure 5. Parameters for assessing the dissolution data of plain Tel and Tel SSDs (A) PD15 and PD45, (B) DE45% and DEAll%, (C) MRT and MDT, and (D) AUC.
Scipharm 90 00071 g005
Figure 6. Differential scanning calorimetry of (A) Tel, (B) PEG 4000, (C) Poloxamer 407, (D) CCS, (E) F14, (F) F15.
Scipharm 90 00071 g006
Figure 7. Dissolution profile of fresh and aged formulae.
Scipharm 90 00071 g007
Table 1. Tel SSDs composition, percentage yield, drug content percentage and saturation aqueous solubility.
CodeSSDs IngredientsRatio (T:S:H)% YieldDrug
Content%
Solubility (µg/mL)
Tel (T)Superdisintegrant (S)Hydrophilic Carrier (H)
P-SSDs
with (S)
F1T(SSG)-1:1:090.198.736.23
F2T(CP)-1:1:096.497.277.84
F3T(CCS)-1:1:090.898.735.44
P-SSDs
with (H)
F4T-PVP K301:0:192.7102.7311.37
F5T-PEG 40001:0:189.698.6410.29
F6T-Poloxamer 4071:0:195.4100.1912.35
C-SSDs combined carrierF7TSSGPVP K301:1:191.897.2719.60
F8TSSGPEG 40001:1:193.294.1524.96
F9TSSGPoloxamer 4071:1:194.996.9827.76
F10TCPPVP K301:1:195.2104.3921.13
F11TCPPEG 40001:1:190.6100.5823.07
F12TCPPoloxamer 4071:1:193.1101.8523.85
F13TCCSPVP K301:1:191.595.4220.77
F14TCCSPEG 40001:1:192.895.5226.70
F15TCCSPoloxamer 4071:1:193.397.6628.52
SSDs: surface solid dispersions, P-SSD: Primary Surface Solid Dispersions, C-SSDs: combined carrier-solid dispersions, SSG: sodium starch glycolate, CP: crospovidone, CCS: croscarmellose sodium.
Table 2. Solubility (cs) and relative sink conditions (cs/cd) of telmisartan at different dissolution media & different surfactant concentration on relative sink condition.
Different Dissolution MediaSolubility cs (μg/mL)Sink Condition cs/cd
Water 2.9310.07
Stimulated saliva Fluid pH 6.84.6470.12
Stimulated saliva Fluid pH 6.8 + 0.5% tween 8012.750.32
Stimulated saliva Fluid pH 6.8 + 1.0% tween 8018.230.46
Stimulated saliva Fluid pH 6.8 + 2.0% tween 8033.720.84
Stimulated saliva Fluid pH 6.8 + 3.0% tween 8025.820.65
Stimulated saliva Fluid pH 6.8 + 6.0% tween 8043.921.09
Stimulated saliva Fluid pH 6.8 + 1.5% SLS12.490.312
Stimulated saliva Fluid pH 6.8 + 2.0% SLS11.960.29
Phosphate buffer 7.44.840.12
Phosphate buffer 7.4 + 0.5% tween 8030.190.75
Phosphate buffer 7.4 + 1.0% tween 8054.901.37
Phosphate buffer 7.4 + 2.0% tween 80110.012.75
Phosphate buffer 7.4 + 0.5% SLS58.821.47
Phosphate buffer 7.4 + 1.0% SLS94.312.36
Phosphate buffer 7.4 + 1.5% SLS130.393.26
Table 4. Weibull models parameters.
ModelParameterTelF1F2F3F4F5F6F7F8F9F10F11F12F13F14F15
Weibullα11.10 6.47 8.86 5.31 3.82 2.58 2.89 2.36 1.67 1.76 2.76 1.93 1.85 1.84 1.39 1.66
Td294.28 114.2128.66 92.35 71.27 40.87 48.71 5.95 3.50 3.48 17.71 11.05 6.11 3.61 2.31 2.81
β0.42 0.39 0.45 0.37 0.31 0.26 0.27 0.48 0.41 0.45 0.35 0.27 0.34 0.47 0.40 0.49
T1/2123.84 45.04 56.89 34.19 22.17 9.76 12.73 2.78 1.43 1.56 6.28 2.88 2.09 1.67 0.91 1.33
Table 5. Parameters for assessing the similarity and difference between dissolution data of plain Tel versus Tel-SSDs.
Formulaf1f2f1’ξ1ξ2SdD1D2Description
F142.4045.7535.010.170.170.1611.9912.12Different
F227.6954.0924.320.130.130.107.828.22Different
F355.4540.0243.420.210.210.2015.6715.80Different
F474.0433.8554.040.260.260.2620.9221.02Different
F5100.2427.3266.770.320.320.3328.3228.40Different
F692.7528.9863.370.300.300.3126.2126.31Different
F7189.9413.4397.420.480.470.4953.6753.88Different
F8203.9111.95100.970.490.490.5157.6257.68Different
F9209.6111.34102.350.500.490.5259.2359.31Different
F10129.0121.8478.420.380.380.3836.4536.57Different
F11144.1819.4883.780.400.400.4240.7440.75Different
F12172.7415.5592.690.450.440.4648.8148.86Different
F13210.3511.26102.520.500.500.5259.4459.54Different
F14215.8710.72103.820.500.500.5360.9961.04Different
F15221.0110.19104.990.510.510.5462.4562.55Different
Table 6. Parameters for assessing the similarity and difference between dissolution data of plain Tel versus Tel-SSDs.
ParametersPD15PD45AUCMRTMDTDE45%DEAll%SD
Tel23.5335.661745.0527.84217.99119.9129.0840.01
F134.9349.262462.5526.70816.31530.2341.0430.05
F231.3745.832243.7526.95515.98824.537.3960.02
F339.2250.742663.2826.53416.09533.7444.3880.06
F444.6157.972987.5526.27311.24039.449.7930.01
F552.5764.093391.0825.9998.56647.4856.5180.08
F650.3762.383276.6826.1069.07344.8154.6110.01
F777.194.414929.5014.7439.40567.682.1580.08
F881.9995.965113.4313.5617.90774.65585.2240.04
F984.5697.555209.5011.5177.45375.673386.8250.01
F1060.9175.123894.3823.30311.70752.9464.9060.05
F1163.7377.944097.7823.17510.90160.45568.2960.02
F1273.9985.54582.1020.2629.72566.108376.3680.03
F1384.5697.795222.0311.2417.32775.5587.0340.06
F1486.497.925282.4511.1916.71779.57588.0410.01
F1586.3998.75379.358.3556.10479.5189.6560.02
Table 7. Drug content percentage before and after aging.
FormulaDrug Content%
before Aging
Drug Content%
after Aging
F1495.5294.38 n.s
F1597.6696.03 n.s
n.s: non-significant.
Publisher’s Note: MDPI stays neutral with regard to jurisdictional claims in published maps and institutional affiliations.

