Article

Phytochemical Standardization of an Extract Rich in Flavonoids from Flowers of Kalanchoe pinnata (Lam) Pers

by
Wilson Leonardo Villarreal Romero
,
Jorge Eliecer Robles Camargo
and
Geison Modesti Costa
*
Department of Chemistry, Faculty of Sciences, Pontificia Universidad Javeriana, Bogotá 110231, Colombia
*
Author to whom correspondence should be addressed.
Sci. Pharm. 2023, 91(4), 50; https://doi.org/10.3390/scipharm91040050
Submission received: 4 September 2023 / Revised: 25 October 2023 / Accepted: 25 October 2023 / Published: 2 November 2023

Abstract

:
Kalanchoe pinnata is a species widely used in traditional medicine in Latin America and southern Africa. This species has been reported to have different activities, such as antioxidant, anti-inflammatory, and cytotoxic, the latter being related to its flavonoid content. The aim of this study was to contribute to the standardization of the aqueous extract of flowers from Kalanchoe pinnata. Purification of chemical markers was carried out by centrifugal partition chromatography (CPC). Stability tests under stress conditions were conducted for the extract by using the chromatographic profiles analyzed by ultra-performance liquid chromatography coupled to photodiode array detection (UPLC-PDA) and ultra-high-performance liquid chromatography combined with quadrupole-time of flight–mass spectrometry (UHPLC-MS-QTOF), with quantification of flavonoids by a validated UPLC-PDA method. Physicochemical variables of the plant material were within the limits established by official guides. Thirteen flavonoids present in the extract were identified, the major compounds being quercetin 3-O-α-L-arabinopyranosyl-(1→2)-α-L-rhamnopyranoside and quercetin 3-O-D-glucuronide, purified by CPC. A range of total flavonoids for the extract from 8–13% was determined. Finally, through stability tests, it was observed that the extract was stable in most conditions but evidenced moderate degradations upon acid and basic hydrolysis. Through qualitative and quantitative chemical characterizations, it was possible to chemically standardize the aqueous extract of flowers from K. pinnata, with a high content of flavonoids, under parameters required by the WHO and pharmacopoeias.

Graphical Abstract

1. Introduction

In Latin America, and more specifically in Colombia, a multitude of plants are documented for their medicinal properties, potentially harboring active ingredients with diverse therapeutic applications [1,2]. One of them is the species Kalanchoe pinnata (Lam.) Pers (syn. Bryophyllum pinnatum, (Lam.) Oken), which has been used in traditional medicine to treat bacterial, fungal, and viral infections, as well as asthma, kidney stones, inflammatory problems, and ulcers; additionally, its activity has been evaluated as anti-inflammatory [3], immunosuppressant, nephroprotective [4], antihypertensive [5], antimicrobial [6], antileishmanial [7], healing [8], anthelmintic [9], analgesic, anticonvulsant [10], and antitumor [11,12,13]. K. pinnata has proven to be a promising medicinal species with multiple reported properties, which have not yet been fully described [14,15].
In chemical studies, its leaves have been reported to contain compounds of the type bufadienolide cardiotonic glycoside with a steroid nucleus, and glycosylated flavonoids of the flavonol type such as quercetin 3-O-α-L-rhamnopyranoside (quercitrin), kaempferol 3-O-α-L-arabinopyranosyl (1→2) α-L-rhamnopyranoside (kapinnatoside), quercetin 3-O-α-L-arabinopyranosyl (1→2) α-L-rhamnopyranoside (described as the major component), kaempferol, and 4′,5-dihydroxy-3′,8-dimethoxyflavone 7-O-β-D-glucopyranoside; pharmacological activities have been attributed to some of them [3,7,13,14,15,16,17,18]. On the other hand, its flowers have been less studied; however, it is known that there is a presence of phenolic acids such as 4-hydroxybenzoic acid, p-hydroxycinnamic acid, para-coumaric acid, ferulic acid, and flavonoids, mainly glycosylated flavonols [12,14]. In addition, it has been determined that flowers have a higher content (% w/w) of total flavonoids compared to leaves [14].
Given the pharmacological potential of flavonoids, and as an initial step towards standardizing a flower extract, various quality control parameters for both the plant material and the extract have been characterized. These parameters are essential prerequisites for its potential utilization in phytotherapeutic applications. Some of these determined parameters were total ash, foreign matter, loss on drying, and particle size. Likewise, according to the United States Food and Drug Administration (FDA), the European Agency for the Evaluation of Medications (EMEA), and the WHO, the characterized parameters are aimed at reducing variability in terms of concentration of the components through standardization, understanding this as the establishment of parameters in a given process that allows the obtaining of a constant and stable amount of active ingredients in a certain time [7,19,20,21,22,23,24,25,26,27]. The objective of this study consisted of the standardization of an extract rich in flavonoids from flowers of Kalanchoe pinata through the characterization of some physicochemical and chemical aspects.

2. Materials and Methods

2.1. Plant Material

The flowers of K. pinnata were obtained in the municipality of Villa de Leyva, Department of Boyacá, Colombia (5°39′15.6″ N–73°34′38.1″ W). The collection was carried out under the Permission of Pontificia Universidad Javeriana (Resolution No. 00778, of 7 July 2017—ANLA). The voucher specimen was identified by Dr. Nestor Garcia and was deposited in the herbarium collection of the Pontificia Universidad Javeriana, Bogotá D.C (HPUJ-30749). In total, three collections were made at three different times; the first collection was made in November 2019; the second, in December 2020; and the third, in January 2021.

2.2. Physicochemical Characterization of Plant Material

Some of the physicochemical and pharmacognostic variables were defined according to the parameters established in quality control by the WHO and the following pharmacopoeias: Brazilian (5th ed.), American (USP 30), and European (8th ed.). These variables include the determination of foreign matter, determination of total ash, humidity percentage (loss on drying), and particle size [28,29,30,31,32,33].

2.3. Chemical Composition of the Aqueous Extract of K. pinnata Flowers

The dried and ground material was extracted employing the infusion technique with boiling water for 15 min (in a ratio of 1:25 m/v (g:mL, plant:solvent), taking into account that expected active compounds for this species are polar [3]. The extracts obtained were analyzed using ultra-performance liquid chromatography coupled to a Diode Array Detector (UPLC-PDA), and coupled to a mass spectrometer (UHPLC-MS-QToF). Samples were prepared at a concentration of 3 mg mL−1 (methanol:water, 1:1 v/v), and filtered through 0.22 µm PTFE membrane filters.
The elution conditions described by [7,15] were adjusted to UPLC-PDA using Waters Acquity® UPLC Calculator software and were subsequently optimized. Thus, an analysis was performed using a Phenomenex Kinetex® EVO C18 column (100 mm × 2.1 mm; 2.6 µm) at 26 °C. As the mobile phase, a gradient of acetonitrile and 0.1% formic acid in water was used, with a flow of 0.33 mL min−1 and an injection volume of 2.2 µL. Detection was performed at 254 nm, with a UV spectrum obtained between 200 and 600 nm. In the case of UHPLC-MS-QToF analysis, Shimadzu® Nexera X2 LCMS-QToF 9030 equipment was used, with electrospray ionization (ESI), in negative mode, in the range of 100–1000 m/z. Regarding the identification of the compounds, it was done based on their UV spectra, mass spectra, and retention times [3,18,33,34].

2.4. Separation by Centrifugal Partition Chromatography (CPC)

For the separation of the major compounds, a centrifugal partition chromatography (CPC) system was used in PLC-CPC 2250–250® equipment with UV/Vis detection, quaternary pump, automatic fraction collector, manual injector, and rotor of 250 mL, with embedded Gilson Glinder Prep software. Different solvent systems were evaluated; we analyzed the partition coefficient (Kp) visually by Thin Layer Chromatography (TLC). This procedure was developed following the “shake-flask” method, which consists of dissolving a small amount of extract in a biphasic system by shaking for 30 s, and a subsequent analysis of the distribution of the analytes of interest by TLC in each of the 2 phases [35]. Thereby, the systems described in the Supplementary Materials (Table S1) were tested.
The MeOAc:BuOH:H2O (2.5:2.5:5) biphasic system was selected and the upper phase was used as the stationary phase, which was injected in descending mode at 50 mL.min−1 and rotation of 500 rpm. For the filling of the mobile phase, the rotation speed was increased to 1500 rpm with a flow of 20 mL.min−1 until reaching hydrodynamic equilibrium, achieving retention of the stationary phase of 90%. Then, 1 g of the extract was injected dissolved in 10 mL of the lower phase (mobile phase). Subsequently, the fractions were monitored by UPLC-PDA at 254 and 350 nm.

2.5. Quantification of Total Flavonoids

2.5.1. Quantification by Colorimetric Method

The aluminum chloride (AlCl3) technique was used with rutin as the external standard. We established 6 calibration points: 5, 10, 20, 30, 40, and 50 μg mL−1, in methanol:water 1:1 (v/v). Regarding the extract, it was prepared at a concentration of 100 μg mL−1. To 1 mL of each solution, 0.5 mL of 2% (w/v) aluminum chloride in methanol and 0.5 mL of 1 M potassium acetate in methanol were added. Everything was set for a reaction at room temperature in the dark for 50 min, to later measure the absorbance in a UV-Vis spectrophotometer at 425 nm. With the results obtained, a calibration curve was made relating the absorbances obtained with the concentrations of the external standard. The analysis was performed in triplicate and the results were given in rutin equivalents (mg EQ Rutin/mg extract) [7,15,36,37].

2.5.2. Quantification by UPLC-PDA

The validation of the UPLC-PDA method for the quantification of flavonoids was carried out according to the technical requirements established by the validation guide for analytical procedures of the International Council for Harmonization for the registration of medicines for human use (ICH) [38]. Like the UV-Vis method, rutin stock solution in methanol:water 1:1 (v/v) with a concentration of 500 μg mL−1 was used, which was diluted to obtain 10 concentration solutions in a range between 400 μg.mL−1 and 0.1953 μg mL−1. The validation parameters evaluated in this study included linearity, repeatability (intra-day precision), intermediate precision (inter-day precision), accuracy (recovery), robustness, the limit of quantification (LOQ), and the limit of detection (LOD) [38]. All analyses were performed in triplicate.
Once the methodology was validated, the total flavonoids of 3 samples collected at different times (November 2019; December 2020; January 2021) were quantified. The quantification was carried out based on the external standard method, with a calibration curve, using rutin as standard. Ten calibration points were established, namely: 400, 300, 250, 200, 100, 50, 12.5, 3.125, 1.562, 0.195 μg mL−1, in methanol:water 1:1 (v/v). For the quantification of total flavonoids, the sum of all the areas of the peaks identified as flavonoids by means of their ultraviolet spectra was performed [3,7,34,36,39].

2.6. Extract Stability under Stress Conditions

Stability tests were carried out to observe the ability of the extract to preserve its chemical characteristics within specific limits (significant degradation between 20 and 80%). The tests were performed from 125 mg of the extract, as well as weighed exactly; also, the percentage of degradation was determined by the previously validated UPLC-PDA method. The stability was estimated based on the percentage of degradation of the flavonoids and the time they were exposed to controlled conditions of temperature, basicity, and acidity: conditions proposed in the methodology developed by Singh and Bakshi (2000). Depending on the severity of the conditions under which significant degradation was reached, the extract was classified into the following categories: practically stable, very stable, stable, labile, very labile, or extremely labile [40].
Additionally, in this assay, solid and solution samples of the extract were analyzed. Thus, 3 samples of 2.5 mg of dry extract were placed separately in closed vials. On the other hand, another 3 extract samples were solubilized with type I water, at a concentration of 5 mg mL−1, separately, in other closed vials. All the vials were stored in a refrigerator at 4 °C for 22 days. The solid samples were solubilized in MeOH:H2O (1:1), at a final concentration of 2.5 mg.mL−1; and for the samples in solution, 500 µL aliquots were taken and diluted with 500 µL of MeOH, to obtain a final concentration of 2.5 mg.mL−1. All samples were filtered on 0.22 µm filters and analyzed by UPLC-PDA [41].

3. Results and Discussion

3.1. Physicochemical Characterization of Dried Flowers of K. pinnata

The quality of a phytotherapeutic product or herbal preparation, such as extracts and crude drugs, depends significantly on the correct validation and description of its characteristics. This process ultimately contributes to the development of standardized products, enhancing their safety and efficacy in the medium and long term. Therefore, the plant material and the extract were characterized, which provides not only important information about the physicochemical properties, but also scientific support for potential medicinal purposes, either of the extract or an isolated compound [23,42].
The characterized parameters of the plant material, summarized in Table 1, were:
Foreign matter: in general, any material foreign to the organ of interest was considered foreign matter. The value obtained corresponding to foreign matter is within the limits specified in the pharmacopoeias (<2% m/m) [29,30]. Therefore, a high degree of purity can be estimated in the plant material. Humidity (lost by drying): the average humidity content is within the reported limits (8–14%), even though K. pinnata is a crassulaceous species, with succulent tissues, characterized by its high water retention [43]. With this measurement, a proper processing of the plant is confirmed, mainly in the drying procedure, thus avoiding possible enzymatic activity, microbiological contamination, and hydrolysis of its components, especially during storage [44,45,46]. Particle size distribution: it was possible to ascertain that more than 70% of the plant material was retained in the 500 µm sieve and less than 40% in the 250 µm sieve; therefore, and according to the WHO and Brazilian Pharmacopoeia classification, this material was classified as moderately coarse dust [29,32]. It is worth mentioning that this particle size was chosen for the extractive process. Determination of total ashes: the amount of ashes represents the residual mineral material present in plant tissues (physiological ashes) and, to a lesser ratio, in the foreign material attached to the plant [25]. This amount is within the values reported in the literature for general ash values in medicinal plants, being equal to or less than 12%, favoring the state of purity of the plant material. Higher percentages can mean external contamination (mostly dirt or sand) of the raw drug [45,46].

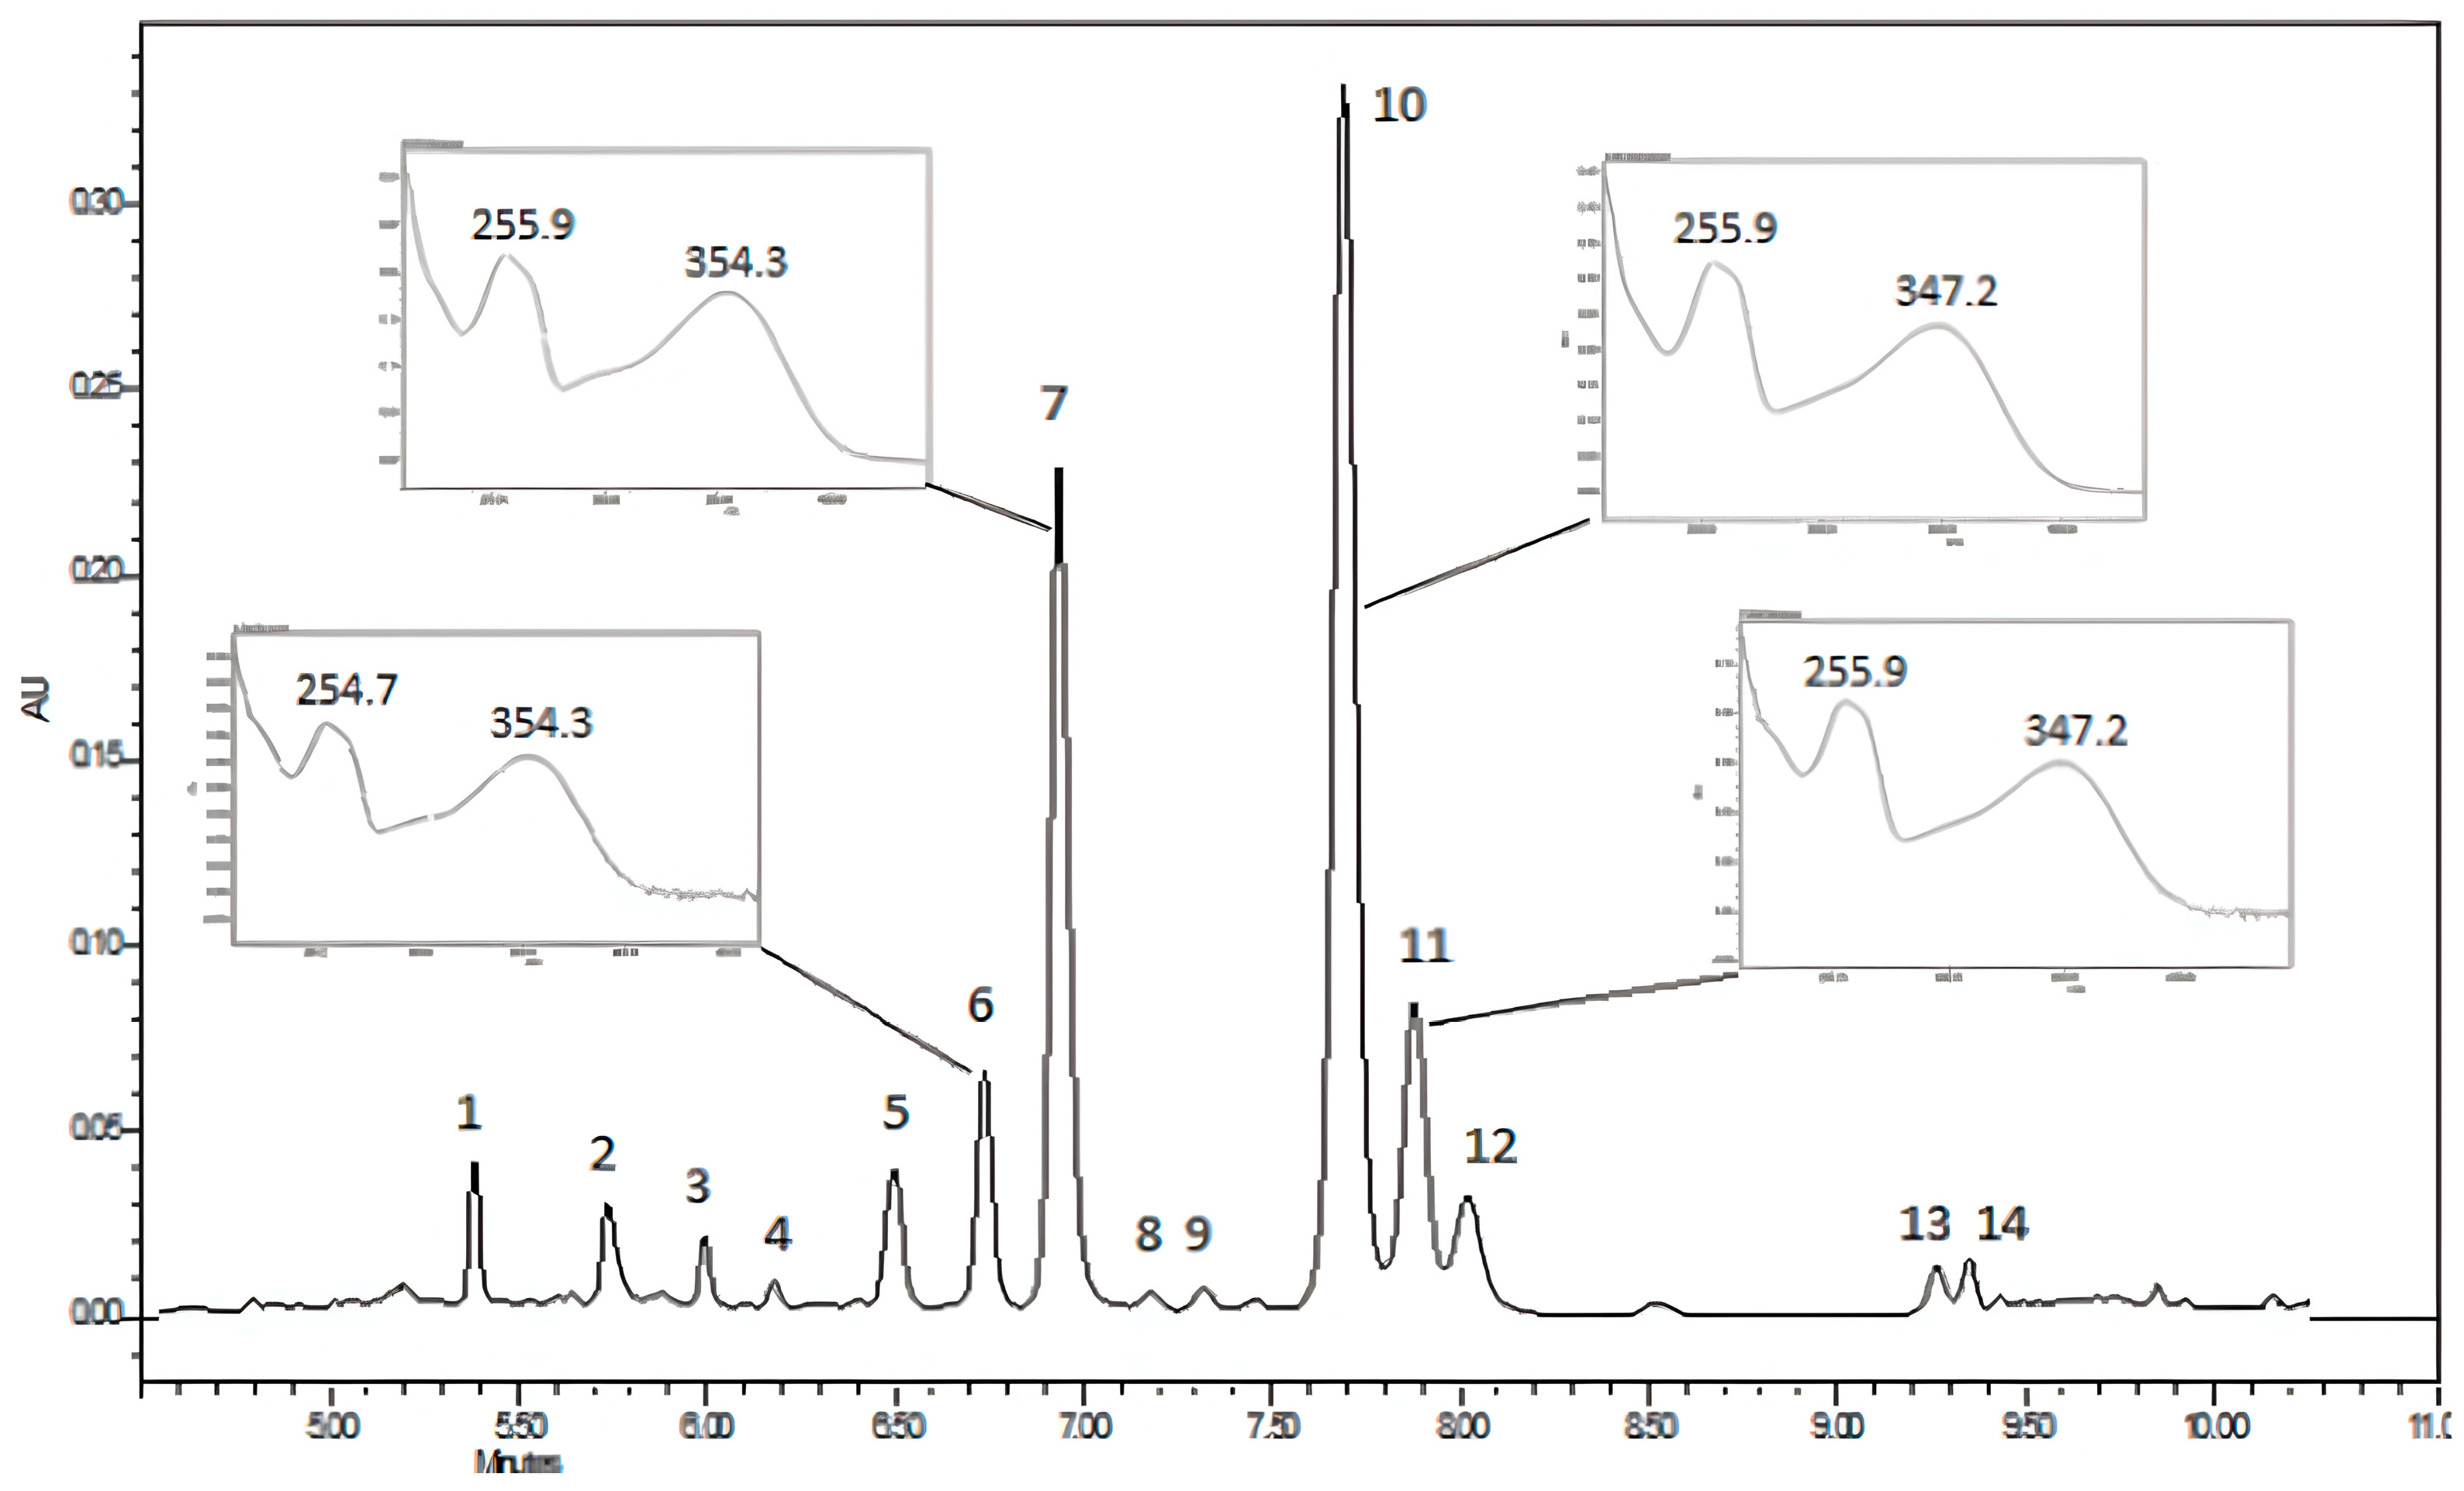
3.2. Chemical Composition of the Aqueous Extract of K. pinnata Flowers

In the UPLC chromatographic analysis, a good resolution of the peaks was achieved, based on a modification of the methodology proposed by Nascimento and co-workers [3]. In this chromatogram obtained from the crude extract, measured at 254 nm, 14 peaks corresponding to different compounds are observed, with peaks 7 and 10 being the major compounds, with retention times of 6.9 and 7.7 min, respectively (Figure 1). All the compounds were identified as flavonoids except peak 2, through their characteristic UV spectra for flavonoids and phenolic acids [15,47].
Subsequently, exact masses for each compound were obtained through UHPLC-MS-QTOF analysis and added to the UV spectra acquired via UPLC-PDA. A tentative identification of the compounds present in the extract was made; the latter are summarized in Table 2.
Accordingly, the presence of some flavonoids that had already been reported for this species is corroborated, both for leaves and flowers, mainly quercetin nucleus flavonols (peaks 5, 7, 8, 10, and 11) [14]. Furthermore, the presence of flavonols with a kaempferol nucleus (peaks 1, 5, 12, and 13), myricetin nucleus (peaks 3 and 6), isoramnetin nucleus (peak 9), and a flavone with an isoscoparin nucleus (peak 14) was confirmed. These compounds have not been previously reported for flowers in this species [7,14,18].
As for the major compound in the extract (peak 10), it exhibited a mass of [M–H] 579.1347 m/z and was identified as quercetin 3-O-α-L-arabinopyranosyl (1→2) α-L-rhamnopyranoside, which is a major compound in this species and is suggested as a chemical marker [7,18,57].

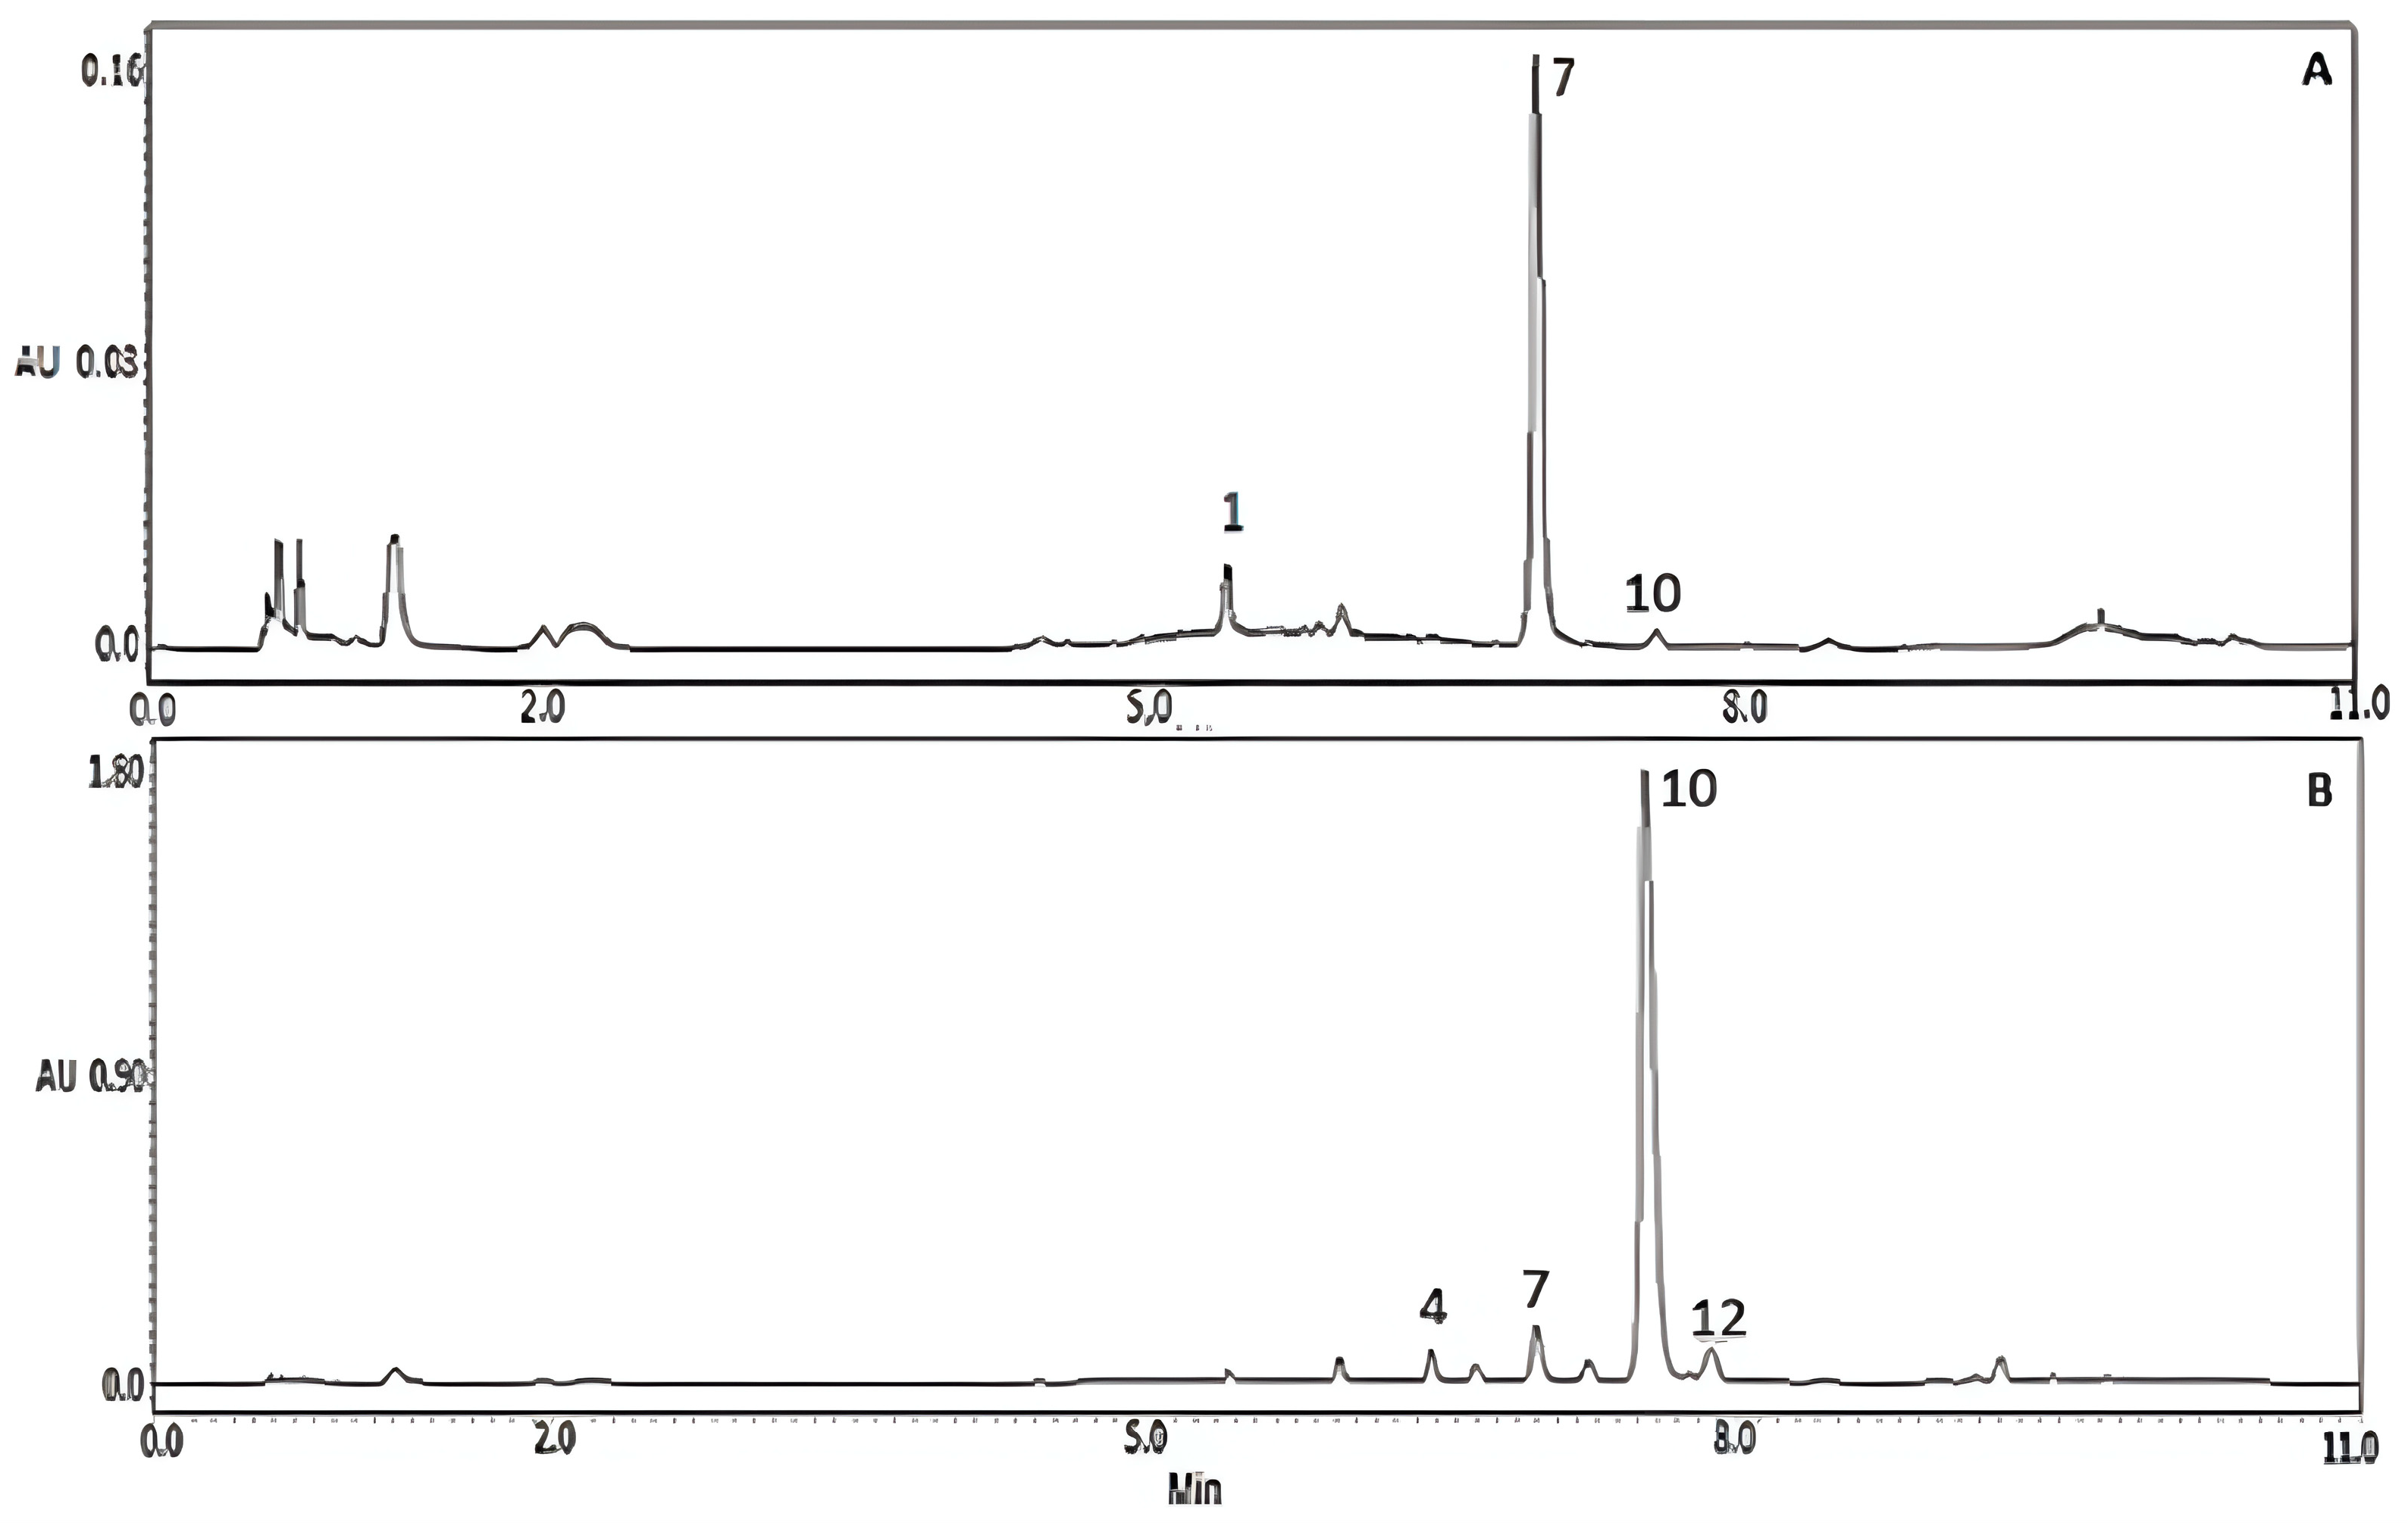
3.3. Purification of Major Compounds by Centrifugal Partition Chromatography (CPC)

To obtain the analytical marker in a purified form, which is the same major compound of the extract, the MeOAc:BuOH:H2O (2.5:2.5:5) solvent system was employed, and when analyzed by TLC, the presence of a single band was observed in fraction 11 (mass of fraction: 7.5 mg), 12 (6.9 mg), 13 (12.7 mg), 15 (2.5 mg), 16 (15.7 mg), as well as a mixture of two bands in fraction 14 (12.1 mg) (Figure S1).
The profile of the flavonoids present in these fractions, along with their purity, were analyzed by the validated UPLC-PDA method, where it was evidenced that fraction 13 (Figure 2A) presents a predominant flavonoid corresponding to the second major compound (quercetin 3-O-glucuronide, peak 7), with a purity percentage of 88.1%. Finally, for fraction 16, the predominant compound corresponding to the analytical marker quercetin 3-O-α-L-arabinopyranosyl (1→2)-α-L-rhamnopyranoside (peak 10) was obtained with a percentage of purity of 84.2% (Figure 2B). Mixtures of the different compounds were obtained in the other fractions.
Utilizing this biphasic solvent system was the technique that allowed the obtaining of fractions with major compounds with considerable percentages of purity directly from the crude extract in a single analysis of 30 min.

3.4. Quantification of Total Flavonoids

When analyzed by colorimetric method at UV-Vis at 425 nm, the extract presented a total flavonoid content of 10.306 ± 0.001 μg mL−1, and taking into account that the concentration of the extract sample was 100 μg mL−1, the value can be expressed as 0.103 ± 0.001 mg EQ-Rutin/mg lyophilized extract, a value that corresponds to 10.3 ± 0.01%. The results obtained are given in average percentage ± standard deviation (SD), n = 3, but do not present significant statistical differences; however, they do present relative standard deviation (RSD) < 10% (Table S2) and coefficient of determination (r2) ≥ 0.99, which translates into precision and linearity of the results.
The value obtained in this study is higher than the total flavonoid content reported for flowers and leaves with the same extraction methodology (infusion). Coutinho and coworkers reported a content of 3.24% (w/w) of total flavonoids in a flower extract and 2.61% for a leaf extract [14]. Meanwhile, in another study [15], the total flavonoid content was 2.70% for leaves. Therefore, it is considered that the content of flavonoids obtained in the aqueous extract of flowers in this study is moderately high.
In addition to colorimetric quantification, a total flavonoid quantification was also carried out using UPLC-PDA, based on the sum of all peaks identified as flavonoids through their UV-Vis spectra. This was done to enable the tracking of individual peaks. At first, a method validation was performed following the ICH Analytical Validation Procedures [38]. The parameters evaluated were linearity, precision, accuracy, robustness, and detection and quantification limits (Table 3), using rutin as an external standard.
The calibration curve had an RSD of less than 5%, which indicates a low dispersion between the data. Additionally, a good linear correlation was also obtained, expressed as the coefficient of determination (r2) of 0.9997. For precision, intra- and inter-day measurements presented RSD < 5%, in accordance with the guidelines [38]. Accuracy was measured by using the recovery method, with a recovery percentage of 102.3% established as an exact measure, since a value close to 100% is determined as accurate and a percentage greater than 80% is usually acceptable [58,59]. Both detection limit and the quantification limit were determined experimentally (visually, according to [38]) and theoretically using the SD of the blank.
Finally, robustness was evaluated through small modifications of the method, in terms of temperature, flow, and composition of the mobile phase; the ability of the method to resist these modifications under analytical conditions was determined. Considering that the retention time of the rutin standard in the validated method was 6.3 min, a variation in the retention time of less than 5% was obtained, with SD less than 0.3 min and RSD < 5% in the integration of the areas, in all conditions (Table 4). The obtained results showed that the greatest change regarding the retention time was related to the variation in the flow, retarding 0.5 min the rutin retention time (Figure 3).
The previous robustness tests were also carried out for the extract to verify its behavior against variations. It was evidenced that there are indeed no significant variations in the chromatograms, except for the variable temperature (25 °C), which tends to join peaks 6 and 7 (Figure S2) but does not affect the quantification of total flavonoids. These results confirm the robustness of the developed method against deliberately induced variations.
Once the calibration curve was obtained with its respective linear equation, we proceeded to quantify the total flavonoids present in the extract. For such a purpose, the freeze-dried extract sample was injected in triplicate at a concentration of 3 mg mL−1, in methanol:water (1:1 v/v).
A content of 9.97 ± 0.17% was obtained, a very similar value to that obtained by UV-vis: 10.30%, using a comparative technique that allows us to estimate the content of total flavonoids more accurately.
The total flavonoid quantification values obtained were higher than the values reported by Muzitano and co-workers [7], where the maximum percentage of total flavonoids was 3.34 ± 0.05%. It was also evidenced that these values were higher than those reported for flowers in a different study [14], whose content was found to be 3.24%. Specifically, for the major flavonoids, regarding peaks 7 and 10 (quercetin 3-O-glucuronide and quercetin 3-O-α-L-arabinopyranosyl (1→2) α-L-rhamnopyranoside, respectively), the analysis of their percentage of the areas, in relation to the sum of all areas, indicated an amount of 2.48 ± 0.02% and 4.07 ± 0.02%, respectively (Table S3). The content of the major compound was higher than the amount reported by other authors, who reported contents of 1.87% for flowers, and 2.09% and 2.43% for leaves [7,14,35].
In order to analyze quantitative variations in the content of total flavonoids, and subsequently, establish a quality parameter, three different collections of plant material were carried out at three different times. The values obtained for total flavonoids of different samples collected are presented in Table 5.
It was verified that the content of total flavonoids was very similar for the three collections, with variations in their amounts of less than 2.5%, allowing us to establish a range of contents regarding the flavonoids present in the extract, ranging from 8 to 13%.

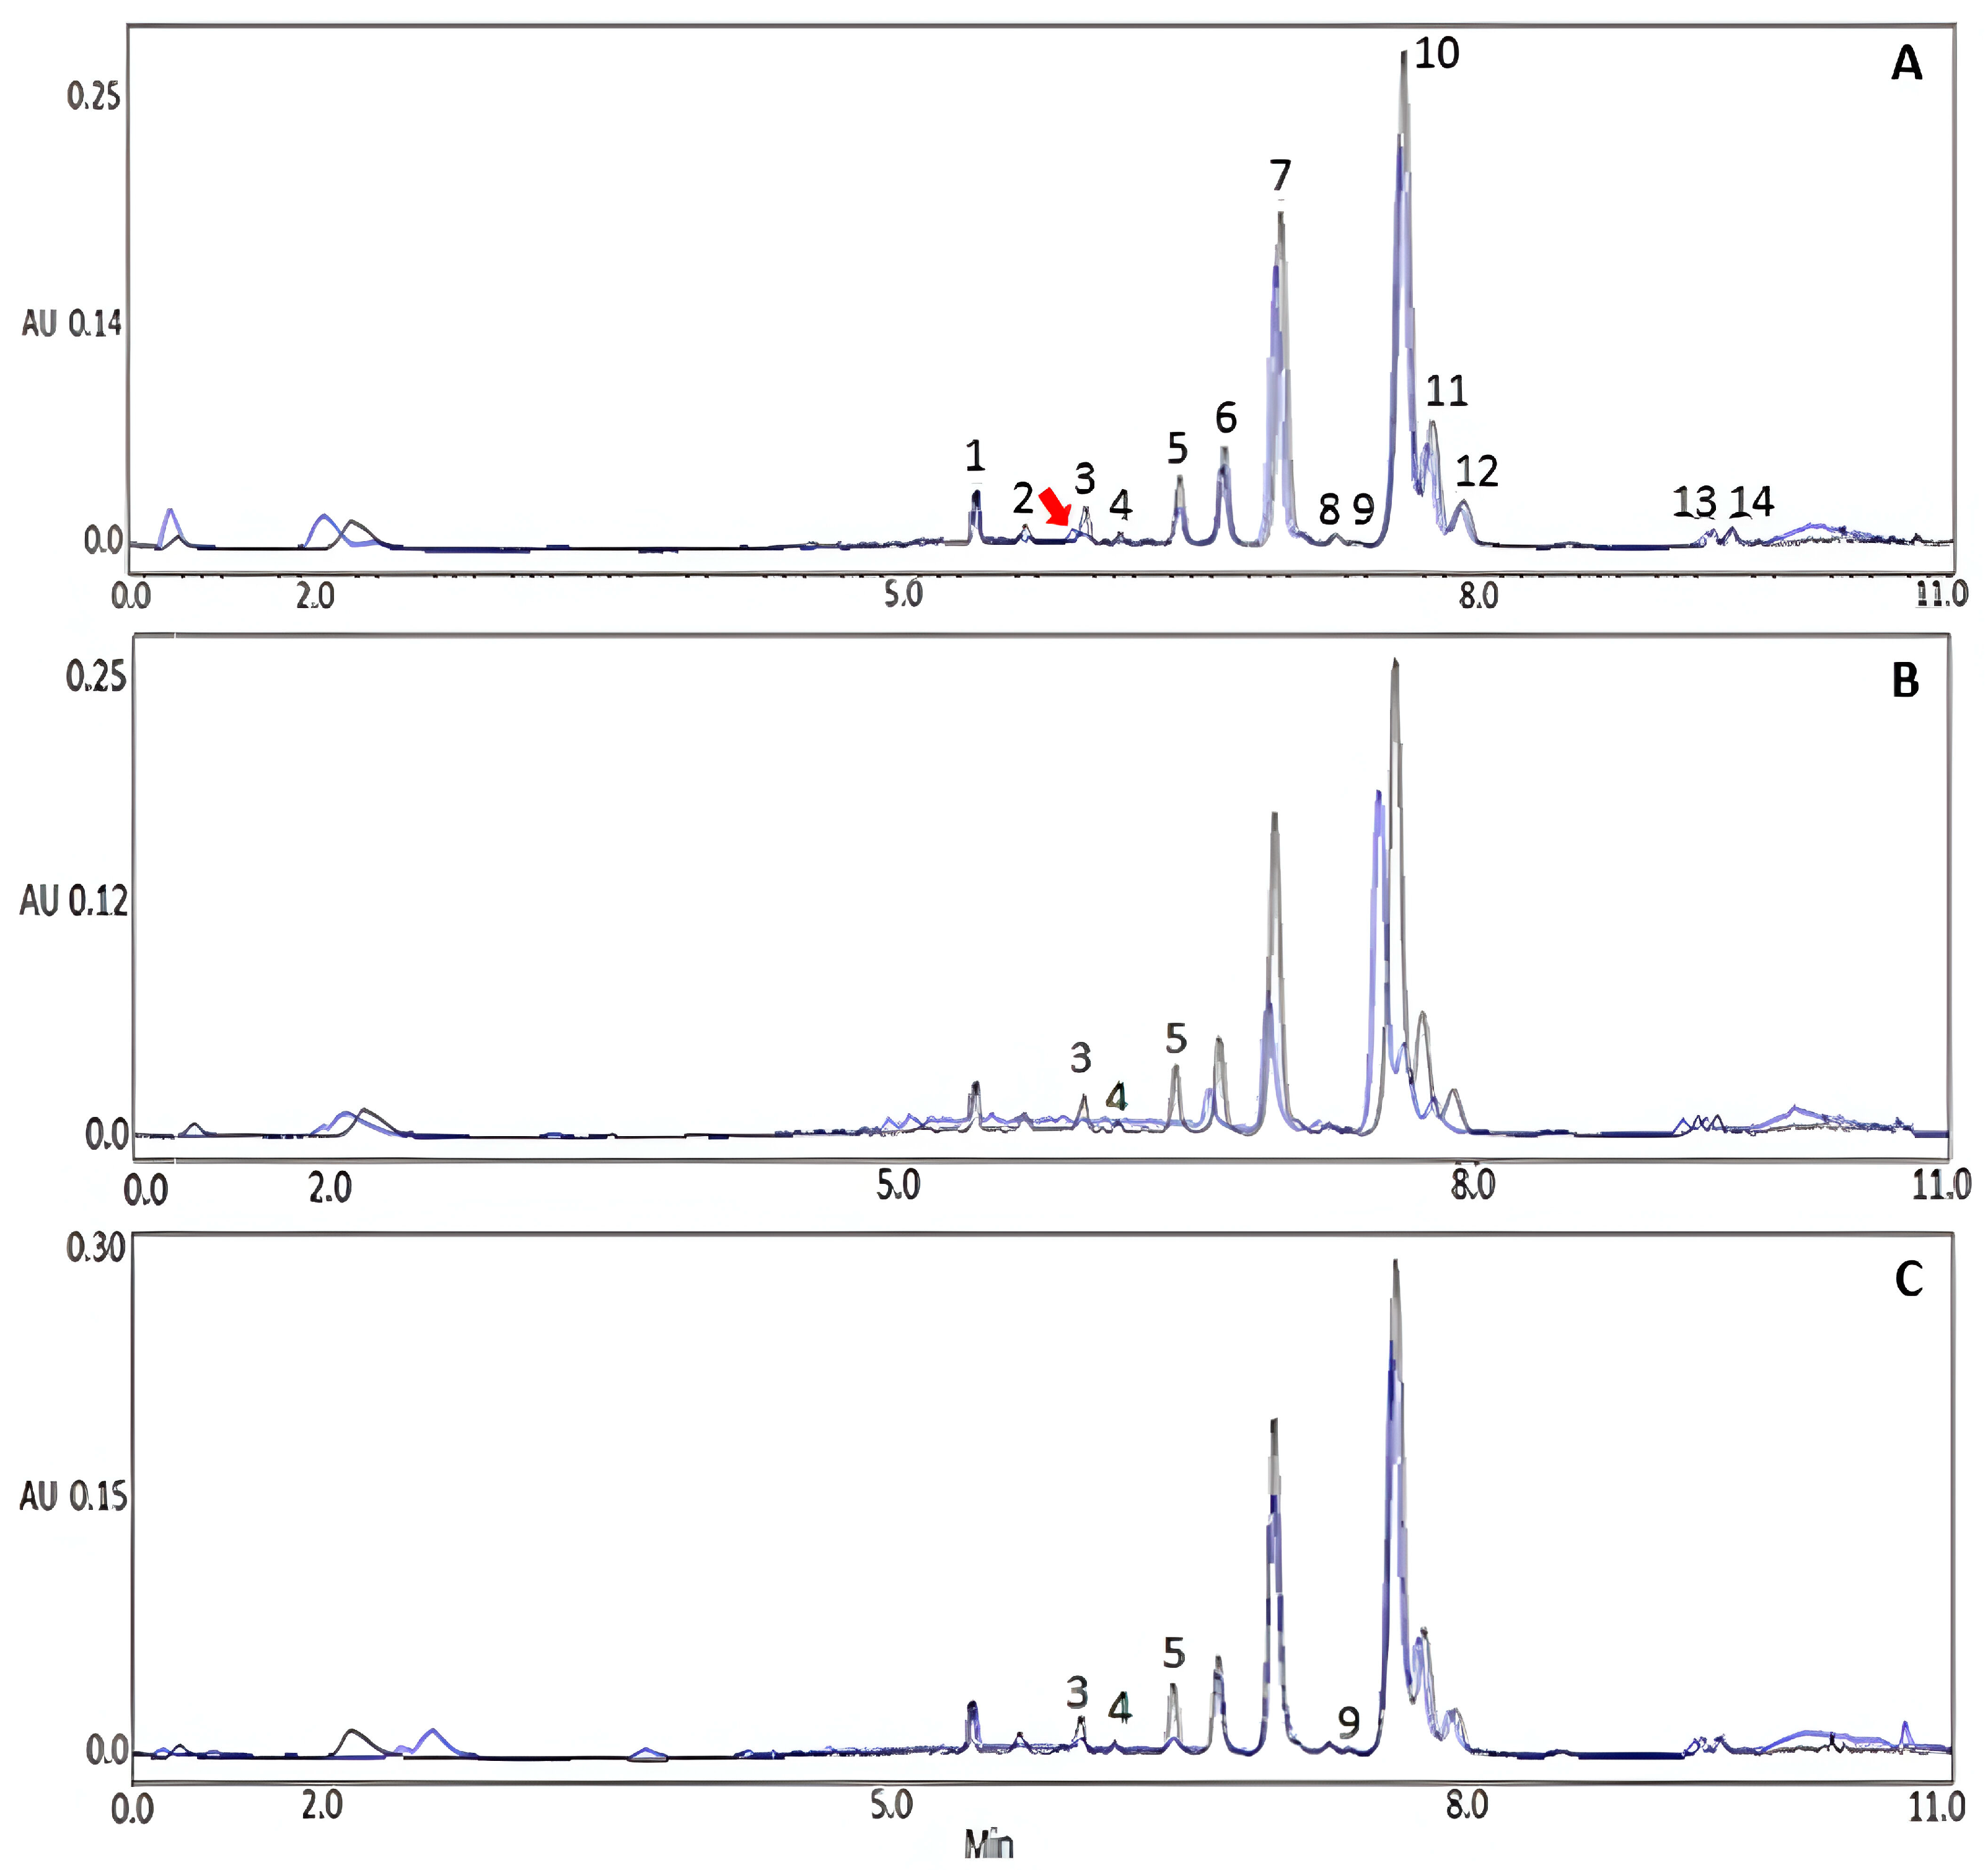
3.5. Extract Stability under Stress Conditions

3.5.1. Stability under Stress by Neutral Hydrolysis

In the analysis by hydrolysis, in the first condition of the decision tree (reflux for 12 h) the extract did not present a significant degradation of total flavonoids (<20%). Therefore, it was refluxed for 1 day. Under this condition, the extract had a degradation corresponding to 22.3 ± 0.3%, being classified as stable according to the decision tree proposed by Singh and Bakshi [40]. This degradation was observed as a decrease in the flavonoid contents, especially for myricetin-3-O-arabinopyranoside and isorhamnetin-3-O-glucoside (peaks 4 and 9, respectively), whose decrease becomes evident when comparing the chromatographic profile of the degraded extract to the profile of the extract without degradation (at the same concentration: 2.5 mg.mL−1) (Figure 4A).
As for the decrease in flavonoid content in general, it is suggested that this may have resulted from the complete degradation of the flavonoid nucleus present in the extract. This degradation process typically initiates with a cleavage in ring C, separating rings A and B, potentially generating phenolic derivatives such as 3,4-dihydroxy-benzaldehyde and hydroxybenzoic acid [60,61,62].

3.5.2. Stability under Stress by Basic Hydrolysis (NaOH)

When exposed to 0.01 N NaOH at 40 °C for 8 h, the extract experienced a total flavonoid degradation of 36.3 ± 2.2%, which classifies it as very labile [40].
Under these conditions, the complete disappearance of peaks 3, 4, and 5 (Figure 4B), identified as myricetin-3-O-galactopyranoside, myricetin-3-O-arabinopyranoside, and quercetin 3-O-glucopyranoside (isoquercitrin), respectively, was observed, which are found in less proportion in the extract.
A possible degradation by NaOH may be due to the rupture of the C-ring, through an attack of the hydroxyl groups coming from the NaOH, the carbonyl, and the alkoxy (R-O-R) of the C ring, separating the A and B rings, and generating trihydroxybenzoic acid and acetophenone, among other compounds mainly of the phenolic type [61,63].

3.5.3. Stability under Stress by Acid Hydrolysis (HCl)

In this test, degradation of total flavonoids of 24.4 ± 0.5% was obtained, a degradation that corresponds to the very labile classification, under conditions 0.01 N HCl at 40 °C/8 h. Upon comparison of the extract obtained under these conditions with the chromatographic profile of the non-degraded extract, it is evident that peaks 4 and 9 have undergone complete degradation, while peaks 3 and 5 have significantly decreased (Figure 4C), corresponding to flavonoids monoglycosylated with O-glycosidic bonds [64].
In this study, we observed a moderate degradation of total flavonoids at a lower acid concentration. Notably, the expected aglycones such as quercetin, myricetin, and kaempferol were not detected, nor were common compounds associated with acid degradation, such as the chalcones [63].

3.5.4. Extract Stability under Refrigeration Conditions

Regarding the stability of the extract under refrigeration (4 °C) for 22 days, the dry extract sample presented a degradation of total flavonoids of only 3.8 ± 1.8%, indicating a very low degradation. As in the previous stability tests, a decrease in the peaks was observed (Figure 5A), but an increase in the content of any flavonoid was not observed, suggesting that the degradation products were not other flavonoids derived from hydrolysis of sugars. Instead, it is likely that smaller and less complex molecular compounds were generated.
On the other hand, the sample of the extract that was in an aqueous medium under the same temperature and time conditions (4 °C/22 days) experienced an 11.2 ± 2.0% degradation of total flavonoids, which is nearly 10% higher degradation compared to the solid sample (Figure 5B). This result aligns with expectations, as the aqueous medium promotes degradation through hydrolysis and can also lead to contamination by microorganisms capable of causing enzymatic hydrolysis [65]. In none of the refrigeration tests was total degradation of flavonoids observed, and the degradation percentage was not significant enough for the samples (>20%); therefore, it can be established that the extract is stable under refrigeration conditions and normal storage, for short- and medium-term periods [41,66].

4. Conclusions

The physicochemical parameters determined for the plant material the amount of foreign matter, the loss due to drying, the particle size, and the total ashes, that are within the limits required by international guidelines related mainly to the quality and purity of the plant. A UPLC chromatographic method was developed, resulting in chromatographic profiles for the main phenolic compounds in the extract. This analysis revealed the presence of 13 flavonoids, which were tentatively identified through both UPLC-PDA and UHPLC-MS-QTOF analyses. Thus, the following flavonoids were identified: Quercetin 3-O-(6-pentosyl)-hexoside, kaempferol 3-O-α-L-arabinopyranosyl (1→2) α-L-rhamnopyranoside, myricetin 3-O-α-L-rhamnopyranoside, and isoscoparin-7-O-arabinoside, compounds reported for the first time in flowers for this species. On the other hand, this is the first report for this species of these compounds; the flavonoids kaempferol-3-O-glucose-glucose, kaempferol-3-O-hexosyl-O-pentoside, Myricetin-3-O-glucoside, myricetin-3-O-arabinopyranoside, Quercetin-O-arabinofuranoside, and isorhamnetin-3-O-glucoside were reported for the first time in this species. The developed UPLC-PDA chromatographic method was validated, determining the content of total flavonoids of 9.97 ± 0.17%. Similarly, when analyzing extracts collected in different months, it was possible to establish a range of flavonoid content in the extract varying from 8% to 13%. The separations conducted by CPC allowed us to isolate the two primary flavonoids from the extract with a high degree of purity in a single analysis. Finally, the results obtained in the stress stability tests allowed us to classify the extract as stable under most conditions except under acid hydrolysis.
Given its reported medicinal potential and knowing more thoroughly its chemical and physicochemical characteristics, for both the plant material and the extract with a known and constant content of flavonoids, the use and pharmacological research of the aqueous extract of K. pinnata is positively suggested.

Supplementary Materials

The following supporting information can be downloaded at https://www.mdpi.com/article/10.3390/scipharm91040050/s1: Tables S1–S3, Figures S1 and S2.

Author Contributions

Conceptualization, G.M.C.; methodology, W.L.V.R., J.E.R.C. and G.M.C.; formal analysis, W.L.V.R., J.E.R.C. and G.M.C.; investigation, W.L.V.R.; resources, G.M.C.; writing—original draft preparation, W.L.V.R.; writing—review and editing, J.E.R.C. and G.M.C.; supervision, J.E.R.C. and G.M.C.; project administration, G.M.C.; funding acquisition, G.M.C. All authors have read and agreed to the published version of the manuscript.

Funding

This research was funded by Pontificia Universidad Javeriana, Ministerio de Ciencia, Tecnología e Innovación, Ministerio de Educación Nacional, Ministerio de Industria, Comercio y Turismo and ICETEX, 2a Convocatoria Ecosistema Científico—Colombia Científica 792-2017, Programa “Generación de alternativas terapéuticas en cáncer a partir de plantas a través de procesos de investigación y desarrollo traslacional, articulados en sistemas de valor sostenibles ambiental y económicamente” (Contrato no. FP44842-221-2018).

Institutional Review Board Statement

Not applicable.

Informed Consent Statement

Not applicable.

Data Availability Statement

The data presented in this study are available in the main document and in the Supplementary Materials.

Acknowledgments

The authors would like to acknowledge Wilmar Rolando for collecting the plant material. We would also like to express our gratitude to the Ministerio de Ambiente y Desarrollo Sostenible for granting permission for the use of genetic resources and derived products (Contract number 212/2018; Resolution 210/2020).

Conflicts of Interest

The authors declare no conflict of interest.

References

  1. Polindara, Y.W.; Sanabria, O.L. Plantas y prácticas de conservación de la medicina tradicional en el suroriente de El Tambo, Cauca, Colombia. Bot. Sci. 2022, 100, 935–959. [Google Scholar] [CrossRef]
  2. Trujillo, W.; González, V. Plantas medicinales utilizadas por tres comunidades indígenas en el noroccidente de la Amazonia colombiana. Mundo Amaz. 2011, 2, 283–305. [Google Scholar]
  3. Nascimento, L.B.; de Aguiar, P.F.; Leal-Costa, M.V.; Coutinho, M.A.; Borsodi, M.P.G.; Rossi-Bergmann, B.; Costa, S. Optimization of Aqueous Extraction from Kalanchoe pinnata Leaves to Obtain the Highest Content of an Anti-inflammatory Flavonoid using a Response Surface Model. Phytochem. Anal. 2018, 29, 308–315. [Google Scholar] [CrossRef] [PubMed]
  4. Harlalka, G.V.; Patil, C.R.; Patil, M.R. Protective effect of Kalanchoe pinnata pers. (Crassulaceae) on Gentamycin-induced nephrotoxicity in rats. Indian J. Pharmacol. 2007, 39, 201–205. [Google Scholar] [CrossRef]
  5. Ghasi, S.; Egwuib, C.; Achukwu, P.U.; Onyeanusi, J.C. Assessment of the medical benefit in the folkloric use of Bryophyllum Pinnatum leaf among the Igbos of Nigeria for the treatment of hypertension. Afr. J. Pharm. Pharmacol. 2011, 5, 83–92. [Google Scholar] [CrossRef]
  6. Okwu, D.E.; Nnamdi, F.U. Two novel flavonoids from Bryophyllum pinnatum and their antimicrobial Activity. J. Chem. Pharm. Res. 2011, 3, 1–10. [Google Scholar]
  7. Muzitano, F.; Bergonzi, M.; De Melo, G.; Lage, C.; Bilia, A.; Vincieri, F.; Rossi-Bergmann, B.; Costa, S. Influence of cultivation conditions, season of collection and extraction method on the content of antileishmanial flavonoids from Kalanchoe pinnata. J. Ethnopharmacol. 2011, 133, 132–137. [Google Scholar] [CrossRef]
  8. Nayak, B.S.; Marshall, J.R.; Isitor, G. Wound healing potential of ethanolic extract of Kalanchoe pinnata Lam. Leaf-A preliminary study. Indian J. Exp. Biol. 2010, 48, 572–576. [Google Scholar]
  9. Majaz, Q.A.; Nazim, S.; Asir, Q.; Shoeb, Q.; Bilal, G.M. Screening of In vitro anthelmentic activity of Kalanchoe pinnata roots. Int. J. Res. Ayurveda Pharm. 2011, 2, 221–223. [Google Scholar]
  10. Nguelefack, T.B.; Nana, P.; Atsamo, A.D.; Dimo, T.; Watcho, P.; Dongmo, A.B.; Tapondjou, L.A.; Njamen, D.; Wansi, S.L.; Kamanyi, A. Analgesic and anticonvulsant effects of extracts from the leaves of Kalanchoe crenata (Andrews) Haworth (Crassulaceae). J. Ethnopharmacol. 2006, 106, 70–75. [Google Scholar] [CrossRef]
  11. Mahata, S.; Maru, S.; Shukla, S.; Pandey, A.; Mugesh, G.; Das, B.; Bhart, A.C. Anticancer property of Bryophyllum pinnata (Lam.) Oken. leaf on human cervical cancer cells. Complement. Altern. Med. 2012, 12, 15. [Google Scholar] [CrossRef] [PubMed]
  12. Majaz, Q.A.; Tatiya, A.U.; Khurshid, M.; Nazim, S.; Siraj, S. The miracle plant (Kalanchoe pinnata): A phytochemical and pharmacological review. Int. J. Res. Ayurveda Pharm. 2011, 2, 1478–1482. [Google Scholar]
  13. Supratman, U.; Fujita, T.; Akiyama, K.; Hayashi, H.; Murakami, A.; Sakai, H.; Koshimizu, K.; Ohigashi, H. Anti-tumor promoting activity of bufadienolides from Kalanchoe pinnata and K. daigremontiana × tubiflora. Biosci. Biotechnol. Biochem. 2001, 65, 947–949. [Google Scholar] [CrossRef]
  14. Coutinho, M.A.; Muzitano, M.F.; Cruz, E.A.; Bergonzi, M.C.; Kaiser, C.R.; Tinoco, L.W.; Bilia, A.; Vincieri, F.; Bergmann, R.; Costa, S.S. Flowers from Kalanchoe pinnata are a Rich Source of T Cell-Suppressive Flavonoids. Nat. Prod. Commun. 2012, 7, 175–178. [Google Scholar] [CrossRef] [PubMed]
  15. Nascimento, L.B.; Leal-Costa, M.B.; Menezes, E.; Rodrigues, V.; Muzitano, M.; Costa, S.; Schwartz, E. Ultraviolet-B radiation effects on phenolic profile and flavonoid content of Kalanchoe pinnata. J. Photochem. Photobiol. B 2015, 148, 73–81. [Google Scholar] [CrossRef]
  16. Bogucka-Kocka, A.; Zidorn, C.; Kasprzycka, M.; Szymczak, G.; Szewczyk, K. Phenolic acid content, antioxidant and cytotoxic activities of four Kalanchoe species. Saudi J. Biol. Sci. 2018, 25, 622–630. [Google Scholar] [CrossRef]
  17. Kumar, S.B.; Chowdhury, A.; Das, J.S.; Hosen, S.M.; Uddin, R.; Rahaman, S. Literature review on pharmacological potentials of Kalanchoe pinnata (Crassulaceae). Afr. J. Pharm. Pharmacol. 2011, 5, 1258–1262. [Google Scholar] [CrossRef]
  18. Pereira, K.M.; Grecco, S.S.; Figueiredo, C.R.; Hosomi, J.K.; Nakamura, M.U.; João Henrique, G.L. Chemical composition and cytotoxicity of Kalanchoe pinnata leaves extracts prepared using Accelerated System Extraction (ASE). Nat. Prod. Commun. 2018, 13, 163–166. [Google Scholar] [CrossRef]
  19. Anupam, K.; Garima, V.; Roopak, K. Need of standardization of herbal medicines in modern era. Int. J. Phytomedicine 2016, 8, 300–330. [Google Scholar]
  20. Bijauliya, R.K.; Alok, S.; Chanchal, D.K.; Kumar, M. A comprehensive review on standardization of herbal drugs. Int. J. Pharm. Sci. Res. 2017, 8, 3663–3677. [Google Scholar]
  21. Echeverry, S. Aporte a la Estandarización del Proceso de Obtención de un Extracto de Hojas de Passiflora quadrangularis. Master’s Thesis, Universidad Nacional de Colombia, Bogotá, Colombia, 2017. [Google Scholar]
  22. European Medicines Agency (EMEA). Guideline on Specifications: Test Procedures and Acceptance Criteria for Herbal Substances, Herbal Preparations, and Herbal Medicinal Products/Traditional Herbal Medicinal Products, EMEA/CVMP/815/00 Rev 1; European Medicines Agency: London, UK, 2006. [Google Scholar]
  23. Kunle, O.F.; Egharevba, M.O.; Ahmadu, P.O. Standardization of herbal medicines—A review. Int. J. Biodivers. Conserv. 2012, 4, 101–112. [Google Scholar] [CrossRef]
  24. Ochoa, A.; Marin, J.; Rivero, D.; Aguilera, E. Caracterización física, físico-química y química de extractos totales de hojas frescas de Petiveria alliacea L. con acción antimicrobiana. Rev. Mex. Cienc. Farm. 2013, 44, 52–59. [Google Scholar]
  25. Sharapin, N. Fundamentos de Tecnología de Productos Fitoterapéuticos; Pinzón, R., Ed.; CYTED: Santa fe de Bogotá, Colombia, 2000. [Google Scholar]
  26. World Health Organization (WHO). General Guidelines for Methodologies on Research and Evaluation of Traditional Medicine; WHO: Geneva, Switzerland, 2000. [Google Scholar]
  27. Wichtl, M. Herbal Drugs Phytopharmaceuticals: A Handbook for Practice on a Scientific Basis; Medpharm, Scientific Publisher Stuttgart: Stuttgart, Germany, 2004. [Google Scholar]
  28. European Pharmacopoeia Council of Europe. European Pharmacopoeia, 8th ed.; European Pharmacopoeia Council of Europe: Strasbourg, France, 2013. [Google Scholar]
  29. Agencia Nacional de Vigilancia Sanitaria y Fundación Oswaldo Cruz/Editora. Farmacopea Brasileña, 5th ed.; Agencia Nacional de Vigilancia Sanitaria y Fundación Oswaldo Cruz/Editora: Brasilia, Brazil, 2010. [Google Scholar]
  30. United States Pharmacopeia (USP 30), NF, 25th ed.; The United States Pharmacopeial Convention Inc.: Rockville, MD, USA, 2007.
  31. World Health Organization (WHO). Quality Control Methods for Medicinal Plant Materials; WHO: Geneva, Switzerland, 1998. [Google Scholar]
  32. World Health Organization (WHO). Quality Control Methods for Herbal Materials; WHO: Geneva, Switzerland, 2011. [Google Scholar]
  33. Araújo, E.R.D.; Félix-Silva, J.; Xavier-Santos, J.B.; Fernandes, J.M.; Guerra, G.C.B.; de Araújo, A.A.; Zucolotto, S.M. Local anti-inflammatory activity: Topical formulation containing Kalanchoe brasiliensis and Kalanchoe pinnata leaf aqueous extract. Biomed. Pharmacother. 2019, 113, 108721. [Google Scholar] [CrossRef] [PubMed]
  34. Palaniselvam, K.; Kyung, D.; Chae, E.S.; Soundharrajan, I.; Srisesharam, S.; Mariadhas, V.A.; Ki Choon, C. Quantification of major phenolic and flavonoid markers in forage crop Lolium multiflorum using HPLC-DAD. Rev. Bras. Farmacogn. 2018, 28, 282–288. [Google Scholar]
  35. Morais, J.; Ortiz, S.; Padilha, R.; Mandova, T.; Rodrigues, E.; Wilbur, A.; Michel, S.; Grougnet, R.; Zucolotto, S. Bryophyllum pinnatum markers: CPC isolation, simultaneous quantification by a validated UPLC-DAD method and biological evaluations. J. Pharm. Biomed. Anal. 2021, 193, 113682. [Google Scholar]
  36. Castro, E. Evaluación de Indicadores para la Diferenciación de Mieles Provenientes de la Zona Cafetera de la Sierra Nevada de Santa Marta. Master’s Thesis, Universidad Nacional de Colombia, Bogotá, Colombia, 2015. [Google Scholar]
  37. Marino, O.; González, L.; Cortes, Y.; Camargo, J. Caracterización fitoquímica, determinación del contenido de lignina y la actividad antioxidante de los culmos de Guadua angustifolia Kunth. Rev. Fac. Cienc. Básicas 2015, 11, 124–135. [Google Scholar]
  38. International Conference on Harmonisation of Technical Requirements for Registration of Pharmaceuticals for Human Use (ICH). Validation of Analytical Procedures: Text and Methodology Q2(R1); International Conference on Harmonization: London, UK, 2005. [Google Scholar]
  39. Zeraik, M.L.; Yariwake, J.H. Quantification of isoorientin and total flavonoids in Passiflora edulis fruit pulpby HPLC-UV/DAD. Microchem. J. 2010, 96, 86–91. [Google Scholar] [CrossRef]
  40. Singh, S.; Bakshi, M. Guidance on Conduct of Stress Tests to Determine Inherent Stability of Drugs. Pharm. Technolology 2000, 4, 1–14. [Google Scholar]
  41. Food and Drug Administration (FDA). Guidance for Industry Drug Stability Guidelines; Center for Veterinary Medicine (CVM): Rockville, MD, USA, 2008. [Google Scholar]
  42. Comas, R. Contribución a la Estandarización del Proceso de Obtención a Escala de Laboratorio de un Extracto de las Hojas de Psidium guajava L. Master’s Thesis, Universidad Nacional de Colombia, Bogotá, Colombia, 2014. [Google Scholar]
  43. Curtis, H.; Barnes, S.; Schnek, A.; Massarini, A. Biología, 7th ed.; Editorial Medica Panamericana: Madrid, España, 2008. [Google Scholar]
  44. Álvarez, N.; Bagué, A. Tecnología Farmacéutica; Editorial Club Universitario: Alicante, España, 2012. [Google Scholar]
  45. Bayona, A.; Peña, D. Evaluación Farmacognóstica y Antioxidante “In Vitro” del Extracto Etanólico de la Hoja del Aire (Kalanchoe pinnata). Master’s Thesis, Universidad de Guayaquil, Guayaquil, Ecuador, 2017. [Google Scholar]
  46. Camacho, O. Contribución a la Estandarización del Proceso de Obtención de un Extracto de Hojas de Petiveria alliacea l. (anamú) a Escala de Laboratorio. Master’s Thesis, Universidad Nacional de Colombia, Bogotá, Colombia, 2014. [Google Scholar]
  47. Dewick, P.M. Medicinal Natural Products: A Biosynthetic Approach, 3rd ed.; John Wiley & Sons, Ltd.: Chichester, UK, 2009. [Google Scholar]
  48. Li, Z.H.; Guo, H.; Xu, W.B.; Ge, J.; Li, X.; Alimu, M.; He, D.J. Rapid Identification of Flavonoid Constituents Directly from PTP1B Inhibitive Extract of Raspberry (Rubus idaeus L.) Leaves by HPLC-ESI QTOF-MS-MS. J. Chromatogr. Sci. 2016, 54, 805–810. [Google Scholar] [CrossRef]
  49. García, P.; Ayuso, M.; Lozano, E.; Pereira, C.; Dias, M.; Ivanov, M.; Calhelha, R.; Soković, M.; Ferreira, I.; Barros, L.; et al. Phenolic profiling and in vitro bioactivities of three medicinal Bryophyllum plants. Ind. Crop. Prod. 2021, 162, 113241. [Google Scholar] [CrossRef]
  50. Saldanha, L.; Vilegas, W.; Dokkedal, A. Characterization of flavonoids and phenolic acids in Myrcia bella Cambess. using FIA-ESI-IT-MS(n) and HPLC-PAD-ESI-IT-MS combined with NMR. Molecules 2013, 18, 8402–8416. [Google Scholar] [CrossRef] [PubMed]
  51. Roriz, C.L.; Barros, L.; Carvalho, A.M.; Santos-Buelga, C.; Ferreira, I.C.F.R. Pterospartum tridentatum, Gomphrena globosa and Cymbopogon citratus: A phytochemical study focused on antioxidant compounds. Food Res. Int. 2014, 62, 684–693. [Google Scholar] [CrossRef]
  52. Chen, G.; Li, X.; Saleri, F.; Guo, M. Analysis of Flavonoids in Rhamnus davurica and Its Antiproliferative Activities. Molecules 2016, 21, 1275. [Google Scholar] [CrossRef] [PubMed]
  53. Vijayalakshmi, A.; Madhira, G. Anti-psoriatic activity of flavonoids from Cassia tora leaves using the rat ultraviolet B ray photodermatitis model. Rev. Bras. Farmacogn. 2014, 24, 322–329. [Google Scholar] [CrossRef]
  54. Brito, A.; Ramirez, J.E.; Areche, C.; Sepúlveda, B.; Simirgiotis, M.J. HPLC-UV-MS profiles of phenolic compounds and antioxidant activity of fruits from three citrus species consumed in Northern Chile. Molecules 2014, 19, 17400–17421. [Google Scholar] [CrossRef]
  55. Ibrahim, L.; Elkhateeb, A.; Marzouk, M.; Hussein, S.; Abdel-Hameed, E.L.; Kassem, M. Flavonoid investigation, LC–ESI-MS profile and cytotoxic activity of Raphanus raphanistrum L. (Brassicaceae). J. Chem. Pharm. Res. 2016, 8, 786–793. [Google Scholar]
  56. El Sayed, A.M.; Ezzat, S.M.; El Naggar, M.M.; El Hawary, S.S. In vivo diabetic wound healing effect and HPLC–DAD–ESI–MS/MS profiling of the methanol extracts of eight Aloe species. Rev. Bras. Farmacogn. 2016, 26, 352–362. [Google Scholar] [CrossRef]
  57. Costa, S.; Muzitano, M.; Camargo, L.; Coutinho, M.A. Therapeutic Potential of Kalanchoe Species: Flavonoids and other Secondary Metabolites. Nat. Prod. Commun. 2008, 3, 2151–2164. [Google Scholar] [CrossRef]
  58. Horwitz, W.; Albert, R.J. The Horwitz ratio (HorRat): A Useful Index of Method Performance with Respect to Precision. J. Assoc. Off. Anal. Chem. 2006, 89, 1095–1109. [Google Scholar] [CrossRef]
  59. Rodríguez, J.; Amaya, C.; Caballero, P.; Alanís, M.; Aguilera, C.; Báez, J.; Moreno, S.; Núñez, A. Optimización de un método para determinación de fitoesteroles y escualeno en ácidos grasos destilados usando la metodología de superficie de respuesta y su validación. Rev. Mex. Cienc. Farm. 2014, 45, 1–10. [Google Scholar]
  60. Paredes, F.; Clemente, A. Polifenoles de aplicación en farmacia. Ámbito Farm. Fitoter. 2005, 24, 85–94. [Google Scholar]
  61. Justesen, U.; Arrigoni, E.; Larsen, B.; Amado, R. Degradation of Flavonoid Glycosides and Aglycones During in vitro Fermentation with Human Faecal Flora. LWT Food Sci. Technol. 2000, 33, 424–430. [Google Scholar] [CrossRef]
  62. Vetrova, E.; Maksimenko, E.; Khizrieva, S.; Bugaeva, A.; Borisenko, N.; Minkin, V. A simple way for the preparation of natural antioxidant quercetin from rutin by subcritical water. J. Nat. Sci. Biol. Med. 2017, 8, 213–215. [Google Scholar] [PubMed]
  63. Fransina, E.; Tanasale, M.; Latupeirissa, J.; Malle, D.; Tahapary, R. Phytochemical screening of water extract of gayam (Inocarpus edulis) Bark and its amylase inhibitor activity assay. Mater. Sci. Eng. 2019, 509, 012074. [Google Scholar] [CrossRef]
  64. Dou, M.; He, X.; Sun, Y.; Peng, F.; Liu, J.; Hao, L.; Yang, S. Controlled acid hydrolysis and kinetics of flavone C-glycosides from trollflowers. Chin. Chem. Lett. 2015, 26, 255–258. [Google Scholar] [CrossRef]
  65. Mandalari, G.; Bennett, R.N.; Kirby, A.R.; Lo Curto, R.B.; Bisignano, G.; Waldron, K.W.; Faulds, C.B. Enzymatic hydrolysis of flavonoids and pectic oligosaccharides from bergamot (Citrus bergamia Risso) peel. J. Agric. Food. Chem. 2006, 54, 8307–8313. [Google Scholar] [CrossRef]
  66. Food and Drug Administration (FDA). Title 21 Chapter I—FDA Department of health and Human Services Subchapter C—DRUGS: GENERAL PART 205. Guidelines for state licensing of wholesale prescription drug distributors. In CFR—Code of Federal Regulations; FDA: Washington, DC, USA, 2020. [Google Scholar]
Figure 1. UPLC chromatogram of the crude extract at 254 nm and PDA spectra for major peaks. 6. Quercetin 3-O-glucoside. 7. Quercetin 3-O-glucuronide. 10. Quercetin 3-O-α-L-arabinopyranosyl (1→2) α-L-rhamnopyranoside. 11. Quercetin 3-O-rhamnoside.
Scipharm 91 00050 g001
Figure 2. UPLC-PDA chromatogram at 254 nm. (A) Chromatogram of fraction 13 obtained by CPC; (B) chromatogram of fraction 16 obtained by CPC.
Scipharm 91 00050 g002
Figure 3. UPLC-PDA chromatogram of the standard rutin 50 μg mL−1 at 254 nm for robustness assay. (A) Increase in the pH of the mobile phase; formic acid 0.5%. (B) Decrease in column temperature: 25 °C. (C) Decreased flow rate: 0.3 mL min−1.
Scipharm 91 00050 g003
Figure 4. UPLC-PDA chromatograms for crude extract at 254 nm for stability under stress assay. (A) Degraded extract under neutral hydrolysis by reflux for 24 h (Blue); crude total extract chromatogram (Black). (B) Degraded extract under basic hydrolysis 0.01 N NaOH at 40 °C/8 h (Blue); crude total extract chromatogram (Black). (C) Degraded extract under acid hydrolysis at 40 °C/8 h (Blue); crude total extract chromatogram (Black).
Scipharm 91 00050 g004
Figure 5. UPLC-PDA chromatograms for crude extract at 254 nm for stability under refrigeration assay. (A) Degraded dry extract under refrigeration at 4 °C/22 days (Blue); Crude total extract chromatogram (Black). (B) Degraded aqueous solution extract under refrigeration at 4 °C/22 days (Blue); Crude total extract chromatogram (Black).
Scipharm 91 00050 g005
Table 1. Characterization of physicochemical parameters of plant material.
ParameterPercentage (%)
Foreign matter0.3
Humidity (loss on drying)10.0 ± 0.1
Particle size distribution70.0
Total ashes11.8 ± 0.6
Table 2. Flavonoids assigned by UHPLC-MS-QTOF.
PeakRetention Time (min)Theoretical Mass [MߝH]Calculated Mass [MߝH]Error (Δ ppm)CompoundReference
15.3609.5085609.5096−1.74Kaempferol-3-O-glucose-glucose[48]
35.9479.0831479.072422.33Myricetin-3-O-hexoside [49]
46.1449.0720449.2013−287.93Unknow flavonol[50]
5a6.5463.0882463.08702.59Quercetin 3-O-galactoside (Hyperoside)[48]
5b6.5595.1299595.12901.51Quercetin 3-O-(6-pentosyl)-hexoside[51]
66.7463.0882463.08712.38Quercetin 3-O-glucoside (Isoquercitrin)[52]
76.9477.0674477.06642.10Quercetin 3-O-glucuronide[48,53]
87.1433.0776433.07593.93Quercetin-O-arabinofuranoside [50]
97.3477.0942477.067256.59Isoramnetin-3-O-hexoside[54]
107.7579.1355579.13471.38Quercetin 3-O-α-L-arabinopyranosyl (1→2) α-L-rhamnopyranoside[7,18,55]
117.9447.0932447.09212.46Quercetin 3-O-rhamnoside[7,18]
128.1579.1355579.13432.07Kaempferol-3-O-pentosyl-hexoside[51,56]
139.1563.1406563.14020.76Kaempferol 3-O-α-L-arabinopyranosyl-(1→2) α-L-rhamnopyranoside[18]
149.3593.1511593.15001.85Isoscoparin-7-O-arabinoside[18]
Table 3. UPLC-PDA validation analytical parameters.
Calibration CurveCalibration Equation aCorrelation Factor (r2)Linear Range (µg mL−1)
1y = 12243x − 174310.99970.1953–400.0
2y = 12232x − 157140.99970.1953–400.0
3y = 12225x − 166400.99970.1953–400.0
Repeatability bIntermediate precision b
Rutin concentration (μg mL−1)RSD (%)RSD (%)
250.00.1150.016
50.00.1810.025
1.5621.1980.062
LOQ c (μg mL−1)LOD c (μg mL−1)
Experimental value0.09760.0488
Theoric value0.00260.0009
a Ten data points (n = 3); b limits: R.S.D. < 5%; c LOD = limit of detection; LOQ = limit of quantification.
Table 4. Robustness and variability parameters a.
RSD (%)Retention Time (min)
Temperature (25 °C)
0.8016.6
Flow rate (0.3 mL min−1)
0.4676.8
Formic acid 0.5%
0.8696.3
a Rutin concentration: 50 μg mL−1.
Table 5. Total flavonoids determined in 3 different collections.
CollectionContent % amg EQ-Rutin/mg Extract
November 201912.48 ± 0.500.124 ± 0.005
December 20209.97 ± 0.170.099 ± 0.001
January 20218.51 ± 0.350.085 ± 0.008
a Content in percentage for 1 mg of lyophilized extract.
Disclaimer/Publisher’s Note: The statements, opinions and data contained in all publications are solely those of the individual author(s) and contributor(s) and not of MDPI and/or the editor(s). MDPI and/or the editor(s) disclaim responsibility for any injury to people or property resulting from any ideas, methods, instructions or products referred to in the content.

